Article

Heart Rate Variability and Performance of Commercial Airline Pilots during Flight Simulations

by
Xiaodong Cao
1,
Piers MacNaughton
1,
Leslie R. Cadet
1,
Jose Guillermo Cedeno-Laurent
1,
Skye Flanigan
1,
Jose Vallarino
1,
Deborah Donnelly-McLay
1,
David C. Christiani
1,2,
John D. Spengler
1 and
Joseph G. Allen
1,*
1
Department of Environmental Health, Harvard T.H. Chan School of Public Health, Boston, MA 02215, USA
2
Department of Medicine, Massachusetts General Hospital/Harvard Medical School, Boston, MA 02114, USA
*
Author to whom correspondence should be addressed.
Int. J. Environ. Res. Public Health 2019, 16(2), 237; https://doi.org/10.3390/ijerph16020237
Submission received: 3 December 2018 / Revised: 8 January 2019 / Accepted: 11 January 2019 / Published: 16 January 2019

Abstract

:
Pilots undergo a variety of stressors that may affect their performance during all phases of flight. Heart rate variability (HRV) has been considered as a reliable indicator of the parasympathetic and sympathetic activities of human autonomic nervous system, which can be used to characterize the sympathetic stress response of pilots during flight. In this study, thirty active commercial airline pilots were recruited to fly three flight segments in a Federal Aviation Administration (FAA)-certified A320 flight simulator with each segment at a different carbon dioxide (CO2) concentration on the flight deck. The pilots performed a series of maneuvers of varying difficulty, and their performance was evaluated by FAA designated pilot examiners. The HRV metrics (SDNN, RMSSD and LF/HF ratio) of each pilot both before and during flight simulations were measured with a Movisens EcgMove3 sensor. The average SDNN, RMSSD and LF/HF ratio of the pilots during flight simulations were 34.1 ± 12.7 ms, 23.8 ± 10.2 ms and 5.7 ± 2.8 respectively. Decreased HRV was associated with aging, obesity and performing difficult maneuvers. Both CO2 exposure and HRV had an independent effect on the pilot performance, while their interaction was not significant. The generalized additive mixed effect model results showed that a pilot performed better on a maneuver when his stress response was lower, as indicated by higher SDNN and RMSSD and lower LF/HF ratio. An interquartile range (IQR) increase in SDNN (21.97 ms) and RMSSD (16.00 ms) and an IQR decrease in LF/HF ratio (4.69) was associated with an increase in the odds of passing a maneuver by 37%, 22% and 20%, respectively.

1. Introduction

The International Air Transport Association (IATA) expects 7.2 billion passengers to travel by air in 2035, a near doubling of the 3.8 billion passengers that travelled in 2016 [1]. Within the U.S. Federal Aviation Administration’s (FAA) Air Traffic Control Organization alone, over 2.5 million airline passengers travel on 43,000 airline flights every day [2]. Billions of passengers travel by air every year; however, compared to other forms of transportation, flying is the safest, with only 138 onboard and one external fatality worldwide in 2016 [3].
As of 2017, there were an estimated total of 609,306 pilots within the FAA’s jurisdiction, including 159,825 airline transport pilots [4]. Before an individual can become a pilot, they must obtain a medical certificate, which indicates that they are healthy enough to operate an airplane. Medication usage, medical history, use of corrective lenses, surgeries, and recent visits to health care professionals are all items that must be disclosed to the Aviation Medical Examiner (AME) by the applicant. Though having strict requirements of qualification, the actual performance and mental health of airplane pilots on the flight deck still warrants further intervention. An anonymous survey-based study showed that some pilots may suffer from depressive symptoms that they do not disclose to the AME or their primary care manager due to the fear of negative career impacts [5]. Pilots’ attempts to protect their careers through non-disclosure of their symptoms prevents them from receiving proper treatment. Airline pilots also reported heightened self-rated fatigue and irregular sleep during international flights [6,7].
Pilots undergo a variety of physical, psychological, and physiological stressors that affects their performance during the flight. Examples include flight deck humidity, family illnesses or death, or fatigue and physical deconditioning. To ensure flight safety, it is necessary to have a deeper insight into the stress levels of pilots during flight, and how stress impacts their performance. The occupational stress and workload can be estimated through physiological indicators such as cortisol levels in saliva, respiration rate and heart rate variability (HRV) [8,9,10]. A recent study [11] indicated that the stress of pilots was elevated as indicated by lower HRV, when switching from analog to digital visual presentations of the flight and navigation data.
The stress response system is comprised of the autonomic nervous system (ANS) and the hypothalamic-pituitary-adrenal (HPA) axis [12]. Activation of the sympathetic nervous system (SNS) with inhibition of the parasympathetic nervous system (PNS) triggers the acute response to both physical and psychological stress, also known as the fight-or-flight response [13]. During the stress response, the HPA axis is initiated by the release of the corticotrophin-releasing hormone from the hypothalamus, which results in a series of endocrine changes that culminates with the release of cortisol from the adrenal cortex [14]. The PNS plays an integral role in alleviating the stress response of individuals by inhibiting the SNS and HPA axis [12,15]. The PNS also regulates the “rest and digest” functions that calm the body down and dampen the stress response [15,16]. HRV is a measure of the variability in the length of time between heart beats, which serves as a proxy for the dynamic interplay between the parasympathetic and sympathetic branches of the ANS [17]. Current neurobiological evidence suggests that HRV indices can be used as an objective physiological indicator of stress [18]. HRV can be measured in both a time-domain and a frequency-domain [19,20]. Time-domain HRV indices represent the variability in the time intervals between successive heartbeats. SDNN (standard deviation of the normal to normal interval) and RMSSD (root mean square of successive differences between normal heartbeats) are the two most commonly-used HRV time-domain indices. SDNN reflects the total heart rate variability correlated with ANS activities, while RMSSD is more of a marker of parasympathetic regulation of heart. Both higher SDNN and RMSSD have been associated with physiological resilience against stress [18,21]; low variability could be attributed to pathologies such as hypertension, diabetes, and depression, all of which are associated with stress and decreased cognitive function [22,23].
Frequency-domain measurements describe the power distribution of HRV as a function of frequency. The low frequency (LF) component (0.04 to 0.15 Hz) of HRV is produced by both SNS and PNS activities. An increased LF power may reflect increased sympathetic activity during mental stress and exercise [20]. The high frequency (HF) component (0.15 to 0.4 Hz) of HRV is primarily produced by PNS activity and highly correlated with the RMSSD time-domain measures [24]. Lower HF power is correlated with higher stress, panic, anxiety or worry [19]; therefore, the ratio of LF power to HF power (LF/HF ratio) can be used to estimate the balance between SNS and PNS activity [23]. A low LF/HF ratio reflects the dominance of PNS activity, when people conserve energy and engage in tend-and-befriend behaviors. Conversely, a high LF/HF ratio indicates sympathetic dominance, which occurs when people engage in fight-or-flight behaviors or parasympathetic withdrawal.
The performance of pilots may also be affected by environmental conditions on the flight deck such as temperature, aircraft vibration, noise, air quality and ventilation. The flight deck has been under studied, however; nearly all of the research to date on these environmental factors in airplanes, has focused on conditions in the airplane cabin [25,26,27,28,29]. Specific to air quality, a focus of our current study, one study of 179 U.S. domestic flights, Cao et al. [30] found an average CO2 concentration of 1353 ± 290 ppm (mean ± SD) during all flight phases, but as high as nearly 3000 ppm during boarding, a time when the flight deck door is usually open. The equivalent outside air ventilation rates could only meet the minimum value of 4.7 L/s/p as required by Federal Aviation Regulations [31] 42% of time during boarding and 73% of time during flying. Data for conditions on the flight deck are more limited. The European Aviation Safety Agency (EASA) measured the CO2 concentrations in the cockpits of eight B787 airplanes and 61 other types of airplanes [32]. The mean CO2 concentration on the B787 flight deck was 603 ppm with a range of 473 to 1229 ppm. On the flight deck of other airplanes, the mean CO2 concentrations were 835 ppm (629–1918 ppm) and 753 ppm (594–1976 ppm) for short-haul and long-haul flights, respectively.
Exposure to CO2 at these levels has been shown to be associated with detrimental effects on cognitive function and increasing prevalence of health symptoms in other indoor settings [33,34,35,36]. Further, our recent study that focused on CO2 and airplane pilots [37] demonstrated that CO2 concentrations impact airline pilot performance at levels occasionally observed on the flight deck. Compared to segments at a CO2 concentration of 2500 ppm, the odds of passing a maneuver in flight simulations were 1.52 (95% CI: 1.02–2.25) times higher when pilots were exposed to 1500 ppm and 1.69 (95% CI: 1.11–2.55) times higher when exposed to 700 ppm [37]. Based on prior studies showing the potential for elevated CO2 in the airplane and an impact of CO2 on pilot performance, the aims of our present study were to: further investigate the stress response of pilots when conducting flight maneuvers of varying difficulty at different CO2 concentrations during the flight simulations; and to evaluate how sympathetic stress response, as indicated by HRV metrics impact, the performance of pilots. Using a crossover repeated measures study design, we recruited thirty active commercial airline pilots and had them complete a series of three simulated flights in an FAA-certified A320 flight simulator at three CO2 conditions: 700 ppm, 1500 ppm, and 2500 ppm. Pilots had HRV monitored for the duration of the flight, and the flight performance of pilots was rated by FAA designated pilot examiners. We sought to examine the effects of different influencing factors on pilots’ HRV, and in turn the effect of HRV on the flight performance.

2. Materials and Methods

2.1. Participants

Thirty active commercial airline pilots participated in this panel study in March-May, 2017. All participants were currently qualified to fly the Airbus A320 aircraft. Their demographic and flight experience information are presented in Table 1.
All recruited pilots were male, which fits the current demographic of airline pilots globally (94% male) [38]. Pilots were paired to create fifteen teams, and each flight team completed three simulated flight tests in an FAA-certified A320 flight simulator. During the approximately three-hour long simulation, each pilot was the pilot flying for half of the simulation, and the pilot monitoring for the other half. The pilot who flew first for the first simulation flew first for the remaining two sessions, and pilots sat in the left or right seat based on where they typically sat during actual flight. The Institutional Review Board (IRB) of the Harvard T.H. Chan School of Public Health reviewed and approved the study protocol. Informed consent was obtained from all participants.

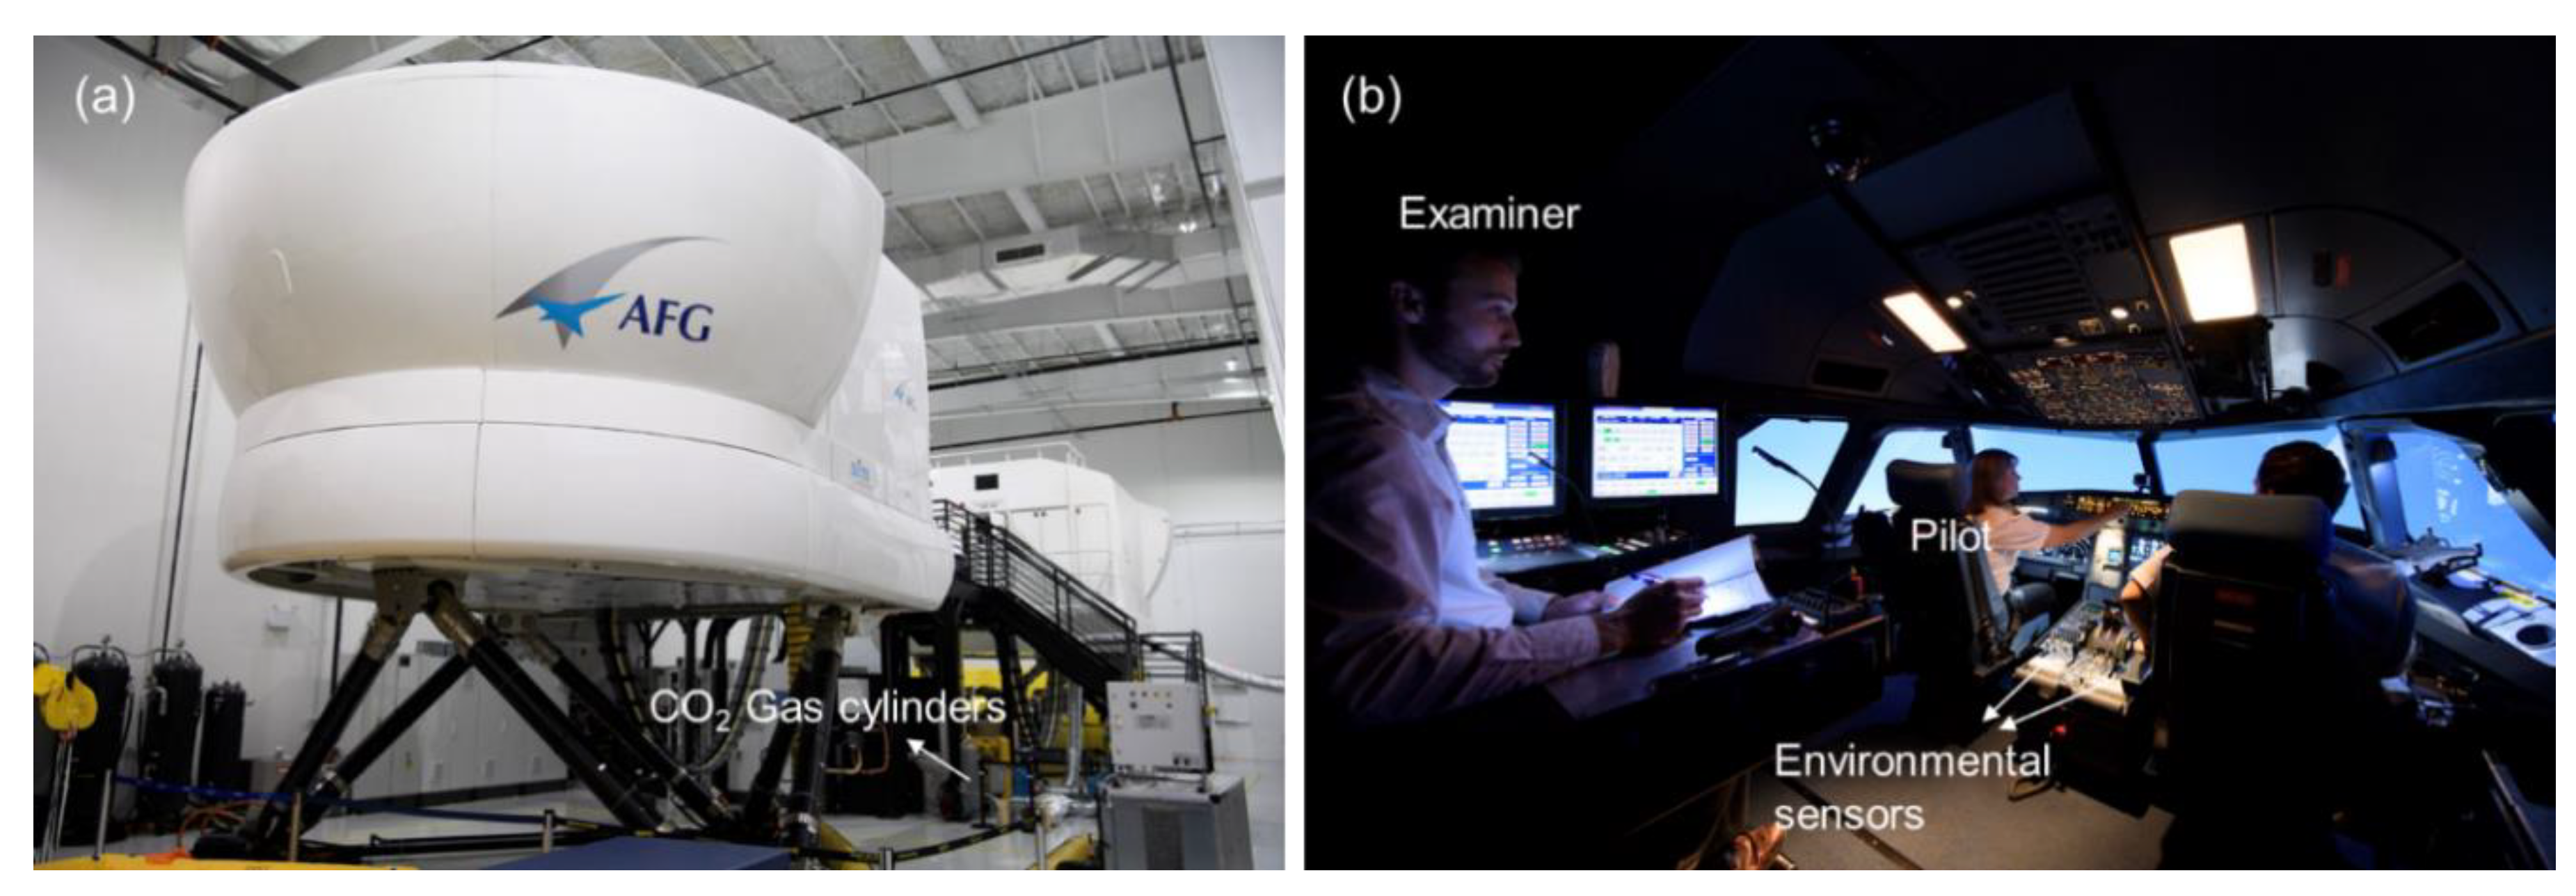
2.2. Experimentation

An FAA-approved A320 flight simulator (AFG, Inc., Fort Lauderdale, FL, USA) for pilot training and certification was used in the study (Figure 1). A series of flight maneuvers of varying difficulty (A, B and C), grouped into three sequences, were programmed into the flight simulator. The descriptions for each flight maneuver are summarized in the Table S1 (see supplemental material). The detailed FAA definition of each of the maneuver and rating criteria can be found in [39,40]. There were also transitional periods between adjacent maneuvers, which were we defined collectively as ‘Gap’ in our analysis so we could delineate time periods when pilots were actually performing maneuvers. Each pilot on each flight team performed all of the maneuvers during each of the three simulated flights. The three flight simulation tests were executed in different order based on the airport that the pilots departed from—Boston Logan International, New York LaGuardia Airport/New York Kennedy Airport, and Ronald Reagan Washington National Airport.
Each pilot team flew one flight at each of the three targeted CO2 conditions: 700 ppm, 1500 ppm, 2500 ppm. Prior to each session, the CO2 level was adjusted back to a background concentration of 400 ppm with outdoor air. The CO2 concentration was modified by introducing ultra-pure CO2 (99.9% pure CO2, 0.1% H2O) from a gas cylinder into the simulator through the simulator’s ventilation system. Two environmental sensors (HOBO model MX1102, Onset Computer Corporation, Bourne, MA, USA) were installed on the left and right sides of the center console between the pilot seats to monitor real-time CO2 concentrations. The other environmental conditions were held constant during the flight simulation tests: total ventilation rate (850 L/s), temperature (24 ± 1 °C) and relative humidity (47 ± 2%). Pilots and examiners were both blinded to test conditions and the order of exposures was randomized. More specifics on the experimental methodology can be found in Allen et al. [37].
Three FAA designated examiners participated in the evaluation of pilot performance during the simulated flights, with the majority of ratings performed by one examiner (Examiner 1: 65% of flights, Examiner 2: 24% of flights; Examiner 3: 11% of flights). During each simulation, one of the three examiners was seated at the control console located behind the pilots. The examiner had full control over the simulator and an elevated vantage point to observe the pilot actions and communications. The pilot flying and the pilot monitoring worked as team with different responsibilities during each maneuver; the rating by the examiner was an indication of their combined flight performance. The examiners rated each maneuver according to standardized protocols used by the FAA during flight certification tests. The overall passing rates of pilots on each maneuver are presented in Figure S1.
The Movisens EcgMove3 sensor (Movisens, GmbH, Karlsruhe, Germany) [41], which was worn on a chest belt underneath the clothes with direct skin contact, was used to measure the electrocardiogram (ECG) data of each pilot from 10 min before entering the flight simulator to the end of simulations. The sensor collected single channel ECG data with a resolution of 12 bits and a sampling rate of 1024 Hz. The Movisens software was used to convert the ECG signals into time-serial HRV indices: SDNN (ms), RMSSD (ms), LF power (ms2), HF power (ms2) and LF/HF ratio. The HRV indices were calculated in an interval of 30 s (the minimum interval of EcgMove3 sensor).

2.3. Data Analysis

Multivariate linear models were used to test the fixed effect estimates of potential influencing factors on HRV indices for each maneuver. The influencing factors tested include age, body mass index (BMI), regular flight experience as a pilot or in simulation, CO2 condition settings and difficulty level of the maneuver, controlling for flight profile number (i.e., order of maneuvers) and examiner. Generalized additive mixed effect models (GAMM) were used to test the relationships between HRV indices and pilot performance, controlling for CO2 condition, maneuver difficulty, flight profile number, and examiner, and treating pilot ID as a random effect accounting for the repeat testing of pilots. As pretested, the interaction effect between CO2 condition and continuous HRV indices was not statistically significant. Therefore, the interaction term was not included in the final GAMM. A logit link function was used to treat examiner ratings as a binomial variable (1: Pass, 0: Fail):
y i , j , k = β 1 + β 2 HRV + β 3 ( MediumCO 2 ) + β 4 ( LowCO 2 ) + β 5 ( Profile 2 ) + β 6 ( Profile 3 ) + β 7 ( Examiner 2 ) + β 8 ( Examiner 3 ) + β 9 ( DifficultyB ) + β 10 ( DifficultyC ) + b 1 i + e i , j , k
where yi,i,k is the passing rate for pilot i during profile j on maneuver k; β1 is the fixed intercept; β2 is the fixed effect of each HRV metric at the maneuver level; β3 and β4 are the fixed effects of the medium and low CO2 conditions compared to the high CO2 condition; β5 and β6 are the fixed effects of the second and third sessions compared to the first session; β7 and β8 are the fixed effects of Examiners 2 and 3 compared to Examiner 1; β9 and β10 are the fixed effects of the Difficulty B and C maneuvers compared to the Difficulty A maneuvers; and b1i is the random effect of intercept for pilot i. Additionally, penalized splines (4 knots, cubic regression) were used to test for the linearity in the relationship between HRV indices and estimates of passing odds. Statistical analyses were performed using the open-source statistical package R version 3.5.0 (R Project for Statistical Computing, Vienna, Austria).

3. Results

3.1. Influencing Factors of HRV

Summary statistics of the HRV indices by the pilots are presented in Table 2 along with normative short-term HRV data from 44 selected studies involving 21,438 healthy adults at rest conditions (supine or seated), which could be considered as baseline levels for healthy adult population [42]. As shown in Table 2, both the SDNN and RMSSD values of pilots during flight simulations were slightly decreased than the values recorded during the 10-min waiting period before simulations. The LF/HF ratios of pilots were basically consistent before and during flight simulations. The pilots exhibited lower overall HRV (SDNN) and lower parasympathetic regulation (RMSSD) compared with the normative values both before and during the simulations. The ANS activity of pilots tended to be more sympathovagal imbalance, as indicated by higher LF/HF ratios compared with the normative values and the Task Force values (1.5–2.0) [20].
Figure 2 shows the average HRV values on each flight maneuver. As presented in Figure 2a,b, the lowest average SDNN and RMSSD values were found when the pilots conducted the ‘Steep Turns: Normal’ and ‘Circle to Land: Glide Slope Inoperative’ maneuvers, the two most difficult maneuvers with the lowest overall passing rates, 73% and 67%, respectively. In general, the variability was lower on the difficult maneuvers with low passing rates. The higher variability during the ‘Gap’ time may indicate that the pilots could be more relaxed during the cruise periods than conducting active flight maneuvers. As shown in Figure 2c, the average LF/HF ratios were quite close for most maneuvers within the value range of 5 to 7. That means the pilots were dominated by the sympathetic activity when conducting all the maneuvers, reflecting their intensive response to the stressors during the entirety of the flight simulations. The highest LF/HF ratio was found during the three takeoff maneuvers (‘Takeoff: Normal’; ‘RTO: 1 Engine Inoperative’; ‘Takeoff: Engine Fire’), indicating the increased dominance of SNS activity for the pilots during the takeoff phase. In addition, linear mixed effect models were used to test the difference in mean HRV values by active maneuvers compared to the ‘Gap’ time. The results are presented in Table S2.
Table 3 lists the fixed effects of the influencing factors on HRV indices, as estimated by the multivariate linear models. Both the SDNN and RMSSD were higher for the younger pilots relative to the pilots over 50 years old. Meanwhile, the LF/HF ratio was much lower for the pilots of 30 < Age < 40. HRV indices were also related to BMI; the variability was lower, while the LF/HF ratio was higher for the pilots with BMI > 30, which is defined as ‘obesity’ by the Centers for Disease Control and Prevention (CDC). The participants with frequent flight experience as a pilot showed higher variability than those who reported frequently flying in a simulator. However, the LF/HF ratio was slightly higher for the participants with more actual flight experience. No statistically-significant relationship was observed between HRV and CO2 condition settings. Exposure to lower CO2 concentration had little effect on the variability, but showed a small increase in the LF/HF ratio.
The relationships between the difficulty of maneuver and HRV indices were not consistent, most certainly due to the fact that the majority of maneuvers had a difficulty level of C and the difficulties A and B had a small sample size (Figure 2). Nevertheless, the model results indicated that the SDNN and RMSSD were lower when the pilots conducted the graded maneuvers of any difficulty compared with the ‘Gap’ time.

3.2. HRV and Pilot Performance

Table 4, Table 5 and Table 6 lists the GAMM results for the continuous HRV metrics, controlling for other influencing variables. The exponentials of the estimates represent the odds for a pilot passing a maneuver. As shown in the tables, the odds of passing a maneuver slightly increased with the increase of SDNN and RMSSD and decrease of LF/HF ratio. An interquartile range (IQR) increase in SDNN (21.97 ms) and RMSSD (16.00 ms) was associated with an increase of 37% and 22% in the odds of passing a maneuver, respectively. An IQR decrease in LF/HF ratio (4.69) would lead to a 20% increase in the passing odds. In addition, as reported in our previous paper [37], dose-response effects were also observed for the difficulty of maneuver and CO2 condition: the odds ratios of passing a maneuver were higher at lower CO2 concentration and lower difficulty level of maneuver.

4. Discussion

Active airline pilots were flying the simulator under high stress levels as indicated by their lower variability and higher LF/HF ratio, compared with the normative values of healthy adults [42]. The stress of the pilots was generally higher when performing maneuvers during the takeoff, approach and landing phases. Their stress was reduced during the ‘Gap’ periods, which may represent the cruise phase when the pilots are not performing active maneuvers. Lower HRV was associated with aging, high BMI and performing hard maneuvers with low passing rates. Overall, the pilots performed better on maneuvers as rated by the examiners during the flight simulations when their stress was lower, as indicated by the increase of SDNN and RMSSD and decrease of LF/HF ratio, controlling for CO2 condition and flight maneuver difficulty.
The findings on the impact of age and BMI on HRV are consistent with other studies. Previous studies of short-term HRV [43,44,45,46] have suggested inverse relationships between age and the time-domain HRV indices. The LF/HF ratio tends to increase with age in population of age <44 years [43], but possibly decrease with aging for elderly subjects of age >44 years [47] or >65 years [48]. Respiratory sinus arrhythmia is a normal physiologic process that becomes less prominent as people age, partly because of decreases in baroreflex sensitivity. This may account for some of the changes in HRV observed in aging populations [49]. The ANS activity is also related to the body weight regulation [50]. In a study of 25 healthy adults [51], increasing BMI is correlated to increased sympathetic activity (higher LF power) and lower parasympathetic activity (lower HF power). It could be speculated that obesity yields to increased energy expenditure as modulated by sympathetic activity. A study of 786 young men [52] also showed that increased BMI was associated with a shift in sympathovagal balance trending towards sympathetic dominance in young adults.
In this study, the relationship between CO2 condition and HRV was not significant, which was probably caused by concentrations in the flight simulator at or below 2500 ppm, a level not associated with HRV impacts in prior studies. For example, Kaye et al. [53] investigated the impact of acute CO2 exposure on cardiovascular and psychological responses to stress in healthy adults with concentrations from 5% to 35%. They concluded that a single breath of 35% CO2 could produce sympathetic and HPA axis activation, indicating the anxiogenic response to hypercapnia by the tested subjects. Lower doses of CO2 exposures did not show any significant effects on cardiovascular parameters. Elevating the end-tidal CO2 from 5% to 6% could increase HF and LF components of HRV in awake volunteers under both spontaneous and mechanical ventilation [54]. A recent study of indoor air quality and cardiovascular health [55] indicated that no association was observed between HRV and CO2 concentration in homes. The CO2 concentrations in airplane cabins are much lower than the effect levels [53,54]. For this reason, the ANS activities were not likely on the causal pathway between CO2 and cognition of pilots, yet HRV has an independent relationship with the odds of passing a maneuver.
The interaction between stress and pilot performance on different maneuvers may have two aspects. On the one hand, exposure to stress may be detrimental in performing executive-function tasks. Recent studies have signified the relationships between HRV and cognitive function [56]. Reduced cognitive performance associated with lower HRV may be a consequence of the failure of the ANS to properly regulate brain perfusion [57]. More importantly, vagally-mediated HRV has been related to the prefrontal cortex functioning, which is involved in the inhibition of SNS activation [58,59]. Attenuated SNS activity and increased PNS activity are associated with higher prefrontal cortex activity level [58]. Prefrontal cortex activity is correlated with many important cognitive functions such as working memory, sustained attention, behavioral inhibition and general mental flexibility [56,60,61]. All of these cognitive functions are essential for human executive functions that have to do with plan, direct action and self-regulation to perform goal-directed behavior. As a consequence, HRV is also related to cognitive performance of executive tasks. Hansen et al. [62] reported the subjects with higher RMSSD performed better on executive function such as working memory and attention tasks. The following study showed that physically-trained subjects had higher HF component and better cognitive performance on executive tasks than de-trained subjects who did no physical activity for a four week period [63]. A cross-sectional study of 4763 elder participants [64] showed that reduced total variability was associated with poorer cognitive performance as indicated by lower Montreal cognitive assessment (MOCA) score. ZAl Hazzouri et al. [22] collected the short-term ECG data of 2118 middle-age participants and correlated the HRV metrics with their cognitive test performance five years later with a prospective study design. They concluded that higher quartile of SDNN was associated with better executive function as indicated by higher Stroop test score. A study using visuospatial working memory (VSWM) test also showed that the decrement in HRV would lead to poor cognitive performance with an increase in memory load [65]. All of this evidence suggests that stress could profoundly impair goal-directed behavior with increased HPA-axis and SNS activity [66,67], and may contribute to the cognitive deficits observed in mental disorders and extreme environments [56]. As such, we can infer that stress could be detrimental to pilot performance on the hard maneuvers composed of challenging executive tasks being conducted under stressful conditions.
On the other hand, stress could be associated with improved cognitive performance on non-executive function tasks. Exposure to stress may have a positive effect on non-executive function that is driven reflexively by stimulation. Luft et al. [68] studied the differences in athletes’ HRV between executive tasks and non-executive tasks. They found that lower time-domain HRV measures, which means higher stress, was related to faster reaction time on non-executive tasks. The subjects with lower HRV showed faster mean reaction time on a non-executive or easy task under the threat-of-shock condition in which participants were threatened to receive an uncomfortable, but not painful, electric shock through the hand [69]. Stress is thought to be able to enhance memory formation but to impair memory retrieval [70]. Stress can facilitate the processing of sensory information caused by an increase in attention mediated by cortical arousal [71]. Acute exposure to stress may be beneficial to the instructed stimulus-response learning with moderate working memory demand [72]. As such, in some cases, necessary hyper vigilance or so-called eustress possibly make the pilots more alert, enhancing their reaction and cognitive adaptation to maneuvers. For example, the pilots performed well on the ‘Takeoff: Normal’ maneuver, though they had high LF/HF ratios.
In this study, the LF/HF ratio was used as a marker of sympathovagal balance. However, the interpretation of LF remains actively debated, which is considered by some researchers as a measure of sympathetic regulation [73] and by others as a parameter of both sympathetic and vagal regulation [74]. Another interpretation is LF can serve as a marker of sympathetic modulation in some contexts, and more represent parasympathetic activity in other contexts [74,75]. We further analyzed the influencing factors of the LF power and HF power of HRV, as shown in Figure S2 and Table S3. The results show that the changes in LF and HF power were basically in the same direction but with different magnitude. As the GAMM results, an interquartile range (IQR) increase in LF (944 ms2) and HF (266 ms2) was associated with an increase of 17% and 23% in the odds of passing a maneuver, respectively. The above results indicate that the HF component is highly correlated with the RMSSD measures, both as markers of parasympathetic regulation of heart; the LF component is likely to be influenced by both sympathetic and parasympathetic activity. Consequently, the LF/HF ratio could reflect sympathovagal balance to some extent, but the interpretation of LF and LF/HF ratio still warrants further elucidation.
There are several limitations to consider when interpreting the results of this study. While we had a baseline measurement of HRV before the simulation, the measurements were likely impacted by the stress of the impending simulations. Therefore, the HRV values of pilots may not be directly comparable to the normative HRV values derived from a literature review [42]. A number of studies have revealed large inter-personal variation for the majority of HRV measures [19,42]. The underlying factors for the discrepant values mainly include demographic of subjects, breathing protocols and spectral power analysis methods. In addition, the stress level and performance of pilots presented in this study could be different from those on an actual flight. These simulated flights were not conducted under an actual ‘check ride’ or actual ‘in-flight emergency’. In both of these cases where the pilot’s license and job, and possibly life, is on the line while performing these maneuvers, their stress level could be even higher than what we have demonstrated in this study. Though complying with the PTS standards, the examined maneuvers, such as one engine inoperative and glide slope inoperative, are generally much more challenging than the maneuvers occurred on normally functioning airplanes. As we were interested in the impact on pilot performance, we had the pilots controlling the simulator manually without any auto-pilot aid. Under these conditions, the pilots may more prone to error when conducting difficult maneuvers than during normal flight operations. Our research findings were solely based on male pilots. This reflects the current distribution of pilots in the workforce (94% male), but limit the generalizability to female pilots.
The HRV data that we have collected from airline pilots reflected their physiologic response produced by stressful situations in flight. This is a rare opportunity to evaluate the real-time stress response of pilots in an FAA-approved flight simulator under varying environmental conditions. Studying HRV data in this way can help us better understand how active pilots respond to stress physiologically. The implications of occupational stress and physiologic response can be applied to other workers in high-stress occupations.

5. Conclusions

In this study, we studied the HRV of thirty active commercial airline pilots and their performance on flight maneuvers when flying three flight simulation sessions in an FAA-certified A320 flight simulator. The pilots were stressed both before and during the flight simulations, and have higher stress response when conducting advanced flight maneuvers. Lower HRV was associated with age, high BMI and performing difficult maneuvers. The model results showed that exposure to stress could affect pilot performance, independent from the effects of CO2 exposure; higher HRV and more balanced ANS activity of a pilot were associated with higher odds of passing a maneuver.

Supplementary Materials

The following are available online at https://www.mdpi.com/1660-4601/16/2/237/s1. Figure S1: Overall passing rates of pilots on each maneuver in the flight simulator (the error bars represent the standard errors), Figure S2: Average LF and HF power of HRV by flight maneuver types and difficulty, Table S1: Flight maneuvers and performance criteria, Table S2: Difference in mean HRV values by flight maneuver types (referent: Gap time), treating pilot as a random intercept, Table S3: The fixed effect estimates on LF and HF, controlling for examiner and flight profile number.

Author Contributions

X.C. led the data analysis and drafted the manuscript. P.M., S.F., J.V., D.D.-M., X.C. and J.G.C.-L. participated in the study design and field study. P.M., L.R.C., J.G.C.-L. and D.C.C. participated in interpretation of the data and assisted in the drafting of the manuscript. The research idea was inspired by J.G.A. and J.D.S. They conceived the study and contributed a lot to improve the manuscript quality. All authors contributed to, read and approved the final manuscript.

Funding

This research was funded by a gift from United Technologies to the Healthy Buildings program (www.ForHealth.org) at the Harvard T.H. Chan School of Public Health.

Acknowledgments

The authors would like to thank the pilots for volunteering to participate in this study, AFG for support with the flight simulator, and the three FAA designated flight examiners. We thank the anonymous peer-reviewers for their excellent comments that have enhanced the manuscript. United Technologies provided feedback on the study design, but they were not involved in the data collection, data analysis, data interpretation, data presentation, or drafting of the manuscript.

Conflicts of Interest

The authors declare no conflict of interest.

References

  1. IATA. Iata Forecasts Passenger Demand to Double over 20 Years. Available online: http://www.iata.org/pressroom/pr/Pages/2016-10-18-02.aspx (accessed on 15 June 2017).
  2. FAA. Air Traffic by the Numbers. Available online: https://www.faa.gov/air_traffic/by_the_numbers/media/Air_Traffic_by_the_Numbers_2017_Final.pdf (accessed on 1 July 2018).
  3. Boeing. Statistical Summary of Commercial Jet Airplane Accidents, Worldwide Operations 1959–2016. Available online: https://www.boeing.com/resources/boeingdotcom/company/about_bca/pdf/statsum.pdf (accessed on 1 July 2018).
  4. FAA. Active Civil Airmen Statistics. 2017. Available online: https://www.faa.gov/data_research/aviation_data_statistics/civil_airmen_statistics/ (accessed on 1 July 2018).
  5. Wu, A.C.; Donnelly-McLay, D.; Weisskopf, M.G.; McNeely, E.; Betancourt, T.S.; Allen, J.G. Airplane pilot mental health and suicidal thoughts: A cross-sectional descriptive study via anonymous web-based survey. Environ. Health 2016, 15, 121. [Google Scholar] [CrossRef]
  6. Petrilli, R.M.; Roach, G.D.; Dawson, D.; Lamond, N. The sleep, subjective fatigue, and sustained attention of commercial airline pilots during an international pattern. Chronobiol. Int. 2006, 23, 1357–1362. [Google Scholar] [CrossRef] [PubMed]
  7. Reis, C.; Mestre, C.; Canhão, H.; Gradwell, D.; Paiva, T. Sleep complaints and fatigue of airline pilots. Sleep Sci. 2016, 9, 73–77. [Google Scholar] [CrossRef] [PubMed] [Green Version]
  8. Roscoe, A.H. Assessing pilot workload. Why measure heart rate, hrv and respiration? Biol. Psychol. 1992, 34, 259–287. [Google Scholar] [CrossRef]
  9. Cavallari, J.M.; Fang, S.C.; Eisen, E.A.; Schwartz, J.; Hauser, R.; Herrick, R.F.; Christiani, D.C. Time course of heart rate variability decline following particulate matter exposures in an occupational cohort. Inhal. Toxicol. 2008, 20, 415–422. [Google Scholar] [CrossRef] [PubMed]
  10. Magari, S.R.; Hauser, R.; Schwartz, J.; Williams, P.L.; Smith, T.J.; Christiani, D.C. Association of heart rate variability with occupational and environmental exposure to particulate air pollution. Circulation 2001, 104, 986–991. [Google Scholar] [CrossRef]
  11. Regula, M.; Socha, V.; Kutilek, P.; Socha, L.; Hana, K.; Hanakova, L.; Szabo, S. Study of heart rate as the main stress indicator in aircraft pilots. In Proceedings of the 2014 16th International Conference on Mechatronics-Mechatronika (ME), Brno, Czech Republic, 3–5 Decmeber 2014; pp. 639–643. [Google Scholar]
  12. Rotenberg, S.; McGrath, J.J. Inter-relation between autonomic and hpa axis activity in children and adolescents. Biol. Psychol. 2016, 117, 16–25. [Google Scholar] [CrossRef] [PubMed]
  13. Ziegler, M.G. Psychological stress and the autonomic nervous system. In Primer on the Autonomic Nervous System, 3rd ed.; Elsevier: Amsterdam, The Netherlands, 2012; pp. 291–293. [Google Scholar]
  14. Egliston, K.-A.; McMahon, C.; Austin, M.-P. Stress in pregnancy and infant hpa axis function: Conceptual and methodological issues relating to the use of salivary cortisol as an outcome measure. Psychoneuroendocrinology 2007, 32, 1–13. [Google Scholar] [CrossRef]
  15. Porges, S.W. The polyvagal perspective. Biol. Psychol. 2007, 74, 116–143. [Google Scholar] [CrossRef]
  16. McCorry, L.K. Physiology of the autonomic nervous system. Am. J. Pharm. Educ. 2007, 71, 78. [Google Scholar] [CrossRef]
  17. McCraty, R.; Shaffer, F. Heart rate variability: New perspectives on physiological mechanisms, assessment of self-regulatory capacity, and health risk. Glob. Adv. Health Med. 2015, 4, 46–61. [Google Scholar] [CrossRef]
  18. Kim, H.-G.; Cheon, E.-J.; Bai, D.-S.; Lee, Y.H.; Koo, B.-H. Stress and heart rate variability: A meta-analysis and review of the literature. Psychiatry Investig. 2018, 15, 235. [Google Scholar] [CrossRef] [PubMed]
  19. Shaffer, F.; Ginsberg, J. An overview of heart rate variability metrics and norms. Front. Public Health 2017, 5, 258. [Google Scholar] [CrossRef] [PubMed]
  20. Task Force. Heart rate variability: Standards of measurement, physiological interpretation, and clinical use. Task force of the european society of cardiology and the north american society of pacing and electrophysiology. Circulation 1996, 93, 1043–1065. [Google Scholar] [CrossRef]
  21. Kang, M.G.; Koh, S.B.; Cha, B.S.; Park, J.K.; Woo, J.M.; Chang, S.J. Association between job stress on heart rate variability and metabolic syndrome in shipyard male workers. Yonsei Med. J. 2004, 45, 838–846. [Google Scholar] [CrossRef] [PubMed]
  22. Zeki Al Hazzouri, A.; Elfassy, T.; Carnethon, M.R.; Lloyd-Jones, D.M.; Yaffe, K. Heart rate variability and cognitive function in middle-age adults: The coronary artery risk development in young adults. Am. J. Hypertens. 2017, 31, 27–34. [Google Scholar] [CrossRef] [PubMed]
  23. Ernst, G. Heart-rate variability—More than heart beats? Front. Public Health 2017, 5, 240. [Google Scholar] [CrossRef]
  24. Kleiger, R.E.; Stein, P.K.; Bigger, J.T., Jr. Heart rate variability: Measurement and clinical utility. Ann. Noninvasive Electrocardiol. 2005, 10, 88–101. [Google Scholar] [CrossRef]
  25. Bekö, G.; Allen, J.G.; Weschler, C.J.; Vallarino, J.; Spengler, J.D. Impact of cabin ozone concentrations on passenger reported symptoms in commercial aircraft. PLoS ONE 2015, 10, e0128454. [Google Scholar] [CrossRef]
  26. Allen, J.G.; Stapleton, H.M.; Vallarino, J.; McNeely, E.; McClean, M.D.; Harrad, S.J.; Rauert, C.B.; Spengler, J.D. Exposure to flame retardant chemicals on commercial airplanes. Environ. Health 2013, 12, 17. [Google Scholar] [CrossRef] [Green Version]
  27. Zevitas, C.D.; Spengler, J.D.; Jones, B.; McNeely, E.; Coull, B.; Cao, X.; Loo, S.M.; Hard, A.-K.; Allen, J.G. Assessment of noise in the airplane cabin environment. J. Expo. Sci. Environ. Epidemiol. 2018, 28, 568–578. [Google Scholar] [CrossRef] [PubMed]
  28. Cao, X.; Liu, J.; Pei, J.; Zhang, Y.; Li, J.; Zhu, X. 2d-piv measurement of aircraft cabin air distribution with a high spatial resolution. Build. Environ. 2014, 82, 9–19. [Google Scholar] [CrossRef]
  29. Cao, X.; Li, J.; Liu, J.; Yang, W. 2d-piv measurement of isothermal air jets from a multi-slot diffuser in aircraft cabin environment. Build. Environ. 2016, 99, 44–58. [Google Scholar] [CrossRef]
  30. Cao, X.; Zevitas, C.D.; Spengler, J.D.; Coull, B.; McNeely, E.; Jones, B.; Loo, S.M.; MacNaughton, P.; Allen, J.G. The on-board carbon dioxide concentrations and ventilation performance in passenger cabins of us domestic flights. Indoor Built Environ. 2018. [Google Scholar] [CrossRef]
  31. FAR. Part 25-Airworthiness Standards: Transport Category Airplanes; Federal Aviation Administration (FAA): Washington, DC, USA, 2013.
  32. EASA. Caq Preliminary Cabin Air Quality Measurement Campaign. Available online: https://www.easa.europa.eu/system/files/dfu/EASA%20CAQ%20Study%20Final%20Report_21.03.2017.pdf (accessed on 1 July 2018).
  33. Allen, J.G.; MacNaughton, P.; Satish, U.; Santanam, S.; Vallarino, J.; Spengler, J.D. Associations of cognitive function scores with carbon dioxide, ventilation, and volatile organic compound exposures in office workers: A controlled exposure study of green and conventional office environments. Environ. Health Perspect. 2016, 124, 805–812. [Google Scholar] [CrossRef] [PubMed]
  34. Zhang, X.; Wargocki, P.; Lian, Z.; Thyregod, C. Effects of exposure to carbon dioxide and bioeffluents on perceived air quality, self-assessed acute health symptoms, and cognitive performance. Indoor Air 2017, 27, 47–64. [Google Scholar] [CrossRef] [PubMed]
  35. Satish, U.; Mendell, M.J.; Shekhar, K.; Hotchi, T.; Sullivan, D.; Streufert, S.; Fisk, W.J. Is CO2 an indoor pollutant? Direct effects of low-to-moderate CO2 concentrations on human decision-making performance. Environ. Health Perspect. 2012, 120, 1671. [Google Scholar] [CrossRef]
  36. MacNaughton, P.; Spengler, J.; Vallarino, J.; Santanam, S.; Satish, U.; Allen, J. Environmental perceptions and health before and after relocation to a green building. Build. Environ. 2016, 104, 138–144. [Google Scholar] [CrossRef] [Green Version]
  37. Allen, J.; MacNaughton, P.; Cedeno-Laurent, J.; Cao, X.; Flanigan, S.; Vallarino, J.; Rueda, F.; Donnelly-McLay, D.; Spengler, J. Airplane pilot flight performance on 21 maneuvers in a flight simulator under varying carbon dioxide concentrations. J. Expo. Sci. Environ. Epidemiol. 2018. [Google Scholar] [CrossRef]
  38. WAI. Current Statistics of Women in Aviation Careers in U.S. Available online: https://www.wai.org/resources/waistats (accessed on 1 July 2018).
  39. FAA. Airline Transport Pilot and Aircraft Type Rating Practical Test Standards for Airplane. Available online: https://www.faa.gov/training_testing/testing/test_standards/media/atp_pts.pdf (accessed on 1 July 2018).
  40. FAA. Pilot/Controller Glossary. Available online: https://www.faa.gov/air_traffic/publications/media/pcg_chg_2_9-13-18.pdf (accessed on 13 September 2018).
  41. Movisens. Ecgmove 3. Available online: https://www.movisens.com/en/products/ecg-and-activity-sensor-ecgmove-3/ (accessed on 1 July 2018).
  42. Nunan, D.; Sandercock, G.R.; Brodie, D.A. A quantitative systematic review of normal values for short-term heart rate variability in healthy adults. Pacing Clin. Electrophysiol. 2010, 33, 1407–1417. [Google Scholar] [CrossRef]
  43. Voss, A.; Schroeder, R.; Heitmann, A.; Peters, A.; Perz, S. Short-term heart rate variability—Influence of gender and age in healthy subjects. PLoS ONE 2015, 10, e0118308. [Google Scholar] [CrossRef] [PubMed]
  44. Agelink, M.W.; Malessa, R.; Baumann, B.; Majewski, T.; Akila, F.; Zeit, T.; Ziegler, D. Standardized tests of heart rate variability: Normal ranges obtained from 309 healthy humans, and effects of age, gender, and heart rate. Clin. Auton. Res. 2001, 11, 99–108. [Google Scholar] [CrossRef] [PubMed]
  45. Beckers, F.; Verheyden, B.; Aubert, A.E. Aging and nonlinear heart rate control in a healthy population. Am. J. Physiol. Heart Circ. Physiol. 2006, 290, H2560–H2570. [Google Scholar] [CrossRef] [PubMed]
  46. Voss, A.; Heitmann, A.; Schroeder, R.; Peters, A.; Perz, S. Short-term heart rate variability—Age dependence in healthy subjects. Physiol. Meas. 2012, 33, 1289. [Google Scholar] [CrossRef]
  47. Greiser, K.H.; Kluttig, A.; Schumann, B.; Swenne, C.A.; Kors, J.A.; Kuss, O.; Haerting, J.; Schmidt, H.; Thiery, J.; Werdan, K. Cardiovascular diseases, risk factors and short-term heart rate variability in an elderly general population: The carla study 2002–2006. Eur. J. Epidemiol. 2009, 24, 123. [Google Scholar] [CrossRef] [PubMed]
  48. Stein, P.K.; Barzilay, J.I.; Chaves, P.H.; Domitrovich, P.P.; Gottdiener, J.S. Heart rate variability and its changes over 5 years in older adults. Age Ageing 2009, 38, 212–218. [Google Scholar] [CrossRef] [PubMed]
  49. Porta, A.; Faes, L.; Bari, V.; Marchi, A.; Bassani, T.; Nollo, G.; Perseguini, N.M.; Milan, J.; Minatel, V.; Borghi-Silva, A. Effect of age on complexity and causality of the cardiovascular control: Comparison between model-based and model-free approaches. PLoS ONE 2014, 9, e89463. [Google Scholar] [CrossRef]
  50. Davy, K.P.; Orr, J.S. Sympathetic nervous system behavior in human obesity. Neurosci. Biobehav. Rev. 2009, 33, 116–124. [Google Scholar] [CrossRef] [Green Version]
  51. Molfino, A.; Fiorentini, A.; Tubani, L.; Martuscelli, M.; Fanelli, F.R.; Laviano, A. Body mass index is related to autonomic nervous system activity as measured by heart rate variability. Eur. J. Clin. Nutr. 2009, 63, 1263. [Google Scholar] [CrossRef]
  52. Millis, R.M.; Austin, R.E.; Hatcher, M.D.; Bond, V.; Faruque, M.U.; Goring, K.L.; Hickey, B.M.; DeMeersman, R.E. Association of body fat percentage and heart rate variability measures of sympathovagal balance. Life Sci. 2010, 86, 153–157. [Google Scholar] [CrossRef] [Green Version]
  53. Kaye, J.; Buchanan, F.; Kendrick, A.; Johnson, P.; Lowry, C.; Bailey, J.; Nutt, D.; Lightman, S. Acute carbon dioxide exposure in healthy adults: Evaluation of a novel means of investigating the stress response. J. Neuroendocrinol. 2004, 16, 256–264. [Google Scholar] [CrossRef] [PubMed]
  54. Pöyhönen, M.; Syväoja, S.; Hartikainen, J.; Ruokonen, E.; Takala, J. The effect of carbon dioxide, respiratory rate and tidal volume on human heart rate variability. Acta Anaesthesiol. Scand. 2004, 48, 93–101. [Google Scholar] [CrossRef] [PubMed]
  55. Lin, L.-Y.; Chuang, H.-C.; Liu, I.-J.; Chen, H.-W.; Chuang, K.-J. Reducing indoor air pollution by air conditioning is associated with improvements in cardiovascular health among the general population. Sci. Total Environ. 2013, 463, 176–181. [Google Scholar] [CrossRef] [PubMed]
  56. Thayer, J.F.; Hansen, A.L.; Saus-Rose, E.; Johnsen, B.H. Heart rate variability, prefrontal neural function, and cognitive performance: The neurovisceral integration perspective on self-regulation, adaptation, and health. Ann. Behav. Med. 2009, 37, 141–153. [Google Scholar] [CrossRef] [PubMed]
  57. Elias, M.F.; Torres, R.V. The renaissance of heart rate variability as a predictor of cognitive functioning. Am. J. Hypertens. 2017, 31, 21–23. [Google Scholar] [CrossRef] [PubMed]
  58. Lane, R.D.; McRae, K.; Reiman, E.M.; Chen, K.; Ahern, G.L.; Thayer, J.F. Neural correlates of heart rate variability during emotion. Neuroimage 2009, 44, 213–222. [Google Scholar] [CrossRef] [PubMed]
  59. Thayer, J.F.; Lane, R.D. Claude bernard and the heart–brain connection: Further elaboration of a model of neurovisceral integration. Neurosci. Biobehav. Rev. 2009, 33, 81–88. [Google Scholar] [CrossRef] [PubMed]
  60. Arnsten, A.F.; Goldman-Rakic, P.S. Noise stress impairs prefrontal cortical cognitive function in monkeys: Evidence for a hyperdopaminergic mechanism. Arch. Gen. Psychiatry 1998, 55, 362–368. [Google Scholar] [CrossRef]
  61. Thayer, J.F.; Brosschot, J.F. Psychosomatics and psychopathology: Looking up and down from the brain. Psychoneuroendocrinology 2005, 30, 1050–1058. [Google Scholar] [CrossRef]
  62. Hansen, A.L.; Johnsen, B.H.; Thayer, J.F. Vagal influence on working memory and attention. Int. J. Psychophysiol. 2003, 48, 263–274. [Google Scholar] [CrossRef]
  63. Hansen, A.L.; Johnsen, B.H.; Sollers, J.J.; Stenvik, K.; Thayer, J.F. Heart rate variability and its relation to prefrontal cognitive function: The effects of training and detraining. Eur. J. Appl. Physiol. 2004, 93, 263–272. [Google Scholar] [CrossRef]
  64. Frewen, J.; Finucane, C.; Savva, G.M.; Boyle, G.; Coen, R.F.; Kenny, R.A. Cognitive function is associated with impaired heart rate variability in ageing adults: The irish longitudinal study on ageing wave one results. Clin. Auton. Res. 2013, 23, 313–323. [Google Scholar] [CrossRef] [PubMed]
  65. Muthukrishnan, S.P.; Gurja, J.P.; Sharma, R. Does heart rate variability predict human cognitive performance at higher memory loads? Indian J. Physiol. Pharm. 2017, 61, 14–22. [Google Scholar]
  66. Plessow, F.; Kiesel, A.; Kirschbaum, C. The stressed prefrontal cortex and goal-directed behaviour: Acute psychosocial stress impairs the flexible implementation of task goals. Exp. Brain Res. 2012, 216, 397–408. [Google Scholar] [CrossRef] [PubMed]
  67. Schwabe, L.; Tegenthoff, M.; Höffken, O.; Wolf, O.T. Simultaneous glucocorticoid and noradrenergic activity disrupts the neural basis of goal-directed action in the human brain. J. Neurosci. 2012, 32, 10146–10155. [Google Scholar] [CrossRef] [PubMed]
  68. Luft, C.D.B.; Takase, E.; Darby, D. Heart rate variability and cognitive function: Effects of physical effort. Biol. Psychol. 2009, 82, 186–191. [Google Scholar] [CrossRef] [PubMed]
  69. Hansen, A.L.; Johnsen, B.H.; Thayer, J.F. Relationship between heart rate variability and cognitive function during threat of shock. Anxiety Stress Coping 2009, 22, 77–89. [Google Scholar] [CrossRef] [PubMed]
  70. Schwabe, L.; Wolf, O.T. Stress modulates the engagement of multiple memory systems in classification learning. J. Neurosci. 2012, 32, 11042–11049. [Google Scholar] [CrossRef]
  71. Foote, S.L.; Bloom, F.E.; Aston-Jones, G. Nucleus locus ceruleus: New evidence of anatomical and physiological specificity. Physiol. Rev. 1983, 63, 844–914. [Google Scholar] [CrossRef] [PubMed]
  72. Vogel, S.; Schwabe, L. Tell me what to do: Stress facilitates stimulus-response learning by instruction. Neurobiol. Learn. Mem. 2018, 151, 43–52. [Google Scholar] [CrossRef] [PubMed]
  73. Montano, N.; Porta, A.; Cogliati, C.; Costantino, G.; Tobaldini, E.; Casali, K.R.; Iellamo, F. Heart rate variability explored in the frequency domain: A tool to investigate the link between heart and behavior. Neurosci. Biobehav. Rev. 2009, 33, 71–80. [Google Scholar] [CrossRef] [PubMed]
  74. Reyes del Paso, G.A.; Langewitz, W.; Mulder, L.J.; Van Roon, A.; Duschek, S. The utility of low frequency heart rate variability as an index of sympathetic cardiac tone: A review with emphasis on a reanalysis of previous studies. Psychophysiology 2013, 50, 477–487. [Google Scholar] [CrossRef] [PubMed]
  75. Friedman, B.H. An autonomic flexibility–neurovisceral integration model of anxiety and cardiac vagal tone. Biol. Psychol. 2007, 74, 185–199. [Google Scholar] [CrossRef] [PubMed]
Figure 1. (a) An FAA-approved A320 flight simulator; (b) Flight simulation test.
Ijerph 16 00237 g001
Figure 2. Average HRV values by flight maneuver types and difficulty (the error bars represent the standard deviations): (a) SDNN; (b) RMSSD; (c) LF/HF.
Ijerph 16 00237 g002aIjerph 16 00237 g002b
Table 1. Basic information of participating pilots.
CategoryPercentage
GenderMale100%
Female0%
Age30–4037%
41–5027%
>5036%
BMI (kg/m2)20–2540%
25–3037%
>3023%
EthnicityWhite/Caucasian20%
Latino74%
Black or African American3%
Multiracial3%
Flight experienceRegularly fly 65+ hours/month as a pilot70%
Regularly fly 65+ hours/month in simulation30%
Table 2. Summary statistics of the HRV indices of pilots, compared with the normative values for short-term HRV of healthy adults [42].
HRV IndexCategoryMeanSDMedianMinMax
SDNN (ms)Pilots (during simulations)34.112.732.112.359.3
Pilots (before simulations)40.011.740.919.358.0
Normative values50.016.051.032.093.0
RMSSD (ms)Pilots (during simulations)23.810.222.66.248.0
Pilots (before simulations)26.79.426.712.848.4
Normative values42.015.042.019.075.0
LF/HFPilots (during simulations)5.72.85.51.514.1
Pilots (before simulations)5.52.45.82.812.0
Normative values2.82.62.11.111.6
Table 3. The fixed effect estimates on HRV indices, controlling for examiner and flight profile number.
VariableSDNN (ms) (R-Squared = 0.393)RMSSD (ms) (R-Squared = 0.443)LF/HF (R-Squared = 0.189)
EstimateStd. Errorp-ValueEstimateStd. Errorp-ValueEstimateStd. Errorp-Value
Intercept19.211.54<0.00112.891.20<0.0015.960.49<0.001
Age > 500.00 (Reference)
41 < Age < 5011.620.86<0.0014.130.68<0.0011.330.27<0.001
30 < Age < 4018.110.78<0.00116.560.61<0.001−3.280.25<0.001
BMI > 300.00 (Reference)
25 < BMI < 304.200.91<0.0015.180.71<0.001−0.650.290.026
20 < BMI < 253.540.85<0.0014.370.67<0.001−0.280.270.305
Regularly fly 65+ hours/month in simulation0.00 (Reference)
Regularly fly 65+ hours /month as a pilot6.160.82<0.0010.430.640.5071.360.26<0.001
High CO20.00 (Reference)
Medium CO20.640.730.384−0.150.570.7970.640.230.006
Low CO20.100.750.895−0.780.590.1820.780.240.001
Gap time0.00 (Reference)
Difficulty A−5.531.740.002−2.861.360.036−0.360.550.509
Difficulty B−2.031.370.138−1.401.070.1910.220.430.605
Difficulty C−4.131.270.001−2.661.000.008−0.240.400.558
Table 4. GAMM results of SDNN, CO2 condition and maneuver difficulty on passing a maneuver, controlling for examiner and flight profile number and treating pilot ID as a random effect.
VariableEstimateOdds Ratio (95% CI)p-Value
Intercept2.02--0.004
SDNN0.0141.37 (0.93, 2.02) 10.111
High CO21.00 (Reference)
Medium CO20.501.65 (1.06, 2.59)0.028
Low CO20.631.87 (1.17, 3.01)0.009
Difficulty A1.00 (Reference)
Difficulty B−0.460.63 (0.17, 2.27)0.478
Difficulty C−1.430.24 (0.07, 0.79)0.020
1 Odds ratio for an IQR increase in SDNN (21.97 ms).
Table 5. GAMM results of RMSSD, CO2 condition and maneuver difficulty on passing a maneuver, controlling for examiner and flight profile number and treating pilot ID as a random effect.
VariableEstimateOdds Ratio (95% CI)p-Value
Intercept2.19--0.001
RMSSD0.0131.22 (0.87, 1.73) 10.251
High CO21.00 (Reference)
Medium CO20.521.68 (1.07, 2.63)0.024
Low CO20.631.88 (1.17, 3.02)0.009
Difficulty A1.00 (Reference)
Difficulty B−0.450.64 (0.18, 2.30)0.478
Difficulty C−1.440.24 (0.07, 0.79)0.020
1 Odds ratio for an IQR increase in SDNN (16.00 ms).
Table 6. GAMM results of LF/HF, CO2 condition and maneuver difficulty on passing a maneuver, controlling for examiner and flight profile number and treating pilot ID as a random effect.
VariableEstimateOdds Ratio (95% CI)p-Value
Intercept2.67--<0.001
LF/HF−0.0381.20 (0.94, 1.51) 10.137
High CO21.00 (Reference)
Medium CO20.561.76 (1.12, 2.75)0.014
Low CO20.651.92 (1.19, 3.08)0.007
Difficulty A1.00 (Reference)
Difficulty B−0.440.64 (0.18, 2.31)0.497
Difficulty C−1.480.23 (0.07, 0.76)0.016
1 Odds ratio for an IQR decrease in LF/HF (4.69).

