Spatial-Temporal Coupling Analysis of the Coordination between Urbanization and Water Ecosystem in the Yangtze River Economic Belt


Abstract
1. Introduction
2. Materials and Methods
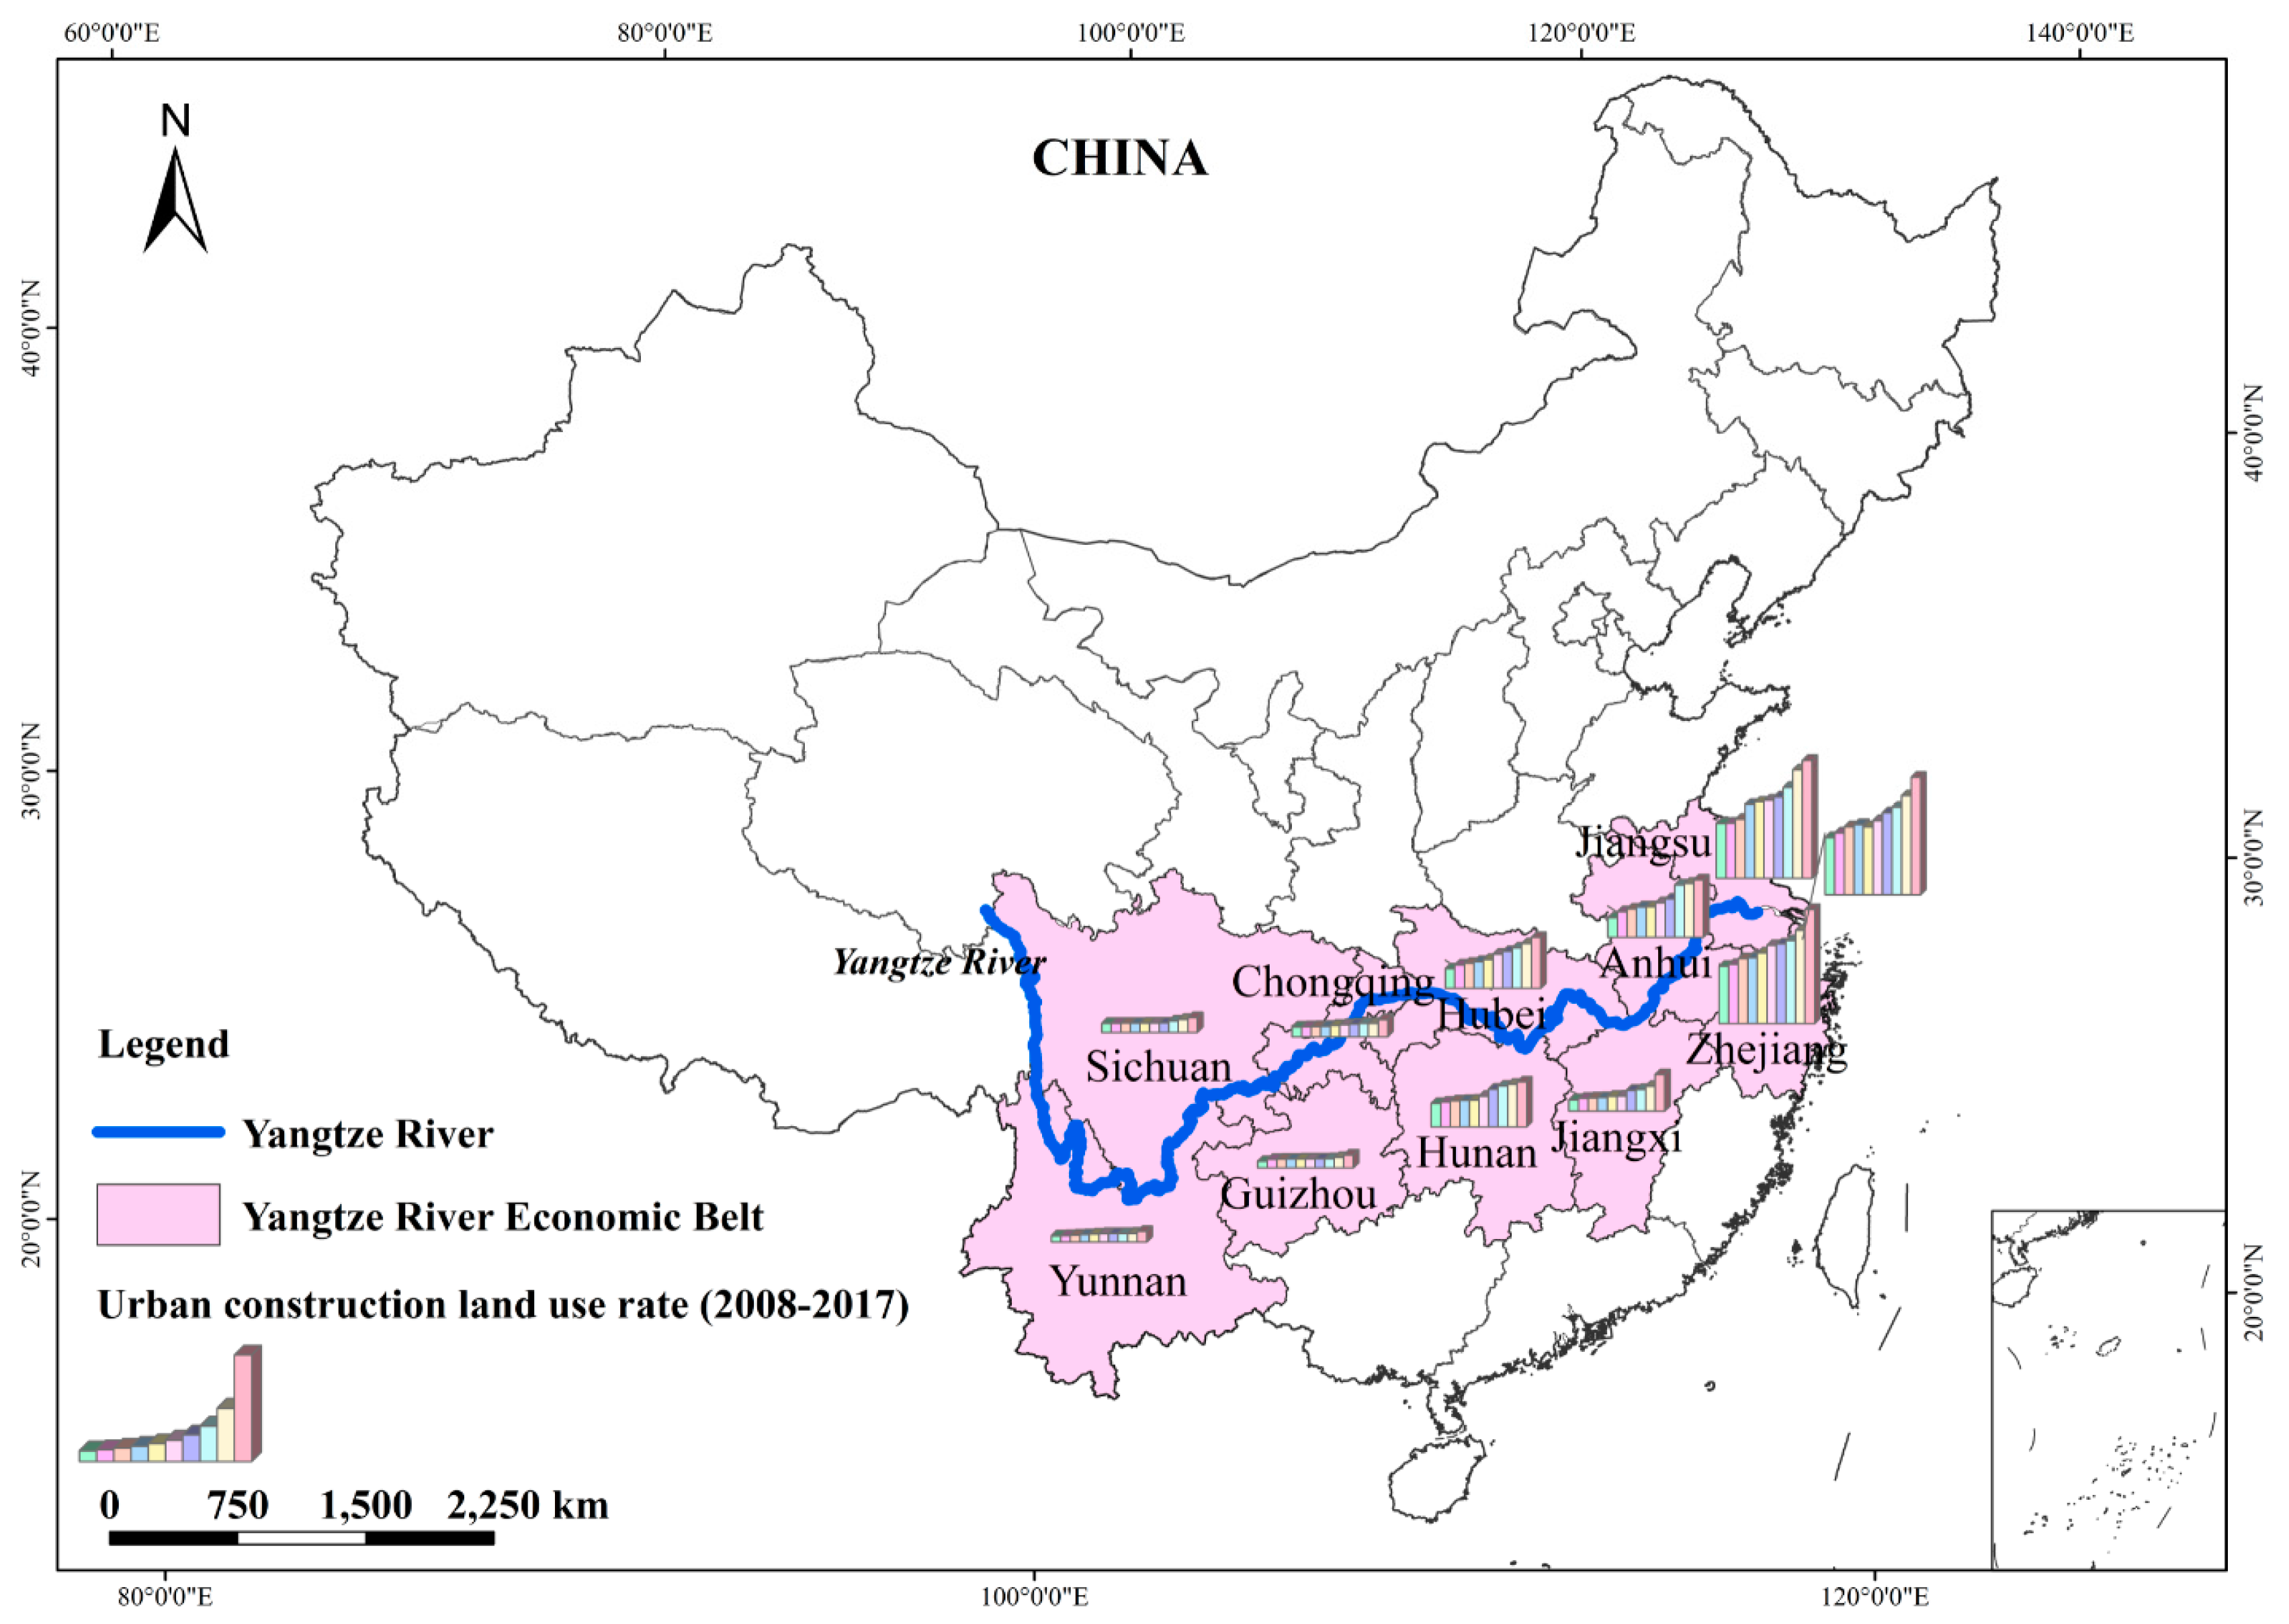
2.1. Study Area
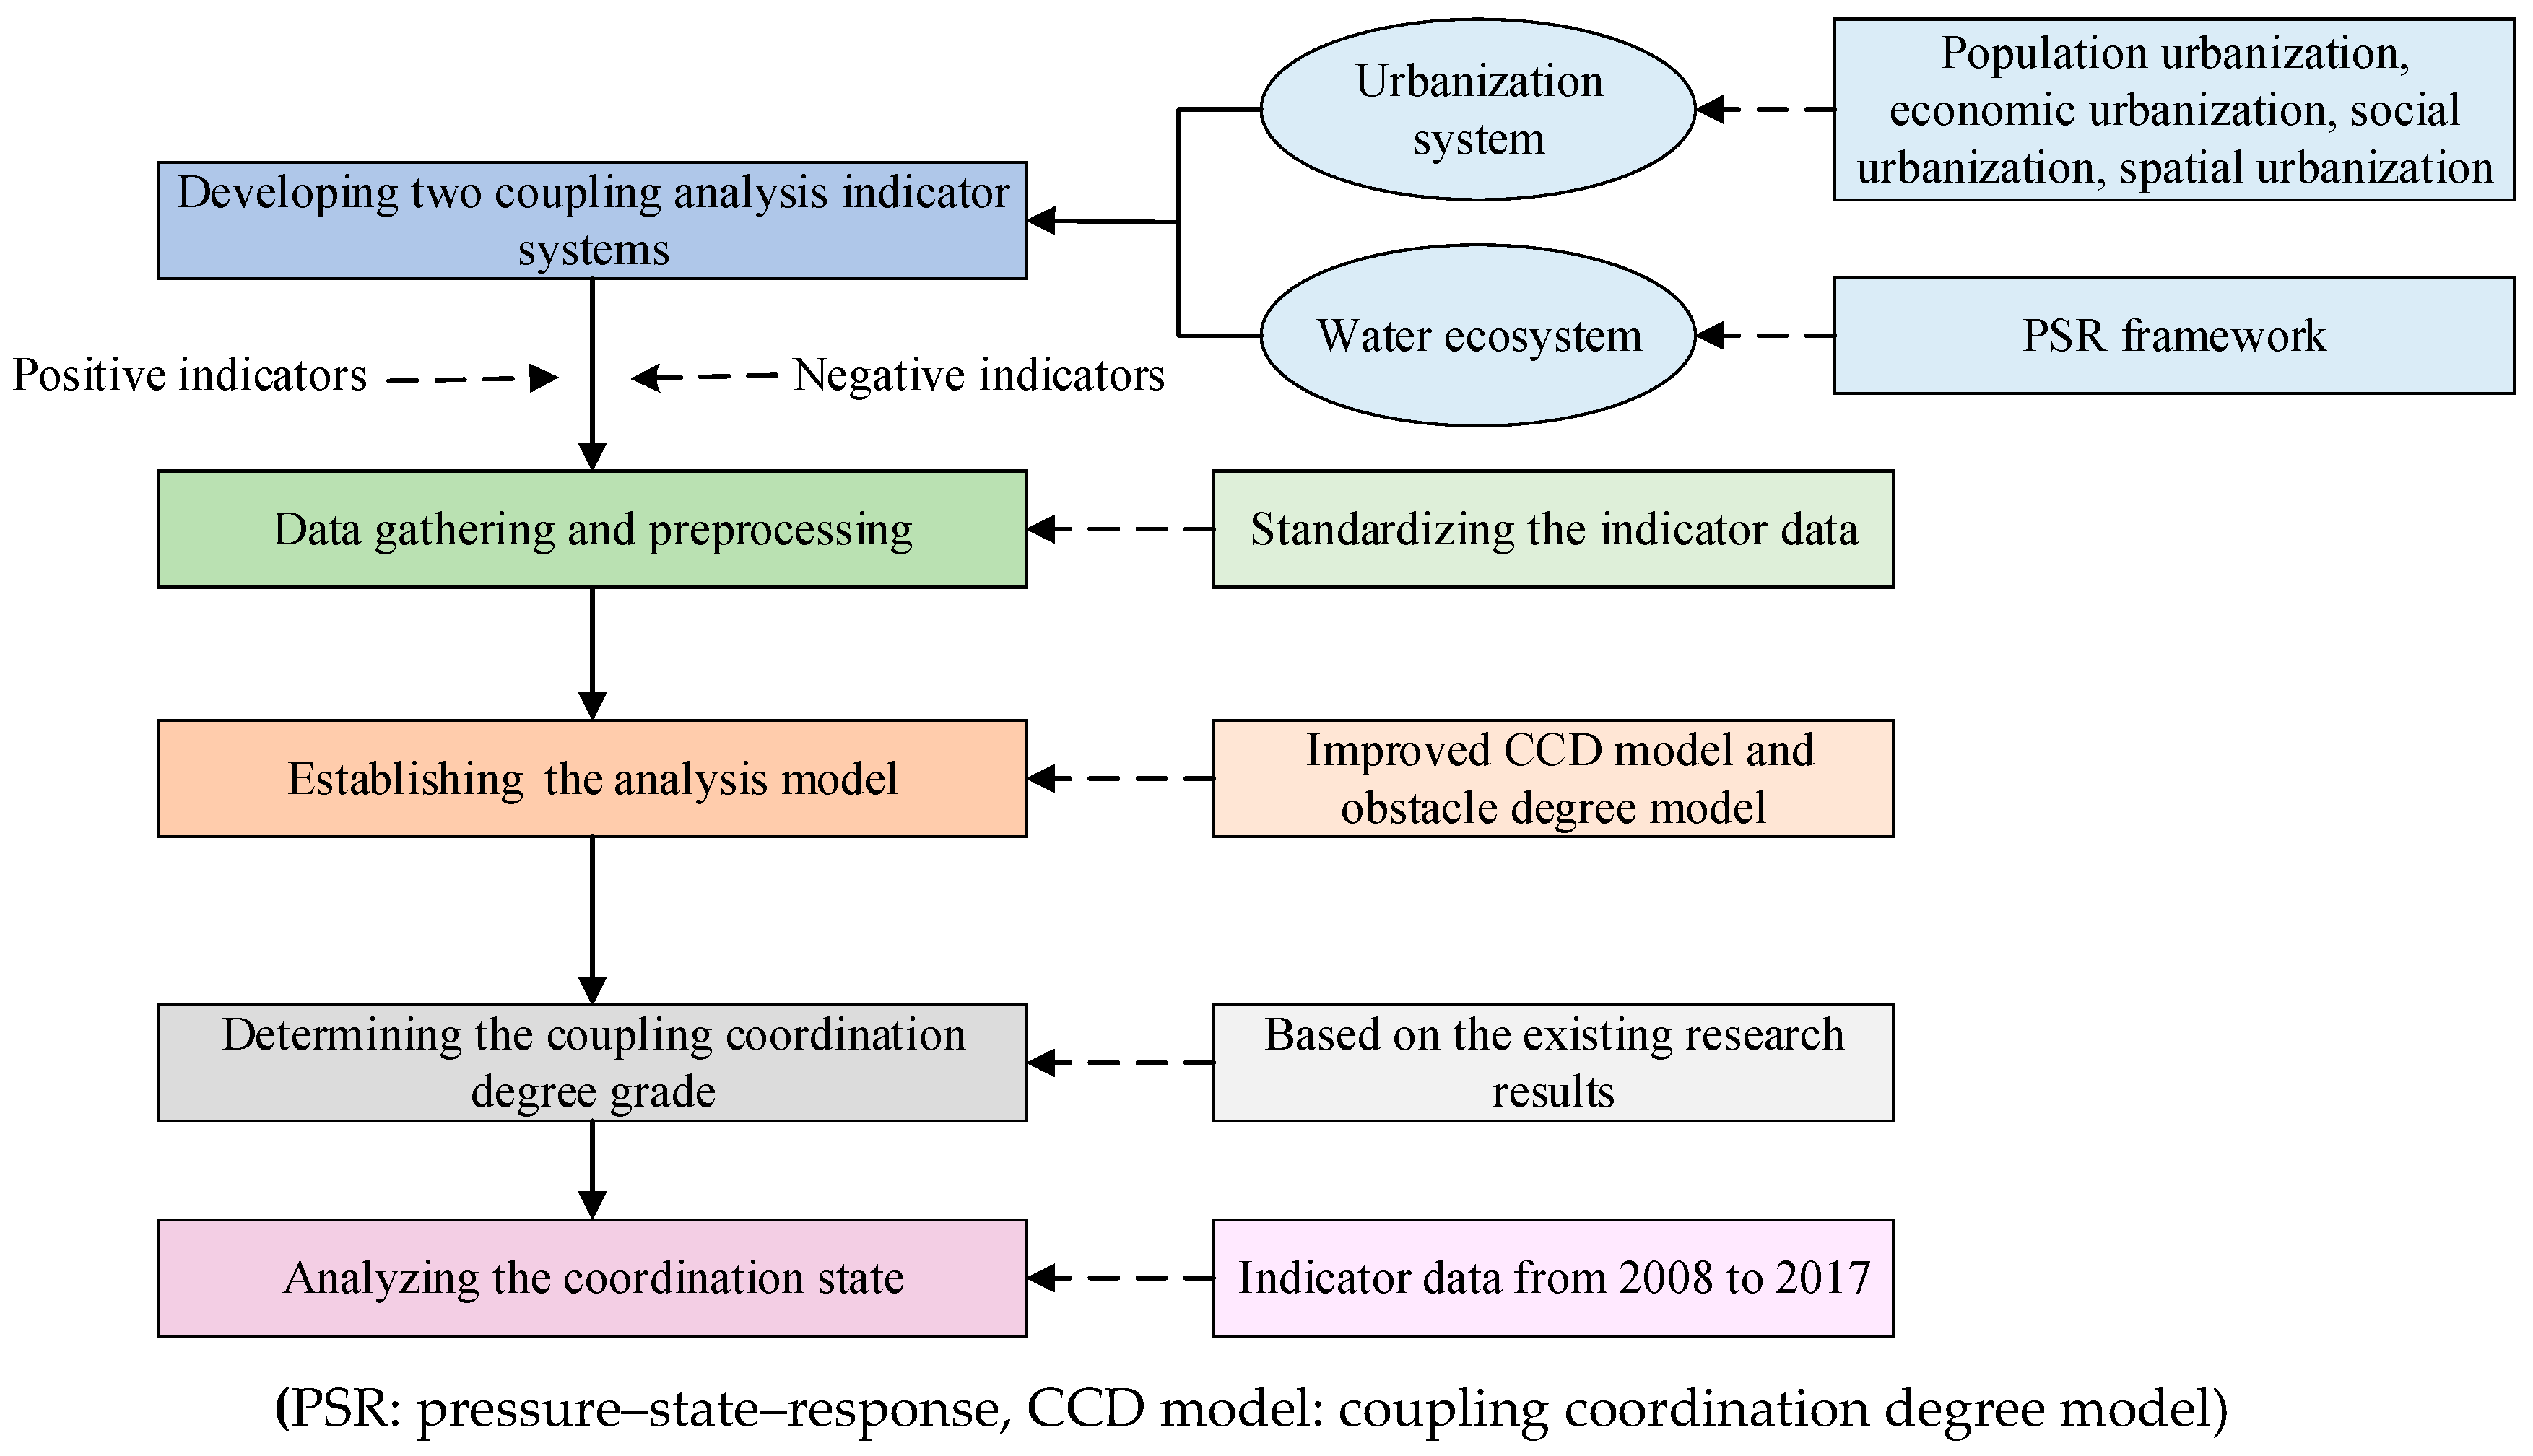
2.2. Methods
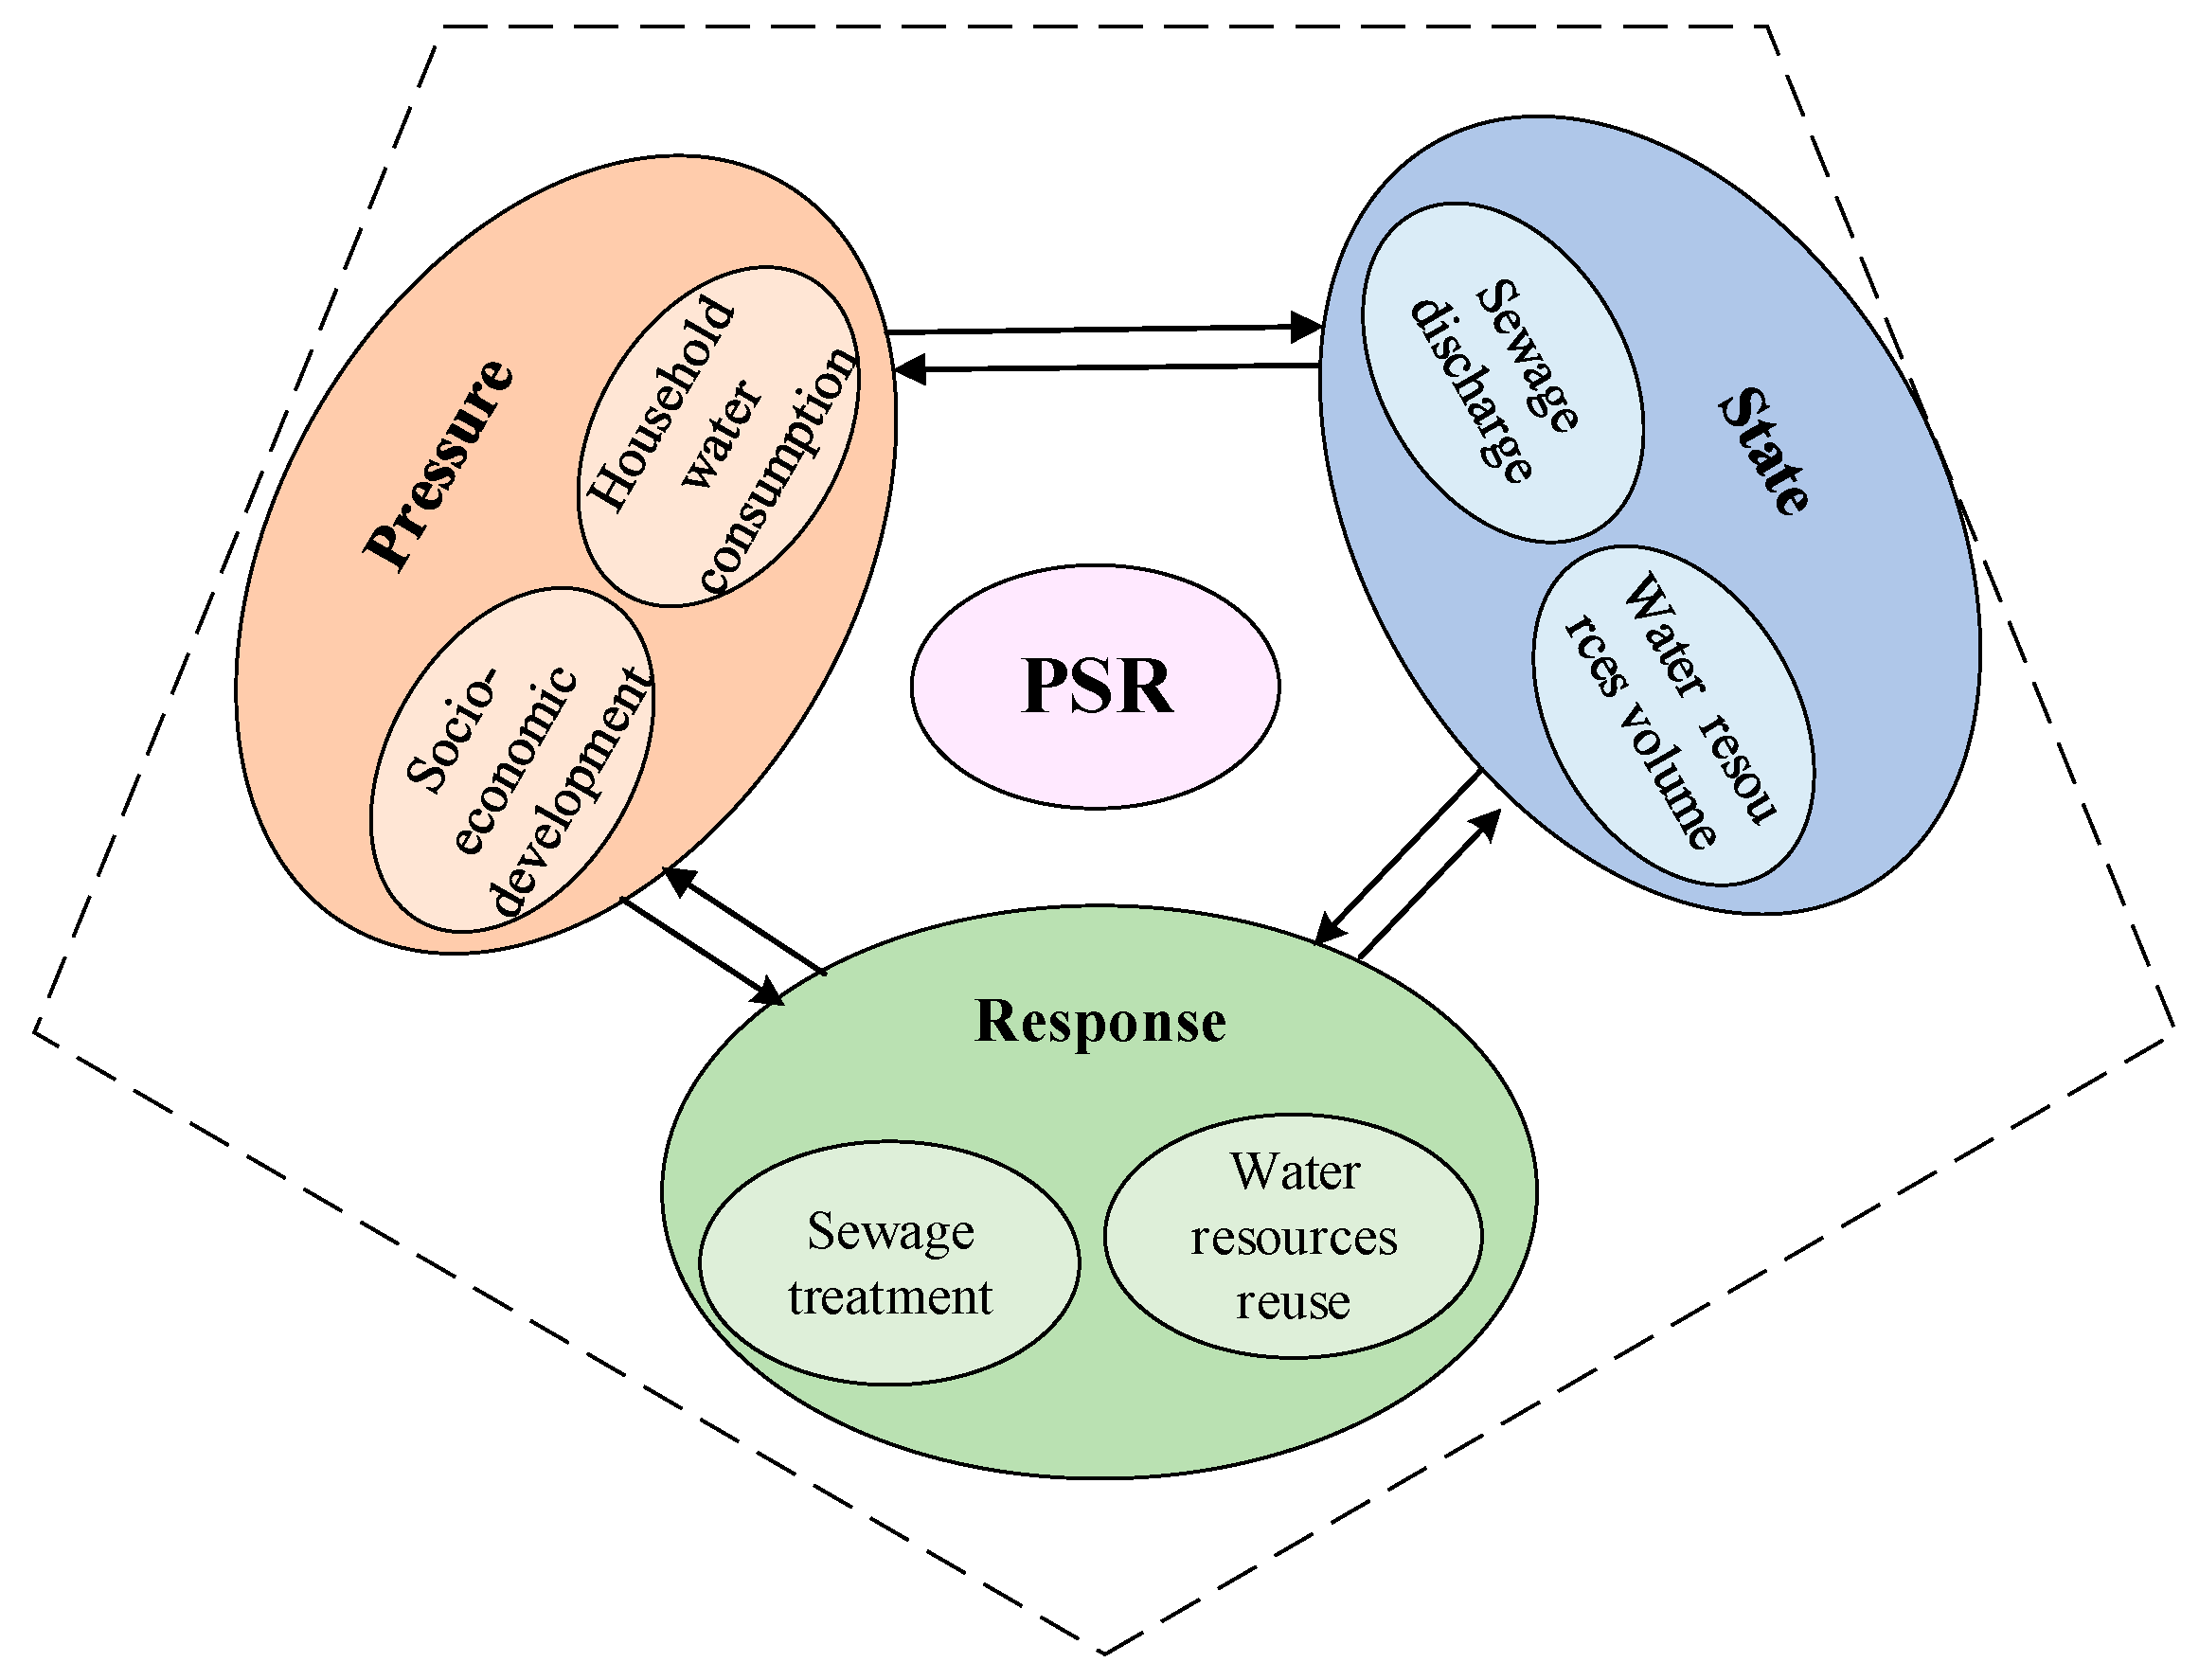
2.2.1. Indicator System Design
2.2.2. Data Sources and Preprocessing
2.2.3. An Improved CCD Model
2.2.4. Obstacle Factor Analysis
3. Results
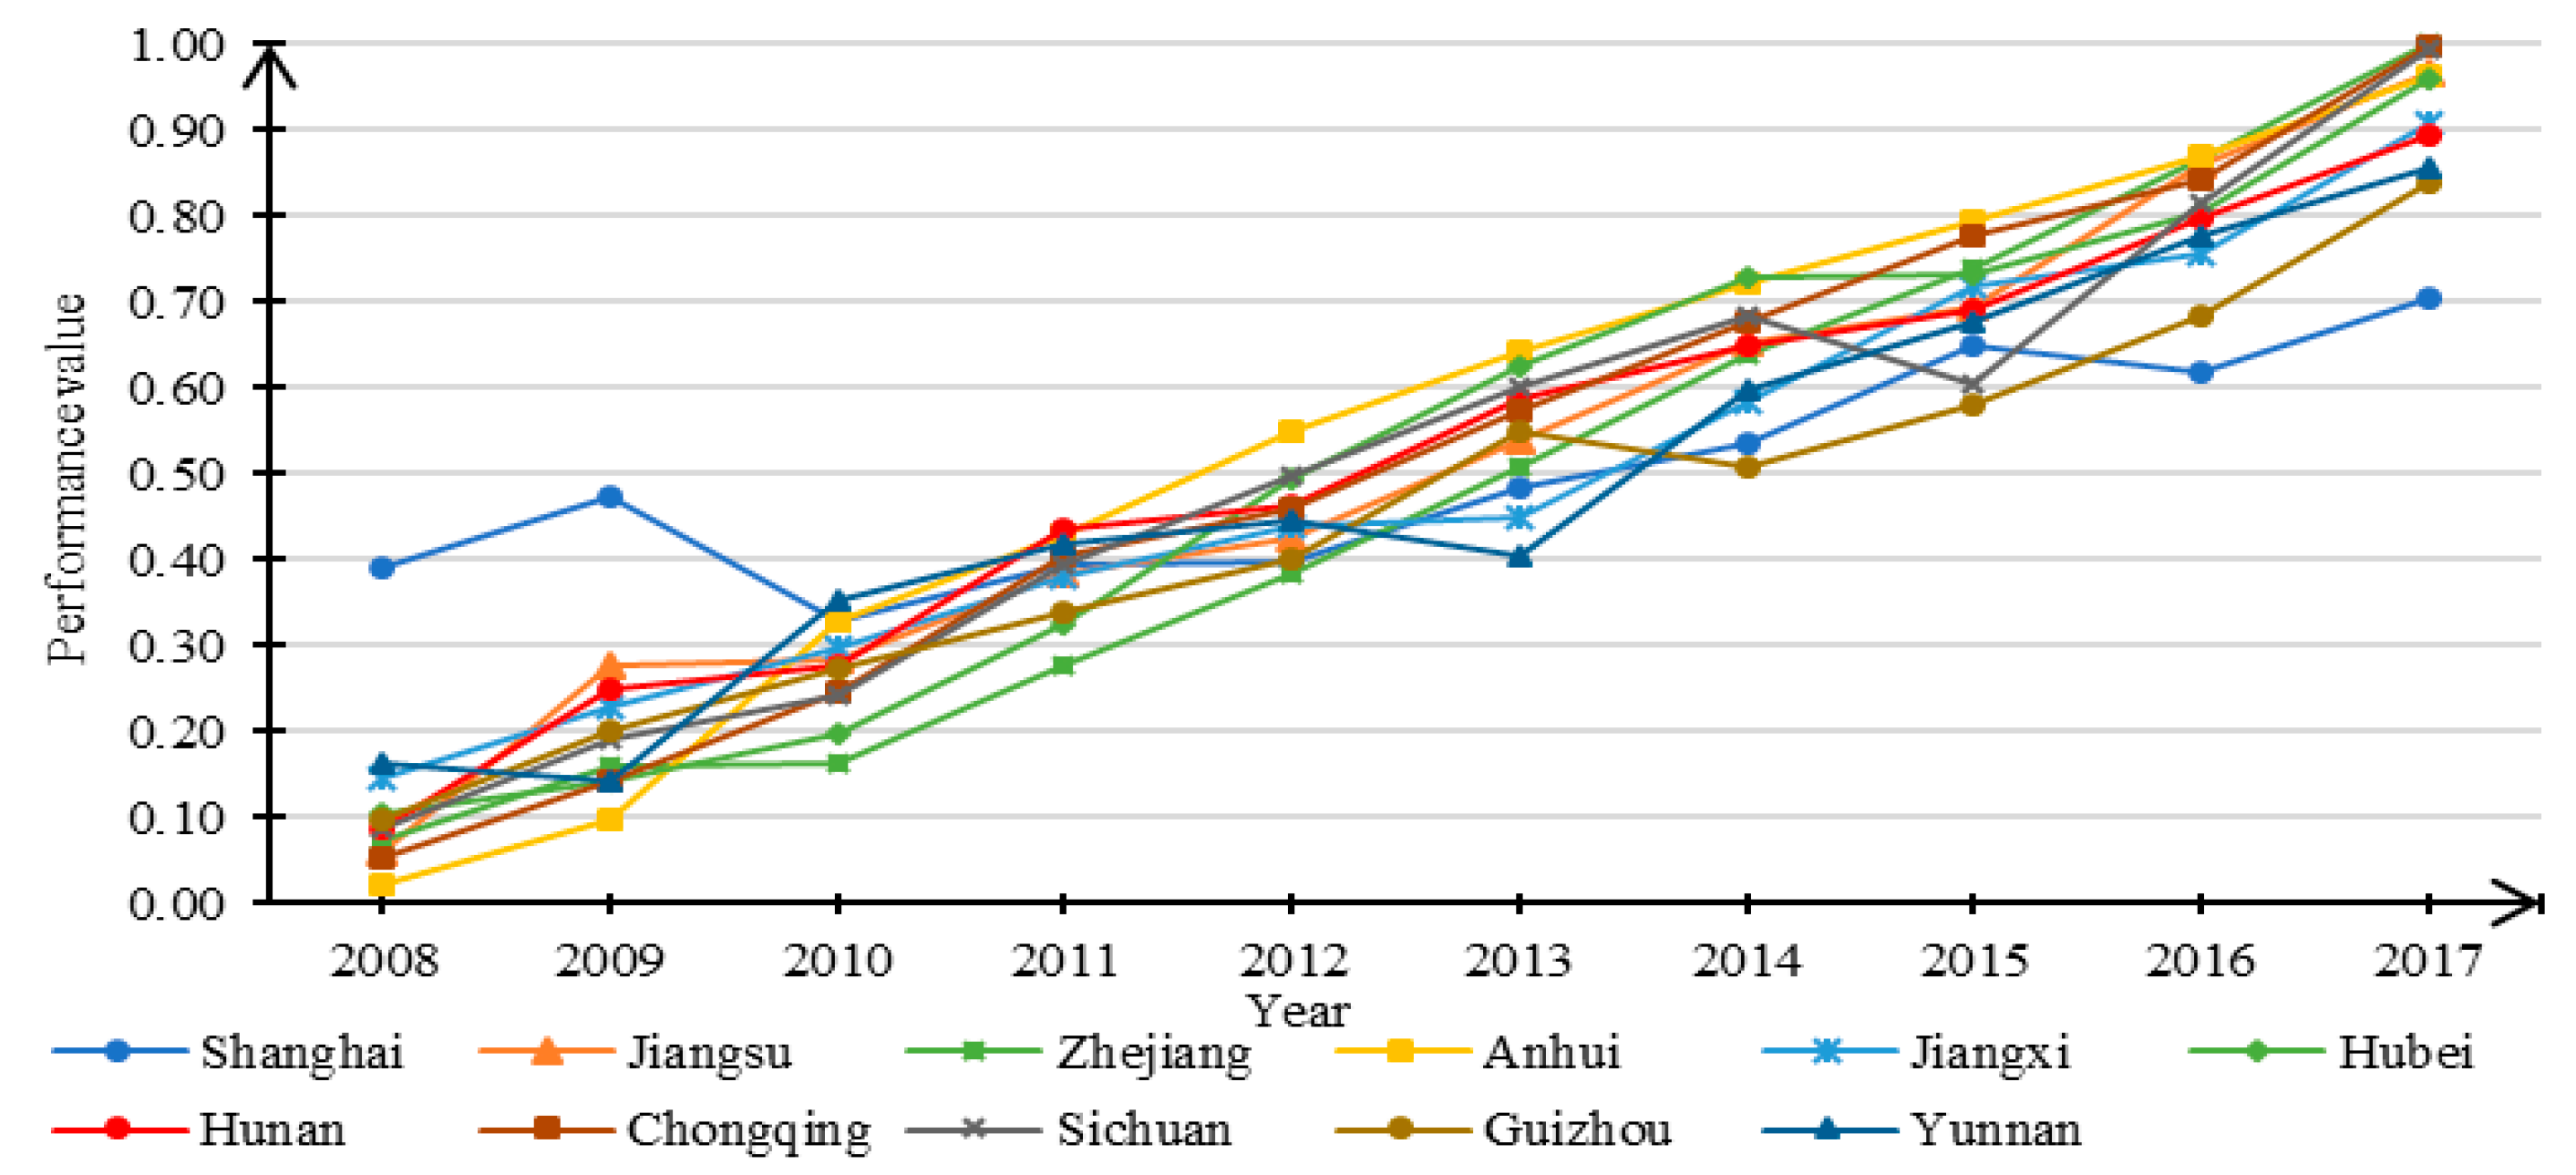
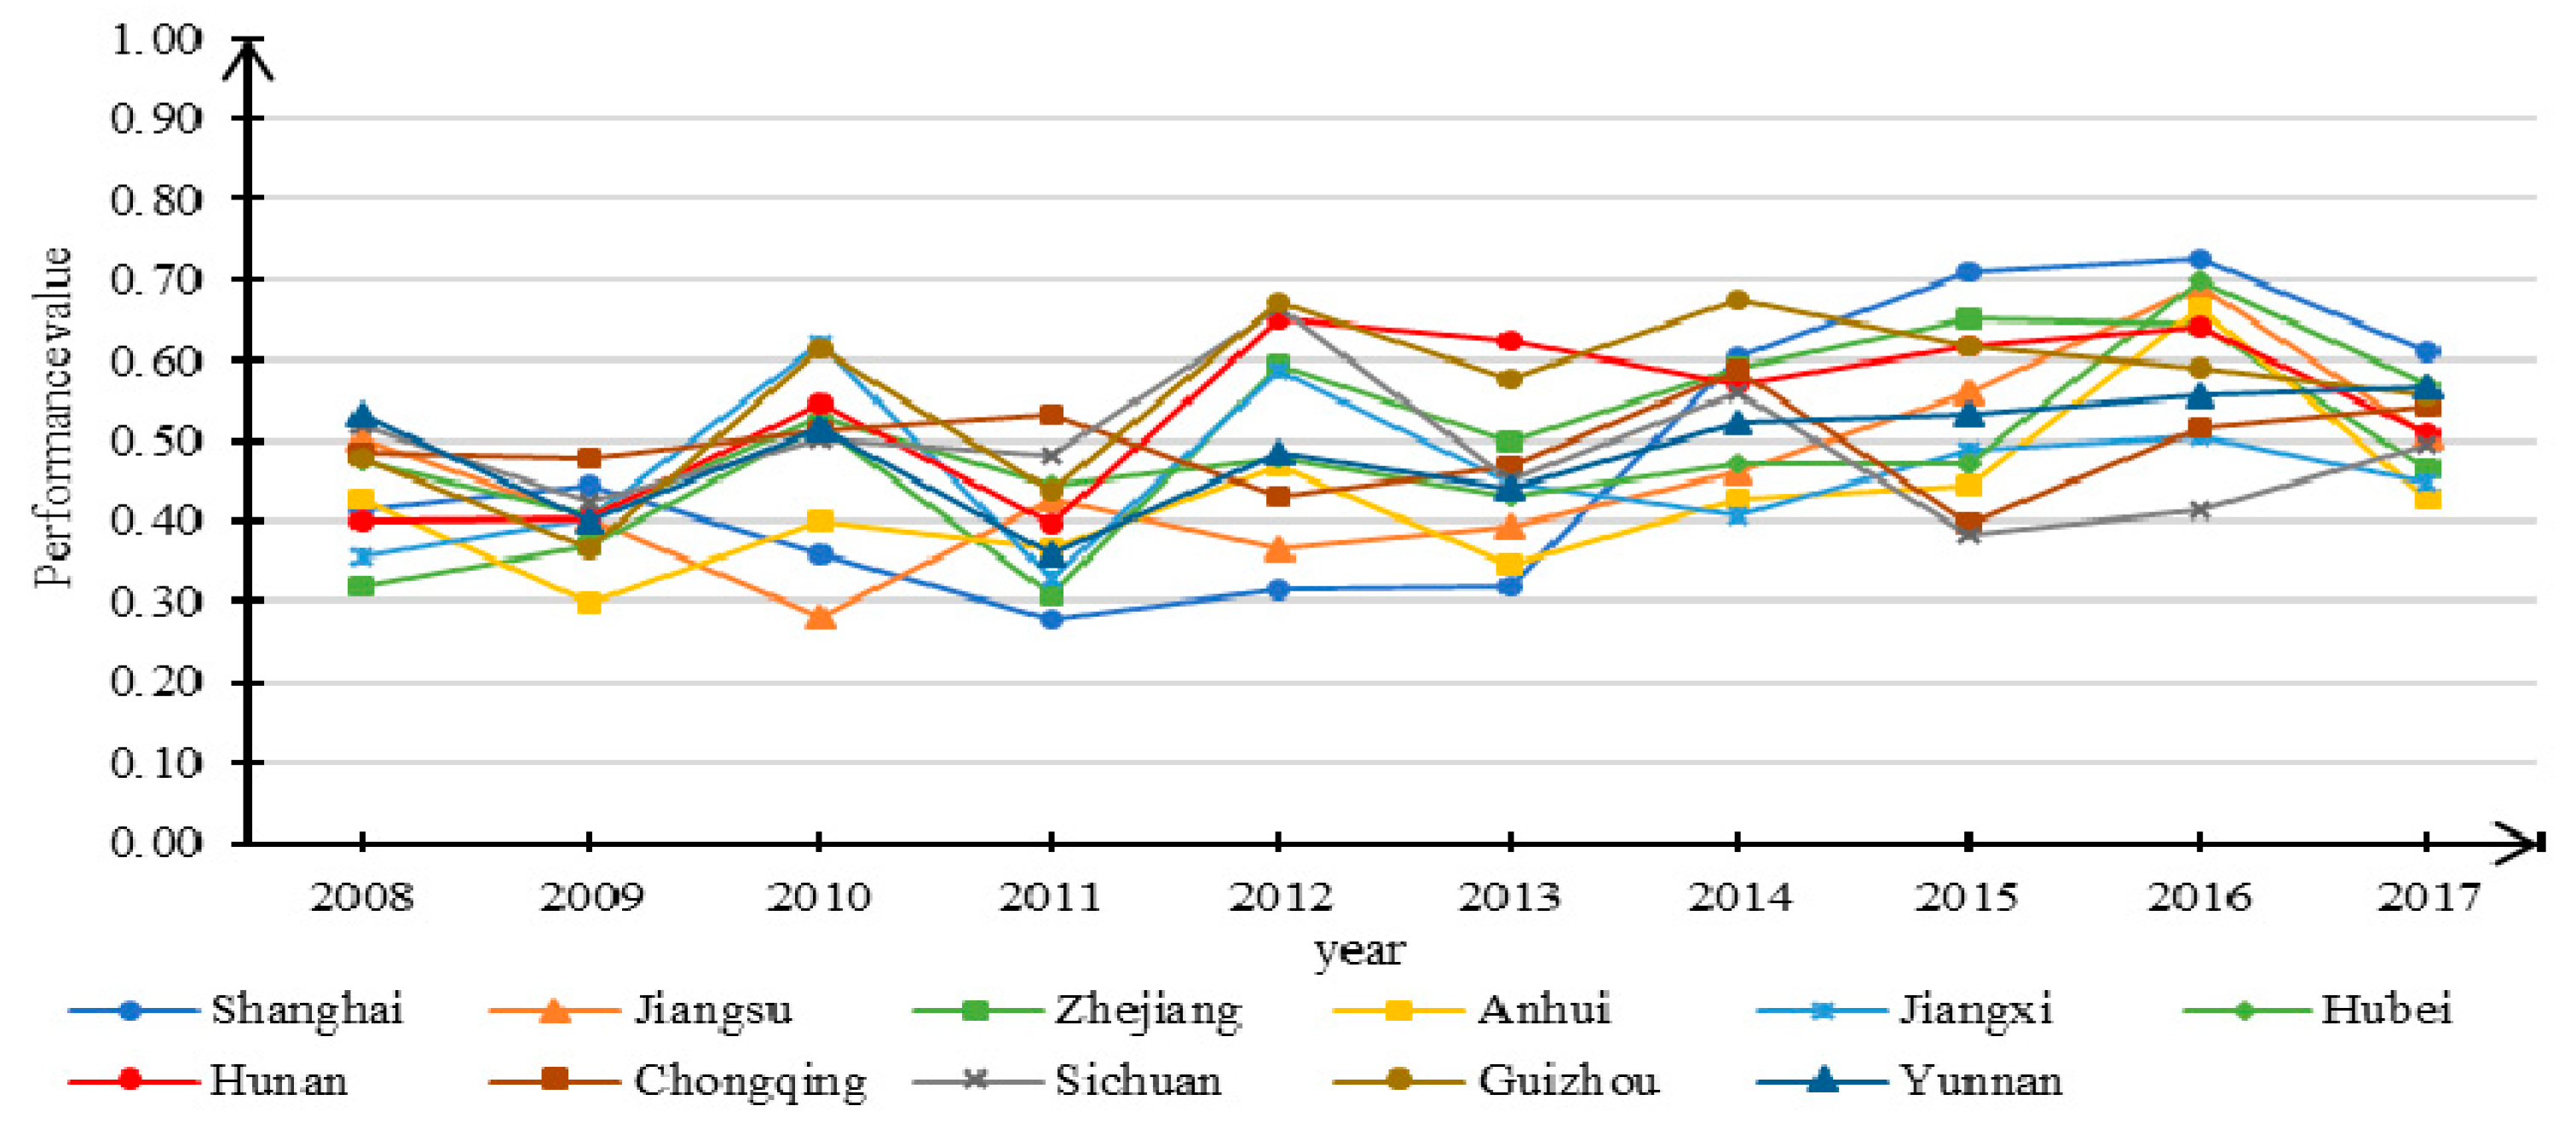
3.1. Performance Level Trend Analysis
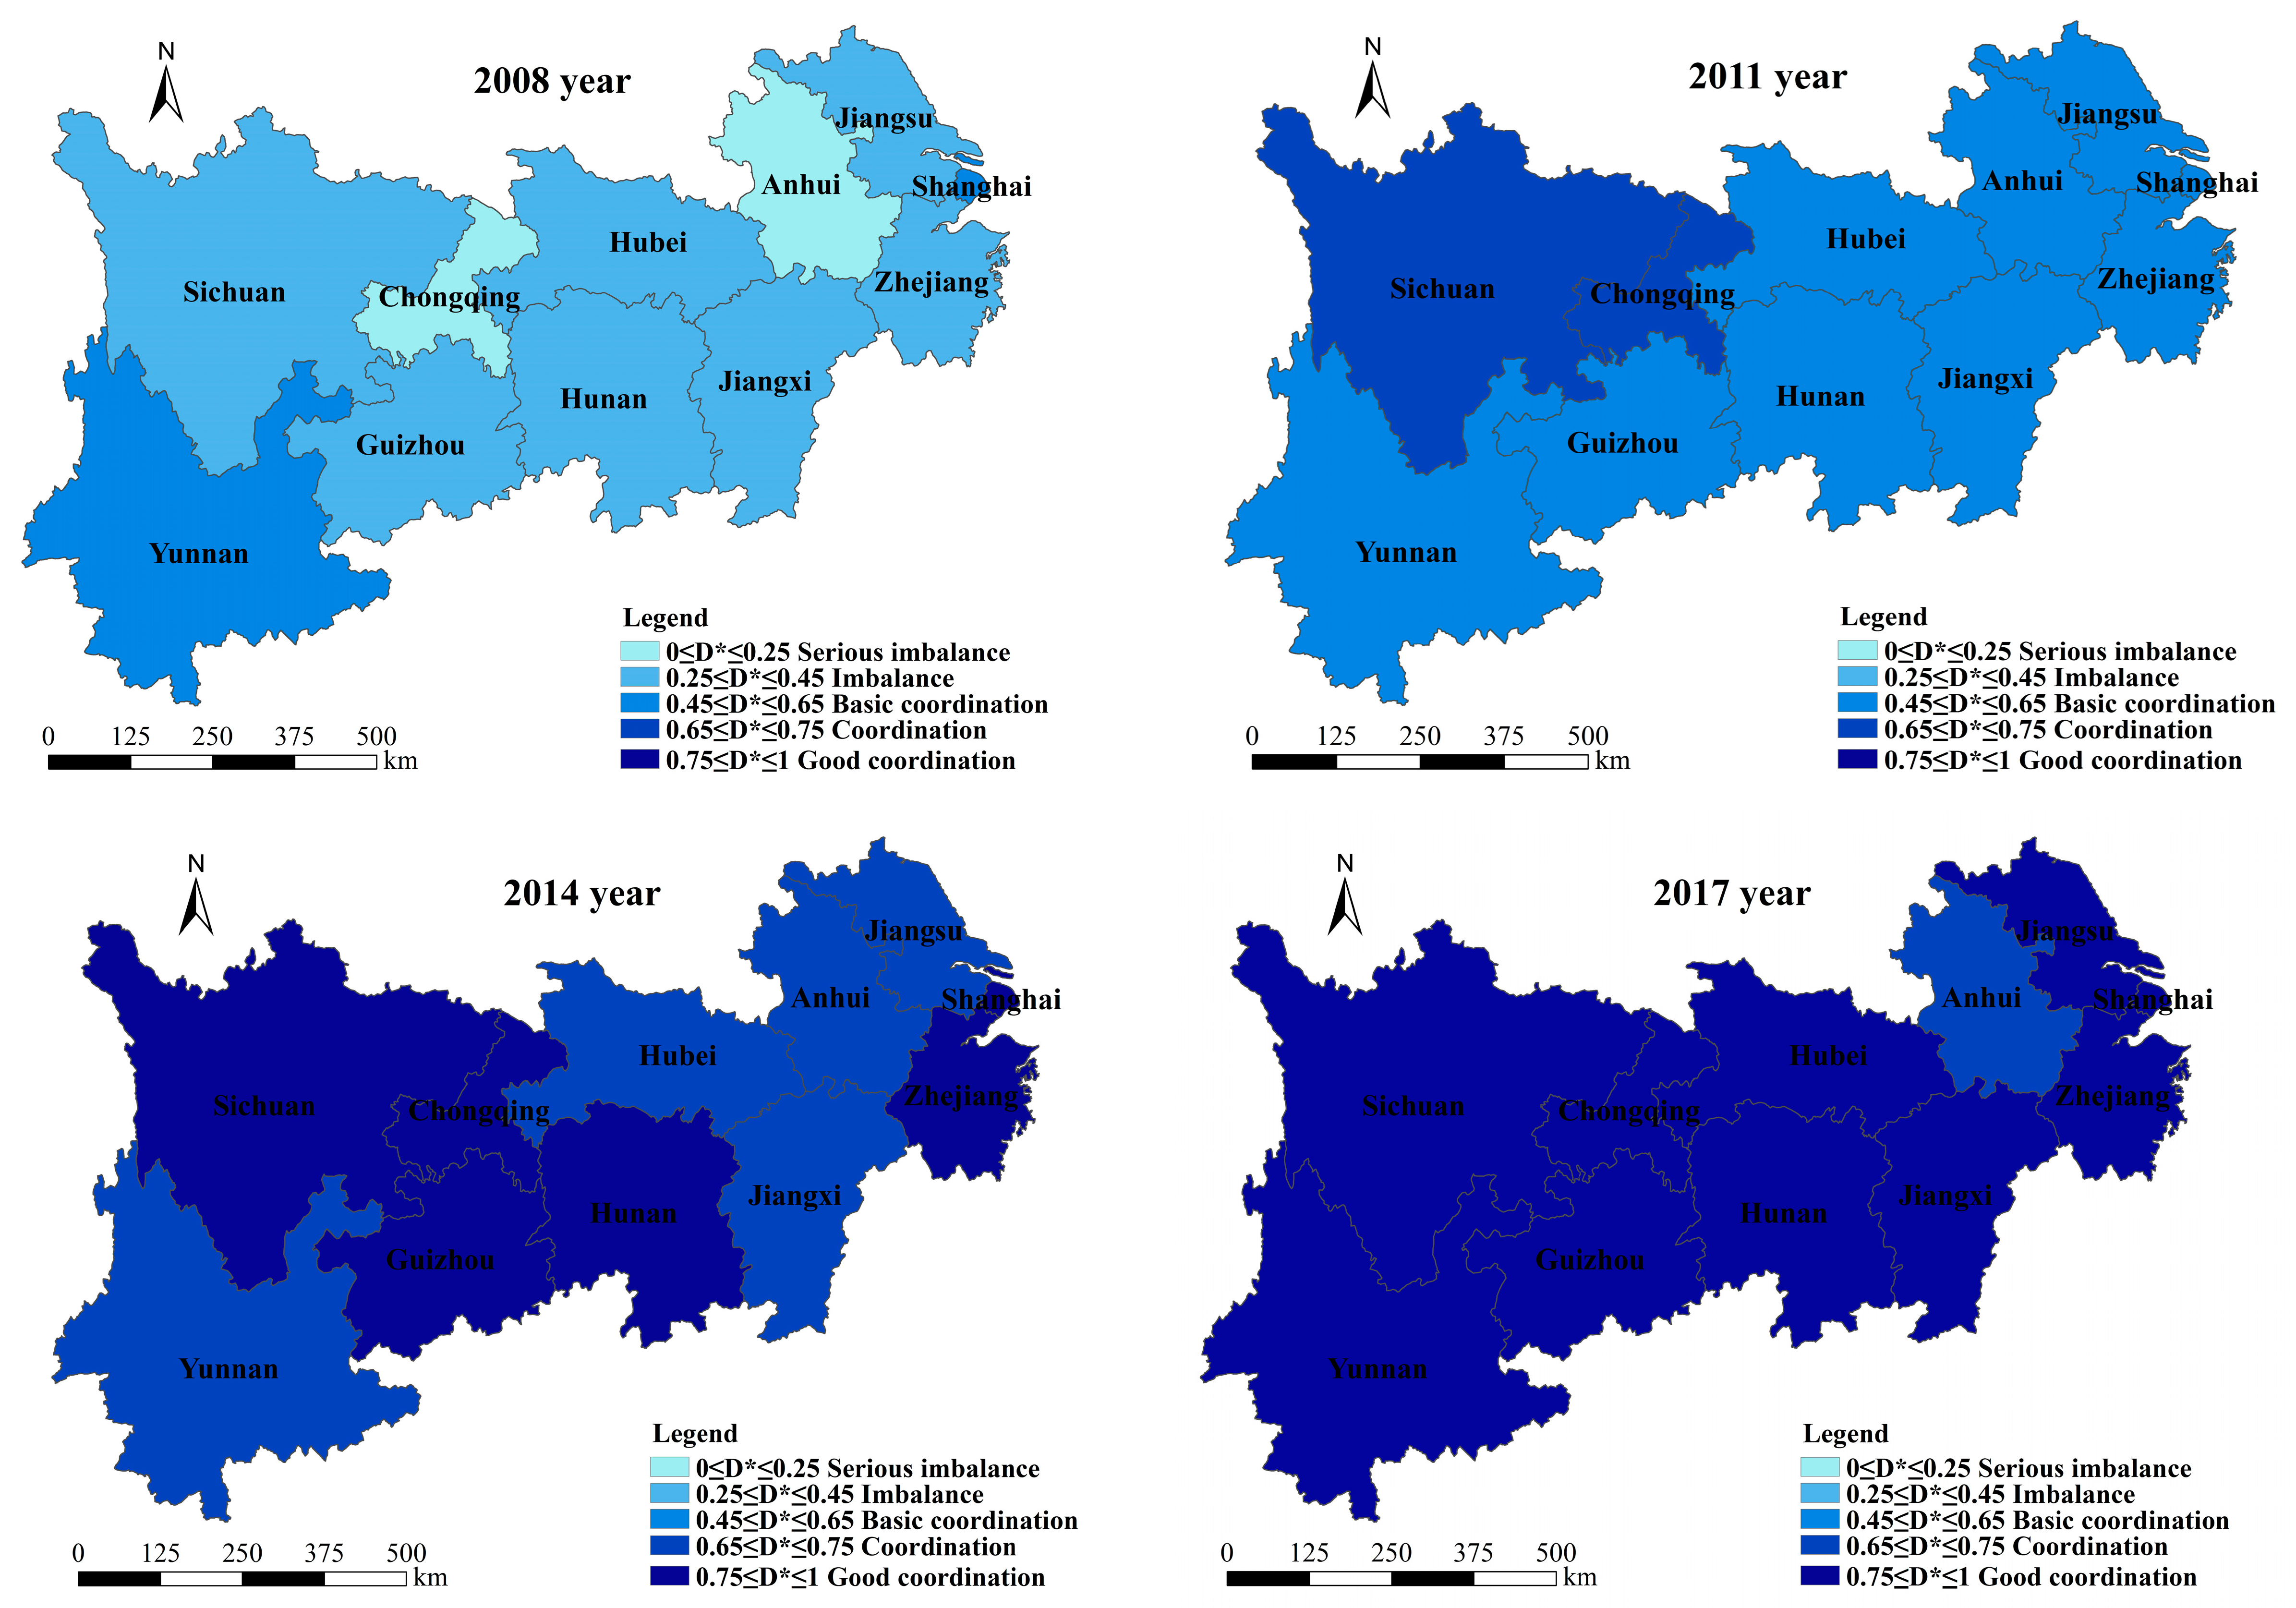
3.2. Spatial Characteristics Analysis
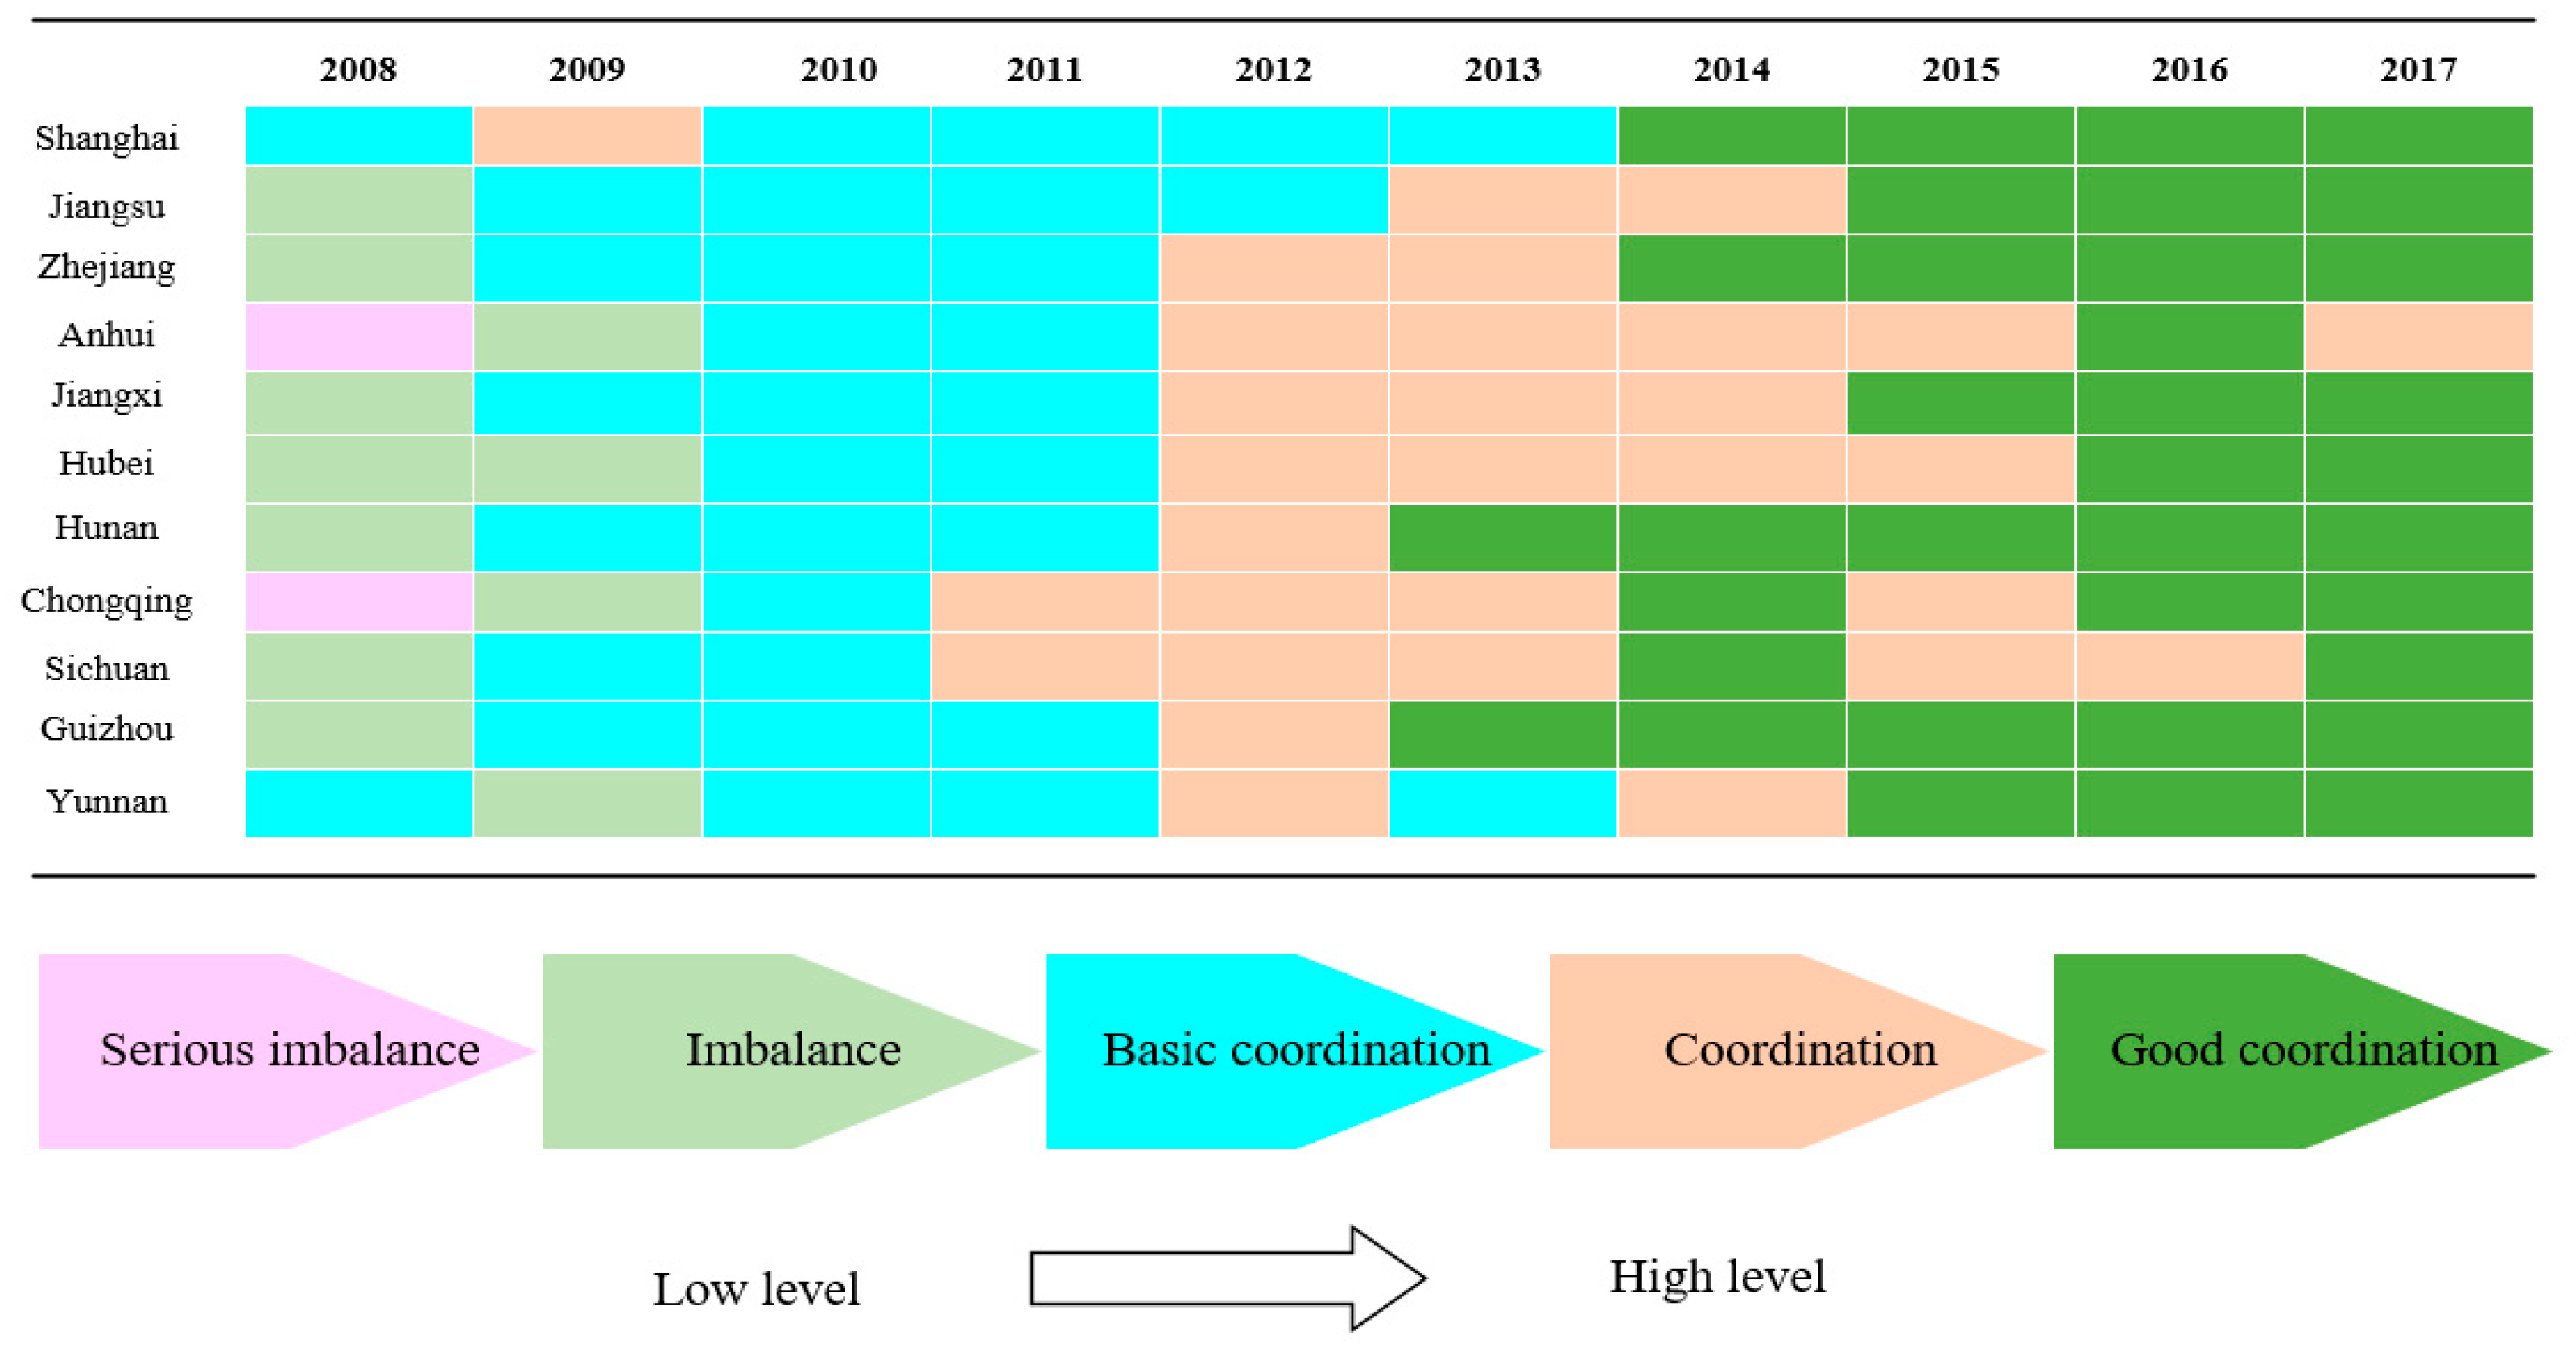
3.3. Temporal Characteristics Analysis
3.4. Obstacle Factors Analysis
4. Discussion
5. Conclusions
Author Contributions
Acknowledgments
Conflicts of Interest
References
- Dong, G.H.; Shen, J.Q.; Jia, Y.Z.; Sun, F.H. Comprehensive Evaluation of Water Resource Security: Case Study from Luoyang City, China. Water 2018, 10, 1106. [Google Scholar] [CrossRef]
- Wang, S.J.; Fang, C.L.; Guan, X.L.; Pang, B.; Ma, H.T. Urbanization, energy consumption, and carbon dioxide emissions in China: A panel data analysis of China’s provinces. Appl. Energy 2014, 136, 738–749. [Google Scholar] [CrossRef]
- Fezzi, C.; Harwood, A.R.; Lovett, A.A.; Bateman, I.J. The environmental impact of climate change adaptation on land use and water quality. Nat. Clim. Chang. 2015, 5, 255–260. [Google Scholar] [CrossRef]
- Bai, X.M.; Shi, P.J.; Liu, Y.S. Realizing China’s urban dream. Nature 2014, 509, 158–160. [Google Scholar] [CrossRef] [PubMed]
- United Nations. Department of Economic and Social Affairs. World Urbanization Prospects: The 2018 Revision; United Nations: New York, NY, USA, 2018. [Google Scholar]
- Zhou, Q. A review of sustainable urban drainage systems considering the climate change and urbanization impacts. Water 2014, 6, 976–992. [Google Scholar] [CrossRef]
- Seto, K.C.; Fragkias, M.; Güneralp, B.; Reilly, M.K. A Meta-Analysis of Global Urban Land Expansion. PLoS ONE 2011, 6, e23777. [Google Scholar] [CrossRef] [PubMed]
- Hubacek, K.; Guan, D.; Barrett, J.; Wiedmann, T. Environmental implications of urbanization and lifestyle change in China: Ecological and Water Footprints. J. Clean Prod. 2009, 17, 1241–1248. [Google Scholar] [CrossRef]
- Kavitha, B.D.; Smt, N.K. Gayathri, Urbanization in India. Int. J. Sci. Res. Educ. 2017, 5, 6166–6168. [Google Scholar]
- Rimal, B.; Zhang, L.F.; Stork, N.; Sloan, S.; Rijal, S. Urban expansion occurred at the expense of agricultural lands in the Tarai region of Nepal from 1989 to 2016. Sustainability 2018, 10, 1341. [Google Scholar] [CrossRef]
- Li, Y.; Li, Y.; Zhou, Y.; Shi, T.L.; Zhu, X.D. Investigation of a coupling model of coordination between urbanization and the environment. J. Environ. Manag. 2012, 98, 127–133. [Google Scholar] [CrossRef] [PubMed]
- Wei, Y.L.; Bao, L.J.; Wu, C.C.; He, Z.C.; Zeng, E.Y. Assessing the effects of urbanization on the environment with soil legacy and current-use insecticides: A case study in the Pearl River Delta, China. Sci. Total Environ. 2015, 514, 409–417. [Google Scholar] [CrossRef] [PubMed]
- Tsujimoto, M.; Kajikawa, Y.; Tomita, J. A review of the ecosystem concept-Towards coherent ecosystem design. Technol. Soc. 2018, 136, 49–58. [Google Scholar] [CrossRef]
- Han, H.; Li, H.M.; Zhang, K.Z. Urban Water Ecosystem Health Evaluation Based on the Improved Fuzzy Matter-Element Extension Assessment Model: Case Study from Zhengzhou City, China. Math. Probl. Eng. 2019, 2019, 7502342. [Google Scholar] [CrossRef]
- Ma, K.M.; Kong, H.M.; Guan, W.B.; Fu, B.J. Ecosystem health assessment: Methods and directions. Acta Ecol. Sin. 2011, 21, 2106–2116. [Google Scholar]
- Wang, Y.M.; Zhou, X.D.; Bernard, E. Water environment carrying capacity in Bosten Lake basin. J. Clean Prod. 2018, 199, 574–583. [Google Scholar] [CrossRef]
- Liu, N.N.; Liu, C.Z.; Xia, Y.F.; Da, B.W. Examining the coordination between urbanization and eco-environment using coupling and spatial analyses: A case study in China. Ecol. Indic. 2018, 93, 1163–1175. [Google Scholar] [CrossRef]
- Ding, L.; Zhao, W.T.; Huang, Y.L.; Cheng, S.G.; Liu, C. Research on the coupling coordination relationship between urbanization and the air environment: A case study of the area of Wuhan. Atmosphere 2015, 6, 1539–1558. [Google Scholar] [CrossRef]
- Liu, Y.; Yao, C.; Wang, G.; Bao, S.M. An integrated sustainable development approach to modeling the eco-environmental effects from urbanization. Ecol. Indic. 2011, 11, 1599–1608. [Google Scholar] [CrossRef]
- Wang, S.; Fang, C.; Wang, Y.; Huang, Y.; Ma, H. Quantifying the relationship between urban development intensity and carbon dioxide emissions using a panel data analysis. Ecol. Indic. 2015, 49, 121–131. [Google Scholar] [CrossRef]
- Martínez-Zarzoso, I. The impact of urbanization on CO2 emissions: Evidence from developing countries. Ecol. Econ. 2011, 70, 1344–1353. [Google Scholar] [CrossRef]
- Balado-Naves, R.; Baños-Pino, J.F.; Mayor, M. Do countries influence neighbouring pollution? A spatial analysis of the EKC for CO2 emissions. Energy Policy 2018, 123, 266–279. [Google Scholar] [CrossRef]
- Iwata, H.; Okada, K.; Samreth, S. Empirical study on the environmental Kuznets curve for CO2 in France: The role of nuclear energy. Energy Policy 2010, 38, 4057–4063. [Google Scholar] [CrossRef]
- Al-Mulali, U.; Weng-Wai, C.; Sheau-Ting, L.; Mohammed, A.H. Investigating the environmental Kuznets curve (EKC) hypothesis by utilizing the ecological footprint as an indicator of environmental degradation. Ecol. Indic. 2015, 48, 315–323. [Google Scholar] [CrossRef]
- Liddle, B. What are the carbon emissions elasticities for income and population? Bridging STIRPAT and EKC via robust heterogeneous panel estimates. Glob. Environ. Chang. 2015, 31, 62–73. [Google Scholar] [CrossRef]
- Dogan, E.; Turkekul, B. CO2emissions, real output, energy consumption, trade, urbanization and financial development: Testing the EKC hypothesis for the USA. Environ. Sci. Pollut. Res. 2016, 23, 1203–1213. [Google Scholar] [CrossRef] [PubMed]
- Ozturk, I.; Al-Mulali, U. Investigating the validity of the environmental Kuznets curve hypothesis in Cambodia. Ecol. Indic. 2015, 57, 324–330. [Google Scholar] [CrossRef]
- Marra, A.; Antonelli, P.; Pozzi, C. Emerging green-tech specializations and clusters—A network analysis on technological innovation at the metropolitan level. Renew. Sust. Energ. Rev. 2017, 67, 1037–1046. [Google Scholar] [CrossRef]
- Wang, S.J.; Fang, C.L.; Wang, Y. Quantitative investigation of the interactive coupling relationship between urbanization and eco-environment. Acta Ecol. Sin. 2015, 35, 2244–2254. (In Chinese) [Google Scholar]
- Guo, Y.; Wang, H.; Nijkamp, P.; Xu, J. Space-time changes in interdependent urban-environmental systems: A policy study on the Huai River Basin in China. Habitat Int. 2015, 45, 135–146. [Google Scholar] [CrossRef]
- Wang, S.J.; Ma, H.; Zhao, Y.B. Exploring the relationship between urbanization and the eco-environment—A case study of Beijing–Tianjin–Hebei region. Ecol. Indic. 2014, 45, 171–183. [Google Scholar] [CrossRef]
- He, J.; Wang, S.; Liu, Y.; Ma, H.; Liu, Q. Examining the relationship between urbanization and the eco-environment using a coupling analysis: Case study of Shanghai, China. Ecol. Indic. 2017, 77, 185–193. [Google Scholar] [CrossRef]
- Cui, X.G.; Fang, C.L.; Liu, H.M.; Liu, X.F. Assessing sustainability of urbanization by a coordinated development index for an Urbanization-Resources-Environment complex system: A case study of Jing-Jin-Ji region, China. Ecol. Indic. 2019, 96, 383–391. [Google Scholar] [CrossRef]
- Lyu, R.F.; Mi, L.; Zhang, J.M.; Xu, M.Q.; Li, J.J. Coupling and metabolic analysis of urbanization and environment between two resource-based cities in North China. Ecol. Res. 2007, 34, 380–392. [Google Scholar] [CrossRef]
- Song, Q.J.; Zhou, N.; Liu, T.L.; Siehr, S.A.; Qi, Y. Investigation of a “coupling model” of coordination between low-carbon development and urbanization in China. Energ. Policy 2018, 212, 346–354. [Google Scholar] [CrossRef]
- Wang, S.J.; Li, Q.Y.; Fang, C.L.; Zhou, C.S. The relationship between economic growth energy consumption, and CO2 emissions: Empirical evidence from China. Sci. Total Environ. 2016, 542, 360–371. [Google Scholar] [CrossRef]
- Hui, E.C.M.; Wu, Y.; Deng, L.; Zheng, B. Analysis on coupling relationship of urban scale and intensive use of land in China. Cities 2015, 42, 63–69. [Google Scholar] [CrossRef]
- Wang, Z.P.; Shi, C.L.; Li, Q.; Wang, G. Coupling Trending Analysis about Urbanization and Urban Resource in Beijing. Energy Procedia 2011, 5, 1589–1596. [Google Scholar]
- Liu, W.J.; Jiao, F.C.; Ren, L.J.; Xu, X.G. Coupling coordination relationship between urbanization and atmospheric environment security in Jinan City. J. Clean Prod. 2018, 204, 1–11. [Google Scholar] [CrossRef]
- Wang, L.; Wang, Y.; Zhang, Y. Coupling coordination degree of urban land use benefit and urbanization: A case of 27 Cites in the Bohai Rim region. Ecol. Econ. 2017, 33, 25–28. [Google Scholar]
- Geng, X.; Huang, M.H.; Feng, Y.Q.; Chen, D.H. Coupling analysis between economic development and eco-environment for a comprehensive industrial park. Environ. Sci. Technol. 2011, 34, 196–200. [Google Scholar]
- Brereton, M. Synergetics: An Introduction—Nonequilibrium Phase Transitions and Self–Organisation in Physics, Chemistry and Biology. Phys. Bull. 1978, 29, 181. [Google Scholar] [CrossRef]
- Yan, X.; Cheng, C.C.; Jia, Y.Z. Effect decomposition of industry, space and population on energy consumption during Chinese urbanization. Resour. Sci. 2018, 40, 216–225. [Google Scholar]
- National Bureau of Statistics of China. China Statistics Yearbook (2018); China Statistica Press: Beijing, China, 2018. [Google Scholar]
- Xu, W.; Dong, Z.C.; Hao, Z.C.; Li, D.Y.; Ren, L. River Health Evaluation Based on the Fuzzy Matter-Element Extension Assessment Model. Pol. J. Environ. Stud. 2017, 26, 1353–1361. [Google Scholar] [CrossRef]
- Liu, Y.B.; Li, R.D.; Zhang, S.Z. Study on the coordinative criteria and coordination degree model between regional urbanization and eco-environment. China Soft Sci. 2005, 5, 140–148. [Google Scholar]
- Bao, C.; Fang, C.L. Water resources constraint force on urbanization in water deficient regions: A case study of the Hexi Corridor, arid area of NW China. Ecol. Econ. 2007, 62, 508–517. [Google Scholar] [CrossRef]
- Neri, A.C.; Dupin, P.; Sánchez, L.E. A Pressure-State-Response Approach to Cumulative Impact Assessment. J. Clean Prod. 2016, 126, 288–298. [Google Scholar] [CrossRef]
- Wang, Q.; Li, S.Q.; Li, R.R. Evaluating water resource sustainability in Beijing, China: Combining PSR model and matter-element extension method. J. Clean Prod. 2018, 206, 171–179. [Google Scholar] [CrossRef]
- Wolfslehner, B.; Vacik, H. Evaluating sustainable forest management strategies with the Analytic Network Process in a Pressure-State-Response framework. J. Environ. Manag. 2008, 88, 1–10. [Google Scholar] [CrossRef]
- National Bureau of Statistics of China. China Statistics Yearbook (2008–2017); China Statistical Press: Beijing, China, 2017. [Google Scholar]
- National Bureau of Statistics of China. China Urban Statistical Yearbook (2008–2017); China Statistical Press: Beijing, China, 2017. [Google Scholar]
- Ministry of Education of China. China Education Statistics Yearbook (2008–2017); China Statistical Press: Beijing, China, 2017. [Google Scholar]
- National Bureau of Statistics of China. China Water Resources Bulletin (2008–2017); China Water & Power Press: Beijing, China, 2017. [Google Scholar]
- Zhang, K.Z.; Shen, J.Q.; Han, H.; Jia, Y.Z. Urban River Health Analysis of the Jialu River in Zhengzhou City Using the Improved Fuzzy Matter-Element Extension Model. Water 2019, 11, 1190. [Google Scholar] [CrossRef]
- Zhao, Y.B.; Wang, S.J. The relationship between urbanization, economic growth and energy consumption in China: An econometric perspective analysis. Sustainability 2015, 7, 5609–5627. [Google Scholar] [CrossRef]
- Ai, J.; Feng, L.; Dong, X.; Zhu, X.; Li, Y. Exploring coupling coordination between urbanization and ecosystem quality (1985-2010): A case study from Lianyungang City, China. Front. Earth Sci. 2016, 10, 527–545. [Google Scholar] [CrossRef]
- Zhang, Y.J.; Jun, M.A. Research on coordination development of ecological-environment and economy in North Jiangsu based on coupling degree model. Environ. Sci. Technol. 2016, 29, 11–15. [Google Scholar]
- Jackson, J.E. Measuring the Demand for Environmental Quality with Survey Data. J. Polit. 1983, 45, 335–350. [Google Scholar] [CrossRef]
- Shen, L.Y.; Huang, H.; Huang, Z.H. Improved coupling analysis on the coordination between socio-economy and carbon emission. Ecol. Indic. 2018, 94, 357–366. [Google Scholar] [CrossRef]
- Xie, T.; Wang, M.; Su, C.; Chen, W. Evaluation of the natural attenuation capacity of urban residential soils with ecosystem-service performance index (EPX) and entropy-weight methods. Environ. Pollut. 2018, 238, 222–229. [Google Scholar] [CrossRef]
- Zou, Z.H.; Yun, Y.; Sun, J.N. Entropy method for determination of weight of evaluating indicators in fuzzy synthetic evaluation for water quality assessment. J. Environ. Sci. 2006, 18, 1020–1023. [Google Scholar] [CrossRef]
- Zhao, Y.; Wang, S.; Zhou, C. Understanding the relation between urbanization and the eco-environment in China\"s Yangtze River Delta using an improved EKC model and coupling analysis. Sci. Total Environ. 2016, 571, 862–875. [Google Scholar] [CrossRef]
- Lei, X.P.; Qiu, R.; Liu, Y. Evaluation of regional land use performance based on entropy TOPSIS model and diagnosis of its obstacle factors. Trans. Chin. Soc. Agric. Eng. 2016, 32, 243–253. [Google Scholar]


| Subsystem | Indicators | Unit | Nature |
|---|---|---|---|
| Population urbanization | U1 Population urbanization rate | % | + |
| U2 Population growth rate | % | + | |
| Economic urbanization | U3 GDP per capita | Yuan | + |
| U4 Per capita disposable income | Yuan | + | |
| U5 Percentage of GDP of tertiary industry | % | + | |
| U6 Per capita investment in fixed assets | 104Yuan | + | |
| Social urbanization | U7 Dwelling area per capita | m2/person | + |
| U8 Per capita education funds | 104Yuan | + | |
| U9 Number of college students | - | + | |
| U10 Number of public transportation vehicles | - | + | |
| Spatial urbanization | U11 Urban population density | Persons/km2 | − |
| U12 Urban road area per capita | km2/person | + | |
| U13 Percentage of built-up areas in total land area | % | + | |
| U14 Built-up area per capita | km2/person | + |
| Subsystem | Indicators | Unit | Nature |
|---|---|---|---|
| Pressure | C1 Water consumption per unit of GDP | 109m3 | − |
| C2 Water consumption of industrial output | 109m3 | − | |
| C3 Water consumption of agricultural irrigation | 109m3 | − | |
| C4 Household water consumption | 109m3 | − | |
| C5 Urban sewage discharge | 109m3 | − | |
| State | C6 Total volume of water resources | 109m3 | + |
| C7 Per capita water occupancy volume | m3 | + | |
| C8 Per capita water consumption | m3 | + | |
| C9 Water production coefficient | % | + | |
| Response | C10 Industrial water pollution control investment | 104 Yuan | + |
| C11 Urban sewage treatment rate | % | + | |
| C12 Urban water reuse rate | % | + | |
| C13 Urban water supply rate | % | + |
| Coordination State | D Value | Coupling Level | Description |
|---|---|---|---|
| Serious imbalance | 0 ≤ D ≤ 0.25 | Low coupling | The nexus between the two systems is very poor. |
| Imbalance | 0.25 < D ≤ 0.45 | Antagonism stage | The interaction between the two systems is weak. |
| Basic coordination | 0.45 < D ≤ 0.65 | Running-in stage | The link between the two systems begins to reinforce. |
| Coordination | 0.65 < D ≤ 0.75 | Coupling stage | The relationship between the two systems is coordinated. |
| Good coordination | 0.75 < D ≤ 1 | Highly coupling | The coordination between the two systems is very good. |
| System | Urbanization | Water Ecosystem | |||||
|---|---|---|---|---|---|---|---|
| Subsystem | Population Urbanization | Economic Urbanization | Social Urbanization | Spatial Urbanization | Pressure | State | Response |
| Shanghai | 0.168 | 0.285 | 0.227 | 0.320 | 0.366 | 0.361 | 0.273 |
| Jiangsu | 0.166 | 0.274 | 0.219 | 0.340 | 0.378 | 0.372 | 0.300 |
| Zhejiang | 0.149 | 0.274 | 0.210 | 0.368 | 0.356 | 0.322 | 0.322 |
| Anhui | 0.207 | 0.290 | 0.225 | 0.278 | 0.357 | 0.340 | 0.302 |
| Jiangxi | 0.186 | 0.239 | 0.272 | 0.302 | 0.353 | 0.325 | 0.322 |
| Hubei | 0.142 | 0.267 | 0.246 | 0.346 | 0.283 | 0.369 | 0.348 |
| Hunan | 0.126 | 0.270 | 0.271 | 0.333 | 0.385 | 0.341 | 0.274 |
| Chongqing | 0.193 | 0.256 | 0.308 | 0.243 | 0.372 | 0.324 | 0.304 |
| Sichuan | 0.191 | 0.241 | 0.240 | 0.329 | 0.351 | 0.338 | 0.311 |
| Guizhou | 0.154 | 0.267 | 0.251 | 0.328 | 0.367 | 0.330 | 0.323 |
| Yunnan | 0.135 | 0.258 | 0.243 | 0.364 | 0.369 | 0.322 | 0.309 |
| Urbanization | Water Ecosystem | |||||||||
|---|---|---|---|---|---|---|---|---|---|---|
| Indicator Order | 1 | 2 | 3 | 4 | 5 | 1 | 2 | 3 | 4 | 5 |
| Shanghai | U12 | U2 | U11 | U6 | U4 | C1 | C2 | C6 | C4 | C5 |
| Jiangsu | U12 | U2 | U11 | U6 | U14 | C1 | C6 | C2 | C3 | C7 |
| Zhejiang | U12 | U2 | U11 | U14 | U4 | C1 | C2 | C6 | C8 | C4 |
| Anhui | U2 | U12 | U11 | U14 | U6 | C1 | C6 | C2 | C3 | C9 |
| Jiangxi | U2 | U12 | U11 | U10 | U14 | C1 | C2 | C6 | C12 | C4 |
| Hubei | U12 | U2 | U11 | U4 | U6 | C1 | C2 | C6 | C7 | C12 |
| Hunan | U12 | U12 | C11 | C10 | U4 | C1 | C2 | C6 | C8 | C4 |
| Chongqing | U12 | U2 | U11 | U6 | U4 | C1 | C6 | C2 | C8 | C7 |
| Sichuan | U2 | U12 | U11 | U14 | U6 | C1 | C6 | C2 | C3 | C12 |
| Guizhou | U2 | U12 | U11 | U13 | U6 | C1 | C2 | C6 | C4 | C10 |
| Yunnan | U12 | U2 | U11 | U13 | U4 | C1 | C2 | C6 | C7 | C5 |
© 2019 by the authors. Licensee MDPI, Basel, Switzerland. This article is an open access article distributed under the terms and conditions of the Creative Commons Attribution (CC BY) license (http://creativecommons.org/licenses/by/4.0/).
Share and Cite
Han, H.; Li, H.; Zhang, K. Spatial-Temporal Coupling Analysis of the Coordination between Urbanization and Water Ecosystem in the Yangtze River Economic Belt. Int. J. Environ. Res. Public Health 2019, 16, 3757. https://doi.org/10.3390/ijerph16193757
Han H, Li H, Zhang K. Spatial-Temporal Coupling Analysis of the Coordination between Urbanization and Water Ecosystem in the Yangtze River Economic Belt. International Journal of Environmental Research and Public Health. 2019; 16(19):3757. https://doi.org/10.3390/ijerph16193757
Chicago/Turabian StyleHan, Han, Huimin Li, and Kaize Zhang. 2019. "Spatial-Temporal Coupling Analysis of the Coordination between Urbanization and Water Ecosystem in the Yangtze River Economic Belt" International Journal of Environmental Research and Public Health 16, no. 19: 3757. https://doi.org/10.3390/ijerph16193757
APA StyleHan, H., Li, H., & Zhang, K. (2019). Spatial-Temporal Coupling Analysis of the Coordination between Urbanization and Water Ecosystem in the Yangtze River Economic Belt. International Journal of Environmental Research and Public Health, 16(19), 3757. https://doi.org/10.3390/ijerph16193757