A Comparative Study of Water Quality and Human Health Risk Assessment in Longevity Area and Adjacent Non-Longevity Area


 ,
,
Abstract
1. Introduction
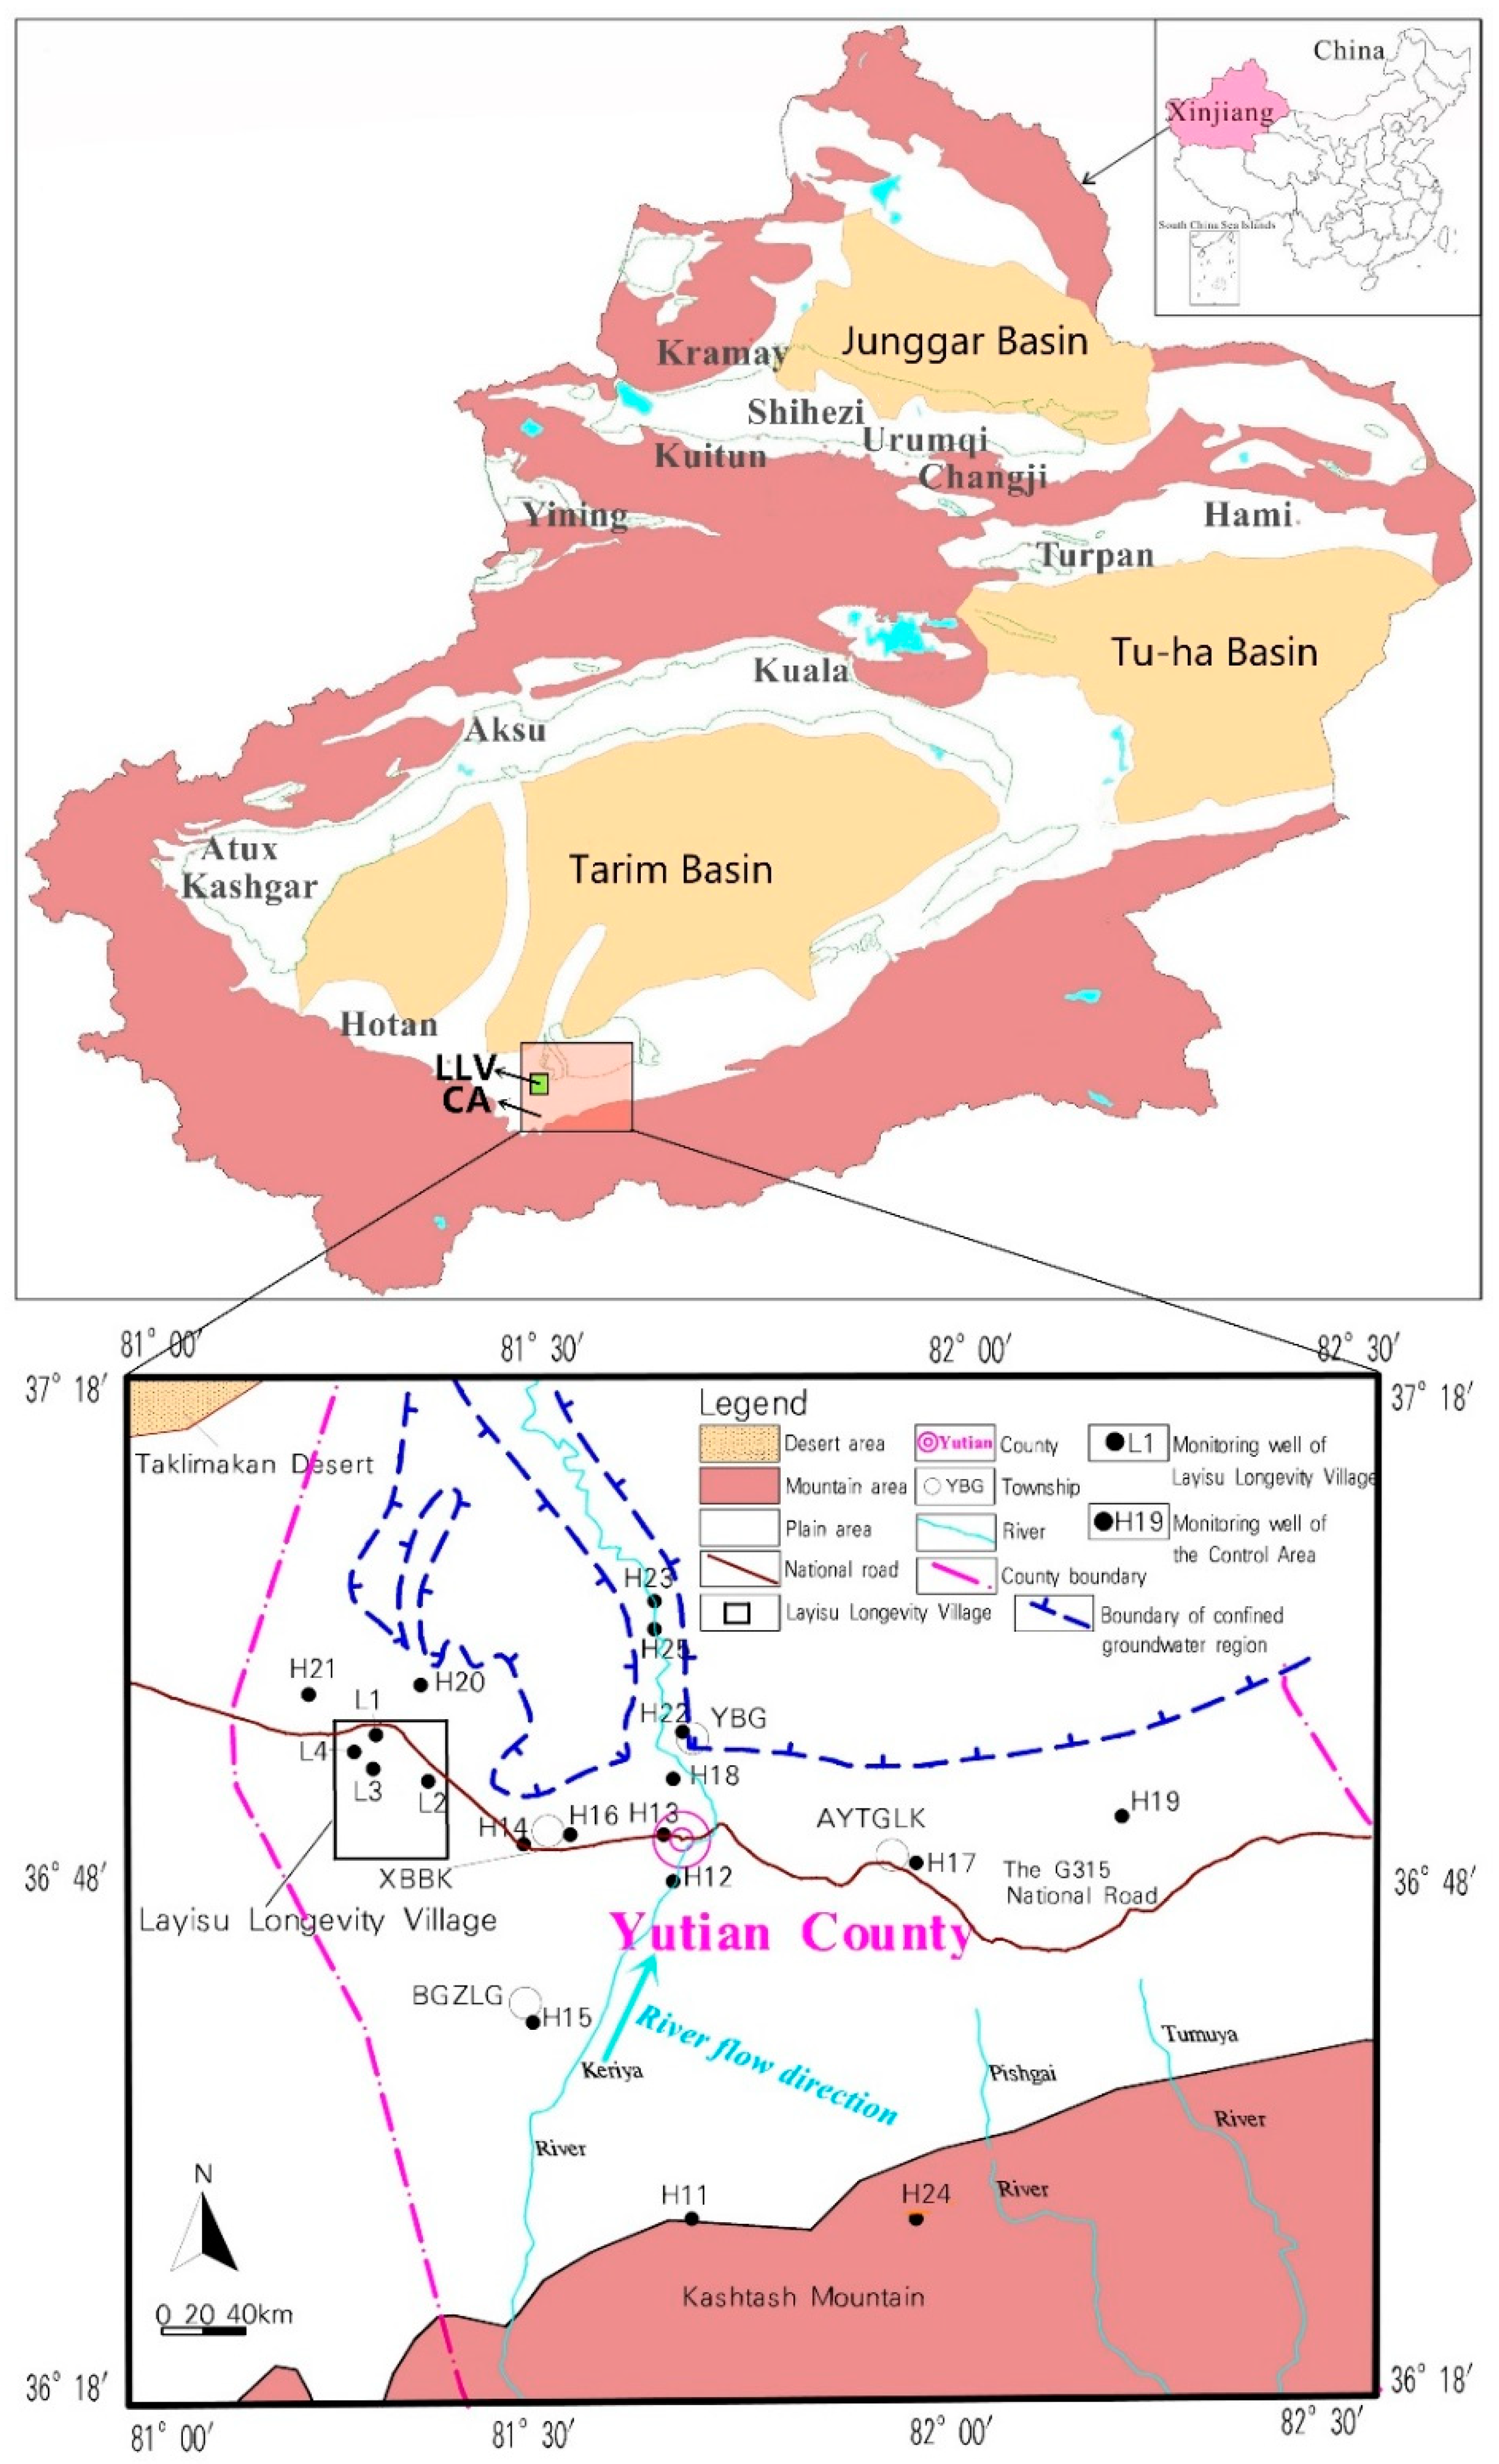
2. Study Area
3. Materials and Methods
3.1. Investigation and Sample Processing
3.2. Water Hydrochemistry Types
3.3. Water Environment Quality Assessment
3.4. Human Health Risk Assessment
4. Results and Discussion
4.1. Population Structural Characteristics and Investigation
4.2. Comparative Analysis of Hydrochemical Characteristics and Types
4.2.1. Drinking Water
4.2.2. Agricultural Water
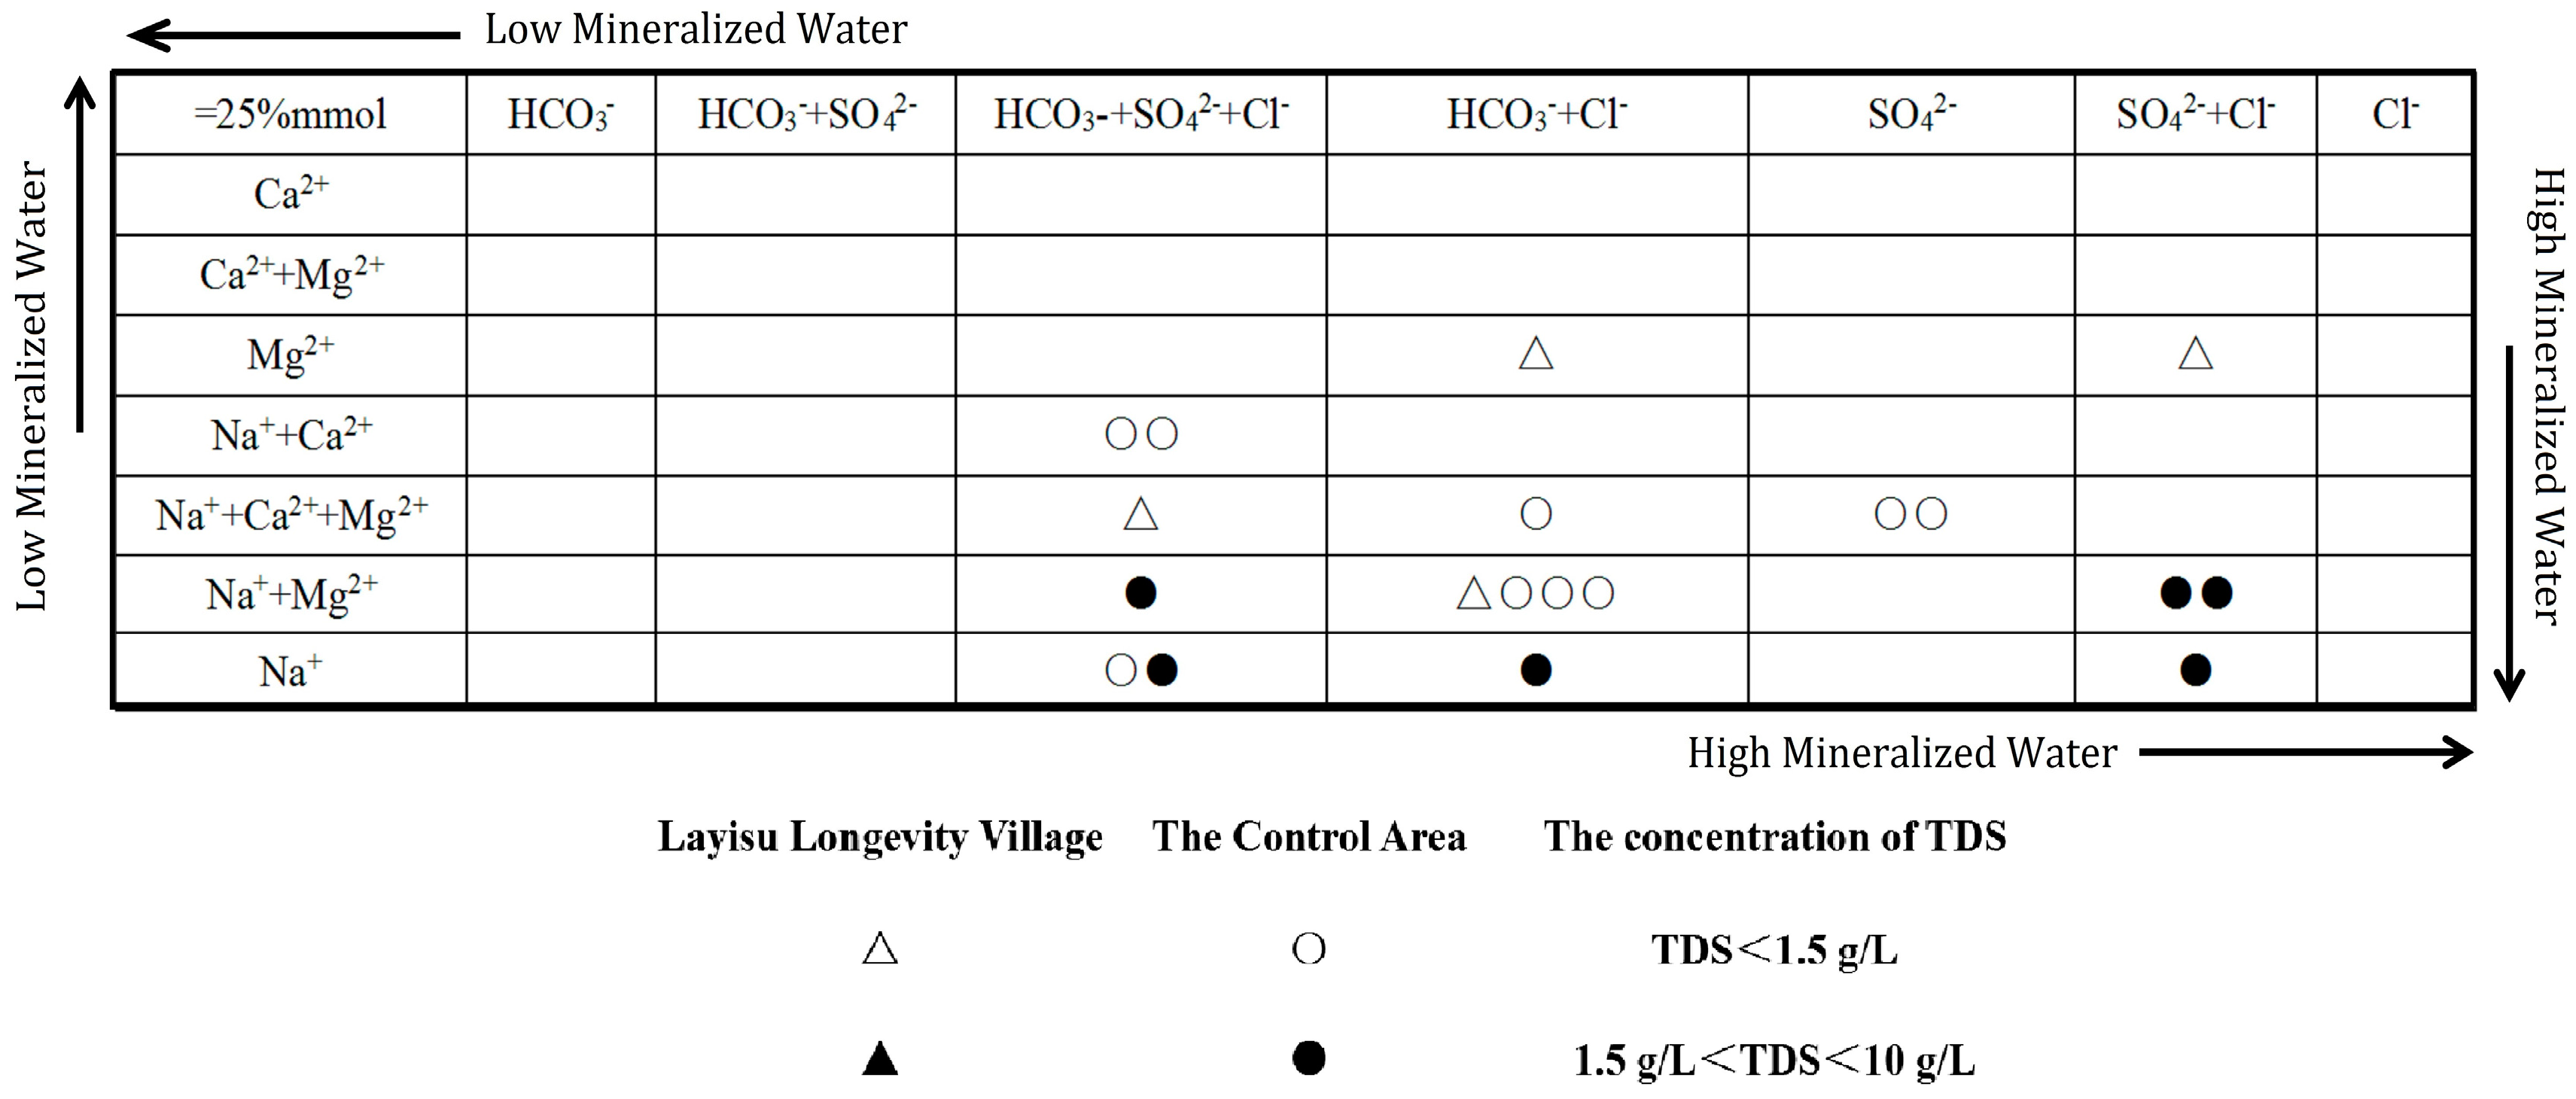
4.2.3. Hydrochemistry Types
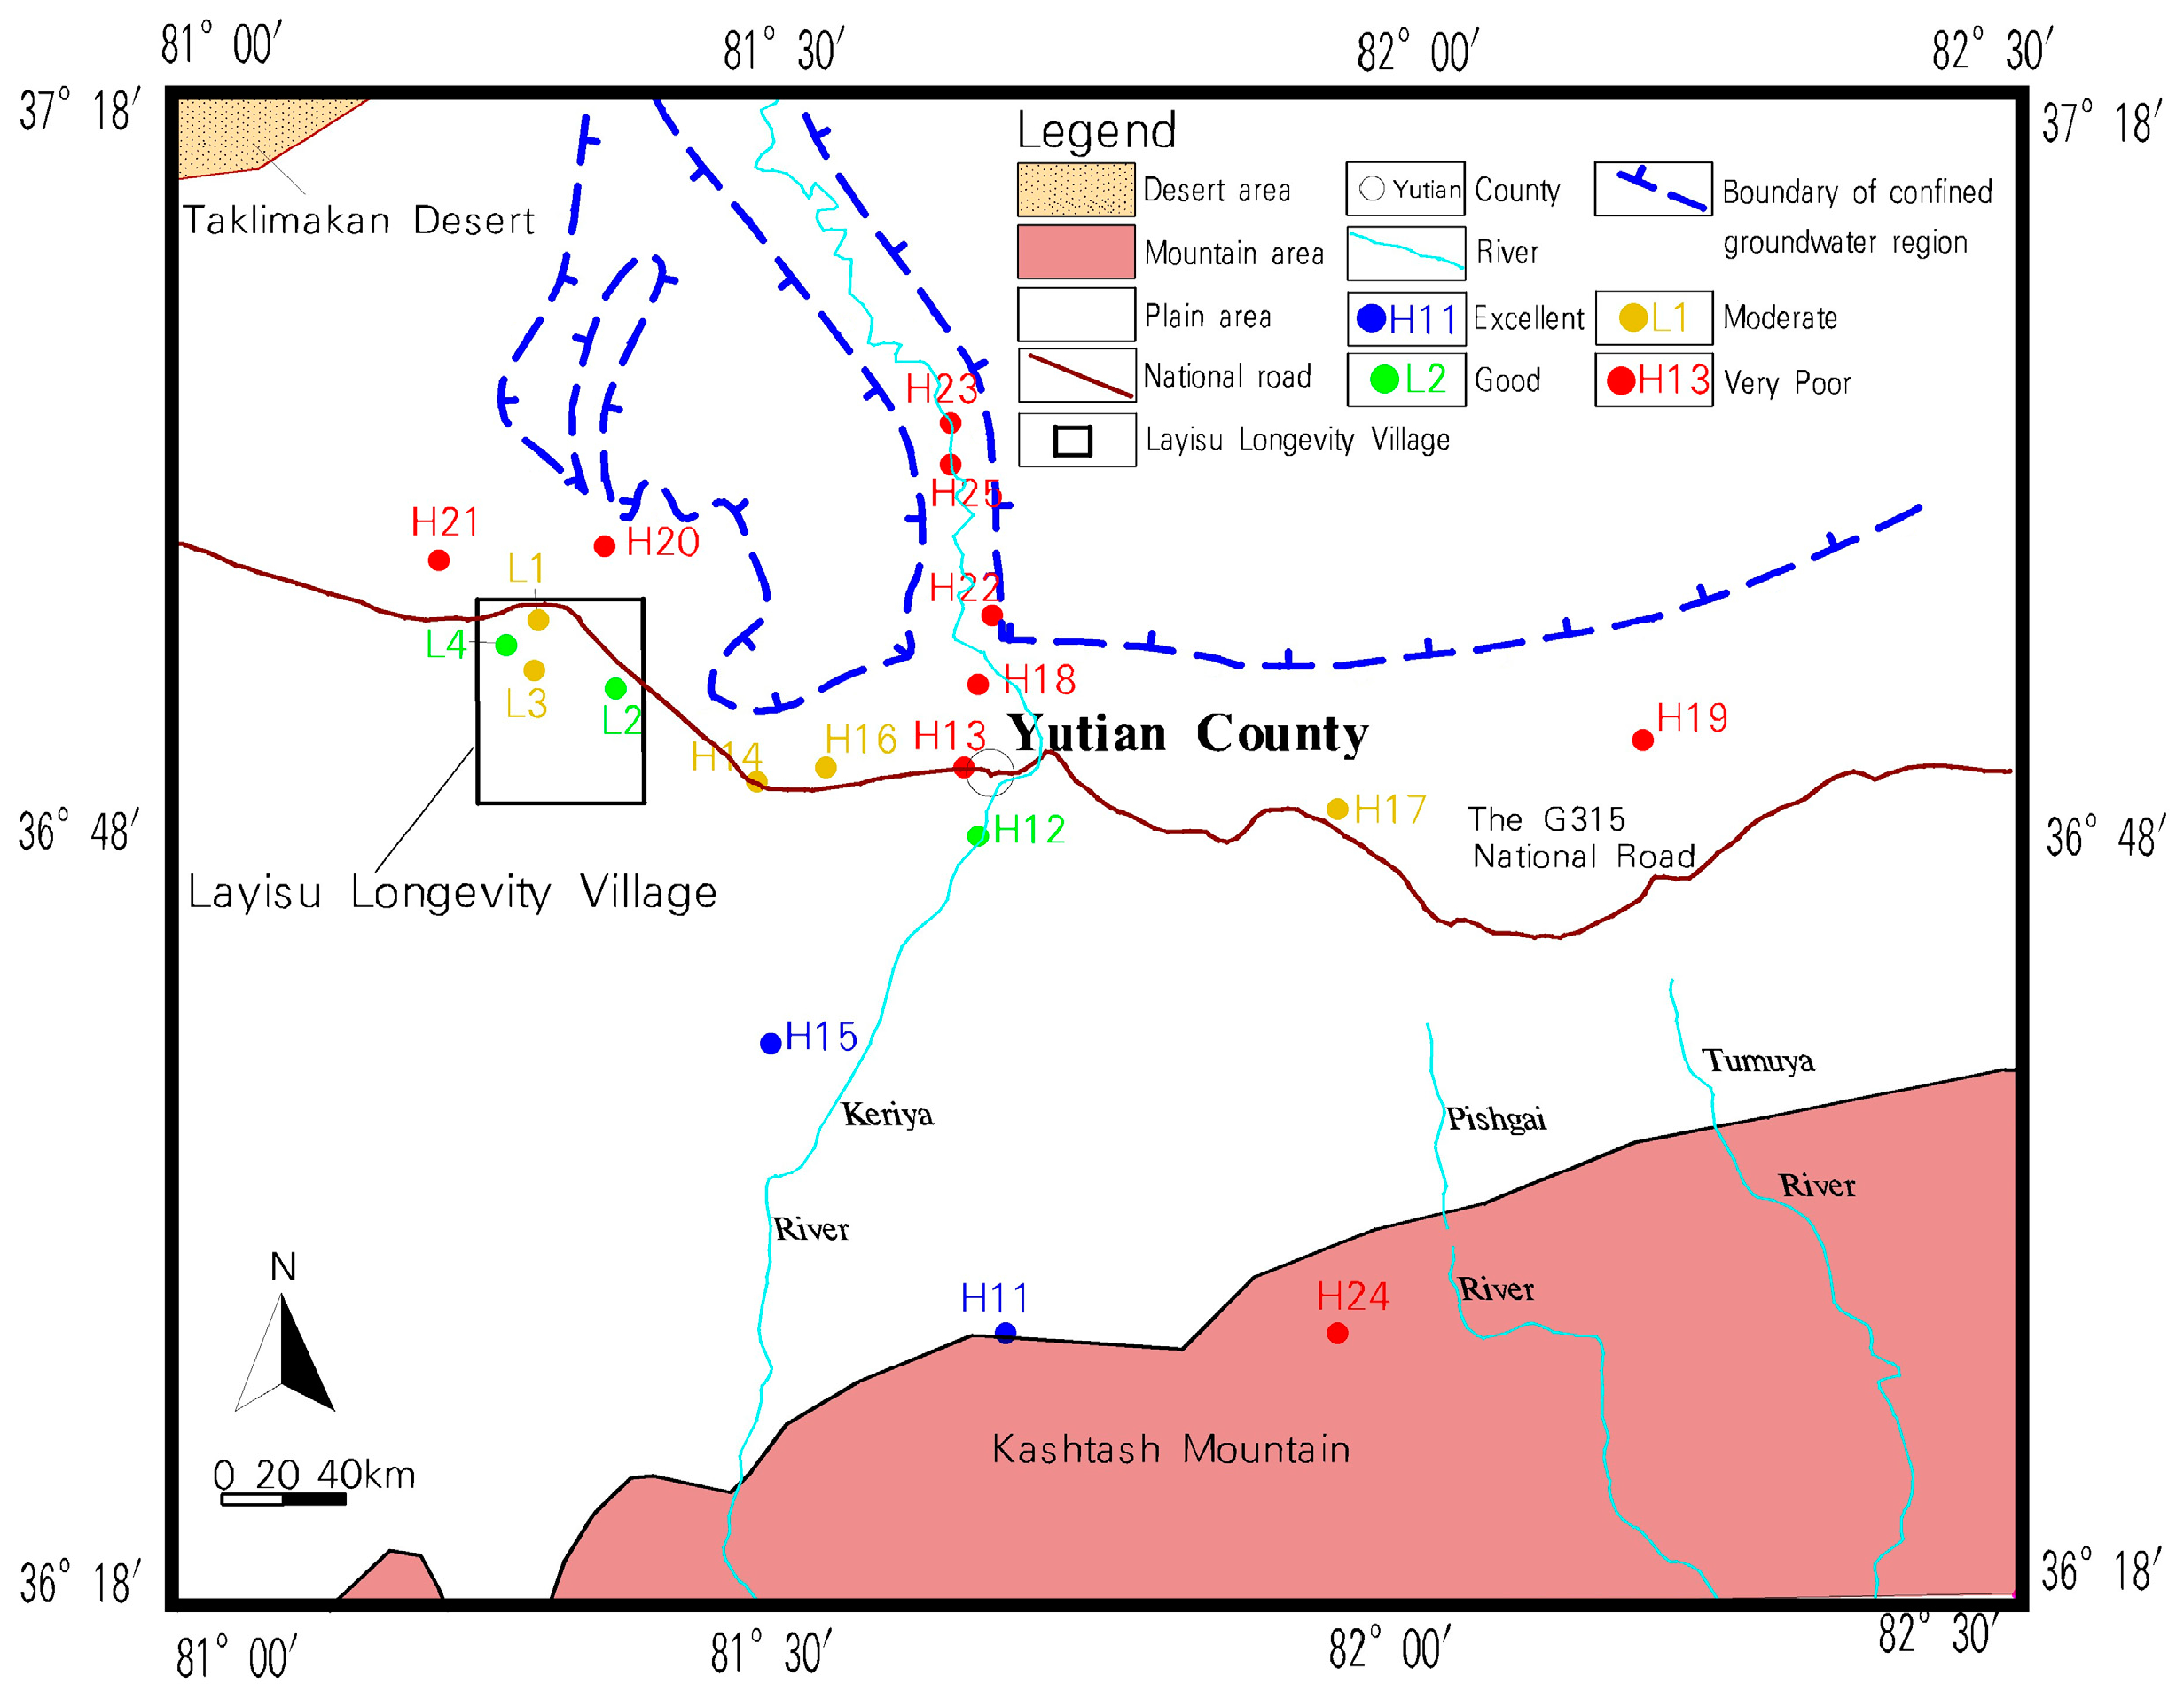
4.3. Comparative Assessment of Water Environment Quality
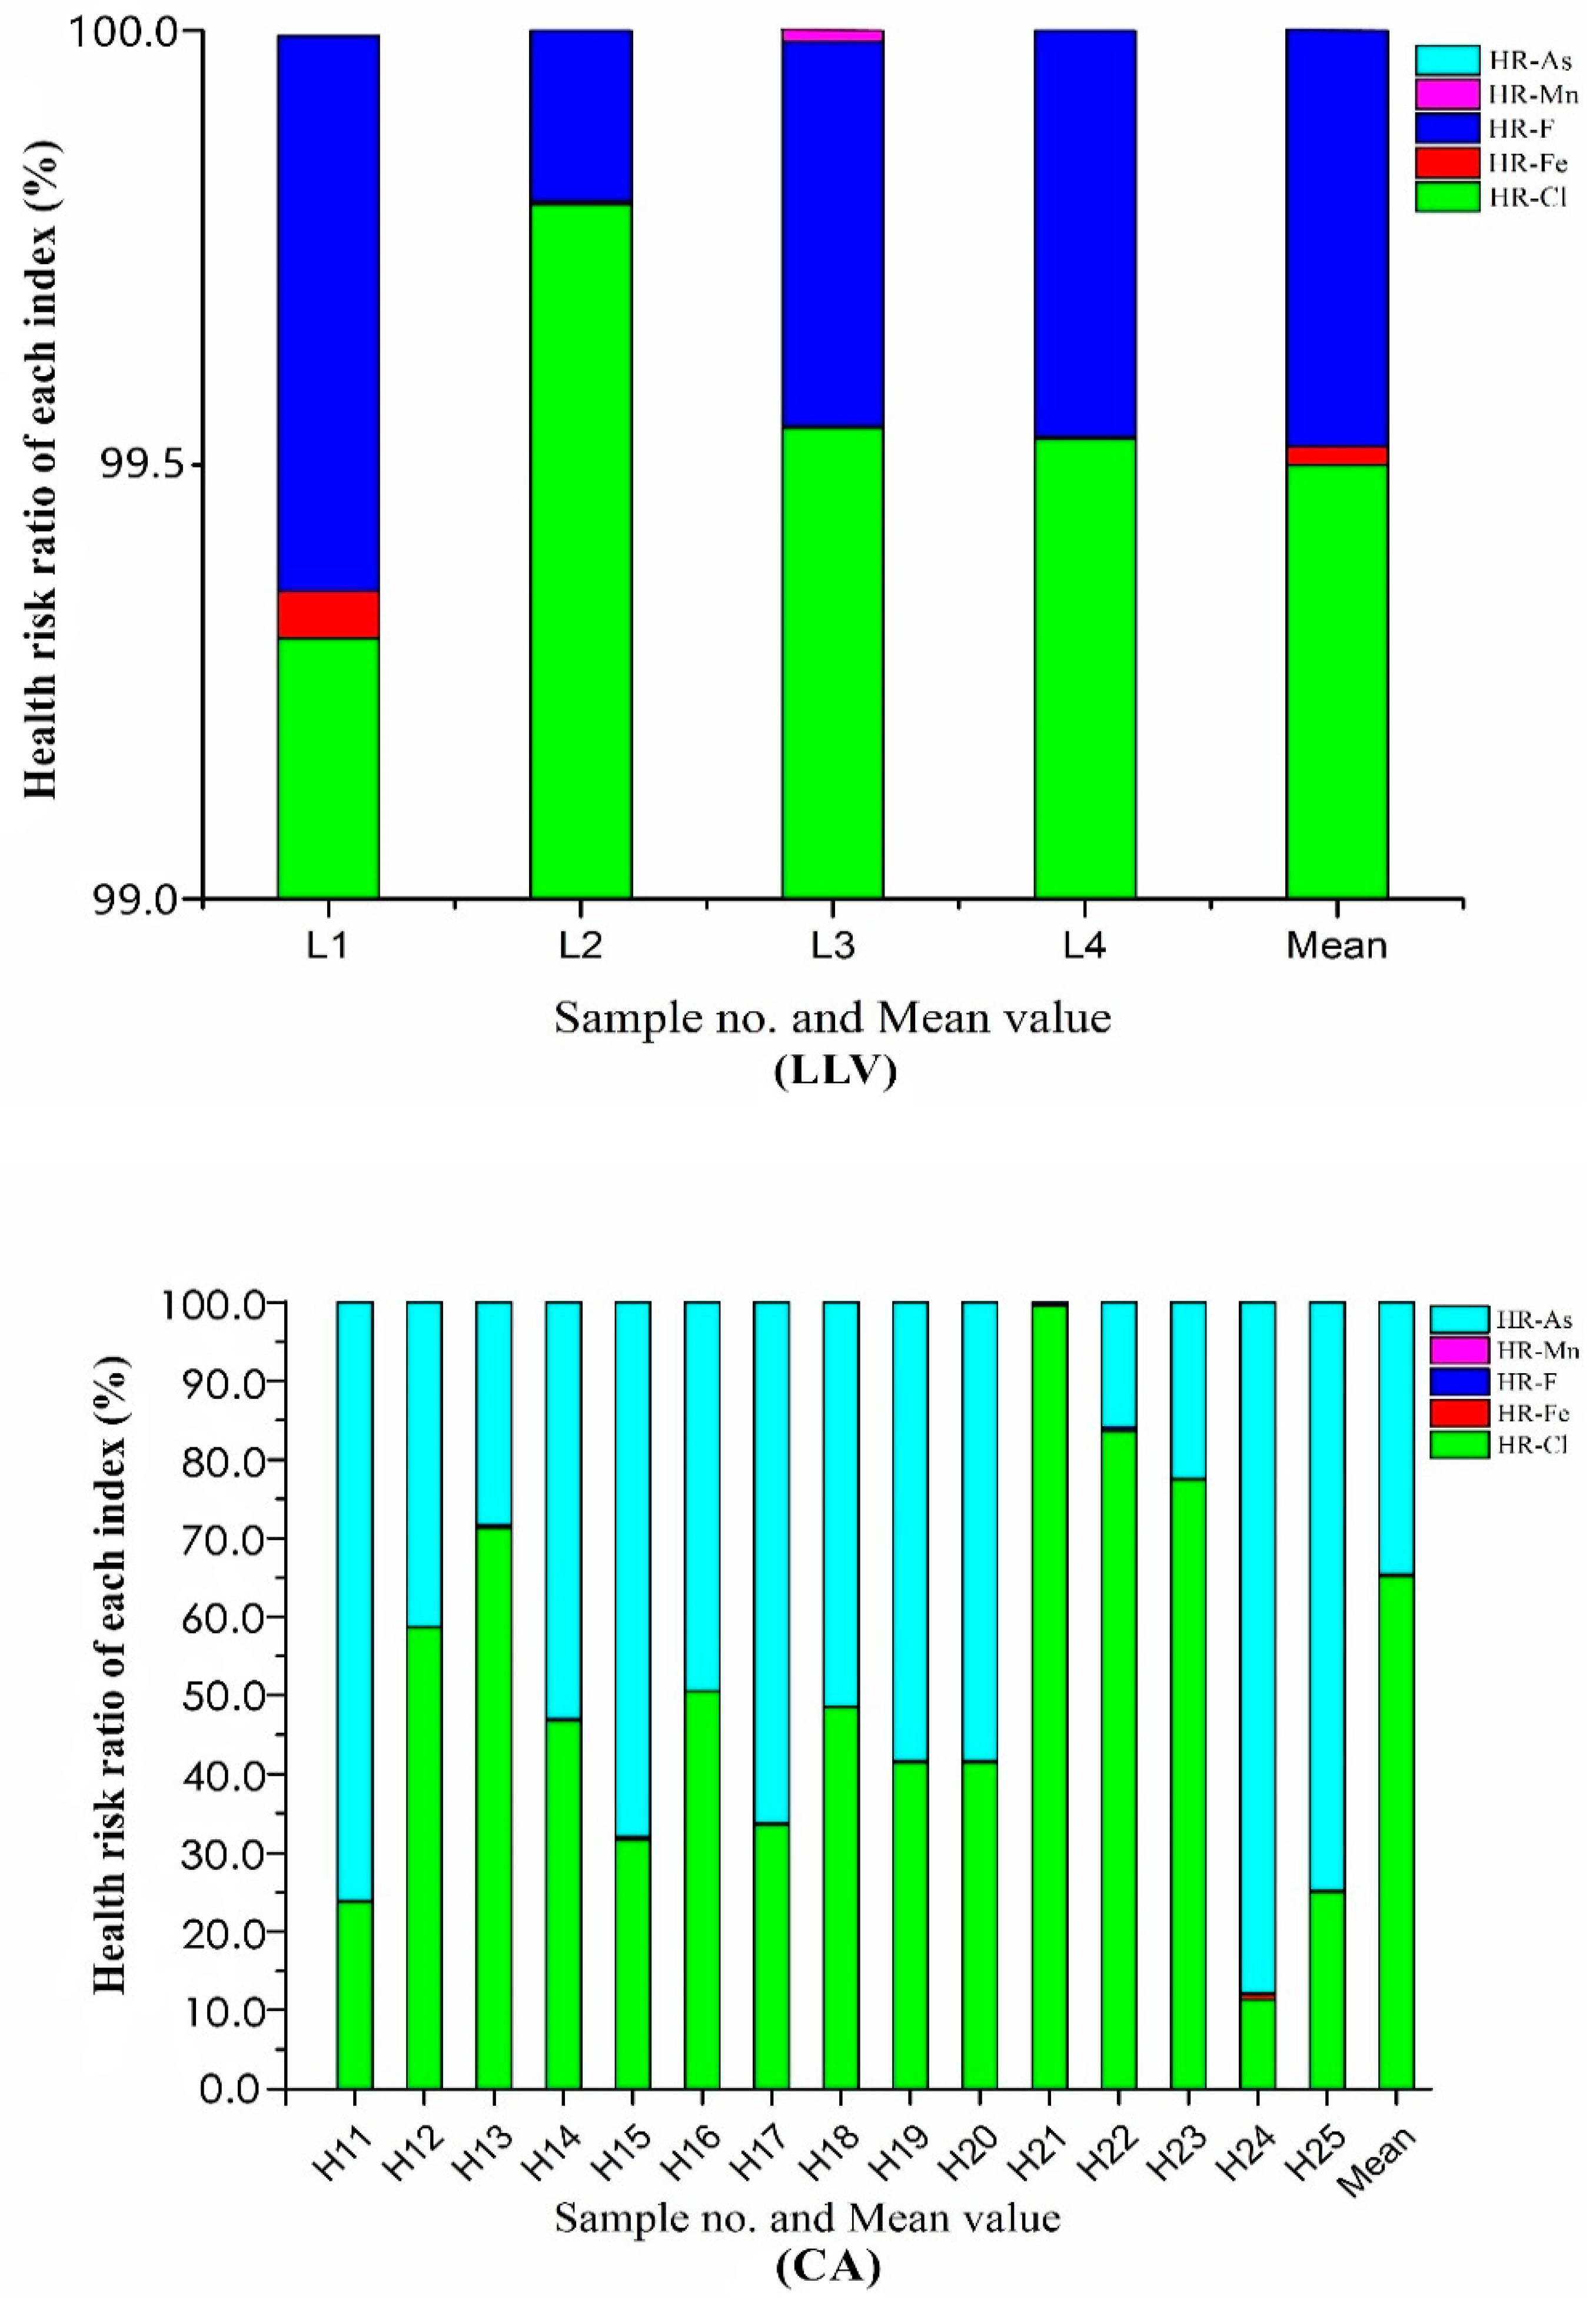
4.4. Comparative Assessment of Health Risk
5. Conclusions
Author Contributions
Funding
Conflicts of Interest
References
- Guo, F. Research on the Relationship between Population Aging and Social Development. Master’s Thesis, Shandong University, Jinan, China, 2006. [Google Scholar]
- Hu, Z.; Peng, X.Z. China’s Population Aging from the Perspective of Public Policy. Social Sci. China 2011, 32, 106–124. [Google Scholar]
- Hawkley, L.C.; Lavelle, L.A.; Berntson, G.G.; Cacioppo, J.T. Mediators of the relationship between socioeconomic status and allostatic load in the Chicago Health, Aging, and Social Relations Study (CHASRS). Psychophysiology 2011, 48, 1134–1145. [Google Scholar] [CrossRef] [PubMed]
- Wang, W.Y.; Li, Y.H.; Li, H.R.; Yu, J.P.; Xiao, Z.Y. Environmental Mechanism of Regional Longevity in China. Sci. Decis. 2015, 1, 1–12. [Google Scholar]
- Ma, T.; Lu, D.; Zhu, Y.S.; Chu, X.F.; Wang, Y.; Shi, G.P.; Wang, Z.D.; Yu, L.; Jiang, X.Y.; Wang, X.F. ACTN3 genotype and physical function and frailty in an elderly Chinese population the Rugao Longevity and Ageing Study. Age Ageing 2018, 47, 1–7. [Google Scholar] [CrossRef]
- Liu, Y.L.; Luo, K.L.; Lin, X.X.; Gao, X.; Ni, R.X.; Wang, S.B.; Tian, X.L. Regional distribution of longevity population and chemical characteristics of natural water in Xinjiang, China. Sci. Total Environ. 2014, 473–474, 54–62. [Google Scholar] [CrossRef] [PubMed]
- Zhai, Y.Z.; Zhao, X.B.; Teng, Y.G.; Li, X.; Zhang, J.J.; Wu, J.; Zuo, R. Groundwater nitrate pollution and human health risk assessment by using HHRA model in an agricultural area, NE China. Ecotoxicol. Environ. Saf. 2017, 137, 130–142. [Google Scholar] [CrossRef]
- Zhang, L.; Hu, W.C.; Lu, Y.Y.; Zhang, J.M.; Zhang, Q.; Feng, Z.S.; Shen, T.; Bai, Y.J. Research on nutrient content and aroma compontents in Uighur medicinal tea. Food Sci. Technol. 2018, 43, 60–66. [Google Scholar]
- Ullah, S.; Javed, M.W.; Rasheed, S.B. Assessment of groundwater quality of district Dir Lower Pakistan. Int. J. Biosci. 2014, 3, 763–771. [Google Scholar]
- Caruso, B.S.; Mirtskhulava, M.; Wireman, M.; Schroeder, W.; Kornilovich, B.; Griffin, S. Effects of Manganese Mining on Water Quality in the Caucasus Mountains, Republic of Georgia. Mine Water Environ. 2012, 31, 16–28. [Google Scholar] [CrossRef]
- Hao, Z.; Liu, Y.; Li, Y.; Song, W.; Yu, J.; Li, H.; Wang, W. Association between longevity and element levels in food and drinking water of typical Chinese longevity area. J. Nutr. Health Aging 2016, 20, 1–7. [Google Scholar] [CrossRef]
- Lv, J.M. The Research to the Chemical Geographic Characteristics of the Typical Longevity Regions in China. Ph.D. Thesis, Chinese Academy of Sciences, Beijing, China, 2011. [Google Scholar]
- Liu, B.S.; Li, H. General situation and features of geriatric epidemiological study in China. Chin. Med. J. 1986, 99, 619. [Google Scholar] [PubMed]
- Yang, X.H.; Zhang, X.J.; Hu, X.X.; Yang, Z.F.; Li, J.Q. Nonlinear Optimization Set Pair Analysis Model (NOSPAM) for Assessing Water Resource Renewability. Nonlinear Process. Geophys. 2011, 18, 599–607. [Google Scholar] [CrossRef]
- Wang, K.W.; Yang, X.H.; Liu, X.M.; Liu, C.M. A simple analytical infiltration model for short-duration rainfall. J. Hydrol. 2017, 555, 141–154. [Google Scholar] [CrossRef]
- Yang, X.H.; Di, C.L.; He, J.; Zhang, J.; Li, Y.Q. Integrated assessment of water resources vulnerability under climate change in Haihe River Basin. Int. J. Numer. Methods Heat Fluid Flow 2015, 25, 1834–1844. [Google Scholar] [CrossRef]
- Yao, Y.P. The Study of Oasis Proper Size Based on the Oasis Self-Organization and Hetero Organization Principle: A Case Study of Keriya Oasis. Master’s Thesis, Xinjiang University, Urumqi, China, 2016. [Google Scholar]
- Yu, J.W.; Zhou, J.L.; Zeng, Y.Y.; Jia, R.L. Comparative analysis of farmland soil heavy metals and health risk assessment. Xinjiang Agric. Sci. 2017, 54, 2293–2303. [Google Scholar]
- Liu, J.Z. Hotan Statistical Yearbook (2015–2018); Xinjiang People’s Publishing House: Urumqi, China, 2018. [Google Scholar]
- Zeng, Y.Y.; Zhou, Y.Z.; Zhou, J.L.; Jia, R.L.; Wu, J.C. Distribution and enrichment factors of high-arsenic groundwater in Inland Arid of P. R. China: A case study of the Shihezi Area, Xinjiang. Expos. Health 2018, 10, 1–13. [Google Scholar] [CrossRef]
- Li, Q.; Zhou, J.L.; Zhou, Y.Z.; Bai, C.Y.; Tao, H.F.; Jia, R.L.; Ji, Y.Y.; Yang, G.Y. Variation of groundwater hydrochemical characteristics in the plain area of the Tarim Basin, Xinjiang Region, China. Environ. Earth Sci. 2014, 72, 4249–4263. [Google Scholar] [CrossRef]
- Zhang, R.Q.; Liang, X.; Jin, M.G.; Wan, L.; Yu, Q.C. Fundamentals of Hydrogeology, 6th ed.; Geological Publishing House: Beijing, China, 2013; p. 67. [Google Scholar]
- Qian, C.; Wu, X.; Mu, W.P.; Fu, R.Z.; Zhu, G.; Wang, Z.R.; Wang, D.D. Hydrogeochemical characterization and suitability assessment of groundwater in an agro-pastoral area, Ordos Basin, NW China. Environ. Earth Sci. 2016, 75, 1356. [Google Scholar] [CrossRef]
- Chabukdhara, M.; Gupta, S.K.; Kotecha, Y.; Nema, A.K. Groundwater quality in Ghaziabad district, Uttar Pradesh, India: Multivariate and health risk assessment. Chemosphere 2017, 179, 167–178. [Google Scholar] [CrossRef] [PubMed]
- Han, L.; Song, Y.; Duan, L.; Yuan, P. Risk assessment methodology for Shenyang chemical industrial park based on fuzzy comprehensive evaluation. Environ. Earth Sci. 2015, 73, 5185–5192. [Google Scholar] [CrossRef]
- Li, R.; Zou, Z.H.; An, Y. Water quality assessment in Qu River based on fuzzy water pollution index method. J. Environ. Sci. 2016, 50, 87–92. [Google Scholar] [CrossRef] [PubMed]
- Min, C.; Lee, Y.; Chung, H.; Yoon, J. Application of Fuzzy Comprehensive Evaluation Method in the Evaluation of Groundwater Quality. Ground Water 2006, 70, 1129–1134. [Google Scholar]
- Radfard, M.M.; Yunesian, M.; Nodehi, R.N.; Biglari, H.; Nazmara, S.; Habi, M.; Yousefi, N.; Yousefi, M. Drinking water quality and arsenic health risk assessment in Sistan and Baluchestan, Southeastern Province, Iran. Hum. Ecol. Risk Assess. Int. J. 2018, 25, 949–965. [Google Scholar] [CrossRef]
- Muhammas, S.; Shah, M.T.; Khan, S. Health risk assessment of heavy metals and their source apportionment in drinking water of Kohistan region, northern Pakistan. Microchem. J. 2011, 98, 334–343. [Google Scholar] [CrossRef]
- United States Environment Protection Agency (USEPA). Guidelines for Carcinogen Risk Assessment; Usepa/630/p-03/001F; Risk Assessment Forum U.S. Environmental Protection Agency: Washington, DC, USA, 2005; pp. 1–166.
- Mohammad, M.; Nicola, C. Arsenic in Drinking Water, Transition Cell Cancer and Chronic Cystitis in Rural Bangladesh. Int. J. Environ. Res. Public Health 2015, 12, 13739–13749. [Google Scholar]
- World Health Organization (WHO). Guidelines for Drinking Water Quality 4th Edn. Available online: http://whqlibdoc.who.int/publications/2011/9789241548151_eng.pdf (accessed on 31 March 2013).
- Magnolfi, S.U.; Petruzzi, E.; Pinzani, P.; Malentacchi, F.; Pazzagli, M.; Antonini, F.M. Longevity index (LI%) and centenarity index (CI%): New indicators to evaluate the characteristics of aging process in the Italian population. Arch. Gerontol. Geriatr. 2007, 44, 271–276. [Google Scholar] [CrossRef]
- Wang, H.Q.; Jiahan, S. Research progress on factors influencing longevity. J. Xinjiang Med. Univ. 2011, 34, 1186–1190. [Google Scholar]
- Xiong, H.G.; Han, Q. Population change and sustainable development in Yutian County, Xinjiang. China Popul. Resour. Environ. 2007, 17, 96–100. [Google Scholar]
- Mattimin, R.; Eli, S.Y. The development status and characteristics of population development in Hotan area. Contemp. Econ. 2015, 10, 72–75. [Google Scholar]
- Zheng, B.S.; Xiao, T.F.; Li, S.H. Medical Geography—The Impact of the Natural Environment on Public Health; Science Press: Beijing, China, 2009. [Google Scholar]
- Zhang, Y.; Wu, J.; Xu, B. Human health risk assessment of groundwater nitrogen pollution in Jinghui canal irrigation area of the loess region, northwest China. Environ. Earth Sci. 2018, 77, 273. [Google Scholar] [CrossRef]
- Cárdenas, M.; Marder, M.; Blank, V.C.; Roguin, L.P. Antitumor activity of some natural flavonoids and synthetic derivatives on various human and murine cancer cell lines. Bioorg. Med. Chem. 2006, 14, 2966–2971. [Google Scholar] [CrossRef] [PubMed]
- Ferrándiz, J.; Abellán, J.J.; Gómezrubio, V.; Ocana-Riola, R. Spatial analysis of the relationship between mortality from cardiovascular and cerebrovascular disease and drinking water hardness. Environ. Health Perspect. 2004, 112, 1037–1044. [Google Scholar] [CrossRef] [PubMed]
- Wongsasuluk, P.; Chotpantarat, S.; Siriwong, W.; Robson, M. Heavy metal contamination and human health risk assessment in drinking water from shallow groundwater wells in an agricultural area in Ubon Ratchathani province, Thailand. Environ. Geochem. Health 2014, 36, 169–182. [Google Scholar] [CrossRef] [PubMed]
- Sohrabi, M.; Gholami, A.; Azar, M.H.; Yaghoobi, M. Trace element and heavy metal levels in colorectal cancer: Comparison between cancerous and non-cancerous tissues. Biol. Trace Elem. Res. 2018, 183, 1–8. [Google Scholar] [CrossRef] [PubMed]
- Du, Y.; Luo, K.; Hussain, R. Comparative study of physico-chemical parameters of drinking water from some longevity and non-longevity areas of China. J. Water Health 2017, 15, 462. [Google Scholar] [CrossRef]
- Bai, X.H.; Chen, G.G. Guidelines for Drinking Water Quality, 4th ed.; Shanghai Jiao Tong University Press: Shanghai, China, 2014. [Google Scholar]
- Luo, K.L.; Feng, F.J.; Li, H.J.; Chou, C.L.; Feng, Z.K. Studies on geological background and source of fluorine in drinking water in the North China Plate fluorosis areas. Toxicol. Environ. Chem. Rev. 2008, 90, 237–246. [Google Scholar] [CrossRef]
- Lv, J.; Wang, W.; Krafft, T.; Li, Y.H.; Zhang, F.; Yuan, F.Q. Effects of several environmental factors on longevity and health of the human population of Zhongxiang, Hubei, China. Biol. Trace Elem. Res. 2011, 143, 702–716. [Google Scholar] [CrossRef]
- Ignatov, I.; Mosin, O.V.; Velikov, B.; Bauer, E.; Tyminski, G. Research of Longevity Factors and Mountain Water as a Factor in Teteven, Yablanitsa and Ugarchin Municipalities, Lovech Region, Bulgaria. J. Health Med. Nurs. 2014, 4, 21–36. [Google Scholar]
- Zou, X.Y. Study on Eco-Chemical Characteristics of Xiayi County in Henan Province, Chinese Longevity Area; Chinese Academy of Sciences: Beijing, China, 2010. [Google Scholar]
- Yang, Y. Survey and Analysis about Longevity-Related Factors of Centenarians in Shandong Province Qindao City Chenyang District; Shandong University: Jinan, China, 2012. [Google Scholar]
- Khedidja, A.; Boudoukha, A. Risk assessment of agricultural pollution on groundwater quality in the high valley of Tadjenanet: Chelghoum Laid (Eastern Algeria). Desalin. Water Treat. 2014, 52, 4174–4182. [Google Scholar] [CrossRef]
- Zhou, P.P.; Wang, Z.M.; Zhang, J.Y.; Yang, Z.X.; Li, X.L. Study on the hydrochemical characteristics of groundwater along the Taklimakan Desert Highway. Environ. Earth Sci. 2016, 75, 1378. [Google Scholar] [CrossRef]
- Wei, Y.P.; Fan, J.L.; Xu, X.W.; Jing, X.J.; Zhou, H.W. Hydrogeochemical Modelling of Groundwater Chemical Evolution from Southern Margin to Hinterland of the Taklamakan Desert. J. Desert Res. 2016, 36, 798–804. [Google Scholar]
- Madhav, W.V.; Baburao, P.D.; Vitthal, M.S.; Kundlik, G.S.; Avinash, M.A.; Mukund, V.A. Health risk assessment of heavy metal contamination in groundwater of Kadava River Basin, Nashik, India. Model. Earth Syst. Environ. 2018, 4, 969–980. [Google Scholar]
- Saleh, H.N.; Panahande, M.; Yousefi, M.; Asghari, F.B.; Oliveri Conti, G.; Talaee, E.; Mohammadi, A.A. Carcinogenic and non-carcinogenic risk assessment of heavy metals in groundwater wells in Neyshabur Plain, Iran. Biol. Trace Elem. Res. 2018, 190, 251–261. [Google Scholar] [CrossRef] [PubMed]
- Li, R.; Kuo, Y.M.; Liu, W.W.; Jang, C.S.; Zhao, E.M.; Yao, L.Q. Potential health risk assessment through ingestion and dermal contact arsenic-contaminated groundwater in Jianghan Plain, China. Environ. Geochem. Health 2018, 1, 1–15. [Google Scholar] [CrossRef]
- Zhou, Y.H.; Wei, A.H.; Li, J.F.; Yan, L.D.; Li, J. Groundwater Quality Evaluation and Health Risk Assessment in the Yinchuan Region, Northwest China. Expo. Health 2016, 8, 443–456. [Google Scholar] [CrossRef]
- Fu, C.C.; Li, X.Q.; Zhang, Y.; Mao, L.; Gong, X.L. Groundwater quality evaluation and the health risk assessment of Yancheng Coastal Plain. J. Water Resour. Water Eng. 2017, 28, 54–60. [Google Scholar]
- Lu, Y.L.; Song, S.; Wang, R.S.; Liu, Z.Y.; Meng, J.; Sweetman, A.J.; Jenkins, A.; Ferrier, R.C.; Li, H.; Luo, W.; et al. Impacts of soil and water pollution on food safety and health risks in China. Environ. Int. 2015, 77, 5–15. [Google Scholar] [CrossRef] [PubMed]
- Chen, Y.F.; Zhou, Y.Z.; Zhou, J.L.; Gao, Y.X.; Feng, X. Assessment on Groundwater Quality of Rural Areas in Tarim Basin. J. Xinjiang Agric. Univ. 2015, 38, 412–419. [Google Scholar]
- Huang, Y.; Miyauchi, K.; Endo, G.; Don, L.D.; Manh, N.C.; Lnoue, C. Arsenic contamination of groundwater and agricultural soil irrigated with the groundwater in Mekong Delta, Vietnam. Environ. Earth Sci. 2016, 75, 757. [Google Scholar] [CrossRef]
- Luo, Y.L.; Jiang, P.A.; Yu, Y.H.; Zheng, C.X.; Wu, H.Q.; Zhang, G.B. Investigation and assessment on Arsenic pollution of soil and groundwater in Kuitun N0.123 State Farm. Arid Land Geogr. 2006, 29, 705–709. [Google Scholar]
- Li, L.; Zhou, J.L.; Qi, W.Q.; Chen, F.; Chen, Y.F. Hydrochemical characteristics and formation reasons of shallow groundwater in oasis area of Hotan River Basin, Xinjiang. J. Water Resour. Water Eng. 2018, 29, 14–20. [Google Scholar]
- Chen, Y.F.; Zeng, Y.Y.; Zhou, J.L.; Wang, S.T.; Du, J.Y.; Liu, Y.F. Spatial distribution characteristics and influence factors of soil heavy metal contents in Oasis Area of Yutian County, Xinjiang. Trans. Chin. Soc. Agric. Mach. 2019, 50, 263–273. [Google Scholar]


| Factors | LLV | CA |
|---|---|---|
| Climate condition | temperate continental arid climate | temperate continental arid climate |
| Annual average temperature | 11.7 °C | 11.6 °C |
| Annual precipitation | 45.7 mm | 47.7 mm |
| Annual evaporation | 2460.3 mm | 2432.1 mm |
| Atmospheric relative humidity | 39.8% | 42.0% |
| Average elevation | 1350 m | 1531 m |
| Frostless period | 205~210 days | 207~213 days |
| Groundwater buried condition | Unconfined groundwater | Unconfined groundwater |
| Per capita GDP | 4085 yuan ($571) | 5250 yuan ($733) |
| Per capita grain planting area | 0.14 hm2 | 0.12 hm2 |
| Indexes | Measurement Instruments and Methods | Detection Limit (mg/L, Except pH Value) |
|---|---|---|
| pH | Portable digital pH meter MT-8060 | 0–14.000 |
| TDS/TH | EDTA titration method | 0.4/0.32 |
| K+/Na+/Ca2+/Mg2+/free CO2 | Ion chromatograph ICS1500 | 0.05/0.01/0.2/0.12/0.07 |
| Li/Sr/Cl−/SO42−/H2SiO3 | Ion chromatograph ICS1500 | 0.003/0.00610/0.09/1 |
| HCO3− | Titration method | 5 |
| I−/F−/TFe/Cu/Pb/Zn/Mn /Cr6+/Cd/Hg/As/Se/Br NH4+/NO3−/NO2− | Inductively coupled plasma atomic emission spectrometer (ICP-AES) iCAP 6300 Ultraviolet spectrophotometer UV2550 | 0.02/0.1/0.05/0.01/0.001/0.002/0.001 /0.004/0.002/0.0001/0.001/0.001/0.005 0.05/0.02/0.02 |
| Factors | LLV | CA |
|---|---|---|
| Population size | 2922 | 28.65 × 10⁴ |
| Agricultural population | 2586 | 25.98 × 10⁴ |
| Uygur population share | 99.6% | 98.3% |
| Population aged 60 and above | 243 | 19769 |
| Population aged 80 and above | 24 | 1364 |
| Population aged 100 and above | 3 | 14 |
| Average life expectancy * Centenarians/Total population | 78.4 1.03 × 10⁻³ | 77.2 4.89 × 10⁻⁵ |
| Child mortality rate ** | 3.05‰ | 12.01‰ |
| Indexes | pH | Cl− | F− | NO3-N | As | Se | Hg | SO42− | Cr6+ |
|---|---|---|---|---|---|---|---|---|---|
| Acceptable limits | ≥6.5, ≤8.5 | ≤300 | ≤1.2 | ≤20 | ≤0.01 | ≤0.01 | ≤0.001 | ≤250 | ≤0.05 |
| LLV (N = 1) CA (N = 4) | 7.84 7.94 ± 0.3 | 326.1 111.5 ± 59.9 | 2.10 0.23 ± 0.2 | 0.52 4.73 ± 4.3 | ND 0.002 ± 0.001 | ND ND | ND ND | 196.9. 162.4 ± 81.9 | ND ND |
| Indexes | Fe | Mn | Cu | Zn | Cd | Pb | TDS | TH | CODMn |
| Acceptable limits | ≤0.5 | ≤0.3 | ≤1.0 | ≤1.0 | ≤0.005 | ≤0.01 | ≤1500 | ≤550 | ≤5.0 |
| LLV (N = 1) CA (N = 4) | 0.86 0.32 ± 0.4 | ND 0.01 ± 0.01 | ND ND | ND ND | ND ND | ND ND | 651.6 1141.3 ± 279.6 | 326.7 430.3 ± 81.9 | 0.72 1.00 ± 0.1 |
| Indexes | Acceptable Limits | LLV (N = 3) | CA (N = 11) | ||||
|---|---|---|---|---|---|---|---|
| Min | Max | Mean ± SD | Min | Max | Mean ± SD | ||
| pH | 5.5~8.5 | 7.8 | 8.01 | 7.93 ± 0.1 | 7.11 | 8.7 | 7.87 ± 0.5 |
| Cl− | ≤350 | 140 | 269.4 | 200.3 ± 65.2 | 34.8 | 2971 | 670.7 ± 834.1 |
| Hg | ≤0.001 | ND | ND | ND | ND | ND | ND |
| Cd | ≤0.01 | ND | ND | ND | ND | ND | ND |
| As | ≤0.1 | ND | ND | ND | ND | 0.01 | 0.004 ± 0.002 |
| Cr6+ | ≤0.1 | ND | ND | ND | ND | ND | ND |
| Pb | ≤0.2 | ND | ND | ND | ND | 0.006 | 0.002 ± 0.002 |
| Index | Grade I | Grade II | Grade III | Grade IV | Grade V | Over-Standard Rate (%) | |
|---|---|---|---|---|---|---|---|
| LLV (N = 4) | CA (N = 15) | ||||||
| Classification | Excellent | Good | Moderate | Poor | Very poor | ||
| TH (mg/L) | ≤150 | ≤300 | ≤450 | ≤650 | >650 | 0 | 46.7 |
| TDS (mg/L) | ≤300 | ≤500 | ≤1000 | ≤2000 | >2000 | 25 | 53.3 |
| Na+ (mg/L) | ≤100 | ≤150 | ≤200 | ≤400 | >400 | 50 | 46.7 |
| SO42− (mg/L) | ≤50 | ≤150 | ≤250 | ≤350 | >350 | 0 | 53.3 |
| Cl− (mg/L) | ≤50 | ≤150 | ≤250 | ≤350 | >350 | 50 | 53.3 |
| Fe (mg/L) | ≤0.1 | ≤0.2 | ≤0.3 | ≤2.0 | >2.0 | 25 | 66.7 |
| Mn (mg/L) | ≤0.05 | ≤0.05 | ≤0.10 | ≤1.50 | >1.50 | 0 | 46.7 |
| F− (mg/L) | ≤1.0 | ≤1.0 | ≤1.0 | ≤2.0 | >2.0 | 50 | 40 |
| I− (mg/L) | ≤0.04 | ≤0.04 | ≤0.08 | ≤0.50 | >0.50 | 0 | 13.3 |
| As (mg/L) | ≤0.001 | ≤0.001 | ≤0.01 | ≤0.05 | >0.05 | 0 | 7 |
| LLV (N = 4) | CA (N = 15) | ||||||||||||
|---|---|---|---|---|---|---|---|---|---|---|---|---|---|
| Sample No. | Grade I | Grade II | Grade III | Grade IV | Grade V | Assessment Results | Sample No. | Grade I | Grade II | Grade III | Grade IV | Grade V | Assessment Results |
| L1 | 0.059 | 0.075 | 0.495 * | 0.223 | 0.193 | Grade III | H11 | 0.426 * | 0.205 | 0.226 | 0.220 | 0.000 | Grade I |
| L2 | 0.342 | 0.528 * | 0.130 | 0.000 | 0.000 | Grade II | H12 | 0.164 | 0.707 * | 0.129 | 0.000 | 0.000 | Grade II |
| L3 | 0.021 | 0.172 | 0.733 * | 0.074 | 0.000 | Grade III | H13 | 0.015 | 0.004 | 0.048 | 0.001 | 0.933 * | Grade V |
| L4 | 0.218 | 0.431 * | 0.352 | 0.000 | 0.000 | Grade II | H14 | 0.015 | 0.128 | 0.495 * | 0.337 | 0.026 | Grade III |
| MC | 0.015 | 0.402 | 0.564 * | 0.020 | 0.000 | Grade III | H15 | 0.557 * | 0.021 | 0.236 | 0.187 | 0.000 | Grade I |
| H16 | 0.040 | 0.351 | 0.609 * | 0.000 | 0.000 | Grade III | |||||||
| H17 | 0.228 | 0.281 | 0.456 * | 0.036 | 0.000 | Grade III | |||||||
| H18 | 0.054 | 0.054 | 0.087 | 0.011 | 0.795 * | Grade V | |||||||
| H19 | 0.163 | 0.099 | 0.210 | 0.192 | 0.338 * | Grade V | |||||||
| H20 | 0.002 | 0.003 | 0.046 | 0.046 | 0.900 * | Grade V | |||||||
| H21 | 0.005 | 0.000 | 0.010 | 0.002 | 0.804 * | Grade V | |||||||
| H22 | 0.000 | 0.008 | 0.012 | 0.000 | 0.981 * | Grade V | |||||||
| H23 | 0.006 | 0.004 | 0.106 | 0.085 | 0.800 * | Grade V | |||||||
| H24 | 0.082 | 0.004 | 0.025 | 0.002 | 0.887 * | Grade V | |||||||
| H25 | 0.006 | 0.044 | 0.266 | 0.138 | 0.537 * | Grade V | |||||||
| MC | 0.008 | 0.004 | 0.052 | 0.136 | 0.799 * | Grade V | |||||||
| Parameters | As | Cl− | Fe | F− | Mn |
|---|---|---|---|---|---|
| RfDnj [mg/(kg·day)] | 3.0 × 10⁻⁴ | 0.06 | 0.3 | 0.06 | 0.14 |
| qci [(kg·day)/mg] | 1.5 |
| Control Groups and Samples No. | Non-Carcinogens | Carcinogen | HQn | Riskc | HRall | |||||
|---|---|---|---|---|---|---|---|---|---|---|
| As | Cl− | Fe | F− | Mn | As | |||||
| LLV | L1 | ND | 3.13 × 10⁻⁶ | 1.70 × 10⁻⁹ | 2.01 × 10⁻⁸ | ND | ND | 3.15 × 10⁻⁶ | ND | 3.15 × 10⁻⁶ |
| L2 | ND | 1.34 × 10⁻⁶ | ND | 2.88 × 10⁻⁹ | ND | ND | 1.34 × 10⁻⁶ | ND | 1.34 × 10⁻⁶ | |
| L3 | ND | 2.58 × 10⁻⁶ | ND | 1.15 × 10⁻⁸ | 3.29 × 10⁻¹⁰ | ND | 2.59 × 10⁻⁶ | ND | 2.59 × 10⁻⁶ | |
| L4 | ND | 1.83 × 10⁻⁶ | ND | 8.63 × 10⁻⁹ | ND | ND | 1.84 × 10⁻⁶ | ND | 1.84 × 10⁻⁶ | |
| Mean | ND | 2.22 × 10⁻⁶ | 4.60 × 10⁻¹⁰ | 1.08 × 10⁻⁸ | 1.59 × 10⁻¹⁰ | ND | 2.23 × 10⁻⁶ | ND | 2.23 × 10⁻⁶ | |
| CA | H11 | 3.89 × 10⁻⁹ | 5.49 × 10⁻⁷ | 2.28 × 10⁻⁹ | 2.14 × 10⁻⁹ | 1.17 × 10⁻¹⁰ | 1.75 × 10⁻⁶ | 5.57 × 10⁻⁷ | 1.75 × 10⁻⁶ | 2.31 × 10⁻⁶ |
| H12 | 1.95 × 10⁻⁹ | 1.25 × 10⁻⁶ | 4.07 × 10⁻¹⁰ | 4.87 × 10⁻¹⁰ | 1.67 × 10⁻¹¹ | 8.76 × 10⁻⁷ | 1.25 × 10⁻⁶ | 8.76 × 10⁻⁷ | 2.13 × 10⁻⁶ | |
| H13 | 3.89 × 10⁻⁹ | 4.42 × 10⁻⁶ | 6.33 × 10⁻¹⁰ | 2.34 × 10⁻⁸ | 5.72 × 10⁻¹⁰ | 1.75 × 10⁻⁶ | 4.45 × 10⁻⁶ | 1.75 × 10⁻⁶ | 6.20 × 10⁻⁶ | |
| H14 | 5.84 × 10⁻⁹ | 2.32 × 10⁻⁶ | 2.14 × 10⁻¹¹ | 1.65 × 10⁻⁸ | 4.21 × 10⁻¹⁰ | 2.63 × 10⁻⁶ | 2.35 × 10⁻⁶ | 2.63 × 10⁻⁶ | 4.97 × 10⁻⁶ | |
| H15 | 1.95 × 10⁻⁹ | 4.09 × 10⁻⁷ | 2.05 × 10⁻⁹ | 3.11 × 10⁻⁹ | 1.08 × 10⁻¹⁰ | 8.76 × 10⁻⁷ | 4.16 × 10⁻⁷ | 8.76 × 10⁻⁷ | 1.29 × 10⁻⁶ | |
| H16 | 3.89 × 10⁻⁹ | 1.79 × 10⁻⁶ | 3.31 × 10⁻¹¹ | 1.56 × 10⁻⁹ | ND | 1.75 × 10⁻⁶ | 1.80 × 10⁻⁶ | 1.75 × 10⁻⁶ | 3.55 × 10⁻⁶ | |
| H17 | 3.89 × 10⁻⁹ | 8.91 × 10⁻⁷ | 2.92 × 10⁻¹¹ | 3.89 × 10⁻⁹ | ND | 1.75 × 10⁻⁶ | 8.99 × 10⁻⁷ | 1.75 × 10⁻⁶ | 2.65 × 10⁻⁶ | |
| H18 | 9.73 × 10⁻⁹ | 4.14 × 10⁻⁶ | 1.21 × 10⁻⁹ | 6.42 × 10⁻⁹ | 2.71 × 10⁻¹⁰ | 4.38 × 10⁻⁶ | 4.16 × 10⁻⁶ | 4.38 × 10⁻⁶ | 8.54 × 10⁻⁶ | |
| H19 | 3.89 × 10⁻⁹ | 1.25 × 10⁻⁶ | 7.40 × 10⁻¹¹ | 4.28 × 10⁻⁹ | ND | 1.75 × 10⁻⁶ | 1.26 × 10⁻⁶ | 1.75 × 10⁻⁶ | 3.01 × 10⁻⁶ | |
| H20 | 1.36 × 10⁻⁸ | 8.30 × 10⁻⁶ | 2.67 × 10⁻⁹ | 5.26 × 10⁻⁸ | 8.72 × 10⁻¹⁰ | 6.13 × 10⁻⁶ | 8.37 × 10⁻⁶ | 6.13 × 10⁻⁶ | 1.45 × 10⁻⁵ | |
| H21 | ND | 2.89 × 10⁻⁵ | 6.52 × 10⁻⁸ | 6.62 × 10⁻⁹ | 1.73 × 10⁻⁹ | ND | 2.90 × 10⁻⁵ | ND | 2.90 × 10⁻⁵ | |
| H22 | 3.89 × 10⁻⁹ | 9.26 × 10⁻⁶ | 3.97 × 10⁻⁹ | 5.45 × 10⁻⁸ | 4.09 × 10⁻¹⁰ | 1.75 × 10⁻⁶ | 9.32 × 10⁻⁶ | 1.75 × 10⁻⁶ | 1.11 × 10⁻⁵ | |
| H23 | 5.84 × 10⁻⁹ | 9.09 × 10⁻⁶ | 8.37 × 10⁻¹⁰ | 1.36 × 10⁻⁸ | 4.51 × 10⁻¹⁰ | 2.63 × 10⁻⁶ | 9.11 × 10⁻⁶ | 2.63 × 10⁻⁶ | 1.17 × 10⁻⁵ | |
| H24 | 5.84 × 10⁻⁹ | 3.39 × 10⁻⁷ | 2.20 × 10⁻⁸ | 2.14 × 10⁻⁹ | 9.43 × 10⁻¹⁰ | 2.63 × 10⁻⁶ | 3.70 × 10⁻⁷ | 2.63 × 10⁻⁶ | 3.00 × 10⁻⁶ | |
| H25 | 2.14 × 10⁻⁸ | 3.23 × 10⁻⁶ | 1.48 × 10⁻⁸ | 1.27 × 10⁻⁸ | 9.64 × 10⁻¹⁰ | 9.63 × 10⁻⁶ | 3.28 × 10⁻⁶ | 9.63 × 10⁻⁶ | 1.29 × 10⁻⁵ | |
| Mean | 5.97 × 10⁻⁹ | 5.08 × 10⁻⁶ | 7.75 × 10⁻⁹ | 1.36 × 10⁻⁸ | 4.58 × 10⁻¹⁰ | 2.69 × 10⁻⁶ | 5.11 × 10⁻⁶ | 2.69 × 10⁻⁶ | 7.79 × 10⁻⁶ | |
| Mean CA/Mean LLV | - | 2.29 | 16.84 | 1.26 | 2.88 | - | 2.29 | - | 3.49 | |
© 2019 by the authors. Licensee MDPI, Basel, Switzerland. This article is an open access article distributed under the terms and conditions of the Creative Commons Attribution (CC BY) license (http://creativecommons.org/licenses/by/4.0/).
Share and Cite
Yu, J.; Zhou, J.; Long, A.; He, X.; Deng, X.; Chen, Y. A Comparative Study of Water Quality and Human Health Risk Assessment in Longevity Area and Adjacent Non-Longevity Area. Int. J. Environ. Res. Public Health 2019, 16, 3737. https://doi.org/10.3390/ijerph16193737
Yu J, Zhou J, Long A, He X, Deng X, Chen Y. A Comparative Study of Water Quality and Human Health Risk Assessment in Longevity Area and Adjacent Non-Longevity Area. International Journal of Environmental Research and Public Health. 2019; 16(19):3737. https://doi.org/10.3390/ijerph16193737
Chicago/Turabian StyleYu, Jiawen, Jinlong Zhou, Aihua Long, Xinlin He, Xiaoya Deng, and Yunfei Chen. 2019. "A Comparative Study of Water Quality and Human Health Risk Assessment in Longevity Area and Adjacent Non-Longevity Area" International Journal of Environmental Research and Public Health 16, no. 19: 3737. https://doi.org/10.3390/ijerph16193737
APA StyleYu, J., Zhou, J., Long, A., He, X., Deng, X., & Chen, Y. (2019). A Comparative Study of Water Quality and Human Health Risk Assessment in Longevity Area and Adjacent Non-Longevity Area. International Journal of Environmental Research and Public Health, 16(19), 3737. https://doi.org/10.3390/ijerph16193737