Article

Hydrochemistry and Dissolved Inorganic Carbon (DIC) Cycling in a Tropical Agricultural River, Mun River Basin, Northeast Thailand

1
Institute of Earth Sciences, China University of Geoscience (Beijing), Beijing 100083, China
2
The Institute of Hydrogeology and Environmental Geology, Chinese Academy of Geological Sciences, Shijiazhuang 050061, China
3
Institute of Geographic Sciences and Natural Resources Research, Chinese Academy of Sciences, Beijing 100101, China
*
Author to whom correspondence should be addressed.
Int. J. Environ. Res. Public Health 2019, 16(18), 3410; https://doi.org/10.3390/ijerph16183410
Submission received: 19 August 2019 / Revised: 7 September 2019 / Accepted: 10 September 2019 / Published: 14 September 2019
(This article belongs to the Section Climate Change)

Abstract

:
Dissolved inorganic carbon isotope composition (δ13CDIC), together with major ion concentrations were measured in the Mun River and its tributaries in March 2018 to constrain the origins and cycling of dissolved inorganic carbon. In the surface water samples, the DIC content ranged from 185 to 5897 μmol/L (average of 1376 μmol/L), and the δ13CDIC of surface water ranged from −19.6‰ to −2.7‰. In spite of the high variability in DIC concentrations and partial pressure of carbon dioxide (pCO2), the δ13CDIC values of the groundwater were relatively consistent, with a mean value of −16.9 ± 1.4‰ (n = 9). Spatial changes occurred in the direction and magnitude of CO2 flux through water-air interface (FCO2). In the dry season, fluxes varied from −6 to 1826 mmol/(m2·d) with an average of 240 mmol/(m2·d). In addition to the dominant control on hydrochemistry and dissolved inorganic carbon isotope composition by the rock weathering, the impacts from anthropogenic activities were also observed in the Mun River, especially higher DIC concentration of waste water from urban activities. These human disturbances may affect the accurate estimate contributions of carbon dioxide from tropical rivers to the atmospheric carbon budgets.

1. Introduction

The global estimate of atmospheric carbon dioxide exchange shows that the amount of carbon dioxide exchanged in the tropics is huge and cannot be ignored [1]. At present, because of the role of atmospheric carbon dioxide in controlling global climate change, the process of controlling carbon in and out of inland water is receiving special attention [2,3,4,5]. As an important part of inland water, river, and groundwater are the key to the hydrogeology of the upper crust and the surface of the earth [6,7,8,9,10]. Many scholars have begun to undertake systematic research on rivers, especially the conversion transfer of CO2 among the lithosphere, hydrosphere, and the atmosphere systems [5,11,12,13,14,15]. However, the special connection between hydrological and biogeochemical processes regulating carbon dioxide fluxes in above systems is still unclear. Some studies have shown that dissolved inorganic carbon (DIC) accounts for about 50% of global carbon fluxes transported by the rivers [16]. In addition, a huge amount of DIC is not only transported by the river into the ocean, but also released into the atmosphere [17,18,19,20]. An updated estimate of global CO2 evasion to the atmosphere from inland waters is about 2.1 Pg C/year [1]. Thus, both vertical and lateral transports of DIC via rivers should be further understood.
The DIC in river water mainly originates from the following processes of CO2 exchange with the atmosphere, inflow of soil CO2 through groundwater, biological respiration in the river, and dissolution of carbonate rocks [21]. Moreover, human factors also affect all aspects of the carbon cycle in a river. For instance, flow regulation and damming affect the basic hydraulic characteristics of the river (water flow velocity and mixing characteristics), and cut off the river’s connection with adjacent areas. Frequent exchange between groundwater and river water increases the risk of water pollution, because possible contaminants from human activities could be carried into the groundwater. High contents of organic carbon in waste water can lead to mass microbial growth, which make groundwater is unsuitable for residents. Understanding the DIC cycle in rivers and streams helps in predicting the behavior of the river system in case of contamination, and in assessing the possible contaminating effect of the river water on groundwater.
The Mun River, in northeast Thailand, has a considerable amount of population and agriculture, therefore, the risk of such contamination is also elevated. Groundwater in the area is used as drinking water and irrigation water. For all these reasons, the Mun River is an ideal example of a vulnerable river system characterized by significant human activity. Under the right conditions, the carbon isotope of DIC (δ13CDIC) can be an effective tool, and it is helpful to understand the biogeochemical reactions processes in surface water and groundwater. Correlation of variations in δ13CDIC with major ion chemistry, the partial pressure of carbon dioxide (pCO2), and calcite saturation indexes (CSI) may provide evidence for such processes.
The objective of this study was to discriminate various DIC sources, especially anthropogenic sources in a tropical agricultural river using isotopic and chemical tracers. For this, this paper combines δ13C values of DIC and hydrochemistry to constrain the origins and cycling of DIC in the Mun River of Northeast Thailand. This study characterizes DIC sources and interactions in a tropical agricultural river system, and thus helping to increase the overall understanding of the global carbon cycle and the links among the lithosphere, hydrosphere, and the atmosphere.

2. Materials and Methods
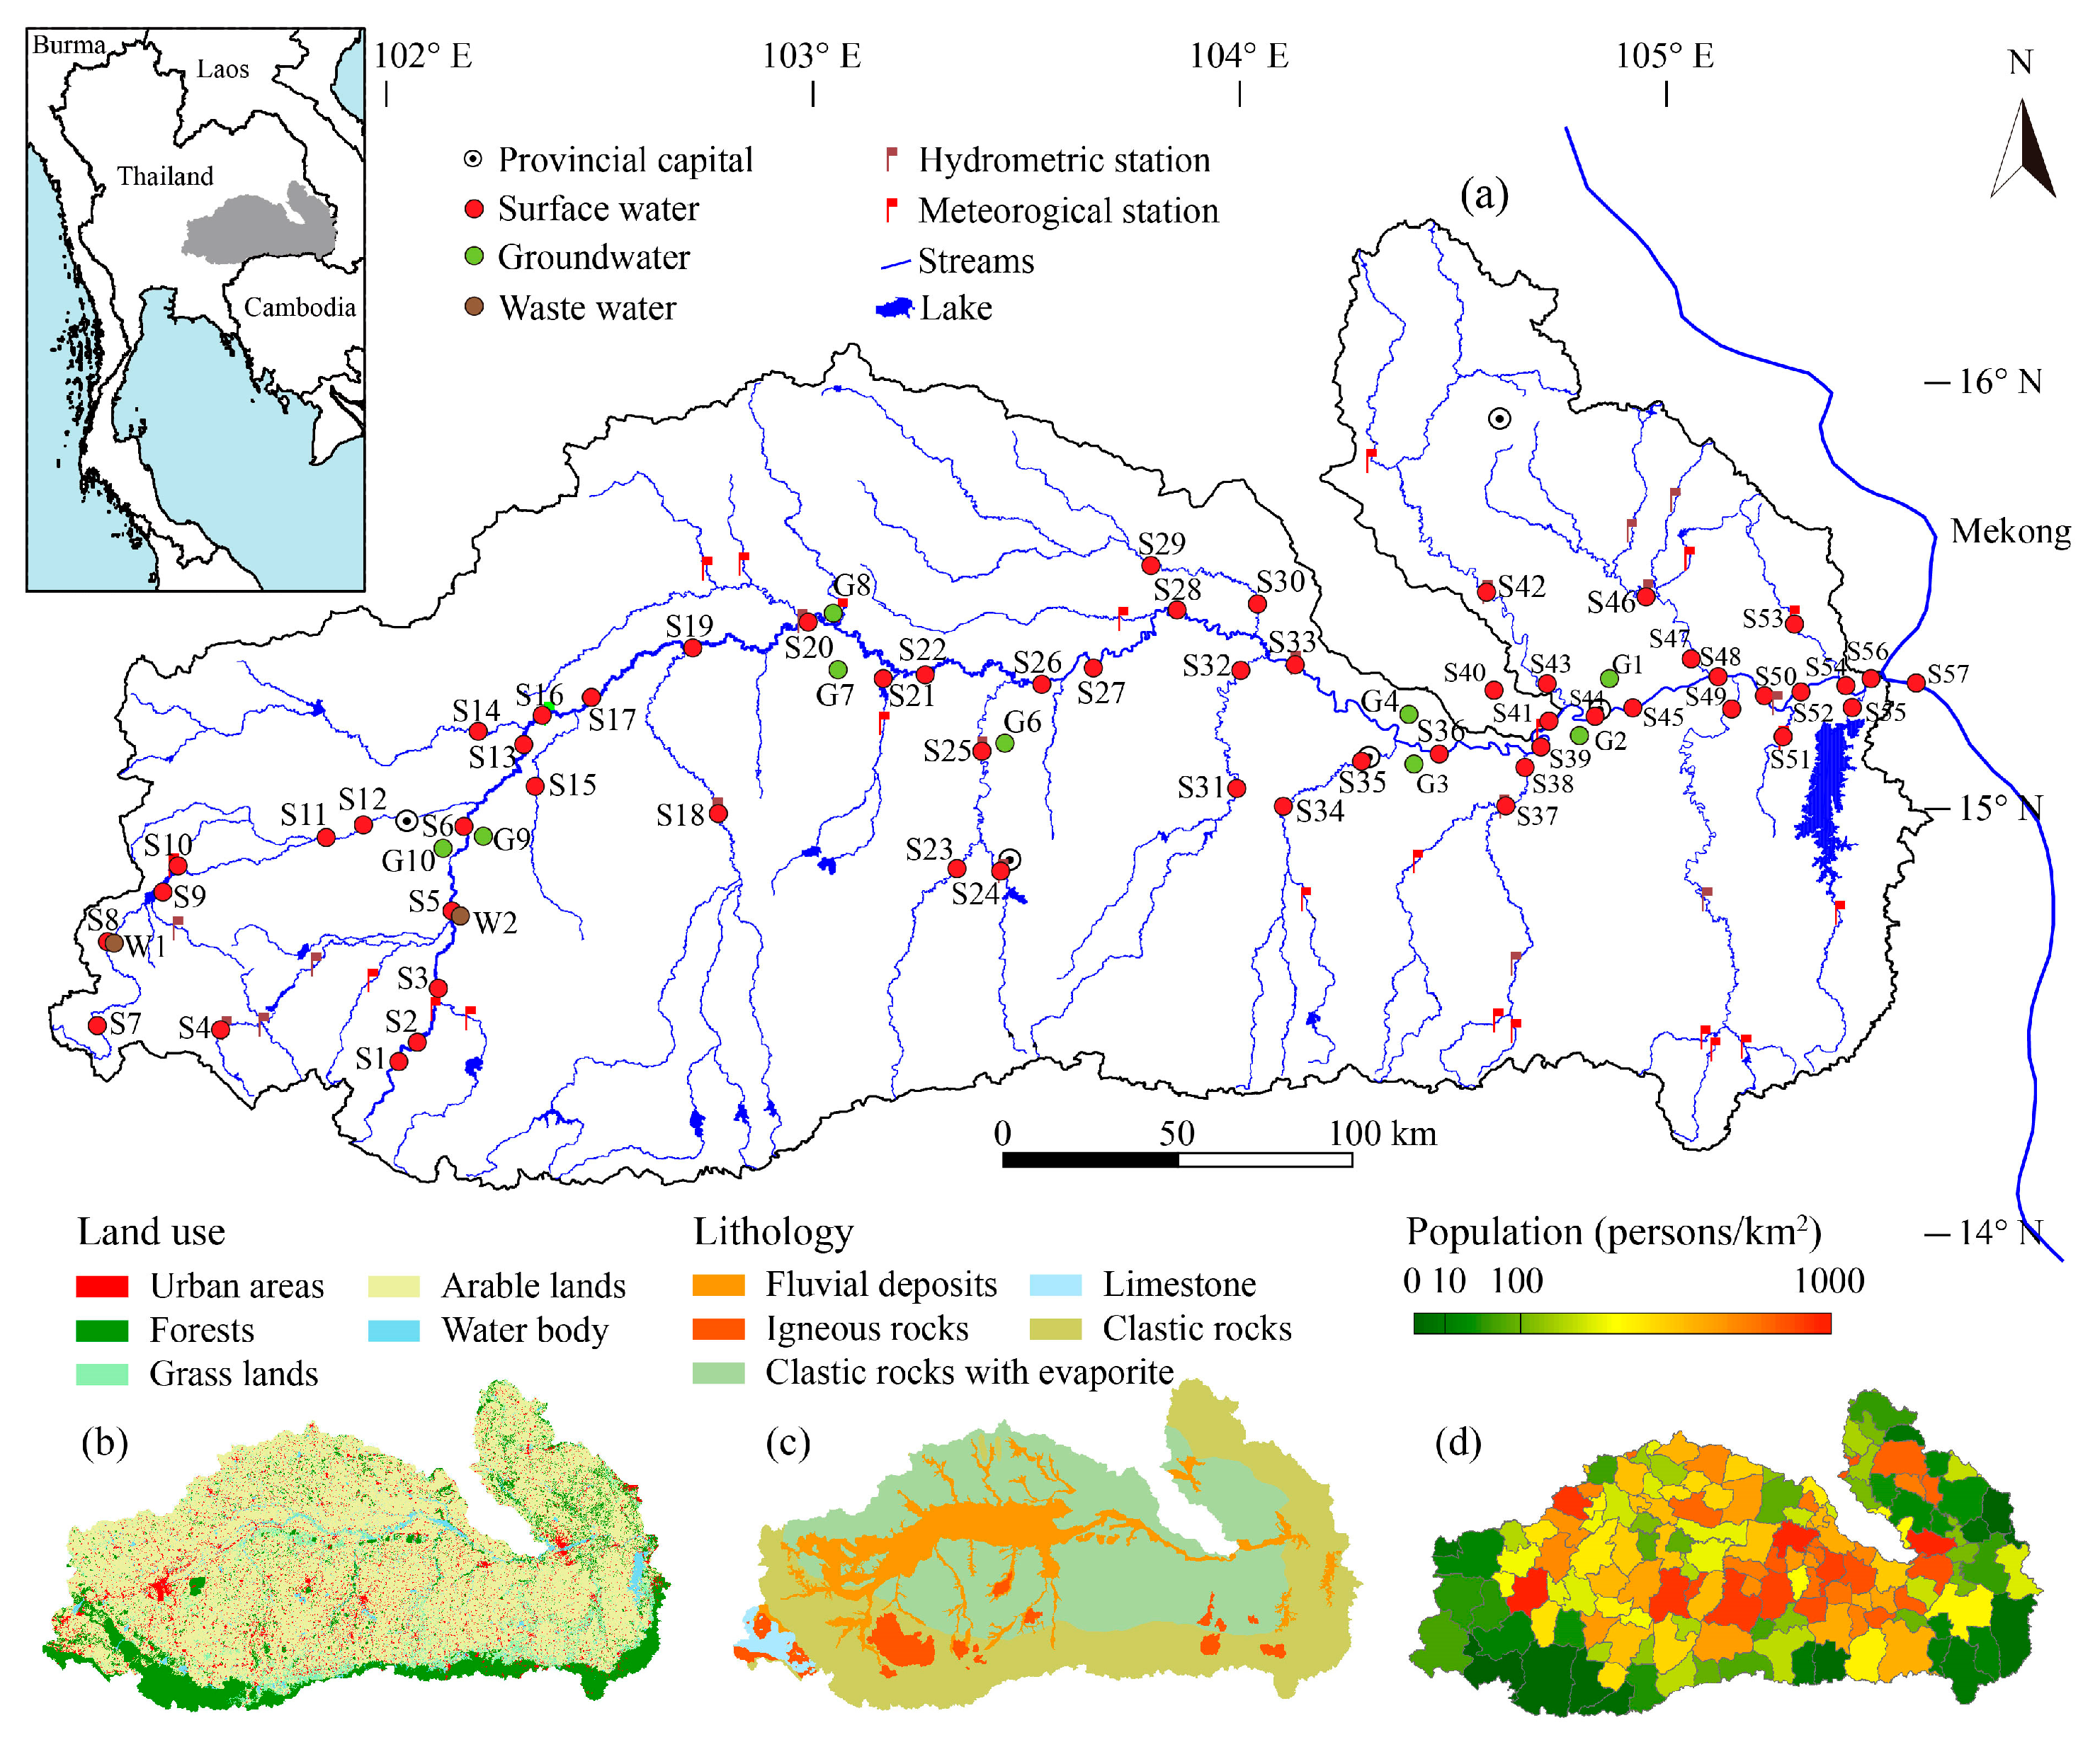
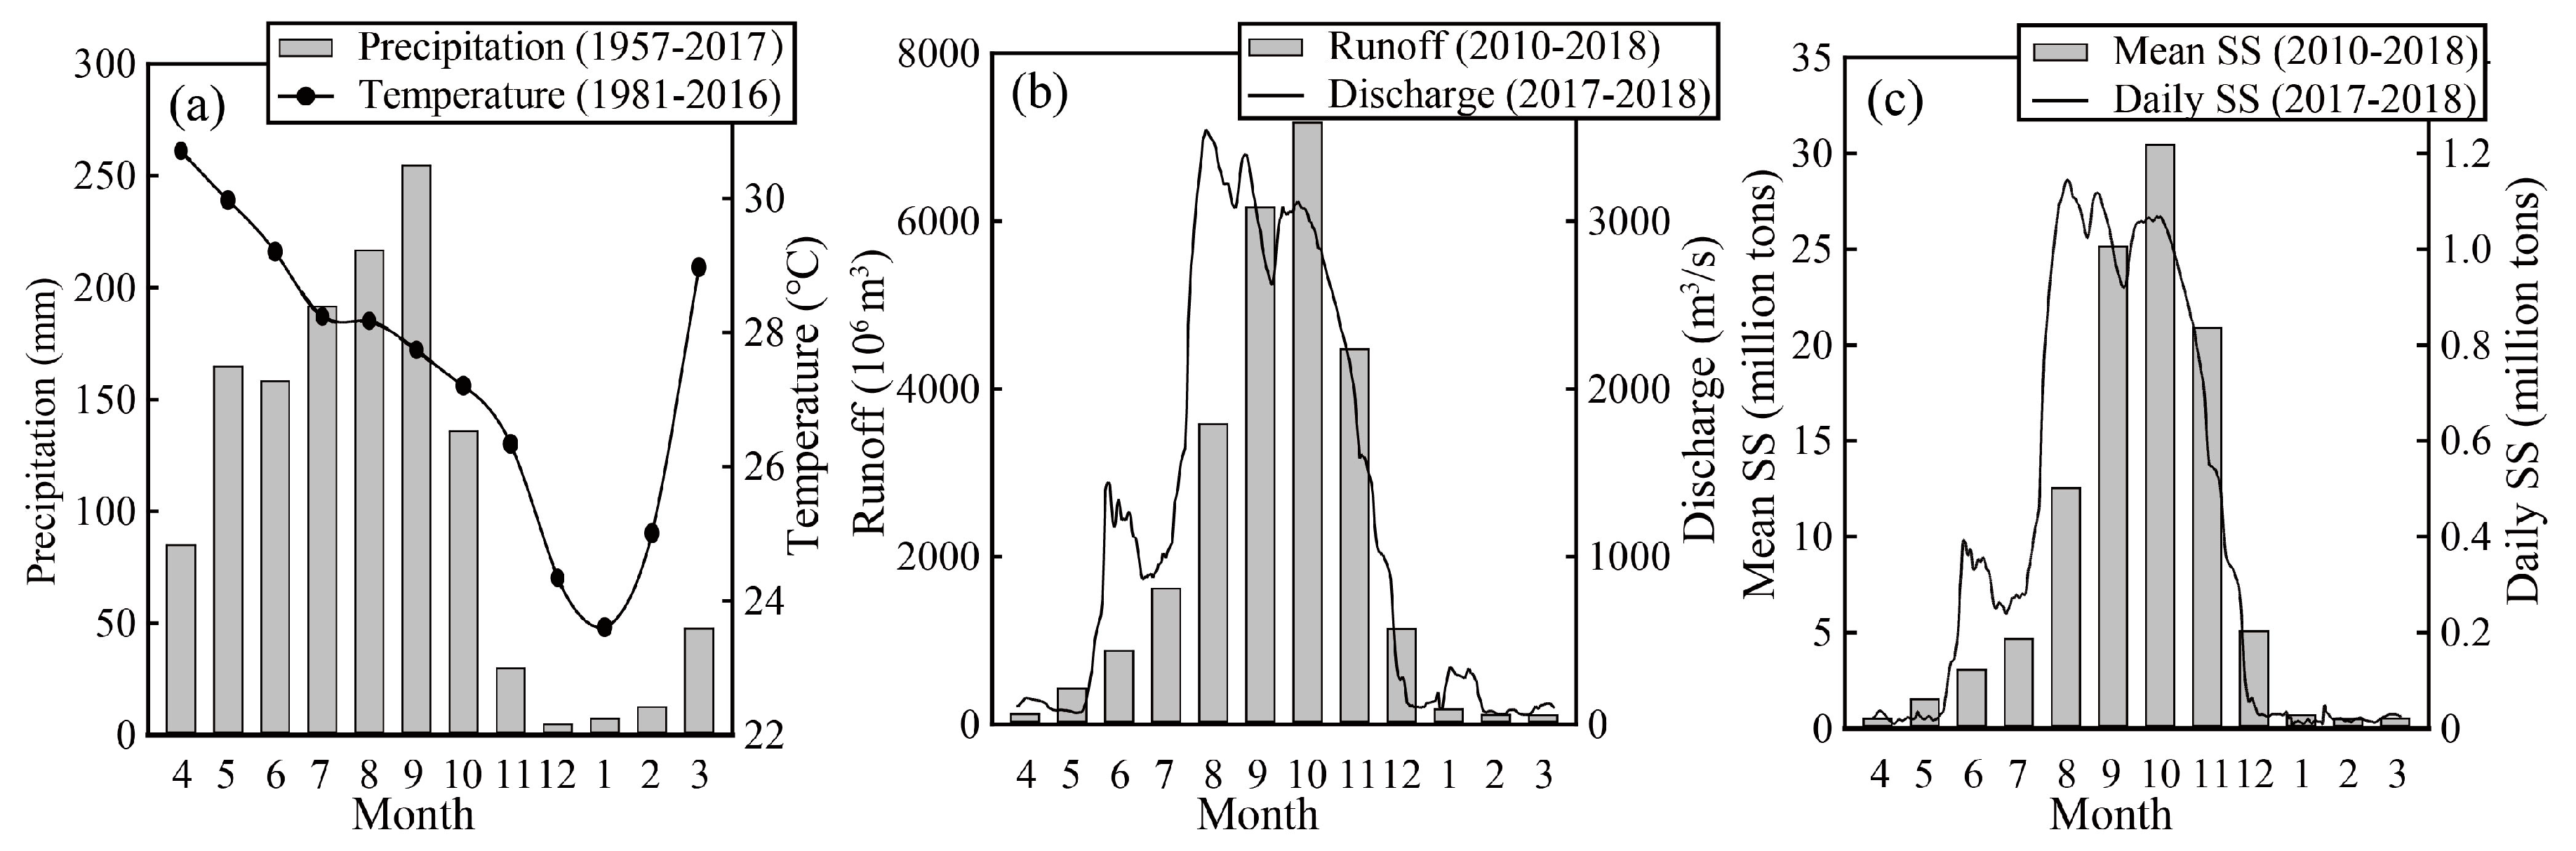
2.1. Study Area

The study area and sample sites were described in detail by the authors of references [22,23]. Briefly, the Mun River lies in the northeast of Thailand between latitudes 14° N to 16° N and longitudes 101°30′ E to 105°30′ E (Figure 1a), the total area is 71,060 square kilometers. It is one of the right tributaries of the Mekong River [24,25]. Thailand is a traditional agricultural country, and agriculture is the largest sector of the economy. Arable land (70.8%) is the main land use type in the study area and others such as forest land (13.5%), grassland (5.3%), urban (including industrial and residential) areas (6.4%), and water body (4.0%) make up a very small percentage (Figure 1b). Most of the arable land (about 75%) in the Mun River Basin is devoted to paddy fields [26]. The study area is mainly occupied by clastic sedimentary rocks of Mesozoic and Quaternary sediments (Figure 1c). Quaternary sediments are mainly semi-consolidated and unconsolidated sediments. There is a small amount of volcanic rock in the south of the basin. Nevertheless, the sum of all limestones is less than 1% of the bedrock geology of the Mun River basin. Thailand has a population of 67 million, of which one third lives in the Northeast, but this area contributes only 10% to the national GDP [27]. The river or stream flows through several urban centers, where the wastewater is not adequately treated. According to government statistics, the population in the study area is mainly concentrated in the middle reaches, and the distribution range is 37 to 601 persons/km2 with an average of 150 persons/km2 in the whole basin (Figure 1d).
The climate of the basin is under the influence of southwest monsoon from mid-May to mid-October and northeast monsoon from mid-October to mid-February. From mid-February to mid-May, this is the transitional period from the southwest to northeast monsoons. The average annual precipitation is 1308 mm with an increasing trend from upstream (1035 mm) to downstream (1616 mm), and the precipitation in the southwest monsoon season (rainy season) accounts for 85.2% of the annual precipitation (Figure 2a). The average monthly temperature throughout the basin ranges from 23.6 °C in January to 30.7 °C in April. The average annual runoff and annual suspended sediment (SS) at the M.11B hydrological station located at outlet of the Mun River are 2.6 × 10¹⁰ m3 and 1.1 × 10⁸ t (Figure 2a,b) (Royal Irrigation Department Thailand, http://hydro-4.rid.go.th).

2.2. Water Sampling and Analysis

All samples in this study were collected in March of 2018. Fifty-six surface water and 2 wastewater samples from the Mun river basin were collected in previous washed containers. One of the wastewater samples (W2) was collected from a sewage pipe in the Khorat Province. Another waste sample was (W1) taken from a rice field where compound fertilizer was added. For comparison, 2 river water samples (S40 and S57) from 2 nearby rivers (Chi and Mekong River) were collected for analysis. In addition, 10 groundwater samples were collected and analyzed in March. The groundwaters were sampled from an existing pumping water well, and depths of this wells ranged from 5 to 30 m. At the sampling points, temperature (T), electrical conductivity (EC), pH, total dissolved solids (TDS), dissolved oxygen (DO), and oxidation reduction potential (ORP) of the water samples were measured using a handheld multi-parameter water meter (YSI Inc., Yellow Springs, OH, USA). Alkalinity was determined on site using a pure HCl titration before filtration. Collected water samples filtered through the cellulose acetate member (Millipore, 0.22 μm), then all samples were stored in pre-cleaned HDPE (high-density polyethylene) bottles.
Major cations ( Mg 2 + , Mg 2 + , K + and Na + ) were analyzed by ICP-OES (Optima 5300DV, PerkinElmer Inc., Waltham, MA, USA), and anions ( SO 4 2 , Cl and NO 3 ) were analyzed using ionic chromatography (Dionex 1100, Sunnyvale, CA, USA) in the Institute of Geographic Sciences and Nature Resources Research, Chinese Academy of Sciences (CAS). Total dissolved inorganic carbon (DIC) in the river included CO2(aq), H2CO3, HCO 3 , and CO 3 2 [17]. Carbon has 2 stables isotopes (12C and13C), and ratios of these isotopes were reported in 10 percentiles relative to the standard Vienna Pee Dee Belemnite (VPDB). The measurements of 13C/12CDIC were conducted using a Thermo Fisher Scientific Isotope Gas Ratio Mass Spectrometer (MAT 252) located in the state key laboratory of environmental geochemistry in Guiyang. Following standard methods [28,29], about a 10 mL sample was injected into glass bottles with 1mL 85% H3PO4. Then generated CO2 was extracted into a vacuum line in the laboratory at 50 °C, while stirring for 10 min. Finally, the CO2 was transferred cryogenically into a tube for isotope measurement, where δ13C (‰) = [(13C/12C) sample/(13C/12C) VPDB − 1] × 1000. Routine δ13CDIC measurements have an overall precision of ± 0.1‰.
In this study, the DIC content, calcite saturation indexes (CSI) and the partial pressure of carbon dioxide (pCO2) were calculated from the major ion concentrations, water temperature, alkalinity, and pH using the program PHREEQC version 2.2. In the program, CSI was calculated using the equation: CSI = Log (IAP/K). In the equation, K is the equilibrium constant of the calcite dissolution reaction and IAP is the ion activity product. If CSI >0, the mineral was supersaturated to the aqueous solution and may deposit calcite or dolomite; if CSI = 0, the mineral and the aqueous solution were in equilibrium; and if CSI <0, the mineral was not saturated to the aqueous solution.

2.3. Data Processing

The map of land use (Figure 1b) was derived from the Ministry of Natural Resource and Environment of Thailand. The geology map (Figure 1c) was based on the “Geological Map of Thailand” (1:250,000); hydrological and geochemical parameters were analyzed by Microsoft Excel (Microsoft, Redmond, WA, USA) and Sigma Plot 12.5 software. In this paper, figures were drawn using Adobe Illustrator CC 2015.3.

3. Results

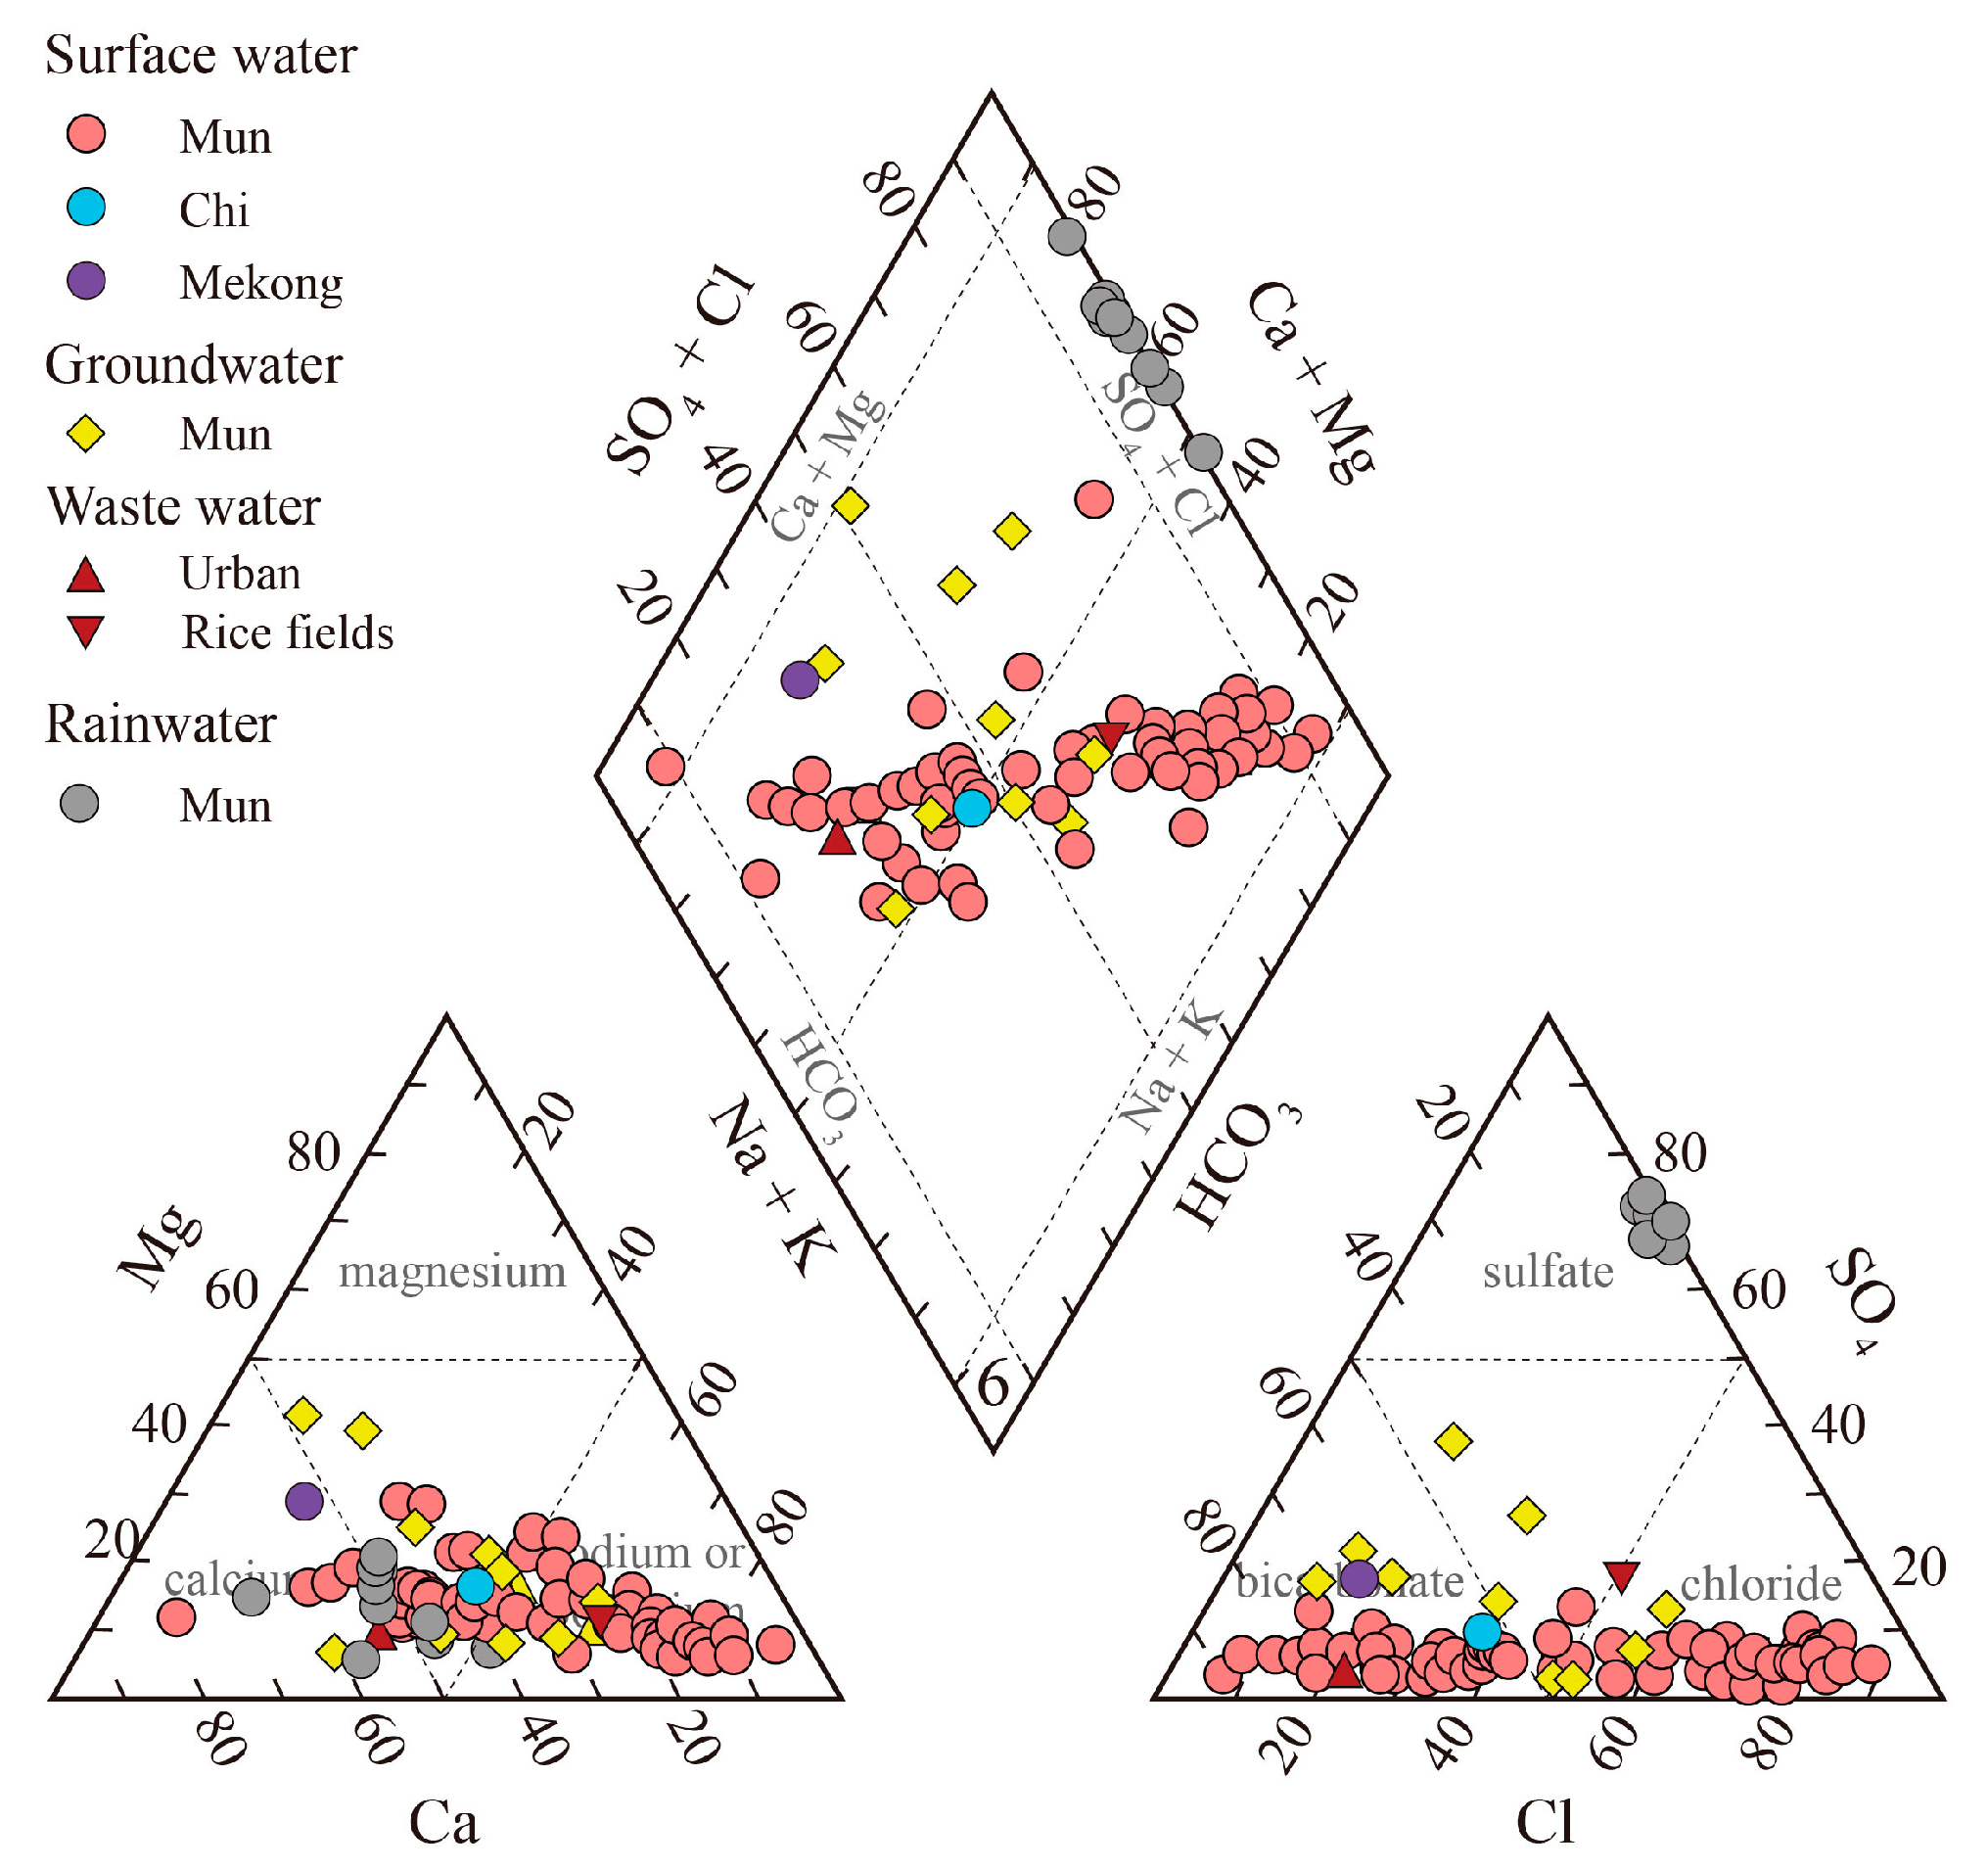
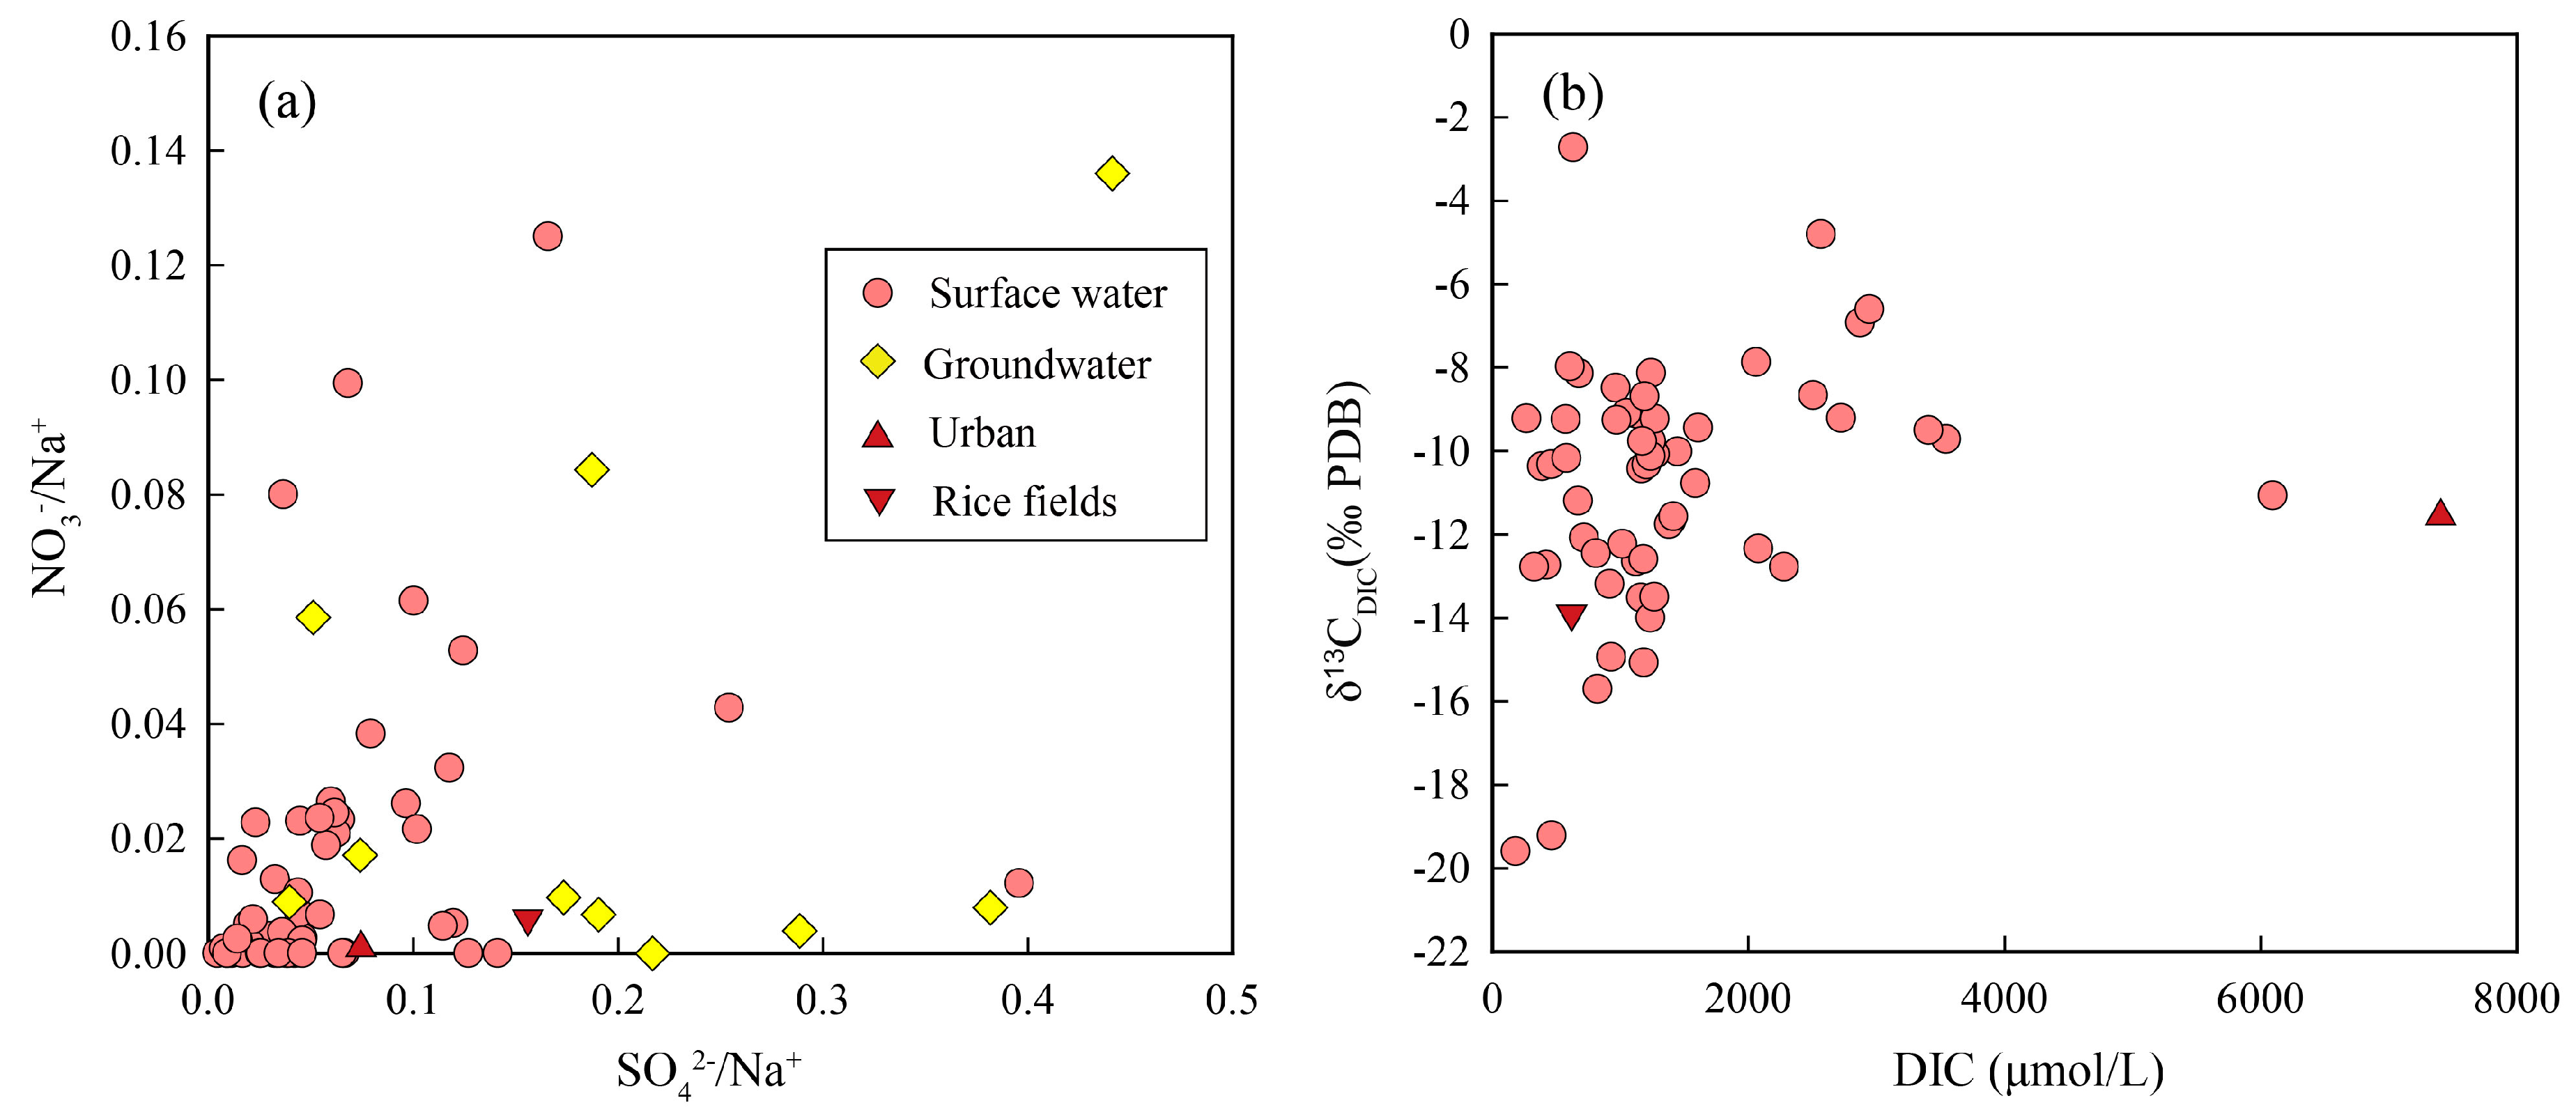
3.1. Geochemistry of the Mun River Water

The physical–chemical parameters of the river water and carbon isotope composition of the dissolved inorganic carbon (δ13CDIC) are listed in the Supplementary material. Surface river water (Mun, Chi, and Mekong River) displayed a temperature range from 24.0 to 33.0 °C (average, 28.6 °C) with pH ranging from 6.1 to 8.5 (average, 7.4). Groundwaters were cooler (24.0 to 24.9 °C), and have a lower pH (4.7 to 7.3, average 6.5) compared with the surface water. Measured TDS in the field showed significant spatial variations from 15 to 1502 mg/L (average, 297 mg/L). From upstream to downstream, TDS increased first and then decreased due to the import of the Chi River and peak appeared in the middle reaches. In the main channel, EC had similar spatial variation characteristics with TDS and from 23 μS/cm to 2452 μS/cm. Compared with TDS and EC, ORP and DO showed small spatial changes. The observed ORP values in most of samples (average of 165 mV) were positive except from one urban waste sample (W2) in the upstream. Urban sewage contained the lowest DO value (1.6 mg/L) of the whole sample. Groundwaters had higher TDS values (36 to 1359 mg/L, average of 598 mg/L) and EC value (47 to 3166 μS/cm, average of 1093 μS/cm). However, ORP and DO in the groundwaters were similar to the surface waters.
The major ions of surface water and groundwaters were plotted in Figure 3. The average content (μmol/L) of the major ions was in the order of Na + > Ca 2 + > Mg 2 + > K + for the cations and Cl > HCO 3 > SO 4 2 > NO 3 for the anions in the surface water samples. The plots indicate that most of the surface and groundwater samples were dominated by Na + for cations and Cl or HCO 3 for anions. The concentration of other cations such as Mg 2 + and Ca 2 + was less than 20% of the sum of the major cations. For anions, the sum of SO 4 2 and NO 3 only contributes about 15% of the total anions in the surface and groundwater samples.

3.2. DIC System and δ13CDIC Values

In the surface water samples, the DIC content ranged from 185 to 5897 μmol/L (average as 1376 μmol/L). In most of the samples, bicarbonate was the main component of DIC, accounting for about 82% of DIC, and the rest was mainly composed of dissolved carbon dioxide as they were more acidic samples. Urban domestic sewage contained abnormally high DIC (7397 μmol/L), and HCO 3 was the dominant species (92.4%). Compared with the average of surface water in the same period, farmland water showed lower DIC concentration (632 μmol/L). Chi and Mekong had similar DIC concentrations 1297 μmol/L and 1669 μmol/L, respectively. In groundwaters, the concentrations of DIC (1669 to 17,551 μmol/L, average 8793 μmol/L) were significantly higher than surface water. In most samples, the partial pressure of CO2 (pCO2) was above the atmospheric level (400 ppm). The CSI results of the most of samples were below zero, indicating that the water was undersaturated with CaCO3.
The carbon isotopic compositions (δ13CDIC) of the surface water ranged from −19.6‰ to −2.7‰ in the dry season. Chi and Mekong had similar δ13CDIC values to Mun River. Urban sewage and farmland water from rice field did not show abnormal carbon isotope values (−11.4‰ and −13.8‰, respectively). Although the DIC concentration and carbon dioxide partial pressure pCO2 varied greatly, the δ13CDIC values of groundwater samples were relatively consistent, and the average value was −16.9 ± 1.4‰ (n = 9) except from G1 (δ13CDIC = −9.3‰).

4. Discussion

4.1. Sources of Groundwater DIC

In the Mun River, pCO2 values in groundwater were generally higher, more than 10,000 μatm. Groundwater recharge may be the main source of DIC in the surface water, especially in the dry season. Carbonate dissolution mainly occurs in groundwater by reaction with H2CO3 produced from CO2 in the soil rather than the atmosphere [30]. Soil CO2 is mainly derived from the respiration of microbial and plant, a minor amount of atmospheric CO213C = −8‰) may be mixed in the shallow layer of the soil [30]. Respiration is a chemical process in which an organism oxidizes and decomposes organic matter in cells and produces energy, at the same time producing carbon dioxide (respired CO2) with approximately the same δ13C value to soil organic matter [31]. In the study area, the soil organic carbon (SOC) had δ13C values of −28‰ to −25‰ (unpublished data), this SOC isotopic range reflects C3 photosynthesis, probably by rice. Most studies have found that due to the different molecular diffusion rates of 13CO2 and 12CO2, δ13C values of soil CO2 is higher than of the organic matter, which is about 4‰ enrichment [32,33,34], the δ13C values of carbon dioxide from the oxidation of soil organic matter with δ13C (−28‰ to −25‰) will be −24‰ to −21‰ (average, −22‰). Zhao, et al. [35] have reported that the average soil pH value is 6 in the Mun River Basin, thus the predominant carbon species in soil water is carbonic acid [16].
Moreover, the dissolution of soil CO2 into soil water produces a further fractionation about 1‰ at 25 °C [17]. Thus, the predicted δ13CDIC of the soil water were −23‰ to −20‰ at pH = 6 and 25 °C. Based on the above discussion, it can be inferred that the δ13C values of HCO 3 from silicate weathering with soil CO2 would range from −23‰ to −20‰, which was lower than the measured average value (−16.9 ± 1.4‰) of groundwater. Because δ13C of carbonate is almost equal to zero, thus weathering of such carbonates with CO2 from soil would produce a positive δ13CDIC of −11‰ compared with soil CO2. The expected δ13CDIC in the process of carbonate weathering was higher than the measured amount. Most of the groundwater samples had δ13CDIC values in the range −19.0‰ to −15.1‰, it shows that the DIC in these groundwaters was mainly derived both from the weathering of silicates and carbonates (Figure 4). In addition, the concentration of carbon dioxide in the soil zone was much higher than the atmosphere and groundwater. Under open system, the δ13CDIC values of groundwater will tend to more negative due to continued isotopic exchange with carbon dioxide in the soil.

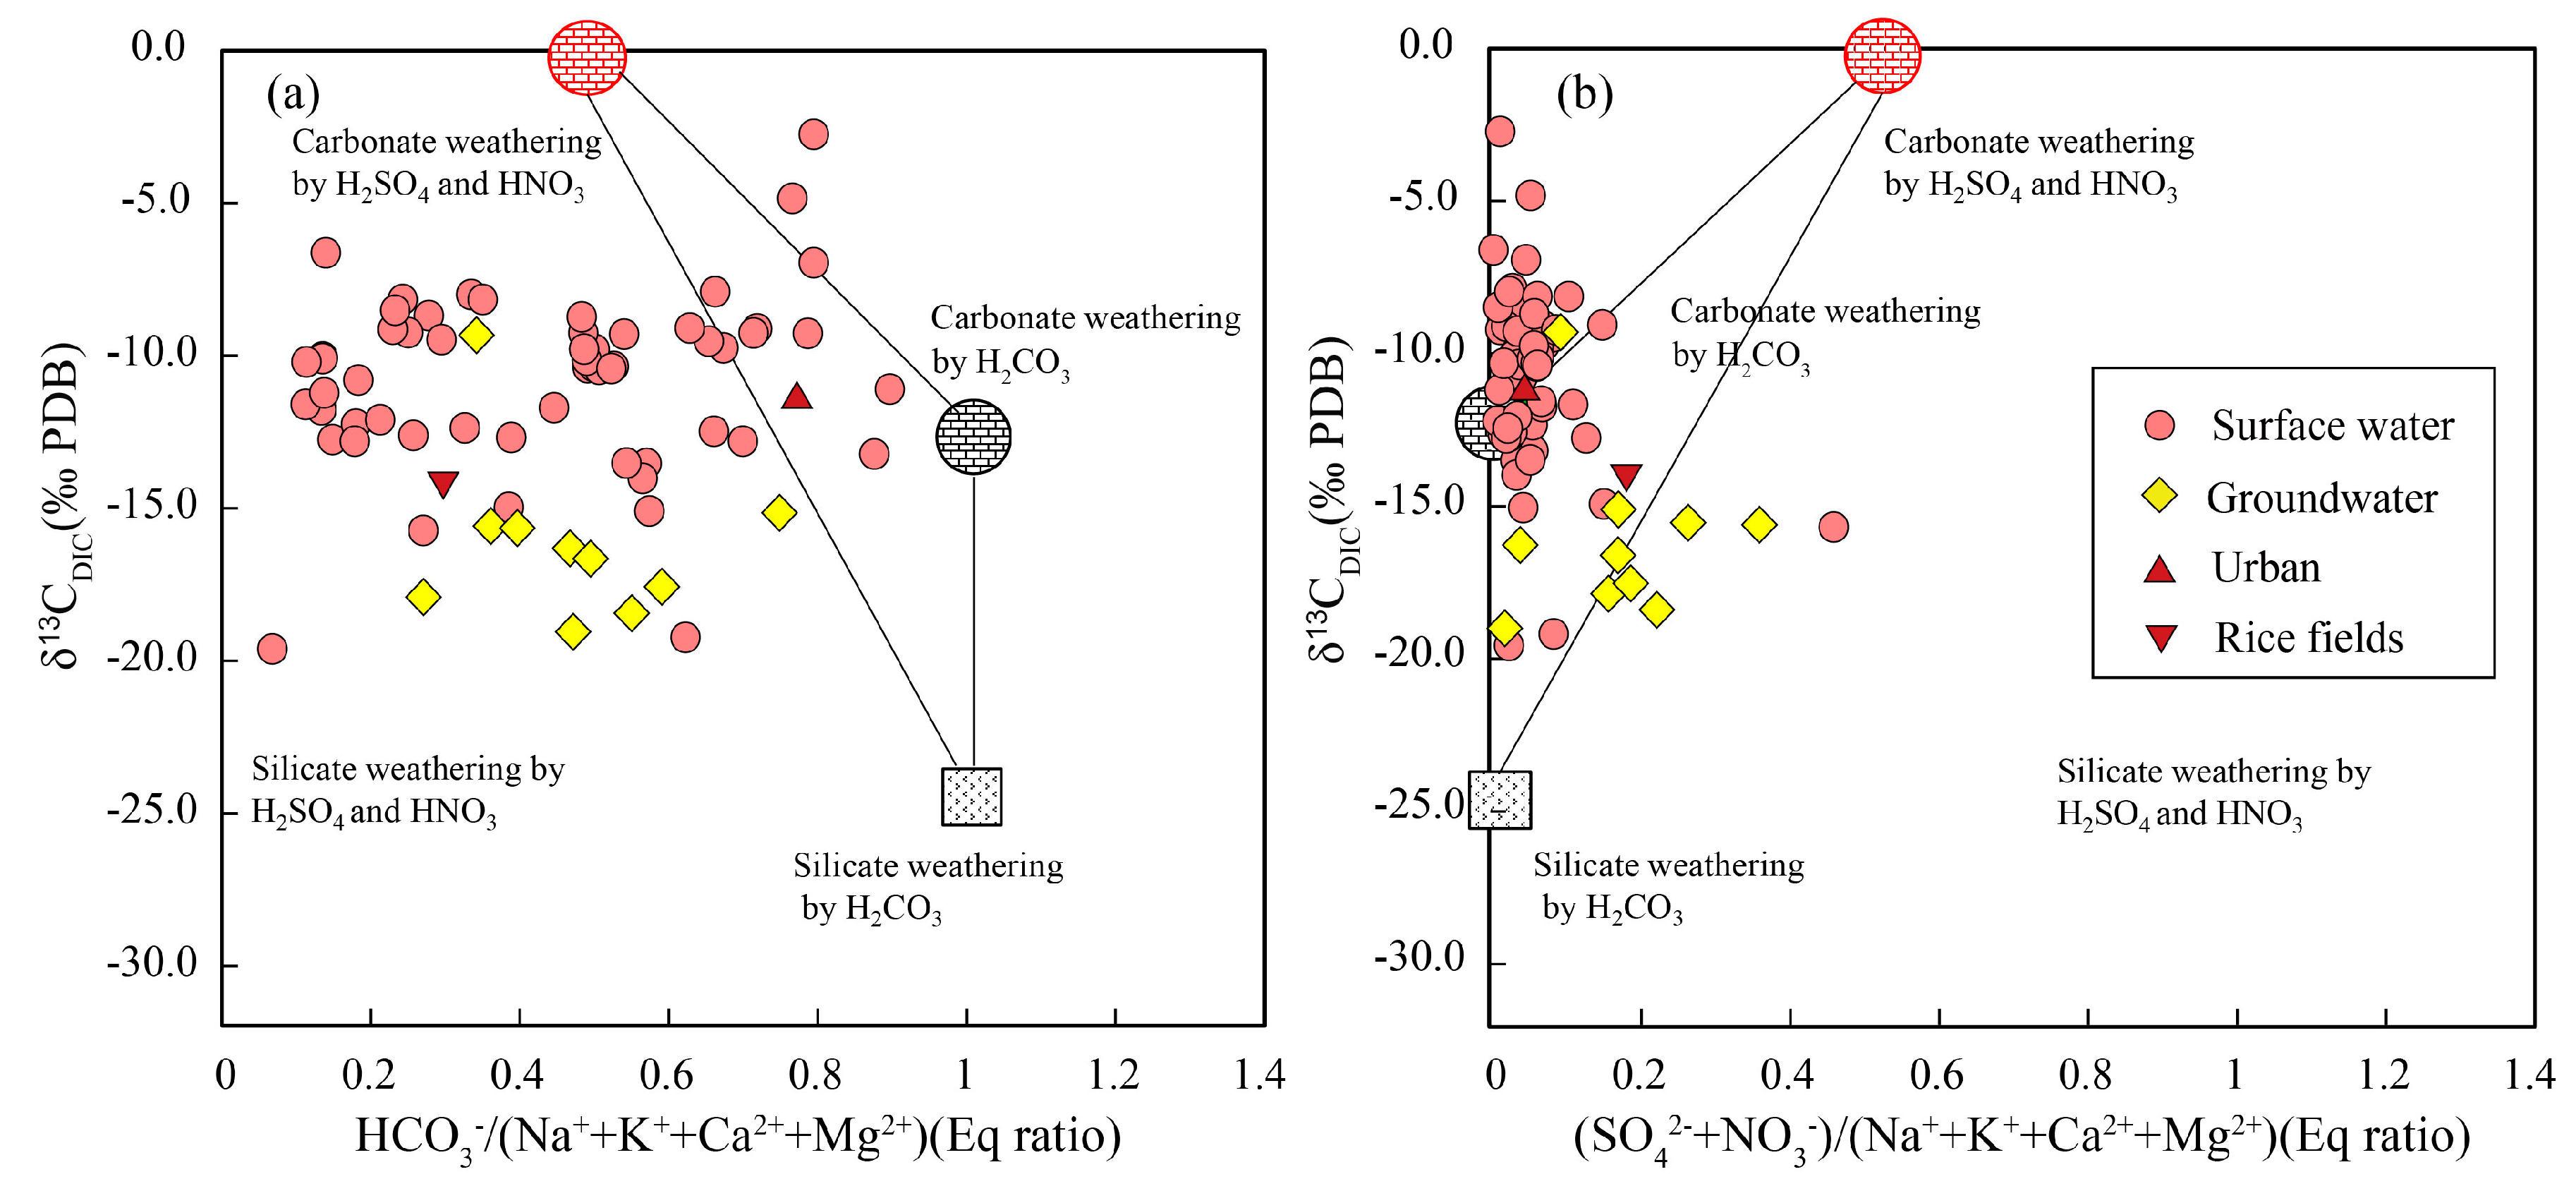
4.2. Rock Weathering Versus the δ13CDIC Values

Chemical weathering of silicates and carbonates is a key process for the carbon cycling at the Earth’s surface [36,37,38,39,40]. Chemical weathering is the major source of elements delivered by rivers to the oceans [41]. Carbonic acid usually accelerates silicate weathering, for instance, the incongruent dissolution of sodium feldspar to clay kaolinite by carbonic acid:
2 NaAlSi 3 O 8 ( s ) + 9 H 2 O + 2 H 2 CO 3 ( aq ) = Al 2 Si 2 O 5 ( OH ) 4 ( s ) + 2 Na + ( aq ) + 2 HCO 3 + 4 H 4 SiO 4 ( aq )
As discussed previously, the carbonic acid is most likely to be produced in the soil, where pCO2 values are much higher than the atmosphere [6,17,20]. Thus, the δ13CDIC values in reaction (1) is similar to the estimated value of carbonic acid (−23‰ to −20‰). However, carbonate weathering is much faster than silicate weathering under the same conditions. Consequently, even in many carbonate-poor catchments and minor carbonate mineral weathering may also occur [42,43,44]:
CaCO 3 + H 2 O + CO 2 ( aq ) = Ca 2 + ( aq ) + 2 HCO 3 ( aq )
There is only a small amount of carbonate in the upper reaches of the Mun River, these marine carbonates probably have δ13CDIC values close to 0‰. Weathering of such carbonate via reaction (2) would produce DIC with a δ13CDIC value of −12‰ to −10‰. These predicted δ13CDIC values are matched to the value of δ13CDIC in the dry season. Although H2CO3 weathering is common, it is not the only one. Anthropogenic acid (sulfuric and nitric acid) also actively participates in the rock weathering process [7,45,46,47]. For example, anthropogenic emissions of SO2 from coal combustion will produces H2SO4 that can then accelerate carbonate weathering:
CaCO 3 + H 2 SO 4 = 2 Ca 2 + ( aq ) + 2 HCO 3 ( aq ) + SO 4 2
In this case, all carbon produced is derived from the carbonate and the δ13CDIC value is similar to the carbonate minerals. Based on the above discussion, DIC from different weathering processes in the Mun River were plotted in Figure 5. Most water samples deviate from the three end-member mixing region and towards the silicate weathering by sulfuric and nitric acid area. Acid rain accelerates rock weathering and the role of the anthropogenic sourced acid (sulfuric and nitric acid) on silicate weathering is not negligible in the Mun River Basin.

4.3. Carbon Isotopic Composition of Anthropogenic DIC

As one of the important agricultural production areas and population gathering place in Thailand, the chemistry of the Mun River water could be significantly impacted by human activities [8,48]. TDS reflects both the different lithologies drained by the river but also can be influenced by human activities on the water quality [6]. Higher TDS were mainly found in the middle reaches, which may be related to the dense population in the middle reaches. In addition, K + , Na + , Cl , NO 3 , and SO 4 2 are usually related to agricultural fertilizers, animal waste, and sewage in the river. If we focus on the mainstream, we can observe a sharp increase in Cl , NO 3 , and SO 4 2 concentration in the middle of the river and this increase can mainly be related to the fertilizers used for agriculture. The case of chlorine is also characteristic but less obvious due to the contribution of evaporites dissolution in the study area. Calcium, Mg 2 + , and HCO 3 are conventionally considered to be insensitive to human pollution [9]. To assess the impact of the urban and agricultural wastewater on river water, the waste water samples were collected from sewage pipe in Khorat Province and the rice field. Figure 6a shows the relationships between the molar ratios NO 3 / Na + , SO 4 2 / Na + for the river waters. Two wastewater samples were characterized by low NO 3 / Na + concentrations, and the values were approximately 0. The SO 4 2 may originate from various sources, such as oxidation of sulfides, the dissolution of gypsum, and acid deposition [41]. Higher DIC concentrations (7397 μmol/L) and medium δ13CDIC value (−11.4‰) were found in the urban sewage sample (Figure 6b), and this large amount of untreated sewage discharged from rural areas may have a huge impact on concentrations of DIC and δ13CDIC. Shin, et al. [49] reported that δ13CDIC values of detergents measured in three streams in a South Korean study ranged from −12.0 to −6.5‰. Therefore, in urban streams, detergent may be an important source of river water DIC.

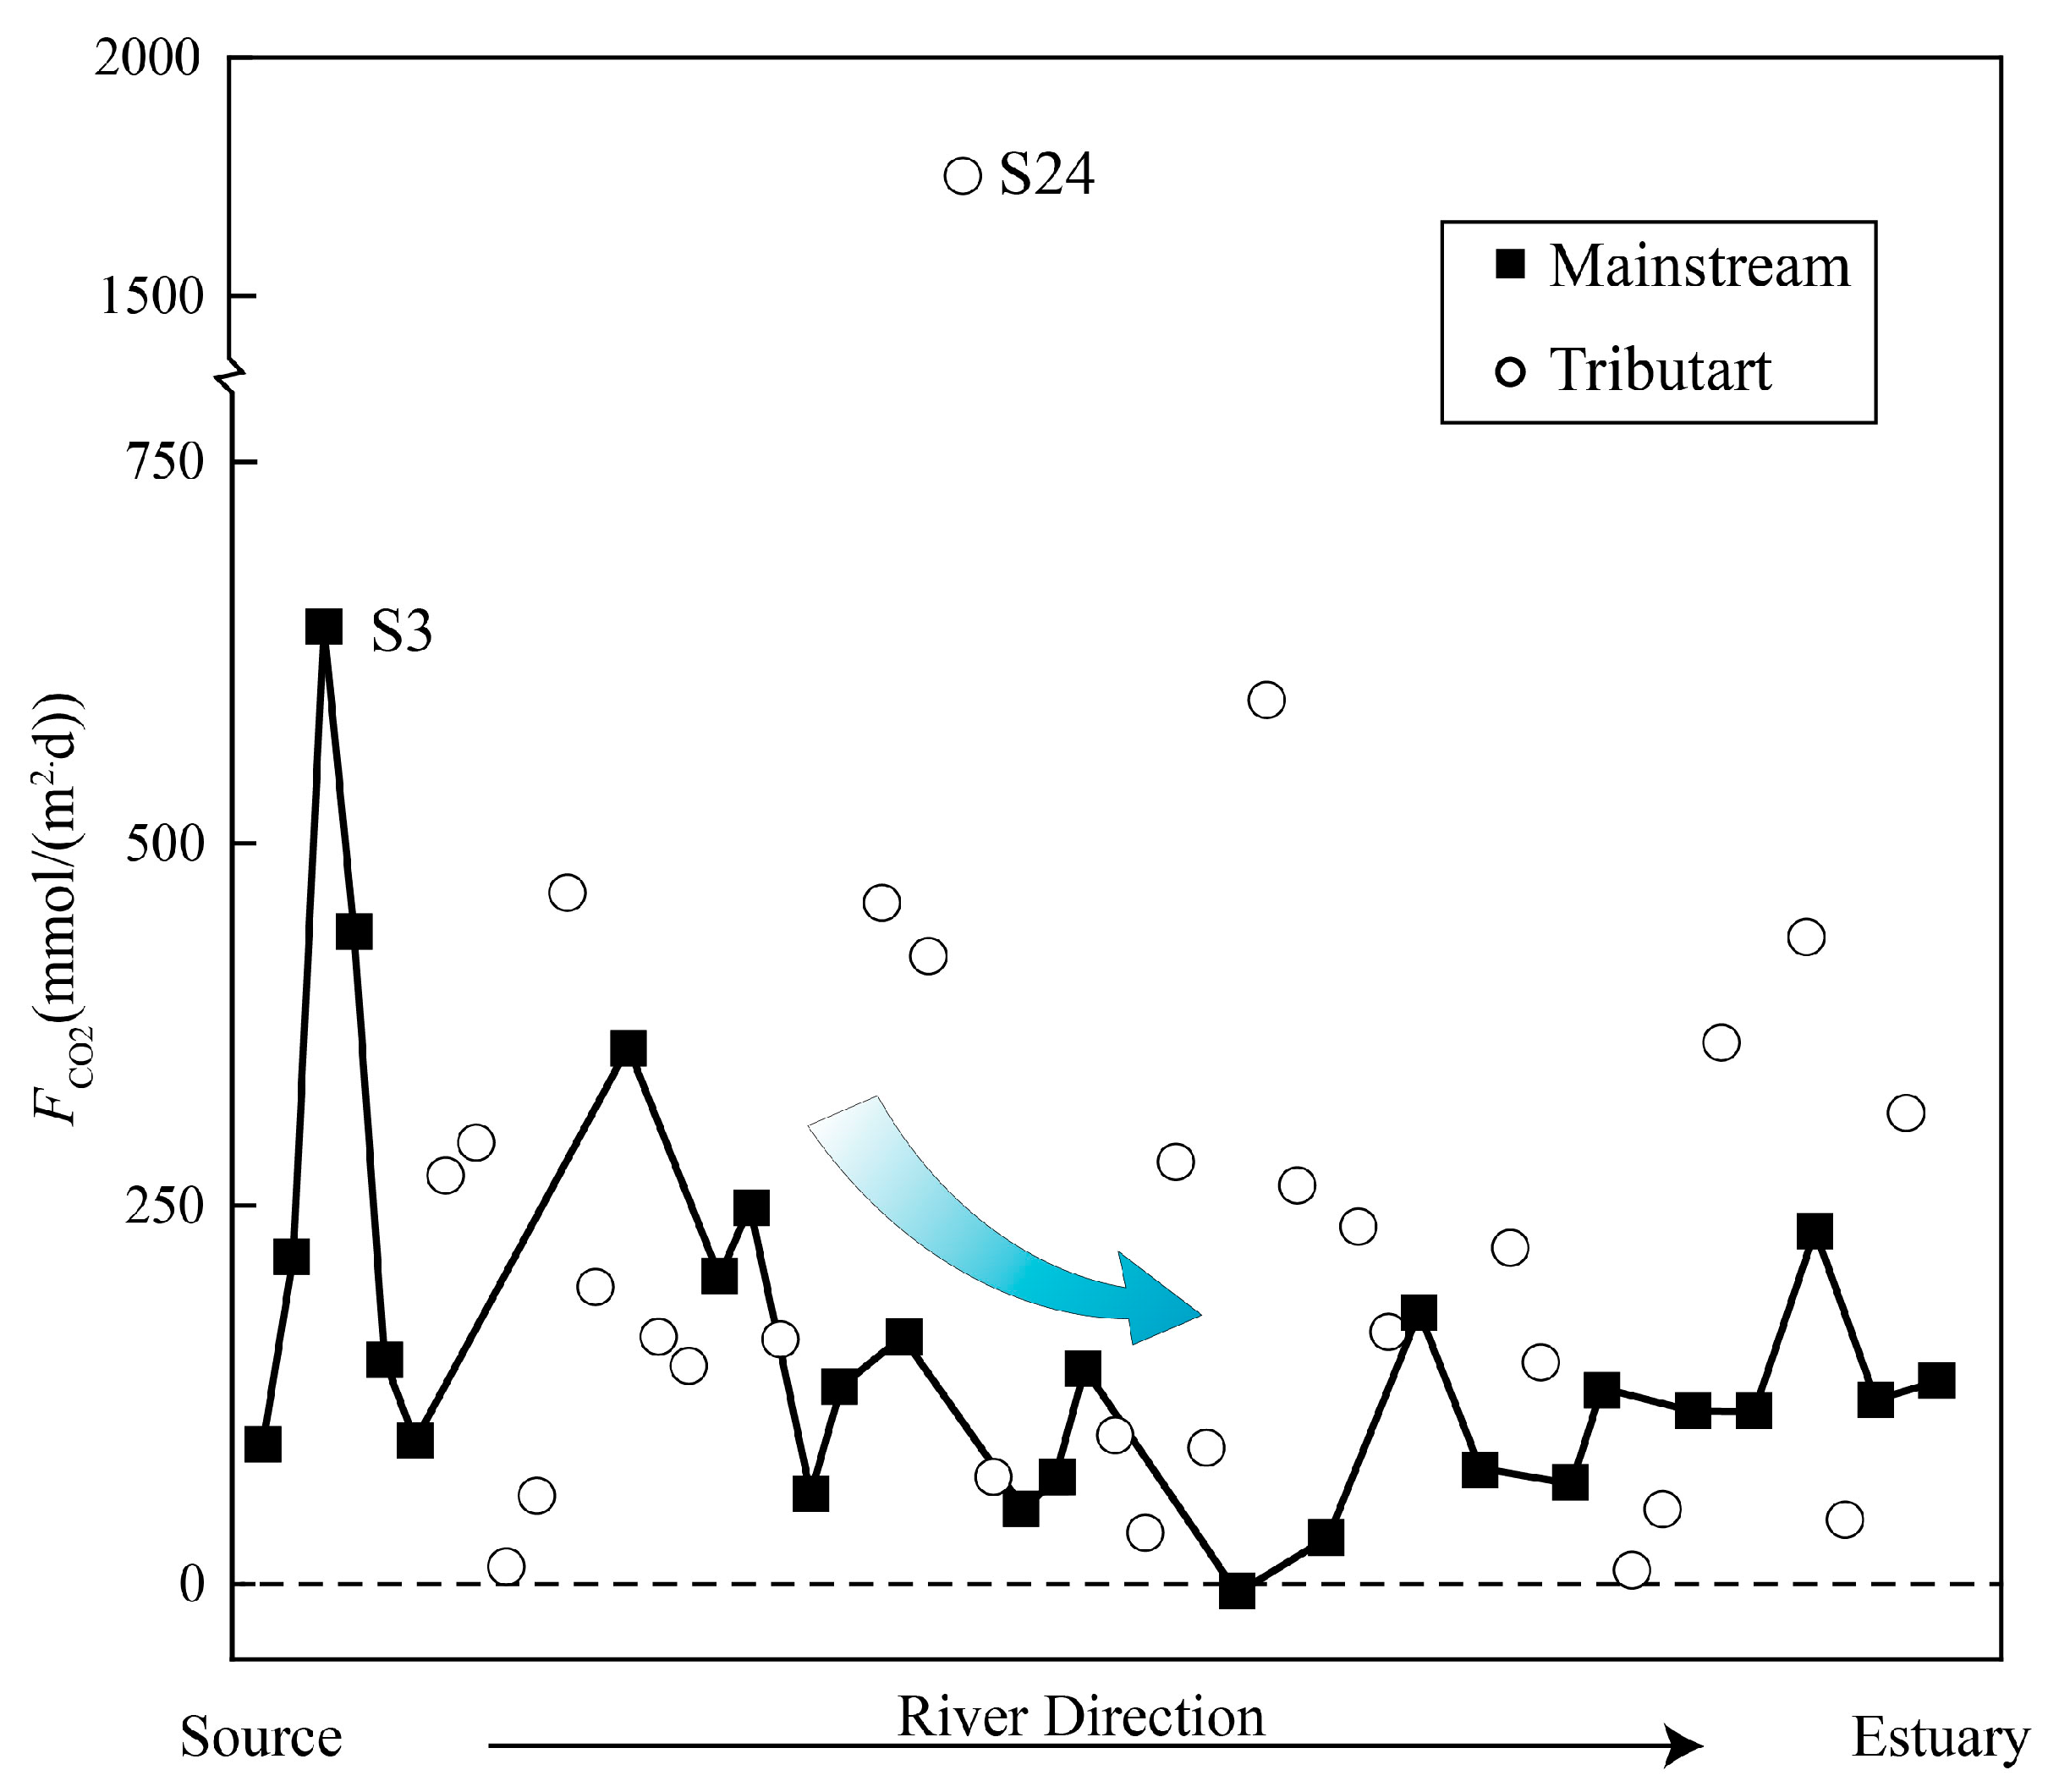
4.4. DIC Evasion from the River System

Carbon dioxide will spread out of the river through the water-air interface when the pCO2 in the river water is greater than the partial pressure of carbon dioxide in the surrounding atmosphere. With the loss of CO2, the isotopic composition of the remaining DIC has changed accordingly [15]. In this study, carbon dioxide fluxes through the water-air interface were estimated using the following equation:
FCO2 = k × (Cwater − Cair)
where FCO2 is the CO2 flux through the water-air interface, k is the gas transfer velocity (cm/h), Cwater and Cair is the CO2 concentration in the water and air, respectively. Cwater and Cair are typically calculated from the CO2 solubility, KH (mol/m·atm), and the partial pressure of CO2 (pCO2, μatm) in the water (pCO2w) and air (pCO2a), respectively (i.e., Cw,a = KH × pCO2w,a). Positive values of FCO2 represent fluxes from the water to air, and negative FCO2 values indicate CO2 invasion from air to water. The atmospheric CO2 concentration 445 ppmv was used here, and K is a temperature-dependent Schmidt number (ScT) for fresh water [13]:
k = k600 × (ScT/600) − 0.5
With
ScT = 1911.1 − 118.11T + 3.4527T2 − 0.04132T3
where T is the in-situ water temperature (°C), and k600 is the K for CO2 at 20 °C in freshwater. For small streams, we use k600 = 13.82 + 0.35w, where w is the water flow rate (cm/s). For the main channel (width >100 m), we use k600 = 4.46 + 7.11 × −u10. Where −u10 is the wind speed 10 m above rivers. Due to the lack of in-situ wind speed data, here the wind speed data of the nearest meteorological department were used to approximately replace the wind speed 10 m above the rivers.
Spatial changes occur in the direction and magnitude of FCO2 (Figure 7). The source region generally had high carbon dioxide flux. The evasion fluxes for the source region in this study show that the evasion of carbon from tropical rivers is not to be ignored. In the dry season, fluxes varied from −6 to 1826 mmol/(m2·d) with an average of 240 mmol/(m2·d). FCO2 values from the Mun River are similar to values from other tropic rivers (Table 1). The observed spatial differences, combined with the changes in other rivers around the world, indicate that carbon dioxide evasion in tropical rivers is huge but there are also large uncertainties.

5. Conclusions

Most of the surface and groundwater samples were dominated by Na + and HCO 3 . The concentration of other cations (such as Mg 2 + and Ca 2 + ) is less than 50% of the sum of the major cations. For anions, the sum of SO 4 2 , Cl , and NO 3 only contributes about 45% of the total anions in all the samples. In the surface water samples, the DIC content ranged from 185 to 5897 μmol/L (average 1376 μmol/L) in the Mun River. In most of the samples, bicarbonate was the main component of DIC, accounting for about 82% of DIC, and the rest is mainly composed of dissolved carbon dioxide due to it containing more acidic samples. Urban domestic sewage contains abnormally high DIC (7397 μmol/L), and HCO 3 was the dominant species (92.4%).
The carbon isotopic compositions (δ13CDIC) of surface water ranged from −19.6‰ to −2.7‰. Urban sewage and farmland water did not show abnormal carbon isotope values (−11.4‰ and −13.8‰, respectively). In spite of the high variability in DIC concentrations and pCO2, the δ13CDIC values of the groundwater were relatively consistent, with a mean value of −16.9 ± 1.4‰ (n = 9). Spatial changes occured in the direction and magnitude of FCO2. In the dry season, fluxes varied from −6 to 1826 mmol/(m2·d) with an average of 240 mmol/(m2·d). In addition to the dominant control on hydrochemistry and dissolved inorganic carbon isotope composition by the rock weathering, the impacts from anthropogenic activities were also observed in the Mun River, especially higher DIC concentration of waste water from urban activities. These human disturbances may affect accurate estimate contributions of carbon dioxide from tropical rivers to the atmospheric carbon budgets.

Supplementary Materials

The following are available online at https://www.mdpi.com/1660-4601/16/18/3410/s1, Table S1: The physical–chemical parameters and major ions concentration in the Mun River, Table S2: DIC system and carbon isotope composition of surface water and groundwater.

Author Contributions

Conceptualization and data curation, X.L. and G.H.; software, X.L.; project administration, G.H., investigation, K.Y., G.H., M.L., C.S., Q.Z., X.L. and J.L.; writing—review and editing, X.L.; writing—original draft preparation, X.L.

Funding

This study was financially supported by National Natural Science Foundation of China (No. 41661144029; 41325010).

Acknowledgments

The authors gratefully acknowledge Fairda Malem from the Ministry of Natural Resource and Environment of Thailand.

Conflicts of Interest

The authors declare no conflict of interest.

References

  1. Raymond, P.A.; Hartmann, J.; Lauerwald, R.; Sobek, S.; McDonald, C.; Hoover, M.; Butman, D.; Striegl, R.; Mayorga, E.; Humborg, C.; et al. Global carbon dioxide emissions from inland waters. Nature 2013, 503, 355–359. [Google Scholar] [CrossRef] [PubMed] [Green Version]
  2. Dubois, K.D.; Lee, D.; Veizer, J. Isotopic constraints on alkalinity, dissolved organic carbon, and atmospheric carbon dioxide fluxes in the Mississippi River. J. Geophys. Res. Biogeosci. 2010, 115, 1–11. [Google Scholar] [CrossRef]
  3. Duvert, C.; Butman, D.E.; Marx, A.; Ribolzi, O.; Hutley, L.B. CO2 evasion along streams driven by groundwater inputs and geomorphic controls. Nat. Geosci. 2018, 11, 813–818. [Google Scholar] [CrossRef]
  4. Campeau, A.; Bishop, K.; Nilsson, M.B.; Klemedtsson, L.; Laudon, H.; Leith, F.I.; Öquist, M.; Wallin, M.B. Stable Carbon Isotopes Reveal Soil-Stream DIC Linkages in Contrasting Headwater Catchments. J. Geophys. Res. Biogeosci. 2018, 123, 149–167. [Google Scholar] [CrossRef]
  5. Li, S.; Lu, X.X.; Bush, R.T. CO2 partial pressure and CO2 emission in the Lower Mekong River. J. Hydrol. 2013, 504, 40–56. [Google Scholar] [CrossRef]
  6. Gaillardet, J.; Dupre, B.; Louvat, P.; Allegre, C.J. Global silicate weathering and CO2 consumption rates deduced from the chemistry of large rivers. Chem. Geol. 1999, 159, 3–30. [Google Scholar] [CrossRef]
  7. Han, G.; Liu, C.-Q. Water geochemistry controlled by carbonate dissolution: A study of the river waters draining karst-dominated terrain, Guizhou Province, China. Chem. Geol. 2004, 204, 1–21. [Google Scholar] [CrossRef]
  8. Regnier, P.; Friedlingstein, P.; Ciais, P.; Mackenzie, F.T.; Gruber, N.; Janssens, I.A.; Laruelle, G.G.; Lauerwald, R.; Luyssaert, S.; Andersson, A.J.; et al. Anthropogenic perturbation of the carbon fluxes from land to ocean. Nat. Geosci. 2013, 6, 597–607. [Google Scholar] [CrossRef]
  9. Chetelat, B.; Liu, C.Q.; Zhao, Z.Q.; Wang, Q.L.; Li, S.L.; Li, J.; Wang, B.L. Geochemistry of the dissolved load of the Changjiang Basin rivers: Anthropogenic impacts and chemical weathering. Geochim. Cosmochim. Acta 2008, 72, 4254–4277. [Google Scholar] [CrossRef]
  10. Zhang, Z.; Wang, Z.; Xu, Y.; Zhang, Y.; Guo, L.; Zheng, Q.; Tang, L. Quantitative Study on the Changes of Karst Groundwater Level and Hydrochemistry in Jinci Spring Catchment, Shanxi, China. Expo. Health 2019, 11, 1–13. [Google Scholar] [CrossRef]
  11. Deirmendjian, L.; Anschutz, P.; Morel, C.; Mollier, A.; Augusto, L.; Loustau, D.; Cotovicz, L.C., Jr.; Buquet, D.; Lajaunie, K.; Chaillou, G.; et al. Importance of the vegetation-groundwater-stream continuum to understand transformation of biogenic carbon in aquatic systems—A case study based on a pine-maize comparison in a lowland sandy watershed (Landes de Gascogne, SW France). Sci. Total Environ. 2019, 661, 613–629. [Google Scholar] [CrossRef] [PubMed]
  12. Marescaux, A.; Thieu, V.; Borges, A.V.; Garnier, J. Seasonal and spatial variability of the partial pressure of carbon dioxide in the human-impacted Seine River in France. Sci. Rep. 2018, 8, 13961. [Google Scholar] [CrossRef] [PubMed]
  13. Pu, J.; Li, J.; Khadka, M.B.; Martin, J.B.; Zhang, T.; Yu, S.; Yuan, D. In-stream metabolism and atmospheric carbon sequestration in a groundwater-fed karst stream. Sci. Total Environ. 2017, 579, 1343–1355. [Google Scholar] [CrossRef] [PubMed]
  14. Campeau, A.; Wallin, M.B.; Giesler, R.; Löfgren, S.; Mörth, C.-M.; Schiff, S.; Venkiteswaran, J.J.; Bishop, K. Multiple sources and sinks of dissolved inorganic carbon across Swedish streams, refocusing the lens of stable C isotopes. Sci. Rep. 2017, 7, 9158. [Google Scholar] [CrossRef]
  15. Richey, J.E.; Melack, J.M.; Aufdenkampe, A.K.; Ballester, V.M.; Hess, L.L. Outgassing from Amazonian rivers and wetlands as a large tropical source of atmospheric CO2. Nature 2002, 416, 617–620. [Google Scholar] [CrossRef]
  16. Shin, W.J.; Chung, G.S.; Lee, D.; Lee, K.S. Dissolved inorganic carbon export from carbonate and silicate catchments estimated from carbonate chemistry and δ13CDIC. Hydrol. Earth Syst. Sci. 2011, 15, 2551–2560. [Google Scholar] [CrossRef]
  17. Telmer, K.; Veizer, J. Carbon fluxes, pCO2 and substrate weathering in a large northern river basin, Canada: Carbon isotope perspectives. Chem. Geol. 1999, 159, 61–86. [Google Scholar] [CrossRef]
  18. Raymond, P.A.; Caraco, N.F.; Cole, J.J. Carbon dioxide concentration and atmospheric flux in the Hudson River. Estuaries 1997, 20, 381–390. [Google Scholar] [CrossRef]
  19. Wang, F.; Wang, Y.; Zhang, J.; Xu, H.; Wei, X. Human impact on the historical change of CO2 degassing flux in River Changjiang. Geochem. Trans. 2007, 8, 7. [Google Scholar] [CrossRef]
  20. Cartwright, I. The origins and behavior of carbon in a major semi-arid river, the Murray River, Australia, as constrained by carbon isotopes and hydrochemistry. Appl. Geochem. 2010, 25, 1734–1745. [Google Scholar] [CrossRef]
  21. Wachniew, P. Isotopic composition of dissolved inorganic carbon in a large polluted river: The Vistula, Poland. Chem. Geol. 2006, 233, 293–308. [Google Scholar] [CrossRef]
  22. Liang, B.; Han, G.; Liu, M.; Li, X.; Song, C.; Zhang, Q.; Yang, K. Spatial and Temporal Variation of Dissolved Heavy Metals in the Mun River, Northeast Thailand. Water 2019, 11, 380. [Google Scholar] [CrossRef]
  23. Liu, J.; Han, G.; Liu, X.; Liu, M.; Song, C.; Zhang, Q.; Yang, K.; Li, X. Impacts of Anthropogenic Changes on the Mun River Water: Insight from Spatio-Distributions and Relationship of C and N Species in Northeast Thailand. Int. J. Environ. Res. Public Health 2019, 16, 659. [Google Scholar] [CrossRef]
  24. Akter, A.; Babel, M.S. Hydrological modeling of the Mun River basin in Thailand. J. Hydrol. 2012, 452, 232–246. [Google Scholar] [CrossRef]
  25. Nimnate, P.; Choowong, M.; Thitimakorn, T.; Hisada, K. Geomorphic criteria for distinguishing and locating abandoned channels from upstream part of Mun River, Khorat Plateau, northeastern Thailand. Environ. Earth Sci. 2017, 76, 331. [Google Scholar] [CrossRef]
  26. Prabnakorn, S.; Maskey, S.; Suryadi, F.X.; de Fraiture, C. Rice yield in response to climate trends and drought index in the Mun River Basin, Thailand. Sci. Total Environ. 2018, 621, 108–119. [Google Scholar] [CrossRef]
  27. Bhattarai, R.; Dutta, D. Estimation of Soil Erosion and Sediment Yield Using GIS at Catchment Scale. Water Resour. Manag. 2006, 21, 1635–1647. [Google Scholar] [CrossRef]
  28. Wu, Q.; Han, G. δ13CDIC tracing of dissolved inorganic carbon sources at Three Gorges Reservoir, China. Water Sci. Technol. 2017, 77, 555–564. [Google Scholar] [CrossRef]
  29. Atekwana, E.A.; Krishnamurthy, R.V. Seasonal variations of dissolved inorganic carbon and δ13C of surface waters: Application of a modified gas evolution technique. J. Hydrol. 1998, 205, 265–278. [Google Scholar] [CrossRef]
  30. Doctor, D.H.; Kendall, C.; Sebestyen, S.D.; Shanley, J.B.; Ohte, N.; Boyer, E.W. Carbon isotope fractionation of dissolved inorganic carbon (DIC) due to outgassing of carbon dioxide from a headwater stream. Hydrol. Process. 2008, 22, 2410–2423. [Google Scholar] [CrossRef]
  31. Yang, W.; Amundson, R.; Trumbore, S. A model for soil 14CO2 and its implications for using 14C to date pedogenic carbonate. Geochim. Cosmochim. Acta 1994, 58, 393–399. [Google Scholar] [CrossRef]
  32. Cerling, T.E.; Solomon, D.K.; Quade, J.; Bowman, J.R. On the isotopic composition of carbon in soil carbon dioxide. Geochim. Cosmochim. Acta 1991, 55, 3403–3405. [Google Scholar] [CrossRef]
  33. Aucour, A.-M.; Sheppard, S.M.; Guyomar, O.; Wattelet, J. Use of δ13C to trace origin and cycling of inorganic carbon in the Rhone river syetem. Chem. Geol. 1999, 159, 87–105. [Google Scholar] [CrossRef]
  34. Das, A.; Krishnaswami, S.; Bhattacharya, S.K. Carbon isotope ratio of dissolved inorganic carbon (DIC) in rivers draining the Deccan Traps, India: Sources of DIC and their magnitudes. Earth Planet. Sci. Lett. 2005, 236, 419–429. [Google Scholar] [CrossRef]
  35. Zhao, Z.; Liu, G.; Liu, Q.; Huang, C.; Li, H. Studies on the Spatiotemporal Variability of River Water Quality and Its Relationships with Soil and Precipitation: A Case Study of the Mun River Basin in Thailand. Int. J. Environ. Res. Public Health 2018, 15, 2466. [Google Scholar] [CrossRef]
  36. Li, S.-L.; Liu, C.-Q.; Li, J.; Lang, Y.-C.; Ding, H.; Li, L. Geochemistry of dissolved inorganic carbon and carbonate weathering in a small typical karstic catchment of Southwest China: Isotopic and chemical constraints. Chem. Geol. 2010, 277, 301–309. [Google Scholar] [CrossRef]
  37. Oliva, P.; Viers, J.; Dupré, B. Chemical weathering in granitic environments. Chem. Geol. 2003, 202, 225–256. [Google Scholar] [CrossRef]
  38. West, A.; Galy, A.; Bickle, M. Tectonic and climatic controls on silicate weathering. Earth Planet. Sci. Lett. 2005, 235, 211–228. [Google Scholar] [CrossRef]
  39. Millot, R.; Gaillardet, J.; Dupré, B.; Allègre, C.J. The global control of silicate weathering rates and the coupling with physical erosion: New insights from rivers of the Canadian Shield. Earth Planet. Sci. Lett. 2002, 196, 83–98. [Google Scholar] [CrossRef]
  40. Moosdorf, N.; Hartmann, J.; Lauerwald, R.; Hagedorn, B.; Kempe, S. Atmospheric CO2 consumption by chemical weathering in North America. Geochim. Cosmochim. Acta 2011, 75, 7829–7854. [Google Scholar] [CrossRef]
  41. Li, X.; Han, G.; Liu, M.; Yang, K.; Liu, J. Hydro-Geochemistry of the River Water in the Jiulongjiang River Basin, Southeast China: Implications of Anthropogenic Inputs and Chemical Weathering. Int. J. Environ. Res. Public Health 2019, 16, 440. [Google Scholar] [CrossRef]
  42. Dalai, T.K.; Krishnaswami, S.; Sarin, M.M. Major ion chemistry in the headwaters of the Yamuna river system: Chemical weathering, its temperature dependence and CO2 consumption in the Himalaya. Geochim. Cosmochim. Acta 2002, 66, 3397–3416. [Google Scholar] [CrossRef]
  43. Maher, K.; Chamberlain, C.P. Hydrologic Regulation of Chemical Weathering and the Geologic Carbon Cycle. Science 2014, 343, 1502–1504. [Google Scholar] [CrossRef]
  44. Liu, Z.; Macpherson, G.L.; Groves, C.; Martin, J.B.; Yuan, D.; Zeng, S. Large and active CO2 uptake by coupled carbonate weathering. Earth Sci. Rev. 2018, 182, 42–49. [Google Scholar] [CrossRef]
  45. Xu, Z.; Liu, C.-Q. Chemical weathering in the upper reaches of Xijiang River draining the Yunnan–Guizhou Plateau, Southwest China. Chem. Geol. 2007, 239, 83–95. [Google Scholar] [CrossRef]
  46. Lerman, A.; Wu, L.; Mackenzie, F.T. CO2 and H2SO4 consumption in weathering and material transport to the ocean, and their role in the global carbon balance. Mar. Chem. 2007, 106, 326–350. [Google Scholar] [CrossRef]
  47. Spence, J.; Telmer, K. The role of sulfur in chemical weathering and atmospheric CO2 fluxes: Evidence from major ions, δ13CDIC, and δ34SSO4 in rivers of the Canadian Cordillera. Geochim. Cosmochim. Acta 2005, 69, 5441–5458. [Google Scholar] [CrossRef]
  48. Liu, W.; Xu, Z.; Sun, H.; Zhao, T.; Shi, C.; Liu, T. Geochemistry of the dissolved loads during high-flow season of rivers in the southeastern coastal region of China: Anthropogenic impact on chemical weathering and carbon sequestration. Biogeosciences 2018, 15, 4955–4971. [Google Scholar] [CrossRef]
  49. Shin, W.-J.; Lee, K.-S.; Park, Y.; Lee, D.; Yu, E.-J. Tracing anthropogenic DIC in urban streams based on isotopic and geochemical tracers. Environ. Earth Sci. 2015, 74, 2707–2717. [Google Scholar] [CrossRef]
  50. Abril, G.; Guérin, F.; Richard, S.; Delmas, R.; Galy-Lacaux, C.; Gosse, P.; Tremblay, A.; Varfalvy, L.; Dos Santos, M.A.; Matvienko, B. Carbon dioxide and methane emissions and the carbon budget of a 10-year old tropical reservoir (Petit Saut, French Guiana). Glob. Biogeochem. Cycles 2005, 19, 1–16. [Google Scholar] [CrossRef]
  51. Alin, S.R.; de Fátima FL Rasera, M.; Salimon, C.I.; Richey, J.E.; Holtgrieve, G.W.; Krusche, A.V.; Snidvongs, A. Physical controls on carbon dioxide transfer velocity and flux in low-gradient river systems and implications for regional carbon budgets. J. Geophys. Res. 2011, 116, 1–17. [Google Scholar] [CrossRef]
  52. Zou, J. Sources and Dynamics of Inorganic Carbon within the Upper Reaches of the Xi River Basin, Southwest China. PLoS ONE 2016, 11, e0160964. [Google Scholar] [CrossRef]
  53. Yao, G.; Gao, Q.; Wang, Z.; Huang, X.; He, T.; Zhang, Y.; Jiao, S.; Ding, J. Dynamics of CO2 partial pressure and CO2 outgassing in the lower reaches of the Xijiang River, a subtropical monsoon river in China. Sci. Total Environ. 2007, 376, 255–266. [Google Scholar] [CrossRef] [PubMed]
  54. Li, S.Y.; Lu, X.X.; He, M.; Zhou, Y.; Li, L.; Ziegler, A.D. Daily CO2 partial pressure and CO2 outgassing in the upper Yangtze River basin: a case study of Longchuanjiang, China. Biogeosci. Discuss. 2011, 8, 10645–10676. [Google Scholar] [CrossRef]
Figure 1. Maps of the Mun River Basin created by using ArcGIS software. (a) The hydrographic network with sampling sites and (b) land uses in the Mun river basin; (c) lithology of the Mun river basin; (d) density of population at district level (persons per square kilometer).
Ijerph 16 03410 g001
Figure 2. (a) Monthly distribution of precipitation (1957 to 2017) and air temperature (1981 to 2016). (b) Multiyear (2010–2018) average runoff and daily discharge in gauging station (M.11B) at the outlet of the basin. (c) Multiyear (2010–2018) average suspended sediment (SS) and daily suspended sediment in gauging station (M.11B) at the outlet of the basin.
Ijerph 16 03410 g002
Figure 3. Piper diagram showing cations and anions compositions. The data of the rainwater came from Data report on the acid deposition in the East Asian Region. 2016. Available online: http://www.eanet.asia.
Ijerph 16 03410 g003
Figure 4. Variation between δ13CDIC values and pCO2. Figure based on (elmer and Veizer [17], Cartwright [20]).
Ijerph 16 03410 g004
Figure 5. (a) δ13CDIC vs. HCO3/(Na+ + K+ + Ca2+ +Mg2+) and (b) (SO42− + NO3)/(Na+ + K+ + Ca2+ Mg2+). Figure based on Liu, Xu, Sun, Zhao, Shi and Liu [48].
Ijerph 16 03410 g005
Figure 6. Plots of NO3/Na+ vs. SO42−/Na+ (a) and δ13CDIC vs. DIC (b).
Ijerph 16 03410 g006
Figure 7. Spatial distributions of FCO2 in the Mun River.
Ijerph 16 03410 g007
Table 1. The average pCO2 and CO2 evasion flux of the Mun River and other rivers around the world.
RiverLocationClimateDICpCO2kFCO2References
mmol/Lμatmcm/hmmol/(m2·d)
MunThailandTropic1.4439210240This study
Lower MekongEast AsiaTropic1.6109026195[5]
SinamayFrenchTropic---30–461[50]
AmazonBrazilTropic-435010189.0[15]
AmazonBrazilTropic-332015345.2[51]
NanpanChinaSubtropics2.826448194[52]
BeipanChinaSubtropics2.61287878[52]
XijiangChinaSubtropics1.626008–15189–356[53]
YangtzaChinaSubtropics1.71297-14.2[19]
LongchuanChinaSubtropics1.1–4.61230–2100-74–156[54]
OttawaCanadaTemperate0.05–31200480.8[17]
HudsonUSATemperate-1125416–s37[18]
MississippiUSATemperate0.51335-270[2]

