Enhancement of COD Removal from Oilfield Produced Wastewater by Combination of Advanced Oxidation, Adsorption and Ultrafiltration


Abstract
1. Introduction
2. Experimental
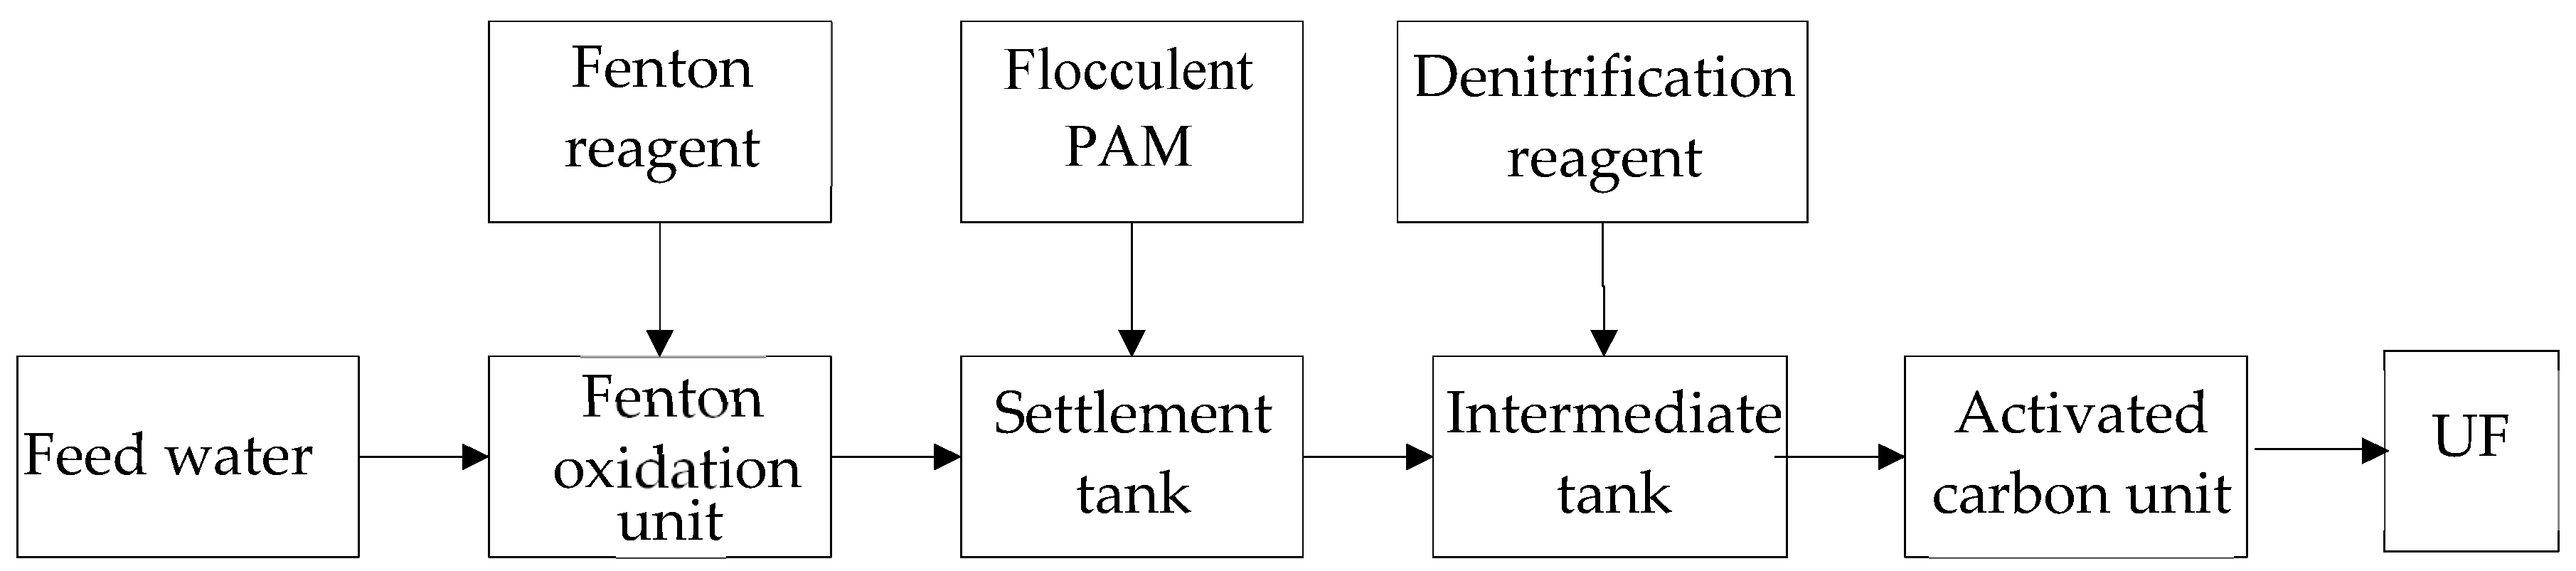
2.1. Pretreatment
2.1.1. Fenton Advanced Oxidation Unit
2.1.2. Settlement Unit and Intermediate Tank Unit
2.1.3. Activated Carbon Adsorption Unit
2.2. UF Membrane Separation Unit
3. Investigation of Pilot Test Parameters
3.1. Fenton Oxidation
3.1.1. H2O2 and FeSO4 Addition
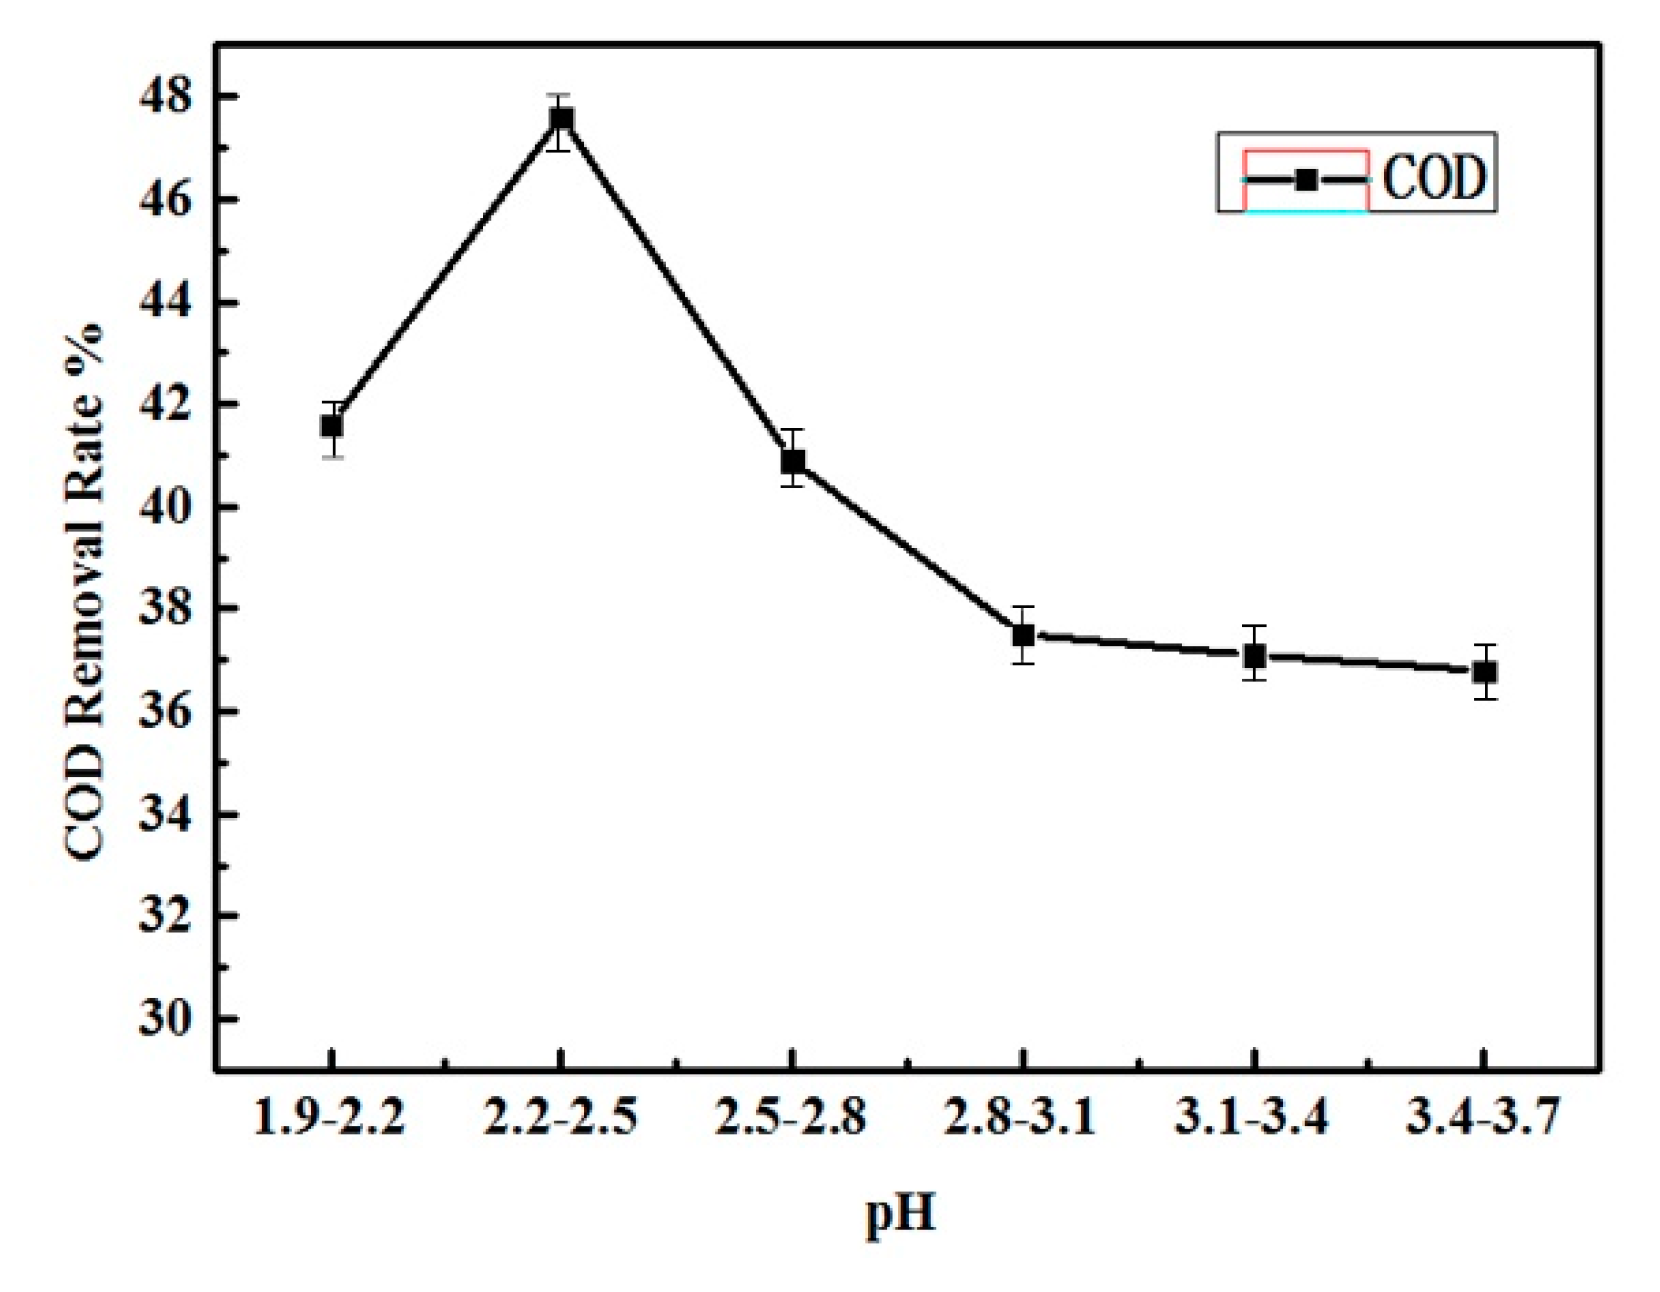
3.1.2. pH Adjustment
3.2. Settlement and Intermediated Units
3.3. Activated Carbon Adsorption
3.4. UF Membrane Challenge Tests
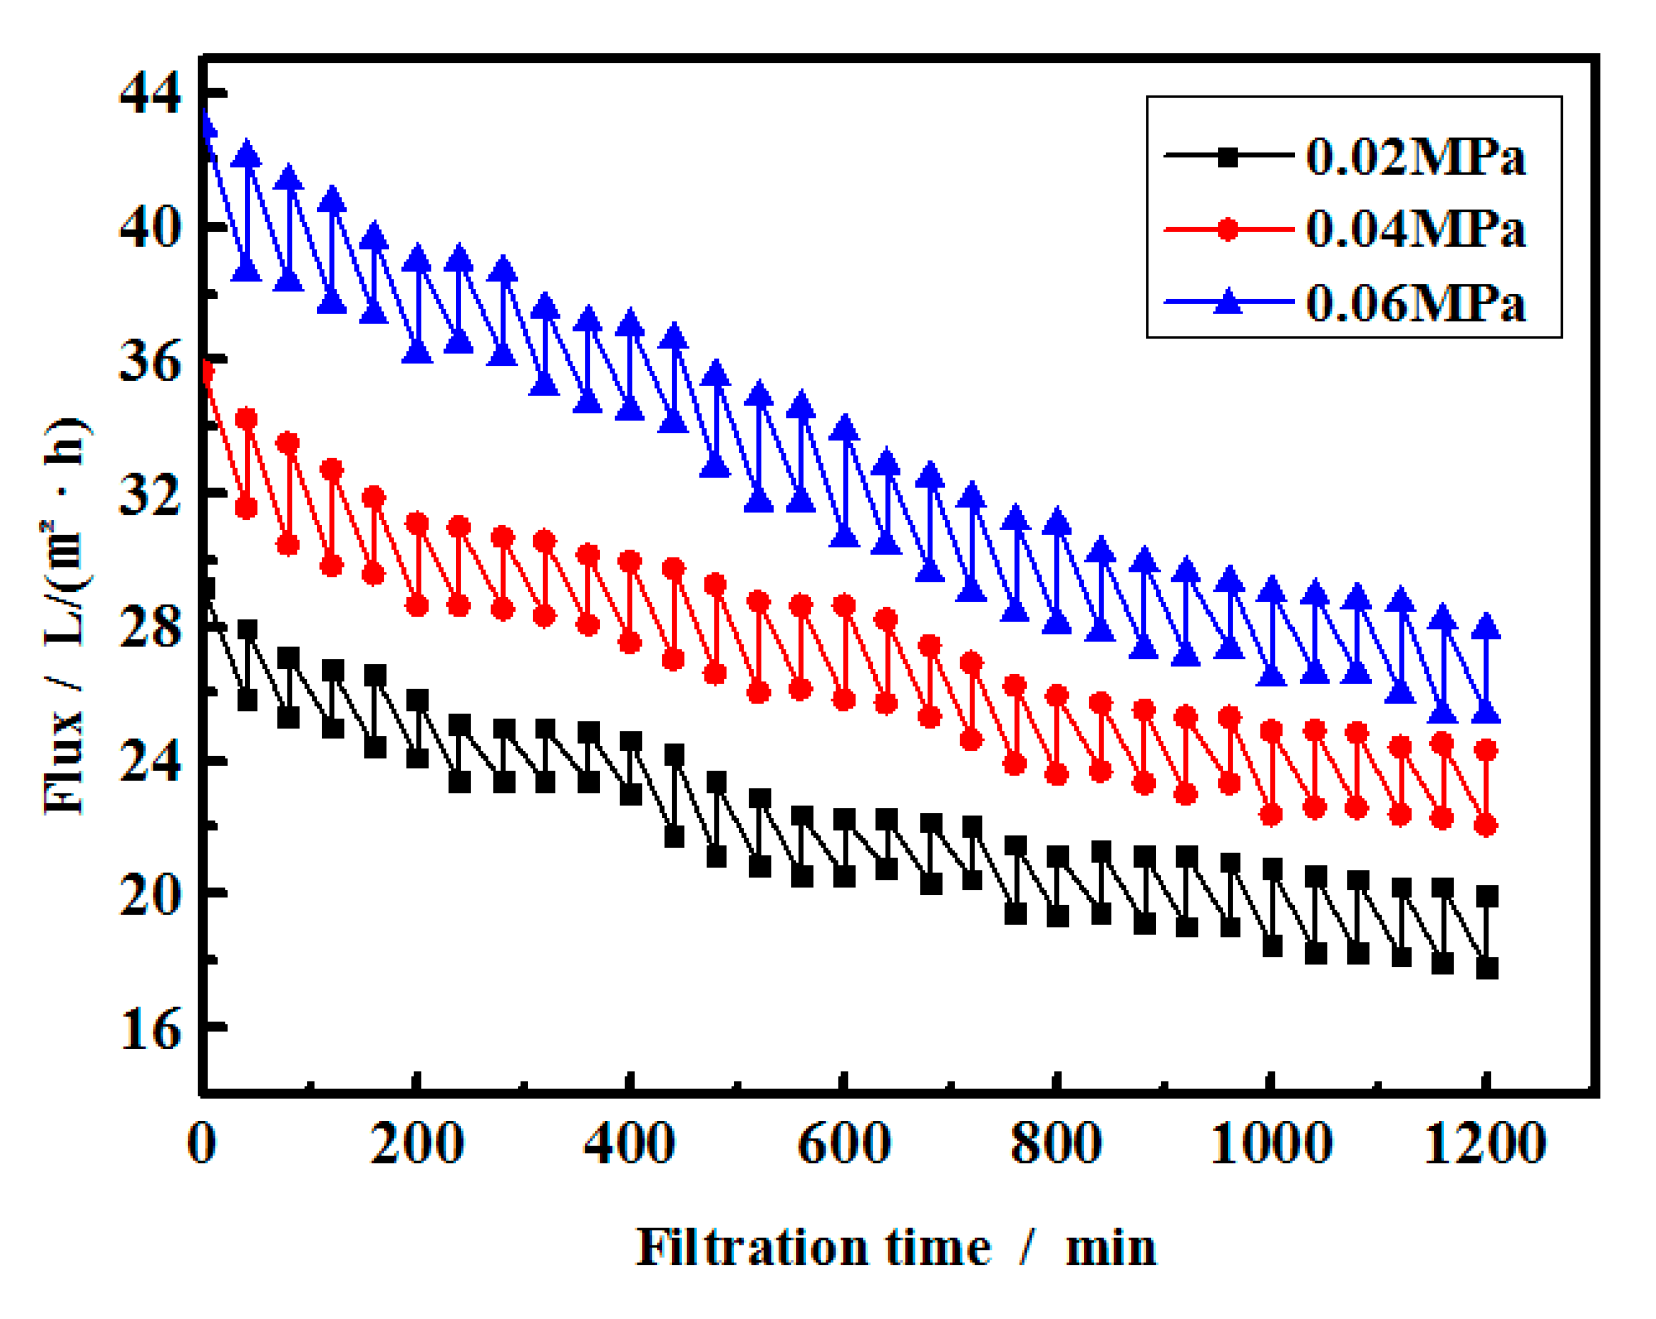
3.4.1. Influence of Operating Pressure on Membrane Flux and Water Quality
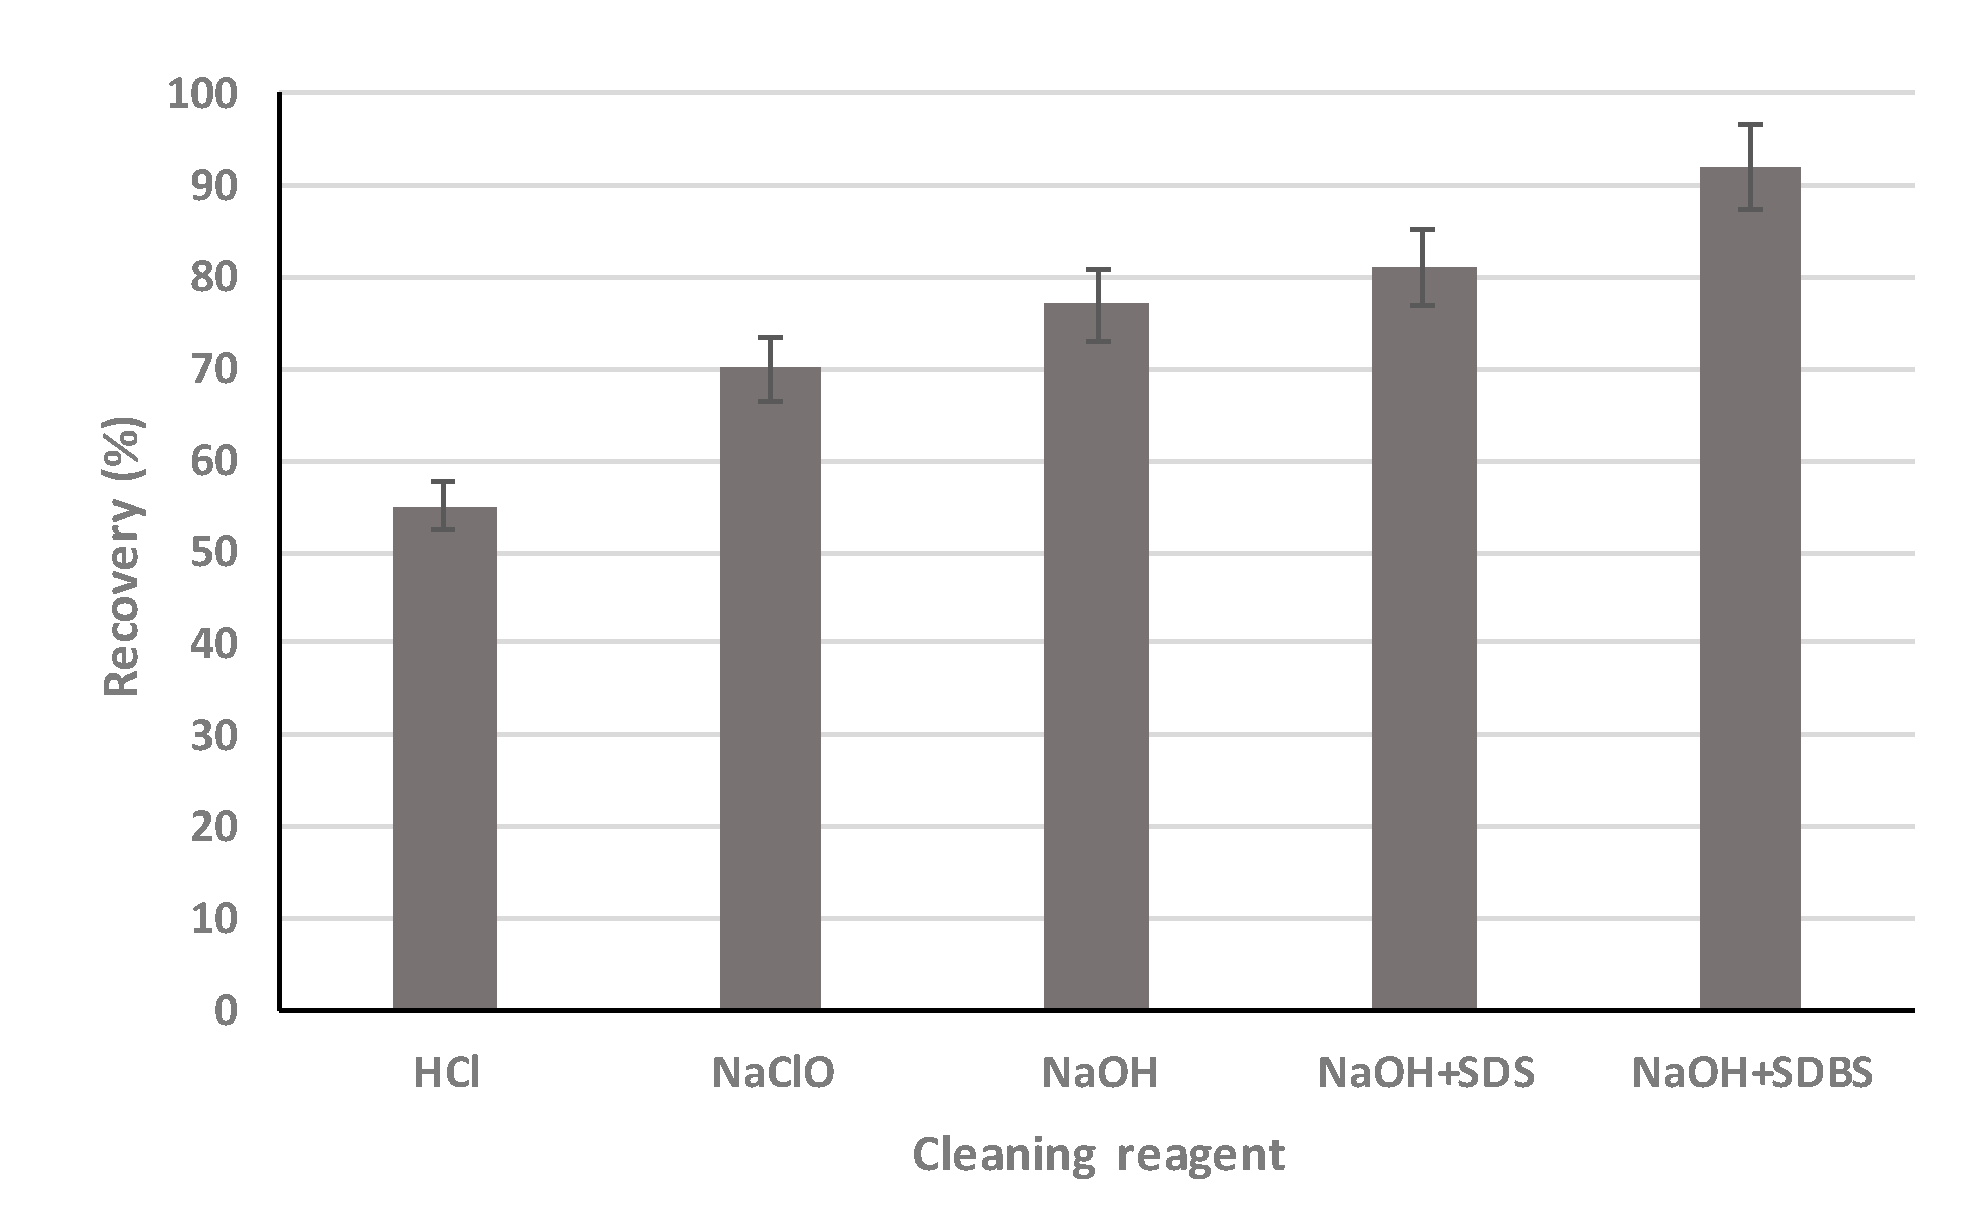
3.4.2. Chemical Cleaning for Membrane
3.5. Treatment Capacity Challenge for the Combined Process
3.6. Cost Analysis
4. Conclusions
- Fenton advanced oxidation reaction: molar ratio of H2O2 to FeSO4 is 3:1, pH 2.2–2.5,
- Settlement tank: pH 9.0–9.5, PAM dosing: 30 mg/L, and
- UF membrane unit: transmembrane pressure 0.04 MPa
Author Contributions
Funding
Acknowledgments
Conflicts of Interest
References
- Fakhru’l-Razi, A.; Pendashteh, A.; Abdullah, L.C.; Biak, D.R.A.; Madaeni, S.S.; Abidin, Z.Z. Review of technologies for oil and gas produced water treatment. J. Hazard. Mater. 2009, 170, 530–551. [Google Scholar] [CrossRef] [PubMed]
- Konvensional, B.T. A review of oilfield wastewater treatment using membrane filtration over conventional technology. Malays. J. Anal. Sci. 2017, 21, 643–658. [Google Scholar]
- Rehman, K.; Imran, A.; Amin, I.; Afzal, M. Enhancement of oil field-produced wastewater remediation by bacterially-augmented floating treatment wetlands. Chemosphere 2019, 217, 576–583. [Google Scholar] [CrossRef] [PubMed]
- Veil, J.A.; Puder, M.G.; Elcock, D.; Redweik, R.J., Jr. A White Paper Describing Produced Water from Production of Crude Oil, Natural Gas, and Coal Bed Methane; Argonne National Lab.: Lemont, IL, USA, 2004. [Google Scholar]
- Yang, J.; Hong, L.; Liu, Y.-H.; Guo, J.-W.; Lin, L.-F. Treatment of oilfield fracturing wastewater by a sequential combination of flocculation, Fenton oxidation and SBR process. Environ. Technol. 2014, 35, 2878–2884. [Google Scholar] [CrossRef] [PubMed]
- Duan, H. Study on Electrocatalytic Oxidation-Coagulation Combined Treating the Oil-Field Polymer-Bearing Wastewater; Northeast Petroleum University: Daqing, China, 2017. (In Chinese) [Google Scholar]
- Tellez, G.T.; Nirmalakhandan, N.; Gardea-Torresdey, J.L. Performance evaluation of an activated sludge system for removing petroleum hydrocarbons from oilfield produced water. Adv. Environ. Res. 2002, 6, 455–470. [Google Scholar] [CrossRef]
- Alias, N.H.; Jaafar, J.; Samitsu, S.; Matsuura, T.; Ismail, A.; Othman, M.; Rahman, M.A.; Othman, N.H.; Abdullah, N.; Paiman, S.H. Photocatalytic nanofiber-coated alumina hollow fiber membranes for highly efficient oilfield produced water treatment. Chem. Eng. J. 2019, 360, 1437–1446. [Google Scholar] [CrossRef]
- Alzahrani, S.; Mohammad, A.W. Challenges and trends in membrane technology implementation for produced water treatment: A review. J. Water Process Eng. 2014, 4, 107–133. [Google Scholar] [CrossRef]
- Zhang, J.; Huang, Z.-F. Treatment of phosphate-containing oily wastewater by coagulation and microfiltration. J. Environ. Sci. 2006, 18, 629–633. [Google Scholar]
- Çakmakce, M.; Kayaalp, N.; Koyuncu, I. Desalination of produced water from oil production fields by membrane processes. Desalination 2008, 222, 176–186. [Google Scholar] [CrossRef]
- Alkhudhiri, A.; Darwish, N.; Hilal, N. Produced water treatment: Application of air gap membrane distillation. Desalination 2013, 309, 46–51. [Google Scholar] [CrossRef]
- Muryanto, S. On precipitation of struvite (MgNH4PO4·6H2O). J. Sci. Educ. 2017, 1, 21–29. [Google Scholar] [CrossRef][Green Version]
- Doyle, J.D.; Parsons, S.A. Struvite formation, control and recovery. Water Res. 2002, 36, 3925–3940. [Google Scholar] [CrossRef]
- Li, Y.S.; Yan, L.; Xiang, C.B.; Hong, L.J. Treatment of oily wastewater by organic–inorganic composite tubular ultrafiltration (UF) membranes. Desalination 2006, 196, 76–83. [Google Scholar] [CrossRef]
- Padaki, M.; Murali, R.S.; Abdullah, M.S.; Misdan, N.; Moslehyani, A.; Kassim, M.; Hilal, N.; Ismail, A. Membrane technology enhancement in oil–water separation. A review. Desalination 2015, 357, 197–207. [Google Scholar] [CrossRef]
- Jung, Y.S.; Lim, W.T.; Park, J.Y.; Kim, Y.H. Effect of pH on Fenton and Fenton-like oxidation. Environ. Technol. 2009, 30, 183–190. [Google Scholar] [CrossRef] [PubMed]
- Ramirez, J.H.; Maldonado-Hódar, F.J.; Pérez-Cadenas, A.F.; Moreno-Castilla, C.; Costa, C.A.; Madeira, L.M. Azo-dye Orange II degradation by heterogeneous Fenton-like reaction using carbon-Fe catalysts. Appl. Catal. B Environ. 2007, 75, 312–323. [Google Scholar] [CrossRef]
- Wolf, P.H.; Siverns, S.; Monti, S. UF membranes for RO desalination pretreatment. Desalination 2005, 182, 293–300. [Google Scholar] [CrossRef]
- Chen, C.; Xie, B.; Ren, Y.; Wei, C. The mechanisms of affecting factors in treating wastewater by Fenton reagent. Chin. J. Environ. Sci. 2000, 21, 93–96. [Google Scholar]
- Fabbricino, M.; Pontoni, L. Use of non-treated shrimp-shells for textile dye removal from wastewater. J. Environ. Chem. Eng. 2016, 4, 4100–4106. [Google Scholar] [CrossRef]
- Bilstad, T.; Espedal, E. Membrane separation of produced water. Water Sci. Technol. 1996, 34, 239–246. [Google Scholar] [CrossRef]
- Jepsen, K.; Bram, M.; Pedersen, S.; Yang, Z. Membrane fouling for produced water treatment: A review study from a process control perspective. Water 2018, 10, 847. [Google Scholar] [CrossRef]
- Jermann, D.; Pronk, W.; Kägi, R.; Halbeisen, M.; Boller, M. Influence of interactions between NOM and particles on UF fouling mechanisms. Water Res. 2008, 42, 3870–3878. [Google Scholar] [CrossRef]
- Nilsson, J.L. Protein fouling of uf membranes: Causes and consequences. J. Membr. Sci. 1990, 52, 121–142. [Google Scholar] [CrossRef]
- Chong, V.; Koo, C.; Thiam, H.; Lai, S. Chemical Cleaning of Fouled Polyethersulphone Nanofiltration Membranes with Ethylenediaminetetraacetic Acid. J. Appl Membr Sci. Technol. 2019, 23, 1–7. [Google Scholar] [CrossRef]
- Zhao, D.; Qiu, L.; Song, J.; Liu, J.; Wang, Z.; Zhu, Y.; Liu, G. Efficiencies and mechanisms of chemical cleaning agents for nanofiltration membranes used in produced wastewater desalination. Sci. Total Environ. 2019, 652, 256–266. [Google Scholar] [CrossRef] [PubMed]
- Wang, S.; Xiao, K.; Huang, X. Characterizing the roles of organic and inorganic foulants in RO membrane fouling development: The case of coal chemical wastewater treatment. Sep. Purif. Technol. 2019, 210, 1008–1016. [Google Scholar] [CrossRef]
- Smulders, E.; Rybinski, W.; Sung, E.; Rähse, W.; Steber, J.; Wiebel, F.; Nordskog, A. Laundry Detergents. In Ullmann’s Encyclopedia of Industrial Chemistry; Wiley-VCH: Weinheim, Germany, 2007. [Google Scholar]
- Pellegrin, M.L.; Burbano, M.S.; Sadler, M.E.; Diamond, J.; Baker, S.; Greiner, A.D.; Arabi, S.; Wong, J.; Doody, A.; Padhye, L.P. Membrane processes. Water Environ. Res. 2016, 88, 1050–1124. [Google Scholar] [CrossRef] [PubMed]
- Shawkat, A.A.; Rashad, Z.W.; Rashad, A.A.; Kareem, N.A.A.; Abbas, T.K.; Alsalhy, Q.F.; Abbas, A.D.; Sherhan, B.Y. Produced Water Treatment Using Ultrafiltration and Nanofiltration Membranes. Al-Khwarizmi Eng. J. 2016, 12, 10–18. [Google Scholar]
- Marsters, P.; Macknick, J.; Bazilian, M.; Newmark, R. A Cost-Benefit Analysis of Produced Water Management Opportunities in Selected Unconventional Oil and Gas Plays; AGU Fall Meeting Abstracts; American Geophysical Union: San Francisco, CA, USA, 2013. [Google Scholar]
- Ersahin, M.E.; Ozgun, H.; Kaya, R.; Mutlu, B.K.; Kinaci, C.; Koyuncu, I. Treatment of produced water originated from oil and gas production wells: A pilot study and cost analysis. Environ. Sci. Pollut. Res. 2018, 25, 6398–6406. [Google Scholar] [CrossRef] [PubMed]


| Parameters | pH | Chemical Oxygen Demand (COD) (mg/L) | Nitrogen (mg/L) |
|---|---|---|---|
| Influent | 8.1 | 261 | 10.8 |
| Effluent | 6–9 | ≤170 | ≤8 |
| Testing Item | Pressure (MPa) | Operating Time (min) | ||
|---|---|---|---|---|
| 100 | 600 | 1200 | ||
| Suspended solid (mg/L) | 0.02 | 1.32 | 1.26 | 2.52 |
| 0.04 | 2.16 | 2.94 | 2.56 | |
| 0.06 | 3.16 | 3.43 | 2.10 | |
| Oil content (mg/L) | 0.02 | 0.00 | 0.02 | 3.86 |
| 0.04 | 0.00 | 0.09 | 0.00 | |
| 0.06 | 0.02 | 0.02 | 0.00 | |
| SDI15 (15-min Silt Density Index) | 0.02 | 1.24 | 2.58 | 3.76 |
| 0.04 | 3.55 | 4.29 | 3.41 | |
| 0.06 | 3.90 | 4.68 | 5.76 | |
| Turbidity (Nephelometric Turbidity Unit) | 0.02 | 0.02 | 0.08 | 0.05 |
| 0.04 | 0.05 | 0.01 | 0.04 | |
| 0.06 | 0.03 | 0.06 | 0.04 | |
| Inflow (m3/h) | Fenton Oxidation Time (min) | Activated Carbon Adsorption Time (min) | COD (mg/L) | Turbidity (NTU) | ||
|---|---|---|---|---|---|---|
| Pre-UF | Post-UF | Pre-UF | Post-UF | |||
| 5 | 320 | 480 | 139 | 13.0 | 138.8 | 9.09 |
| 10 | 160 | 240 | 145 | 20.6 | 154.2 | 9.72 |
| 15 | 106 | 160 | 186 | 25.1 | 180.2 | 11.37 |
| 20 | 80 | 120 | 201 | 26.7 | 186.3 | 14.06 |
© 2019 by the authors. Licensee MDPI, Basel, Switzerland. This article is an open access article distributed under the terms and conditions of the Creative Commons Attribution (CC BY) license (http://creativecommons.org/licenses/by/4.0/).
Share and Cite
Dai, X.; Fang, J.; Li, L.; Dong, Y.; Zhang, J. Enhancement of COD Removal from Oilfield Produced Wastewater by Combination of Advanced Oxidation, Adsorption and Ultrafiltration. Int. J. Environ. Res. Public Health 2019, 16, 3223. https://doi.org/10.3390/ijerph16173223
Dai X, Fang J, Li L, Dong Y, Zhang J. Enhancement of COD Removal from Oilfield Produced Wastewater by Combination of Advanced Oxidation, Adsorption and Ultrafiltration. International Journal of Environmental Research and Public Health. 2019; 16(17):3223. https://doi.org/10.3390/ijerph16173223
Chicago/Turabian StyleDai, Xiaodong, Jian Fang, Lei Li, Yan Dong, and Jianhua Zhang. 2019. "Enhancement of COD Removal from Oilfield Produced Wastewater by Combination of Advanced Oxidation, Adsorption and Ultrafiltration" International Journal of Environmental Research and Public Health 16, no. 17: 3223. https://doi.org/10.3390/ijerph16173223
APA StyleDai, X., Fang, J., Li, L., Dong, Y., & Zhang, J. (2019). Enhancement of COD Removal from Oilfield Produced Wastewater by Combination of Advanced Oxidation, Adsorption and Ultrafiltration. International Journal of Environmental Research and Public Health, 16(17), 3223. https://doi.org/10.3390/ijerph16173223