1. Introduction
Rivers, especially those flowing through urban areas, play a key role in preserving freshwater, adjusting the local climate, and improving the environmental conditions [
1]. However, with accelerated population growth, urbanization, and industrialization, heavy metal pollution of rivers has become a serious issue. In 2007, approximately 90% of the urban rivers in China were polluted, with 900 tons of heavy metals being transported into freshwater bodies [
2]. Anthropogenic activities, such as fertilization, inadequate industrial effluent disposal, oil spillage, domestic sewerage disposal, and mineral mining, as well as rain water and atmospheric deposition, are particularly responsible for the increasing accumulation of heavy metals in water, sediments, and macrophytes, significantly contributing to the pollution of aquatic ecosystems [
3,
4]. The pollution of water bodies with heavy metals seriously threatens aquatic biodiversity because of the toxicity, persistence, bioaccumulation, and non-degradability of heavy metals, and contaminated drinking water represents a severe health hazard in humans [
5].
Aquatic macrophytes can accumulate and concentrate large amounts of various substances and can act as bio-filters by accumulating heavy metals from the surrounding environment, making them excellent indicators of heavy metal contamination in aquatic ecosystems [
6,
7]. Peng et al. found that the aquatic plants
Potamogeton pectinatus had high accumulation capacity for cadmium (Cd), lead (Pb), copper (Cu), zinc (Zn), and manganese (Mn) with 596, 318, 62.4, 6590, and 16,000 mg/kg (DW), respectively [
8].
Salvinia minima was shown to accumulate metals within tissues when cultivated in higher concentrations of selected heavy metals, with maximum removal rates of 0.0045, 0.0595, 0.1423, and 0.4046 mg/m
2·day for Cd, nickel (Ni), Pb, and Zn, respectively [
9]. The analysis of water, sediment, and macrophyte samples can be performed to assess the overall heavy metal pollution and the impact of heavy metals on aquatic ecosystems. As carriers of contaminants, sediments are generally recognized as a primary sink for heavy metals in aquatic environments; more than 85% of heavy metals eventually deposit on surface sediments [
10].
The investigation of heavy metal concentrations and distribution is useful to determine the pollution level in aquatic environments and to provide basic information for the assessment of environmental health risks [
11]. The most commonly cited assessment indices in environmental studies include the water quality index (WQI), the potential ecological risk index (RI), the index of geo-accumulation (
Igeo), and the bioconcentration factor (BCF), which are widely used to evaluate heavy metal pollution in water, sediments, and macrophytes. To more deeply understand the issue of heavy metal pollution of water bodies, the integrated application of multi-assessment methods to evaluate the ecological risk is important [
12,
13,
14].
The Yi River (34°23′–36°20′ N, 117°25′–118°42′ E) originates from the southern foothills of the Mountain Lu in Yiyuan County, Shandong Province, and flows into the Yellow Sea from Jiangsu Province; it has a total length of 574 km and a basin area of 17,325 km2 in Shandong Province. As an important tributary of the Huai River, the Yi River is the second longest river in Shandong Province and the largest river in the Yimeng mountainous area. Three tributary rivers including the Beng River, the Liuqing River, and the Su River, feed into the Yi River in the northeastern part of the Linyi City, forming a junction. A rubber dam, the Xiaobudong Rubber Dam with a length of 1135 m, was built 4.5 km downstream of the junction for water storage in 1997, forming the Yimeng Lake with a water surface of 10 km2. The Yi River and the tributaries play important roles in flood control, irrigation, and maintenance of the ecosystems. With the growth of the population and the rapid development of the industry and agriculture, the water area in the junction of the four rivers was contaminated with heavy metals. However, the pollution levels of the water, the sediment, and aquatic organisms are still unknown, and respective studies are scarce. In recent years, river management has ever been strengthened by the local government. Most chemical, electroplating, and manufacturing factories were shut down or moved out of the river basin, but their contribution to heavy metal pollution in the past still lasted. The effluent of sewage treatment plants near the upper stream, non-point source pollution, surface runoff, and automobile exhaust are all potential sources of heavy metals in the water and sediments of the rivers nowadays.
In this context, we collected water and sediment samples as well as samples from two widely distributed aquatic plants, Potamogeton crispus Linn. and Salvinia natans L., from the junction of the four rivers in Linyi City, with the objectives to (1) investigate the contamination levels, distribution patterns, and the potential ecological risks of heavy metals in water and sediments, and (2) evaluate the effects of the inflow of the tributaries on the heavy metal level of the main stream, and (3) assess the bioaccumulation of heavy metals in aquatic macrophytes and its correlation with sediments or water.
2. Materials and Methods
2.1. Sampling Sites and Methods
Water samples were collected from 12 different areas (three sites at a distance of 50 m for each area) along the junction of Beng River, Liuqing River, Su River, and Yi River in April and September 2017 (
Figure 1). The two sampling times were selected because April and September are the ends of the dry season and flood season of the Yi River, respectively. All samples were obtained at a depth of 0.5 m below the water surface, using clean polyethylene bottles (washed with hydrochloric acid and rinsed with distilled water); at each site, three water samples were collected. The samples were filtered through 0.45-μm Millipore filters and acidified with guaranteed grade nitric acid. Areas 1 and 2 represent the Beng River, areas 3 and 4 represent the Liuqing River, areas 5, 6, 7, and 8 represent the upstream of the Yi River (U), areas 9 and 10 represent the Su River, and areas 11 and 12 represent the downstream of the Yi River (D). Yi River (U) and Yi River (D) were selected as reference sites to evaluate the influence of other three rivers on the heavy metal level of the main stream.
The sediment samples were collected along four sections (
Figure 1) in April 2017. Each section included three sampling sites, and three replicate samples collected at each site. In each sampling site, approximately the top 10-cm layer of the sediment was sampled using a sediment sampler (PBS-411, Wuhan, China). All samples were sealed in clean polyethylene bags, placed in a cooled box, transported to the laboratory, and air-dried. The samples were decomposed with a microwave (MWD-630, METASH, Shanghai, China) for metal determination. The sampling sites were located using a global positioning system (GPS), and the coordinates of the sites used for water and sediment sampling are provided in
Tables S1 and S2, respectively.
Samples of the aquatic plant species P. crispus were collected from eight areas (areas 1, 2, 5, 6, 7, 8, 11, and 12) in April 2017. In the same areas, samples of the plant species S. natans were collected in September 2017. For each sampling site of specific area, plants with approximately 500 g fresh weight from at least three different strains were collected. All plants were rinsed with distilled water immediately after collection. In addition, sediment samples were also collected from the same eight sites containing P. crispus.
2.2. Sample Analysis
Five commonly measured heavy metals (Chromium (Cr), Ni, Cu, Zn, and Pb) were detected in all water and sediment samples. The sediment samples were digested with HF-HClO4, and the concentrations of the heavy metals were determined by inductively coupled mass spectrometry (ICP-MS, iCAP Q, Thermo, Waltham, MA, USA). The recovery percentage of the external standard ranged between 80 and 120% for all elements. The limits of detection were as follows: 0.02 μg/L for Cr, 0.03 μg/L for Ni, 0.01 μg/L for Cu, 0.02 μg/L for Zn, and 0.01 μg/L for Pb. Reference materials of heavy metals in simulated water standard solution (Cr: GBW(E)080403; Ni: GBW(E)080405; Cu: GBW(E)080396; Zn: GBW(E)080400; Pb: GBW(E)080399) were used to ensure data validity and the accuracy and precision of the analysis methods.
Plant tissue digestion was carried out using a method described in [
15]. Briefly, the plants were oven-dried at 80 °C for 24 h to constant weight and then microwave-digested in two steps. The first step occurred in 10 mL of 16 mM HNO
3 at 70 °C for 5 min, followed by 130 °C for another 5 min and by 150 °C for 4 min. The second step consisted of the addition of 1 mL of H
2O
2 at 85 °C for 5 min, followed by 130 °C for 4 min. After cooling, the samples were diluted with 1% (
v/
v) HNO
3 to a final volume of 50 mL. Subsequently, the samples were filtered through 0.45-μm cellulose nitrate ultrafiltration membrane filters (Whatman, Maidstone, UK) and acidified with HNO
3 to a pH of approximately 2.0, followed by heavy metal detection via ICP-MS.
2.3. Water Quality Index and Potential Ecological Risk Index of Sediments
The WQI represents the total quality of the water with respect to heavy metals [
16]:
where
CD is the measured concentration of the sample and
CR is the reference value according to Class I of the environmental quality standard for surface water in China (Cr, Cu, and Pb ≤ 0.01 mg/L; Zn ≤ 0.05 mg/L; Ni is not included but the level ≤0.01 mg/L was selected as a criterion). The classes of WQI are uncontaminated, low, medium, and high for WQI values ≤ 1, 1 < WQI ≤ 2, 2 < WQI ≤ 3, and >3, respectively.
The geo-accumulation index (
Igeo) has originally been used to assess the heavy metal pollution of sediments [
17] and is defined as follows:
where
Cj is the measured concentration of the sample,
Bj is the reference value, and
k is the geo-accumulation constant (1.5) [
18];
Bj is identical with
CR.
The
Igeo value of each heavy metal is classified into seven grades, ranging from uncontaminated to extremely contaminated (
Table 1).
To further evaluate the degree of heavy metal contamination in sediments, the potential ecological risk index (RI), which was proposed by Hakanson [
19], was developed based on the sedimentary theory. It can be used for the assessment of sediments and soil in large regional areas [
20] and is calculated as follows:
where
Tr is the toxic-response factor and
CR is the average background content of heavy metals for soil in Shandong Province, adopted for the present study [
21].
Here,
Tr accounts for the toxic requirement, and the sensitivity requirement is described as Cr (25) > Ni (10) > Cu = Pb (5) > Zn (1) after series statistic and standardization considering the pollution characteristics of four rivers in Linyi City [
22,
23].
The following terminology may be used to describe the risk factor:
RI < 150, low potential ecological risk;
150 ≤ RI < 300, moderate potential ecological risk;
300 ≤ RI < 600, high potential ecological risk;
RI > 600, very high ecological risk for the substance in question.
The bioconcentration factor (BCF) for metal uptake by plants was determined as a ratio of metal contents in each plant species. Because
P. crispus is a rooted submerged angiosperm and
S. natans is a free-floating aquatic plant, biological concentration factors were calculated on a dry weight (mg/kg) basis in different ways [
24]:
BCF = Heavy metalplant/Heavy metalsediment (for P. crispus)
BCF = Heavy metalplant/Heavy metalwater (for S. natans)
2.4. Statistical Analysis
The results presented are the arithmetic means with their corresponding standard deviations. Differences between groups were tested for significance via ANOVA, using the software package SPSS 17.0. According to Duncan’s multiple comparison tests, p < 0.05 was considered significant. Correlation coefficients of heavy metals between the plants and sediments (or water) were analyzed using the software package Excel.
4. Discussion
As a seasonal river in Northern China, the Yi River has different flow rates in different seasons. More than 80% of the annual distribution of runoff are concentrated in the flood season (June to September) [
25]. The river runs through Linyi City, and three tributaries feed into in the northeastern part of the City. These two factors inevitably influence the distribution of pollutants, including heavy metals, in the junction of the four rivers. In addition, the rubber dam built downstream in 1997 has created a lake near the junction of the four rivers, which strongly influenced the distribution and deposition of the pollutants released into the upstream.
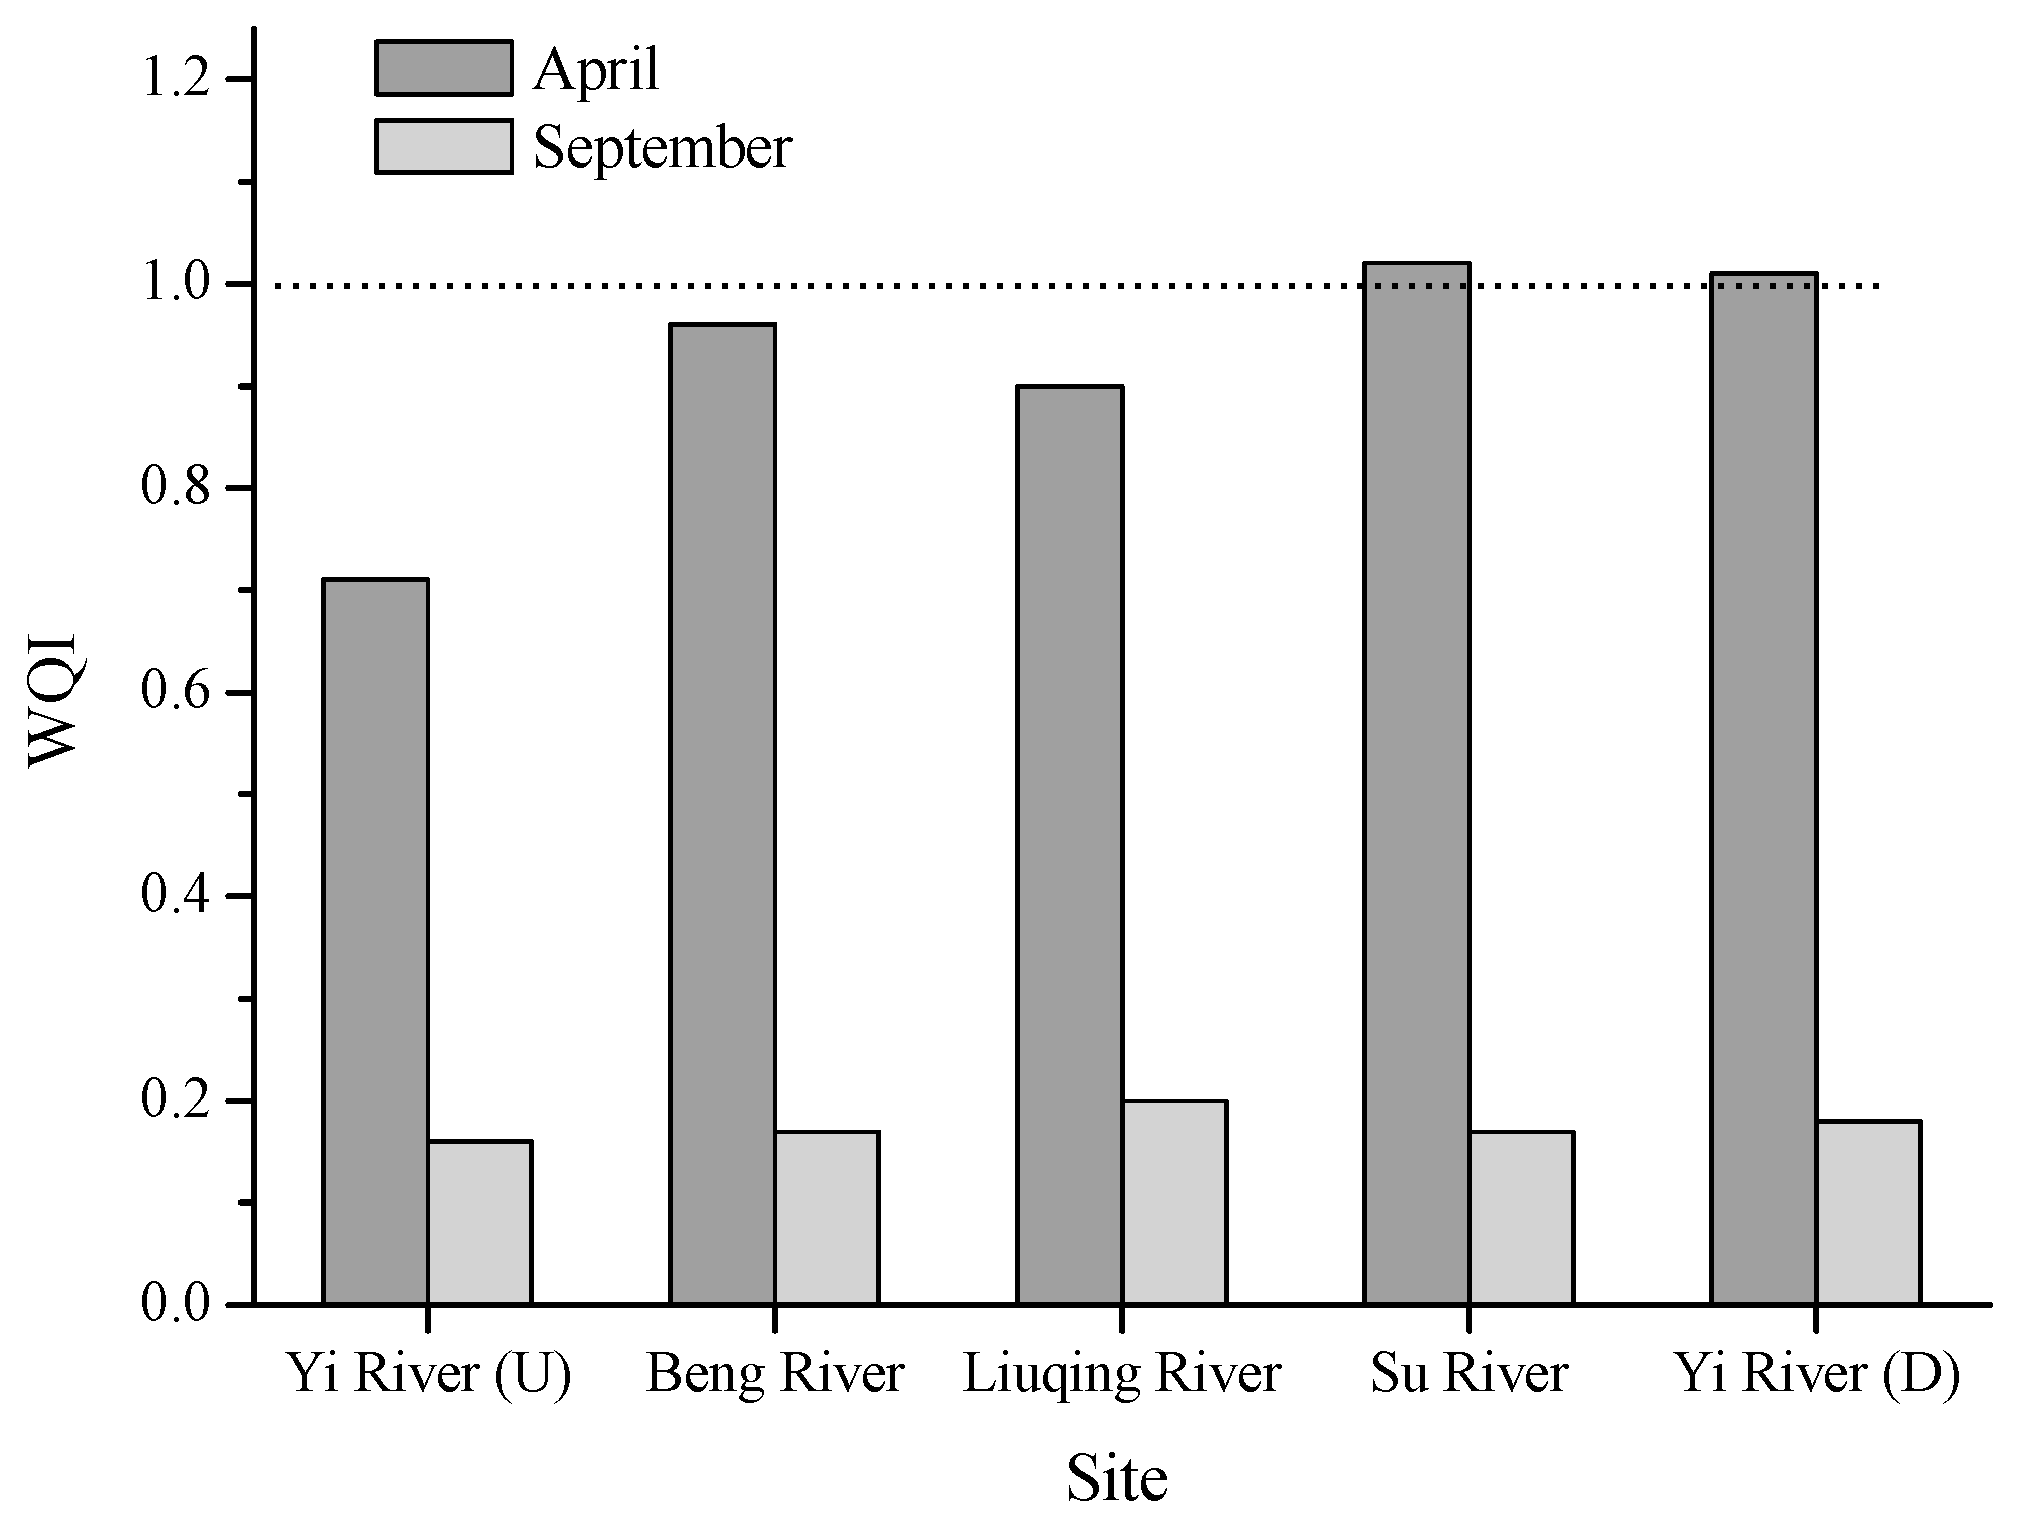
In the present study, we selected the months of April and September for sample collection, mainly because the river experienced a long-time dry season in April, which probably resulted in the concentration of pollutants, and a three-month flood season in September, with a subsequent dilution. Our results clearly show that the concentrations of the four metals (Cr, Ni, Zn, and Pb) decreased significantly (
p < 0.05) in September compared to April (
Table 2). Consequently, the calculated WQI values decreased from about 1 to far below 1 (
Figure 2), indicating an improved water quality. During the dry season of the rivers, Cr was the main factor contributing to the low water quality and high toxicity, and therefore, the bioaccumulation in aquatic organisms deserves more attention. The element Cr may come from the chemical and electroplating factories. In addition, petroleum chemical industry, agriculture production and the agricultural sideline products can result in Cr accumulation in rivers [
26]. In both months, the Cu levels did not significantly fluctuate.
The pollution of sediments with heavy metals can seriously degrade aquatic ecosystems, and their concentrations are considered as reliable indicators of ecosystem health [
27]. The results of the present study show that the concentrations of Cr, Cu, Zn, and Pb in the sediments were rather low compared with several rivers in China, such as the Yangze River, the Huaihe River, the Luan River, and the Second Songhua River, with reported maximum concentrations of 205.00, 178.61, 1142.00, and 113.00 mg/kg for Cr, Cu, Zn, and Pb, respectively (
Table 7). The concentrations of Cu, Zn, and Pb in the Yi River were also lower than those of Gomti River, Po River, Almendares River, and Lahn River. Compared with the guidelines established by the New York State Department of Environmental Conservation [
28], which proposed the lowest effect screening levels for Cr, Ni, Cu, Zn, and Pb of 26, 31, 16, 120, and 16 mg/kg, respectively, the heavy metal levels in all sites of this study did not exceed the upper threshold values, except for Cu and Pb in the Yi River (D) (section IV,
Table 3), which probably originated from industries, atmospheric deposition, and river borne sources [
29,
30]. Accordingly, the results of the potential ecological risk analysis showed that the sediments in the four sections were uncontaminated, with a low pollution risk, which was reflected by the
Igeo and RI values, respectively. The ability of sediments to accumulate heavy metals is affected by the sediment composition [
31,
32]. The sediment samples collected in this study contained more than 80% of sand, which might explain the low metal concentrations. In addition, the Yi River is an important flood discharge river. The annual runoff in the Yi River was 1.124 billion m
3 in 2017, with 60% of which concentrated in July and August [
33]. The scouring function of flood may also reduce the deposition of pollutants in the sediments.
The two aquatic macrophytes studied,
P. crispus and
S. natans, are widely distributed depending on the season, with high growth rate in the Yi River and the Beng River. Investigations on the bioaccumulation potential of these plants may be significant for biomonitoring studies and can provide reference data for the further development of phytoremediation technologies. The two plant species take up nutrients and pollutants differently. While
P. crispus is a rooted submerged angiosperm which extracts nutrients and heavy metals mostly from sediments via root hairs and from the surroundings [
41],
S. natans absorbs nutrients from the surface water as a free-floating aquatic plant. Therefore, the BCF values of
P. crispus and
S. natans were calculated in this study based on the metal concentrations in the surrounding sediment and water, respectively.
Aquatic macrophytes, including
P. crispus and
S. natans, are considered resistant to heavy metals and may accumulate large amounts of heavy metals in their tissues [
42,
43]. Therefore, these species are highly suitable for the use as bio-indicator organisms of heavy metal pollution. While
P. crispus has shown potential to accumulate considerable amounts of Cu, Pb, Ni, and Zn [
44],
S. natans is a hyperaccumulator for Cr, Ni, Cu, and Zn, accumulating amounts of up to 0.5% of its dry weight [
45]. This plant species can remove more than one metal when exposed to multi-metal solutions [
46]. In the present study, both species showed an excellent ability to accumulate heavy metals (
Table 6,
Tables S3 and S4). Because
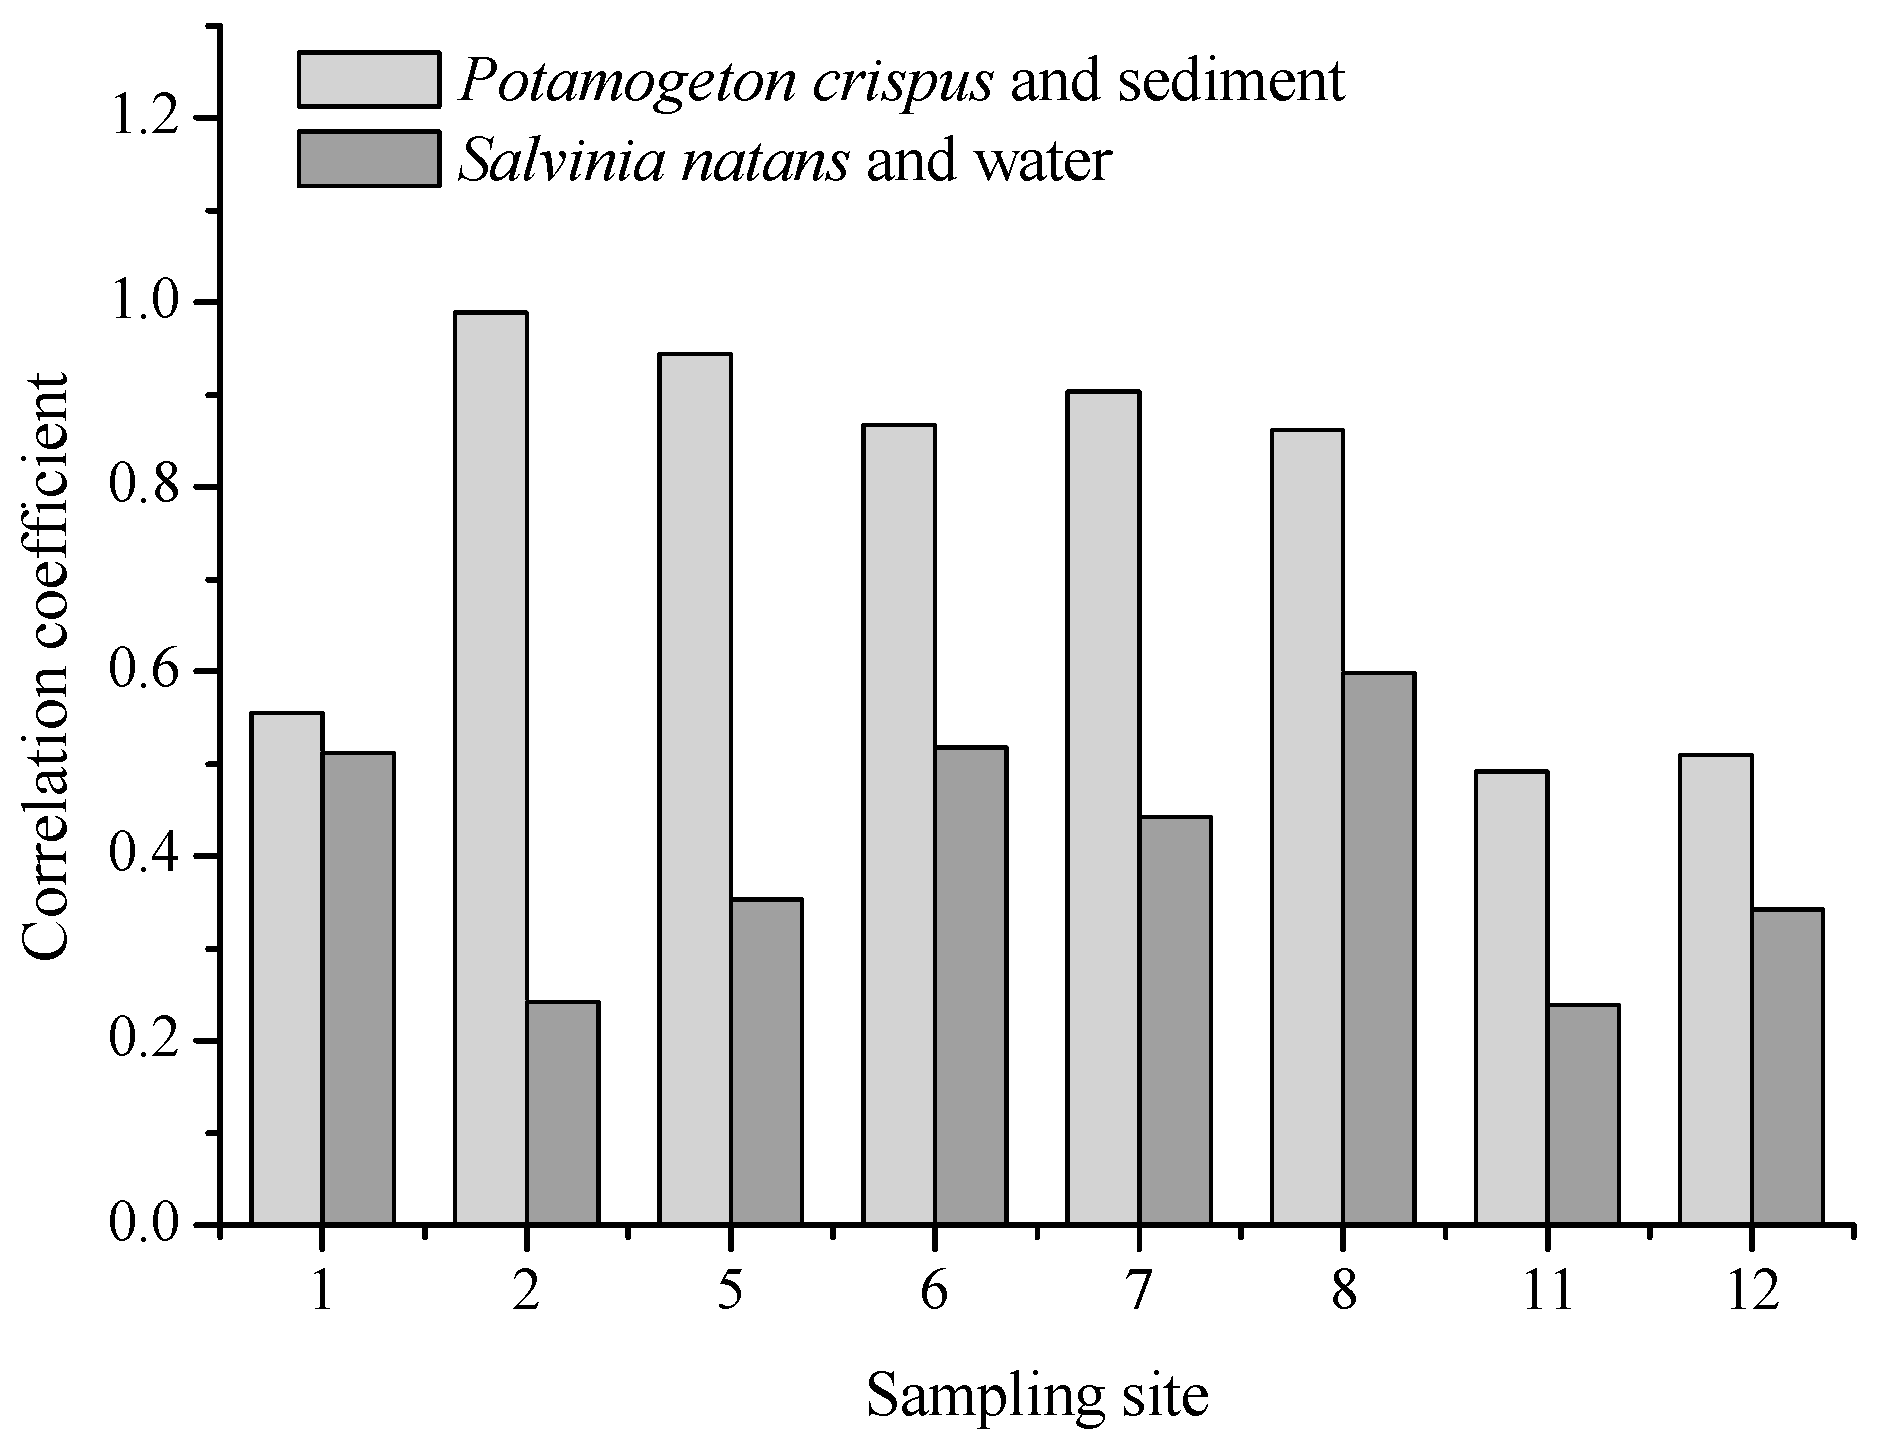
P. crispus grew in a fixed region with its roots in the sediment and lived through a long-term dry season, it can also be used as a bio-indicator reflecting the heavy metal pollution of sediments. We found a high correlation between the heavy metal concentrations of
P. crispus and the sediments of the corresponding sampling sites (
Table 5). In September 2017,
P. crispus could not be collected in most of the sampling sites because of increasing water levels, while
S. natans could travel a long distance, especially in the flood season, and its growth period in a specific area could therefore not be determined. In addition, this plant appeared in the Yi River and the Beng River, with relatively high heavy metal levels before the flood season. Hence, the potential of
S. natans as a bio-indicator is relatively low. The BCF values of heavy metals in
S. natans were calculated based on the low metal concentrations of water in September (compared with April), and thus, the bioaccumulation capability of
S. natans may be overrated. The factors that influence metal accumulation are plant species, environmental conditions, and the surrounding metal levels. Both environmental conditions and the metal level in water or sediments of the three areas (Beng River, Yi River (U), and Yi River (D)) did not vary greatly. This may be the main reason for no spatial differences of the BCF values. Kastratović et al. observed that BCF of Ni and Sr in
Lemna minor from Lake Skadar in Montenegro had no spatial differences [
47]. The two plants selectively accumulated heavy metals; while
P. crispus accumulated higher levels of Cr, Ni, Cu, and Zn,
S. natans showed a high accumulation efficiency for Pb and Zn. Although aquatic plants show high accumulation capacity for specific heavy metals, the metals would release from the plant tissues when the plants die at the end of the growing season, and then return into the water body or sediment. This process should be paid enough attention in phytoremediation using aquatic plants.

 and
and 
