Animal-Assisted Intervention Improves Pain Perception in Polymedicated Geriatric Patients with Chronic Joint Pain: A Clinical Trial

 ,
,
Abstract
:1. Introduction
2. Materials and Methods
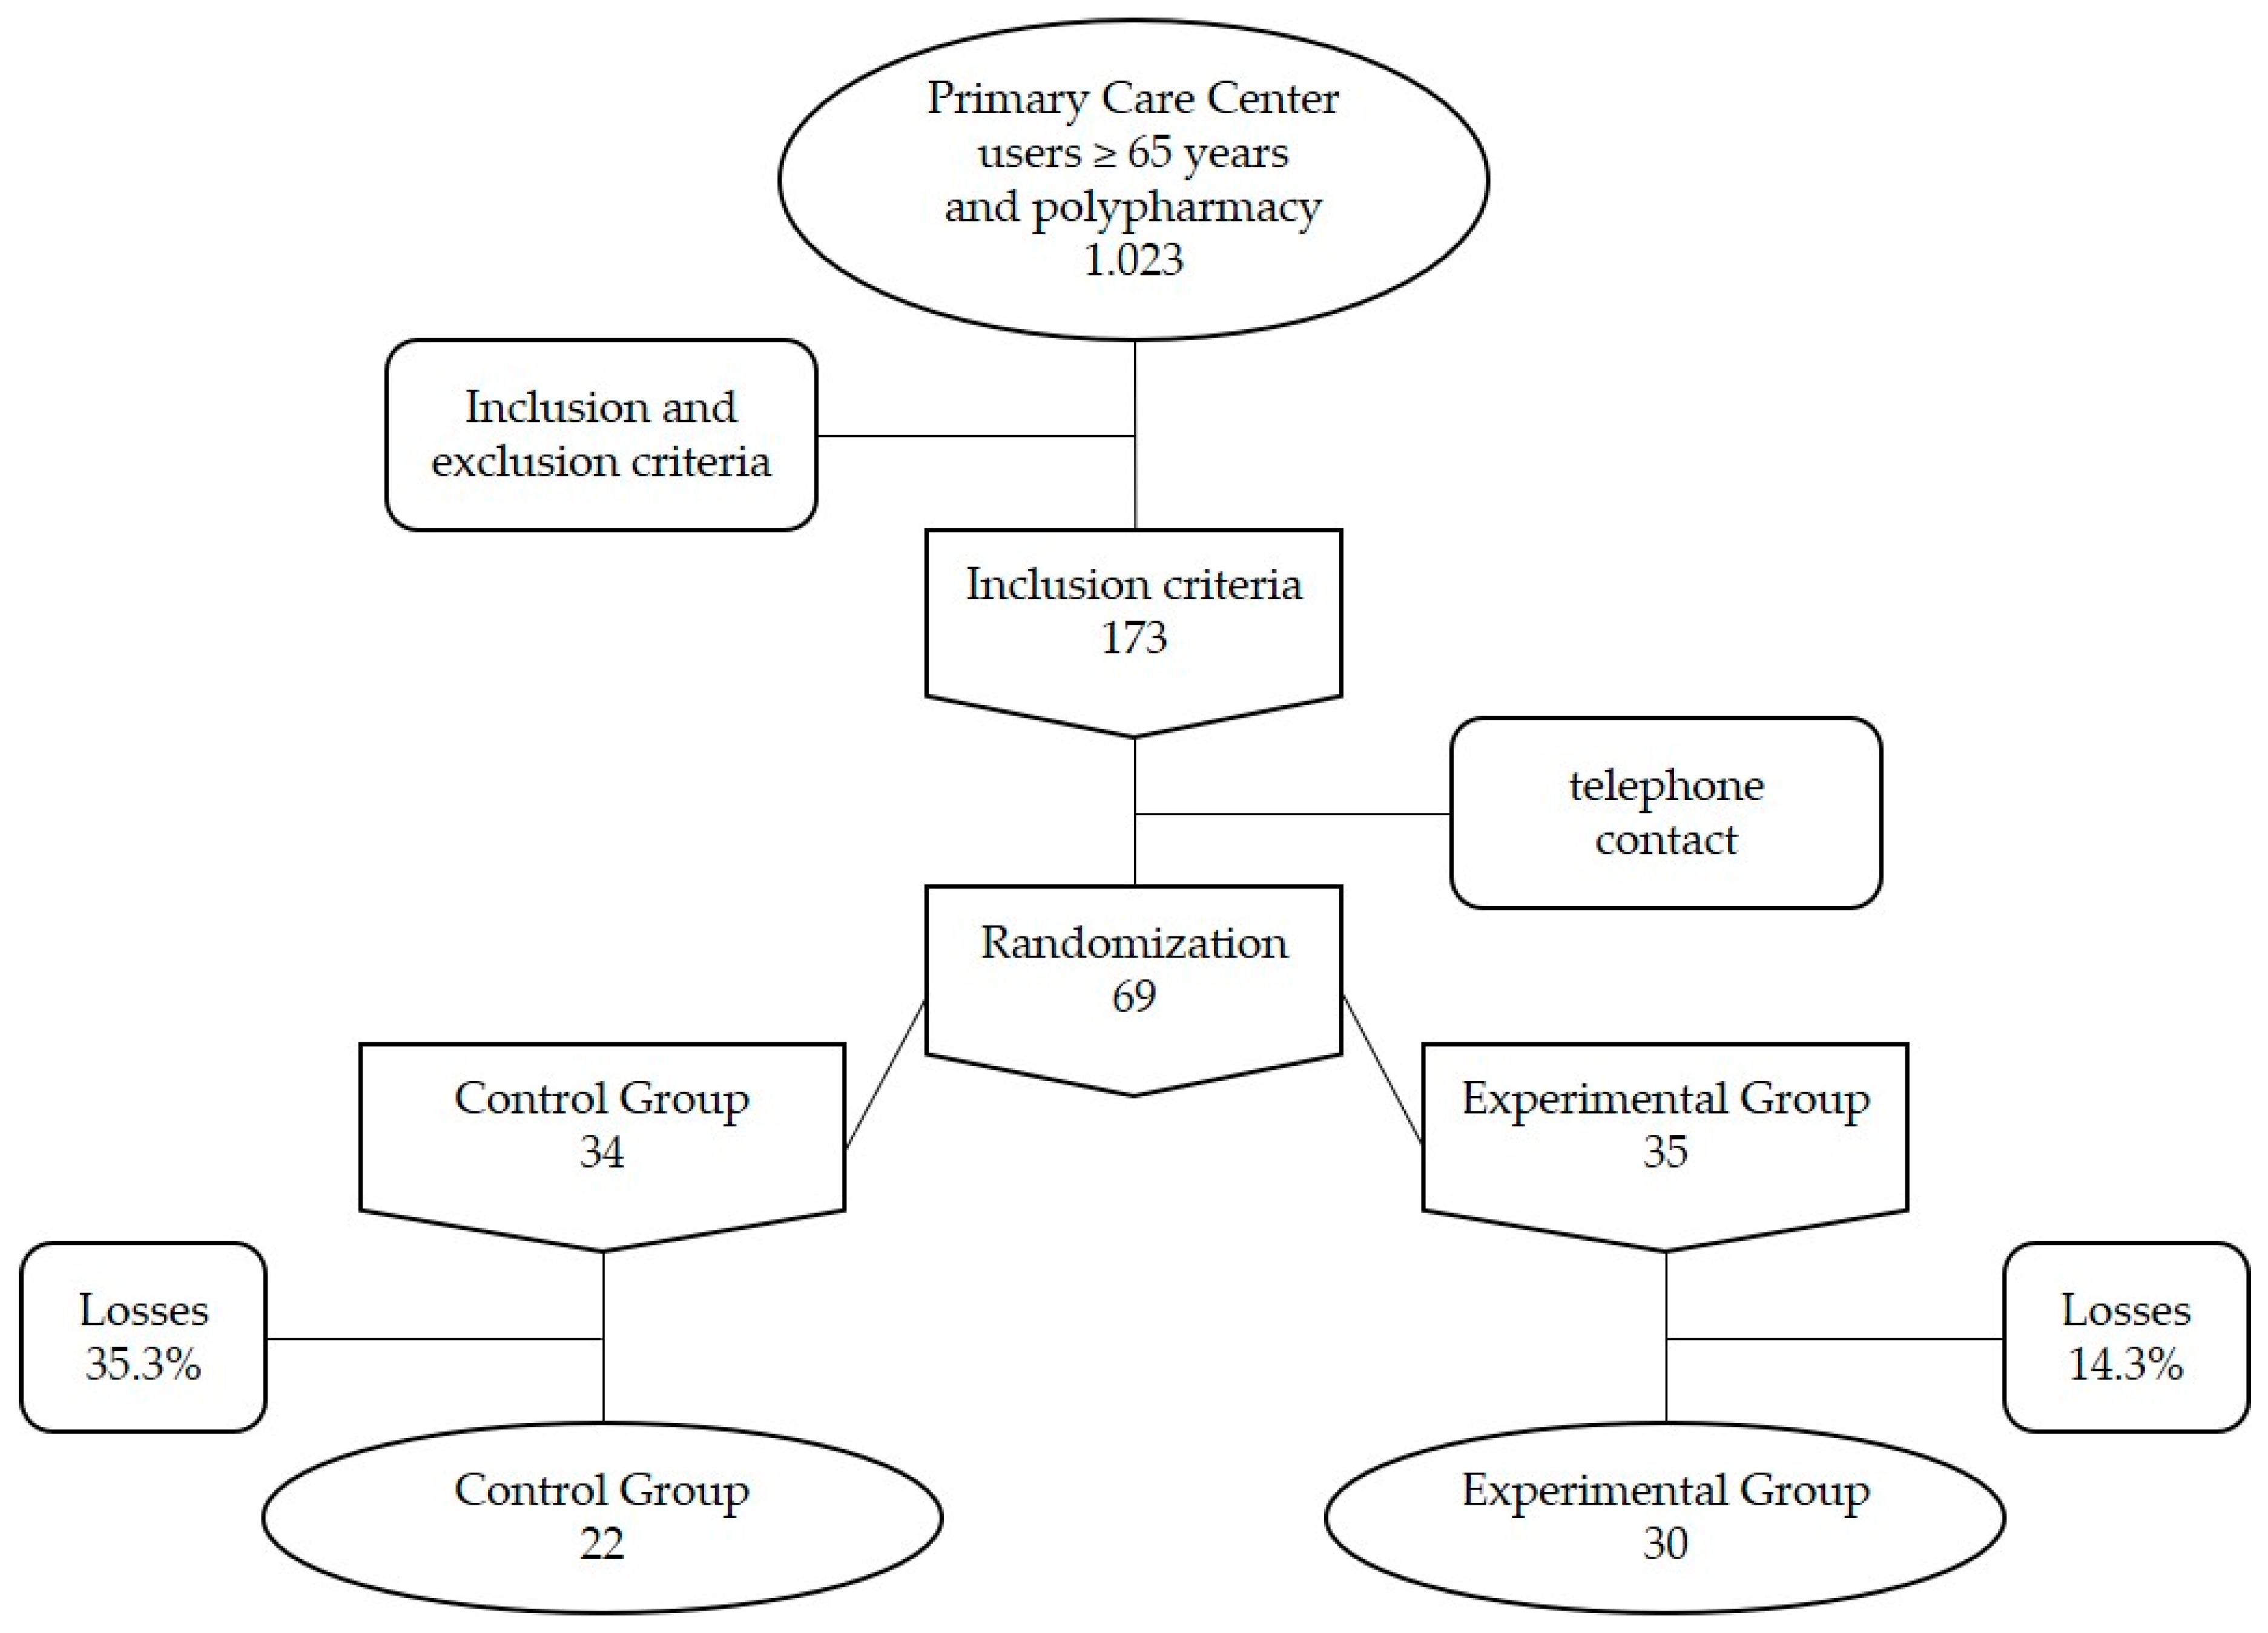
2.1. Design and Participants
2.2. Measurements
2.2.1. Response Variables
2.2.2. Control Variables
2.3. General Procedures
2.4. Human and Animal Resources
2.5. Statistical Analysis
2.6. Ethical Considerations
3. Results
3.1. Description of Patients Included, Analysis of the Control Variables and Efficacy Variables at Baseline (before the Intervention)
3.2. Evaluation of the Effectiveness of the Intervention via the Main Variable
3.3. Evaluation of the Effectiveness of the Intervention via the Secondary Variables
3.4. Evaluation of the Effectiveness of the Intervention Based on the Level of Pain Measured in Each Session Using the VAS Scale
3.5. Evaluation of Patient Satisfaction
4. Discussion
5. Conclusions
Supplementary Materials
Author Contributions
Funding
Acknowledgments
Conflicts of Interest
References
- Direcció General de Planificació i Avaluació. Pla Director Sociosanitari; Departament de Salut, Generalitat de Catalunya: Barcelona, Spain, 2006; pp. 88–101.
- World Health Organization. Active Ageing: A Policy Framework 2002. Available online: http://whqlibdoc.who.int/hq/2002/WHO_NMH_NPH_02.8.pdf?ua=1 (accessed on 21 January 2019).
- Franco, M.C.; Seoane de Lucas, A. Características del dolor crónico en el anciano: Tratamiento. Rev. Soc. Esp. Dolor 2001, 8, 29–38. [Google Scholar]
- Gu, J.; Chao, J.; Chen, W.; Xu, H.; Zhang, R.; He, T.; Deng, L. Multimorbidity and health-related quality of life among the community-dwelling elderly: A longitudinal study. Arch. Gerontol. Geriatr. 2018, 74, 133–140. [Google Scholar] [CrossRef] [PubMed]
- Departament de Salut. Enquesta de Salut de Catalunya 2014; Generalitat de Catalunya: Barcelona, Spain, 2015.
- Mencías, A.B.; Rodríguez, J.L. Consideraciones sobre el empleo de opioides en el dolor crónico del paciente geriátrico. Rev. Soc. Esp. Dolor 2008, 7, 463–474. [Google Scholar]
- Reyes-Gibby, C.C.; Aday, L.; Cleeland, C. Impact of pain on self-rated health in the community dwelling older adults. Pain 2002, 95, 75–82. [Google Scholar] [CrossRef]
- Rogers, F.J. Osteopathic treatment of low back pain. N. Engl. J. Med. 2000, 342, 818. [Google Scholar] [PubMed]
- Correa, G. Dolor crónico y trauma músculo esquelético: Discapacidad e impacto económico. Rev. Iberoam. Dolor 2007, 4, 10–18. [Google Scholar]
- Berry, P.H.; Dahl, J.L. The new JCAHO pain standards: Implications for pain management nurses. Pain Manag. Nurs. 2000, 1, 3–12. [Google Scholar] [CrossRef] [PubMed]
- Institute for Clinical Systems Improvement (ICSI). Assessment and Management of Chronic Pain. Bloomington (MN): Institute for Clinical Systems Improvement (ICSI). 2007. [Revised March 2019]. Available online: http://www.icsi.org/guidelines_and_more/gl_os_prot/musculoskeletal/pain__chronic__assessment_and_management_of_14399/pain__chronic__assessment_and_management_of_14400.html (accessed on 23 January 2019).
- Health Care Association of New Jersey (HCANJ). Pain Management Guideline. Hamilton (NJ): Health Care Association of New Jersey (HCANJ) [Seriate on Line]. 2006. Available online: https://www.hcanj.org/files/2013/09/hcanjbp_painmgmt2_3.pdf (accessed on 14 March 2019).
- Muñoz Lasa, S.; Ferriero, G.; Brigatti, E.; Valero, R.; Franchignoni, F. Animal-assisted interventions in internal and rehabilitation medicine: A review of the recent literature. Panminerva Med. 2011, 53, 129–136. [Google Scholar]
- Jegatheesan, B.; Beetz, A.; Ormerod, E.; Johnson, R.; Fine, A.; Yamazaki, K.; Dudzik, C.; Garcia, R.M.; Winkle, M.; Choi, G. International Association of Human-Animal Interaction Organizations: IAHAIO White Paper 2014. The IAHAIO Definitions for Animal Assisted Intervention and Guidelines for Wellness of Animals Involved. 2015. Available online: http://www.iahaio.org/new/fileuploads/4163IAHAIO%20WHITE%20PAPER-%20FINAL%20-%20NOV%2024-2014.pdf (accessed on 11 April 2019).
- Terminology [web]. Pet Partners. 2015. Available online: https://petpartners.org/learn/terminology/ (accessed on 11 April 2019).
- Handlin, L.; Hydbring-Sandberg, E.; Nilsson, A.; Ejdebäck, M.; Jansson, A.; Uvnäs-Moberg, K. Short-term interaction between dogs and their owners: Effects of oxytocin, cortisol, insulin and heart rate. An exploratory study. Anthrozoos 2011, 24, 301–315. [Google Scholar] [CrossRef]
- Miller, S.C.; Kennedy, C.; DeVoe, D.; Hickey, M.; Nelson, T.; Kogan, L. An examination of changes in oxytocin levels in men and women before and after interaction with a bonded dog. Anthrozoos 2009, 22, 31–42. [Google Scholar] [CrossRef]
- Nagasawa, M.; Kikusui, T.; Onaka, T.; Ohta, M. Dog’s gaze at its owner increases owner’s urinary oxytocin during social interaction. Horm. Behav. 2009, 55, 434–441. [Google Scholar] [CrossRef] [PubMed]
- Beetz, A.; Uvnäs-Moberg, K.; Julius, H.; Kotrschal, K. Psychosocial and psychophysiological effects of human-animal interactions: the possible role of oxytocin. Front. Psychol. 2012, 3, 234. [Google Scholar] [CrossRef] [PubMed]
- Beetz, A.; Julius, H.; Turner, D.; Kotrschal, K. Effects of social support by a dog on stress modulation in male children with insecure attachment. Front. Psychol. 2012, 3, 352–360. [Google Scholar] [CrossRef] [PubMed]
- Jones, M.G.; Rice, S.M.; Cotton, S.M. Incorporating animal-assisted therapy in mental health treatments for adolescents: A systematic review of canine assisted psycotherapy. PLoS ONE 2019, 14, e0210761. [Google Scholar] [CrossRef] [PubMed]
- Friedmann, E.; Galik, E.; Thomas, S.A.; Hall, P.S.; Chung, S.Y.; McCune, S. Evaluation of a pet-assisted living intervention for improving functional status in assisted living residents with mild to moderate cognitive impairment: A pilot study. Am. J. Alzheimers Dis. Other Demen. 2015, 30, 276–289. [Google Scholar] [CrossRef] [PubMed]
- Swall, A.; Ebbeskog, B.; Lundh Hagelin, C.; Fagerberg, I. Can therapy dogs evoke awareness of one’s past and present life in persons with Alzheimer’s disease? Int. J. Older People Nurs. 2015, 10, 84–93. [Google Scholar] [CrossRef]
- Majic, T.; Gutzmann, H.; Heinz, A.; Lang, U.E.; Rapp, M.A. Animal-assisted therapy and agitation and depression in nursing home residents with dementia: A matched case-control trial. Am. J. Geriatr. Psychiatry 2013, 21, 1052–1059. [Google Scholar] [CrossRef]
- Nordgren, L.; Engström, G. Effects of dog-assisted intervention on behavioural and psychological symptoms of dementia. Nurs. Older People 2014, 26, 31–38. [Google Scholar] [CrossRef]
- Nordgren, L.; Engström, G. Animal-assisted intervention in dementia: Effects on quality of life. Clin. Nurs. Res. 2014, 23, 7–19. [Google Scholar] [CrossRef]
- Perraud, F. Animals used in therapy for thewellbeing of elderly people. Soins Gerontol. 2013, 99, 10–12. [Google Scholar] [CrossRef]
- Berry, A.; Borgi, M.; Terranova, L.; Chiarotti, F.; Alleva, E.; Cirulli, F. Developing effective animal-assisted intervention programs involving visiting dogs for institucionalized geriatric patients: A pilot study. Psychogreiatrics 2012, 12, 143–150. [Google Scholar] [CrossRef] [PubMed]
- Bernabei, V.; De Ronchi, D.; La Ferla, T.; Moretti, F.; Tonelli, L.; Ferrari, B.; Forlani, M.; Atti, A.R. Animal-assisted interventions for elderly patients affected by dementia or psychiatric disorders: A review. J. Psychiatr. Res. 2013, 47, 762–773. [Google Scholar] [CrossRef] [PubMed]
- Snipelisky, D.; Burton, M.C. Canine-assisted therapy in the inpatient setting. South Med. J. 2014, 107, 265–273. [Google Scholar] [CrossRef] [PubMed]
- Creagan, E.T.; Bauer, B.A.; Thomley, B.S.; Borg, J.M. Animal-assisted therapy at Mayo Clinic: The time is now. Compl. Ther. Clin. Pract. 2015, 21, 101–104. [Google Scholar] [CrossRef] [PubMed]
- Braun, C.; Stangler, T.; Naveson, J.; Pettingell, S. Animal-assisted therapy as a pain relief intervention for children. Compl. Ther. Clin. Pract. 2009, 15, 105–109. [Google Scholar] [CrossRef] [PubMed]
- Sobo, E.J.; Eng, B.; Kassity-Krich, N. Canine visitation (pet) therapy pilot data on decreases in child perception. J. Holist. Nurs. 2006, 24, 51–57. [Google Scholar] [CrossRef]
- Harper, C.M.; Dong, Y.; Thornhill, T.S.; Wright, J.; Ready, J.; Brick, G.W.; Dyer, G. Can therapy dogs improve pain and satisfaction after total join arthroplasty? A randomized controlled trial. Clin. Orthop. Relat. Res. 2015, 73, 372–379. [Google Scholar] [CrossRef]
- Marcus, D.A.; Bernstein, C.D.; Constantin, J.M.; Kunkel, F.A.; Breuer, P.; Hanlon, R.B. Animal-assisted therapy at an outpatient pain manegement clinic. Pain Med. 2012, 13, 45–47. [Google Scholar] [CrossRef]
- Marcus, D.A. The sicence behind animal-assisted therapy. Curr. Pain Headache Rep. 2013, 17, 322. [Google Scholar] [CrossRef]
- Le Forta, S.; Gray-Donaldb, K.; Rowatc, K.; Jeans, M.E. Randomized controlled trial of a community-based psychoeducation program for the self-management of chronic pain. Pain 1998, 74, 297–306. [Google Scholar] [CrossRef]
- Beas-Jiménez, J.D.; Centeno-Prada, R.A.; Rosety Plaza, M. Gasto anual medio en fármacos para el tratamiento de patologías osteoarticulares en mayores de 65 años no institucionalizados: infl uencia de la práctica regular de ejercicio físico. Rev. Andaluza Med. Deporte 2009, 2, 126–132. [Google Scholar]
- Lust, E.; Ryan-Haddad, A.; Coover, K.; Snell, J. Measuring clinical outcomes of animal-assisted therapy: Impact on resident medication usage. Consult Pharm. 2007, 22, 580–585. [Google Scholar] [CrossRef] [PubMed]
- Gallardo Schall, P.A.; Rivas Espinoza, R.E. Terapia asistida con perros en pacientes con demencia y SPCD institucionalizados en centros residenciales de Toledo, España. Inf. Psiquiátricas 2015, 220, 113–127. [Google Scholar]
- Edwards, N.E.; Beck, A.M. Animal-assisted therapy and Nutrition in Alzheimer’s disease. West J. Nurs. Res. 2002, 24, 697–712. [Google Scholar] [CrossRef] [PubMed]
- Grandgeorge, M.; Hausberger, M. Human-animal relationships: From daily life to animal-assisted therapies. Ann. Ist. Super. Sanità 2011, 47, 397–408. [Google Scholar] [PubMed]
- Reed, M.D.; Van Nostran, W. Assessing pain intensity with the visual analog scale: A plea for uniformity. J. Clin. Pharmacol. 2014, 54, 241–244. [Google Scholar] [CrossRef]
- Bellamy, N.; Buchanan, W.W.; Goldsmith, C.H.; Campbell, J.; Stitt, L.W. Validation study of WOMAC: A health status instrument for measuring clinically important patient relevant outcomes to antirheumatic drug therapy in patients with osteoarthritis of the hip or knee. J. Rheumatol. 1988, 15, 1833–1840. [Google Scholar] [PubMed]
- Huskisson, E.C. Measurements of pain. Lancet 1974, 304, 1127–1131. [Google Scholar] [CrossRef]
- Herdman, M.; Badia, X.; Berra, S. El EuroQol-5D: Una alternativa sencilla para la medición de la calidad de vida relacionada con la salud en atención primaria. Aten. Primaria 2001, 28, 425–429. [Google Scholar] [CrossRef]
- Esteve-Vives, J.; Batlle-Gualda, E.; Reig, A. Spanish versión of the Health Assessment Questionnaire: reliability, validity and transcultural equivalency. Grupo para la Adaptación del HAQ a la Población Española. J. Rheumatol. 1993, 20, 2116–2122. [Google Scholar]
- Hoyl, M.T.; Alessi, C.A.; Harker, J.O.; Josephson, K.R.; Pietruszka, F.M.; Koelfgen, M.; Mervis, J.R.; Fitten, L.J.; Rubenstein, L.Z. Development and testing of a five-item version of the geriatric depression scale. J. Am. Geriatr. Soc. 1999, 47, 873–878. [Google Scholar] [CrossRef] [PubMed]
- Benito, M.; Machado, E. Introducción a la cinesiteràpia. In Cinesiterapia, Bases Fisiológicas y Aplicación Clínica, 1st ed.; Fernández, C., Melián, A., Eds.; Elsevier: Barcelona, Spain, 2013; pp. 1–14. [Google Scholar]
- Pedrosa, S.; Aguado, D.; Canfrán, S.; Torres, J.; Miró, J. La terapia asistida con perros en el tratamiento de las personas con dolor crónico: una revisión sistemática. Rev. Soc. Esp. Dolor 2017, 24, 11–18. [Google Scholar] [CrossRef]
- Baños, J.E.; Bosch, F. Conceptos generales en algología. In Tratamiento del Dolor Teoría y Práctica, 2nd ed.; Aliaga, L., Baños, J.E., de Barutell, C., Molet, J., Rodríguez de la Serna, A., Eds.; Publicaciones Permanyer: Barcelona, Spain, 2002; p. 5. [Google Scholar]
- Odendaal, J.J.; Meintjes, R.A. Neurophysiological correlates of affiliative behavior between humans and dogs. Vet. J. 2003, 165, 296–301. [Google Scholar] [CrossRef]
- Gordillo, A.V.; Ramírez, B.A.; Solís, V.G.; Bautista, S.S.; Kassian, R.A. Causas de dolor crónico en la clínica del dolor del Hospital General de México. Rev. Dolor Clínica Terapia 2004, 1, 15–23. [Google Scholar]
- Carr, E.C.J.; Wallace, J.E.; Pater, R.; Gross, D.P. Evaluating the relationship between well-being and living with a dog for people with chronic low back pain: A feasibility study. Int. J. Environ. Res. Public Health 2019, 16, 1472. [Google Scholar] [CrossRef] [PubMed]
- Marcus, D.A.; Bernstein, C.D.; Constantin, J.M.; Kunkel, F.A.; Breuer, P.; Hanlon, R.B. Impact of animal-assisted therapy for outpatients with fibromyalgia. Pain Med. 2013, 14, 43–51. [Google Scholar] [CrossRef] [PubMed]
- Charnetski, C.J.; Riggers, S.; Brennan, F.X. Effect of petting a dog on immune system function. Psychol. Rep. 2004, 95, 1087–1091. [Google Scholar] [CrossRef] [PubMed]
- Vangoli, L.; Caprilli, S.; Vernucci, C.; Zagni, S.; Mugnai, F.; Messeri, A. Can presence of a dog reduce pain and distress in children furing venipuncture? Pain Mang Nurs. 2015, 16, 89–95. [Google Scholar]
- Barker, S.B.; Knisely, J.S.; McCain, N.L.; Best, A.M. Measuring stress and immune response in healthcare professionals following interaction with a therapy dog: A pilot study. Psychol. Rep. 2005, 96, 713–729. [Google Scholar] [CrossRef]
- Mease, P.J. Further strategies for treating fibromyalgia: The role of serotonin and norepinephrine reuptake inhibitors. Am. J. Med. 2009, 122, S44–S55. [Google Scholar] [CrossRef]
- Calcaterra, V.; Veggiotti, P.; Palestrini, C.; De Giorgis, V.; Raschetti, R.; Tumminelli, M. Post-operative benefits of animal-assisted therapy in pediatric surgery: A randomised study. PLoS ONE 2015, 10, e0125813. [Google Scholar] [CrossRef] [PubMed]
- Miller, J.; Ingram, L. Perioperative nursing and animal-assisted therapy. AORN J. 2000, 72, 477–483. [Google Scholar] [CrossRef]
- Geisler, A.M. Companion animals in palliative care: stories from the bedside. Am. J. Hosp. Palliat. Care 2004, 21, 285–288. [Google Scholar] [CrossRef] [PubMed]
- McCaffrey, R.; Freeman, E. Effect of music on chronic osteoarthritis pain in older people. J. Adv. Nurs. 2003, 44, 517–524. [Google Scholar] [CrossRef] [PubMed] [Green Version]
- Noceda Bermejo, J.J.; Moret Ten, C.; Lauzirika Alonso, I. Tratamiento del dolor osteomuscular crónico. Aten. Primaria 2007, 39, 29–33. [Google Scholar] [CrossRef] [PubMed]
- Moretti, F.; De Ronchi, D.; Bernabei, V.; Marchetti, L.; Ferrari, B.; Forlani, C.; Negretti, F.; Sacchetti, C.; Atti, A.R. Pet therapy in elderly patients with mental illness. Psychogeriatrics 2011, 11, 125–129. [Google Scholar] [CrossRef]
- Villalta-Gil, V.; Roca, M.; Gonzalez, N.; Domenec, E.; Cuca, B.; Escanilla, A.; Haro, J.M. Dog-assisted therapy in the treatment of chronic schizophrenia inpatients. Anthrozoos 2009, 22, 149–159. [Google Scholar] [CrossRef]
- Fleishman, S.B.; Homel, P.; Chen, M.R.; Rosenwald, V.; Abolencia, V.; Gerber, J.; Nadesan, S. Beneficial effects of animal-assisted visits on quality of life during multimodal radiation-chemotherapy regimens. J. Community Support. Oncol. 2015, 13, 22–26. [Google Scholar] [CrossRef]
- Yeh, M.L. Lassie’s magic: Animal-assisted therapy in Taiwan. Hu Li Za Zhi 2005, 52, 23–30. [Google Scholar]
- Sellers, D.M. The evaluation of an animal assisted therapy intervention for elders with dementia in long-term care. Act. Adapt. Aging 2006, 30, 61–77. [Google Scholar]
- Mora Ripoll, R.; Quintana Casado, I. Risa y terapias positivas: moderno enfoque y aplicaciones prácticas en medicina. Rev. Psiquiatr. Salud Ment. 2010, 3, 27–34. [Google Scholar] [CrossRef]
- Lyubomirsky, S.; King, L.; Diener, E. The benefits of frequent positive affect: Does happiness lead to success? Psychol. Bull. 2005, 131, 803–855. [Google Scholar] [CrossRef] [PubMed]
- Fredrickson, B.L.; Joiner, T. Positive emotions trigger upward spirals toward emotional well-being. Psychol. Sci. 2002, 13, 172–175. [Google Scholar] [CrossRef] [PubMed]
- Danner, D.D.; Snowdon, D.A.; Friesen, W.V. Positive emotions in early life and longevity: Findings from the nun study. J. Personal. Soc. Psychol. 2001, 80, 804–813. [Google Scholar] [CrossRef]
- Ostir, G.; Markides, K.; Black, S.; Goodwin, J. Emotional well-being predicts subsequent functional independence and survival. J. Am. Geriatr. Soc. 2000, 48, 473–478. [Google Scholar] [CrossRef] [PubMed]
- Aspinwal, L.G. Dealing with adversity: Self-regulation, coping, adaptation, and health. In The Blackwell Hadbook of Social Phychology; Tesser, A., Schwarz, N., Eds.; Backwell: Malden, The Netherlands, 2001; pp. 159–614. [Google Scholar]
- Fredrickson, B.L. The value of positive emotions. Am. Sci. 2003, 91, 330–335. [Google Scholar] [CrossRef]
- Halm, M.A. The healing power of the human-animal connection. Am. J. Crit. Care 2008, 17, 373–376. [Google Scholar] [PubMed]
- Fine, A. Nuestros Fieles Compañeros. Explorando la Esencia de Nuestra Relación con los Animales; Kns edition; SC (Spanish version): A Coruña, Spain, 2015; p. 166. ISBN 978-84-941852-9-8. [Google Scholar]
- White, J.H.; Quinn, M.; Garland, S.; Dirkse, D.; Wiebe, P.; Hermann, M.; Carlson, L.E. Animal-assisted therapy and counseling support for women with breast cancer: An exploration of patient’s perceptions. Integr. Cancer Ther. 2015, 14, 460–467. [Google Scholar] [CrossRef] [PubMed]
- Dimitrijević, I. Animal-assisted therapy—A new trend in the treatment of children and adults. Psychiatr. Danub. 2009, 21, 236–241. [Google Scholar]


| Variables | Groups | |||
|---|---|---|---|---|
| All Patients n = 52 (100%) | Control n = 22 (42.31%) | Experimental n = 30 (57.69%) | p-Value | |
| Age | 75.60 (7.29) | 77.50 (7.30) | 74.20 (7.08) | 0.11 |
| Gender | 0.64 | |||
| man | 5 (9.62%) | 3 (13.64%) | 2 (6.67%) | |
| woman | 47 (90.38%) | 19 (86.36%) | 28 (93.33%) | |
| Weight | 70.89 (12.5) | 72.25 (13.34) | 69.03 (11.29) | 0.23 |
| Height | 153.76 (8.13) | 152.71 (6.63) | 155.2 (9.8) | 0.63 |
| Body Mass Index | 29.96 (4.91) | 30.85 (5.38) | 28.74 (3.98) | 0.09 |
| Charlson Index | 1.56 (1.97) | 1.5 (1.5) | 1.64 (2.52) | 0.45 |
| Number of sessions held | 9.35 (1.80) | 8.82 (1.65) | 9.73 (1.84) | 0.06 |
| Live alone | 1 | |||
| live alone | 15 (28.85%) | 6 (27.27%) | 9 (30%) | |
| no live alone | 37 (71.15%) | 16 (72.73%) | 21 (70%) | |
| Pet | 0.76 | |||
| no pet | 36 (69.23%) | 16 (72.73%) | 20 (66.67%) | |
| live with pet | 16 (30.77%) | 6 (27.27%) | 10 (33.33%) | |
| Basal Response Variables | Groups | |||
|---|---|---|---|---|
| All Patients n = 52 (100%) | Control n = 22 (42.31%) | Experimental n = 30 (57.69%) | p-Value | |
| WOMAC | ||||
| General | 8.40 (3.03) | 7.82 (1.82) | 8.83 (3.65) | 0.57 |
| Stiffness | 3.27 (1.30) | 3.77 (1.11) | 2.90 (1.32) | 0.02 |
| Functional capacity | 27.67 (8.53) | 27.32 (7.21) | 27.93 (9.49) | 0.91 |
| Lattinen | ||||
| General | 12.06 (3.30) | 12.09 (3.28) | 12.03 (3.38) | 0.72 |
| Intensity | 2.50 (0.90) | 2.59 (0.96) | 2.43 (0.86) | 0.7 |
| Frequency | 2.83 (0.90) | 2.77 (0.92) | 2.87 (0.90) | 0.79 |
| Analgesics | 2.12 (0.83) | 1.91 (0.81) | 2.27 (0.83) | 0.11 |
| lncapacity | 1.94 (0.64) | 2.00 (0.62) | 1.90 (0.66) | 0.58 |
| Pain induced insomnia | 2.46 (1.31) | 2.68 (1.25) | 2.30 (1.34) | 0.27 |
| EuroQoL | 9.25 (1.68) | 9.50 (1.85) | 9.07 (1.55) | 0.4 |
| HAQ | 1.28 (0.51) | 1.38 (0.47) | 1.21 (0.54) | 0.14 |
| Yesavage depression | 1.63 (1.60) | 1.55 (1.30) | 1.70 (1.80) | 0.93 |
| Baseline Session 1 VAS | 4.98 (2.54) | 4.89 (2.95) | 5.04 (2.31) | 0.94 |
| Response Variables | Control Group n = 22 (42.31%) | Experimental Group n = 30 (57.69%) | ||||||||||
|---|---|---|---|---|---|---|---|---|---|---|---|---|
| Pre | Post | Difference (Post-Pre) | 95% CI | p-Value | Pre | Post | Difference (Post-Pre) | 95% CI | p-Value | |||
| A | B | A | B | |||||||||
| WOMAC | ||||||||||||
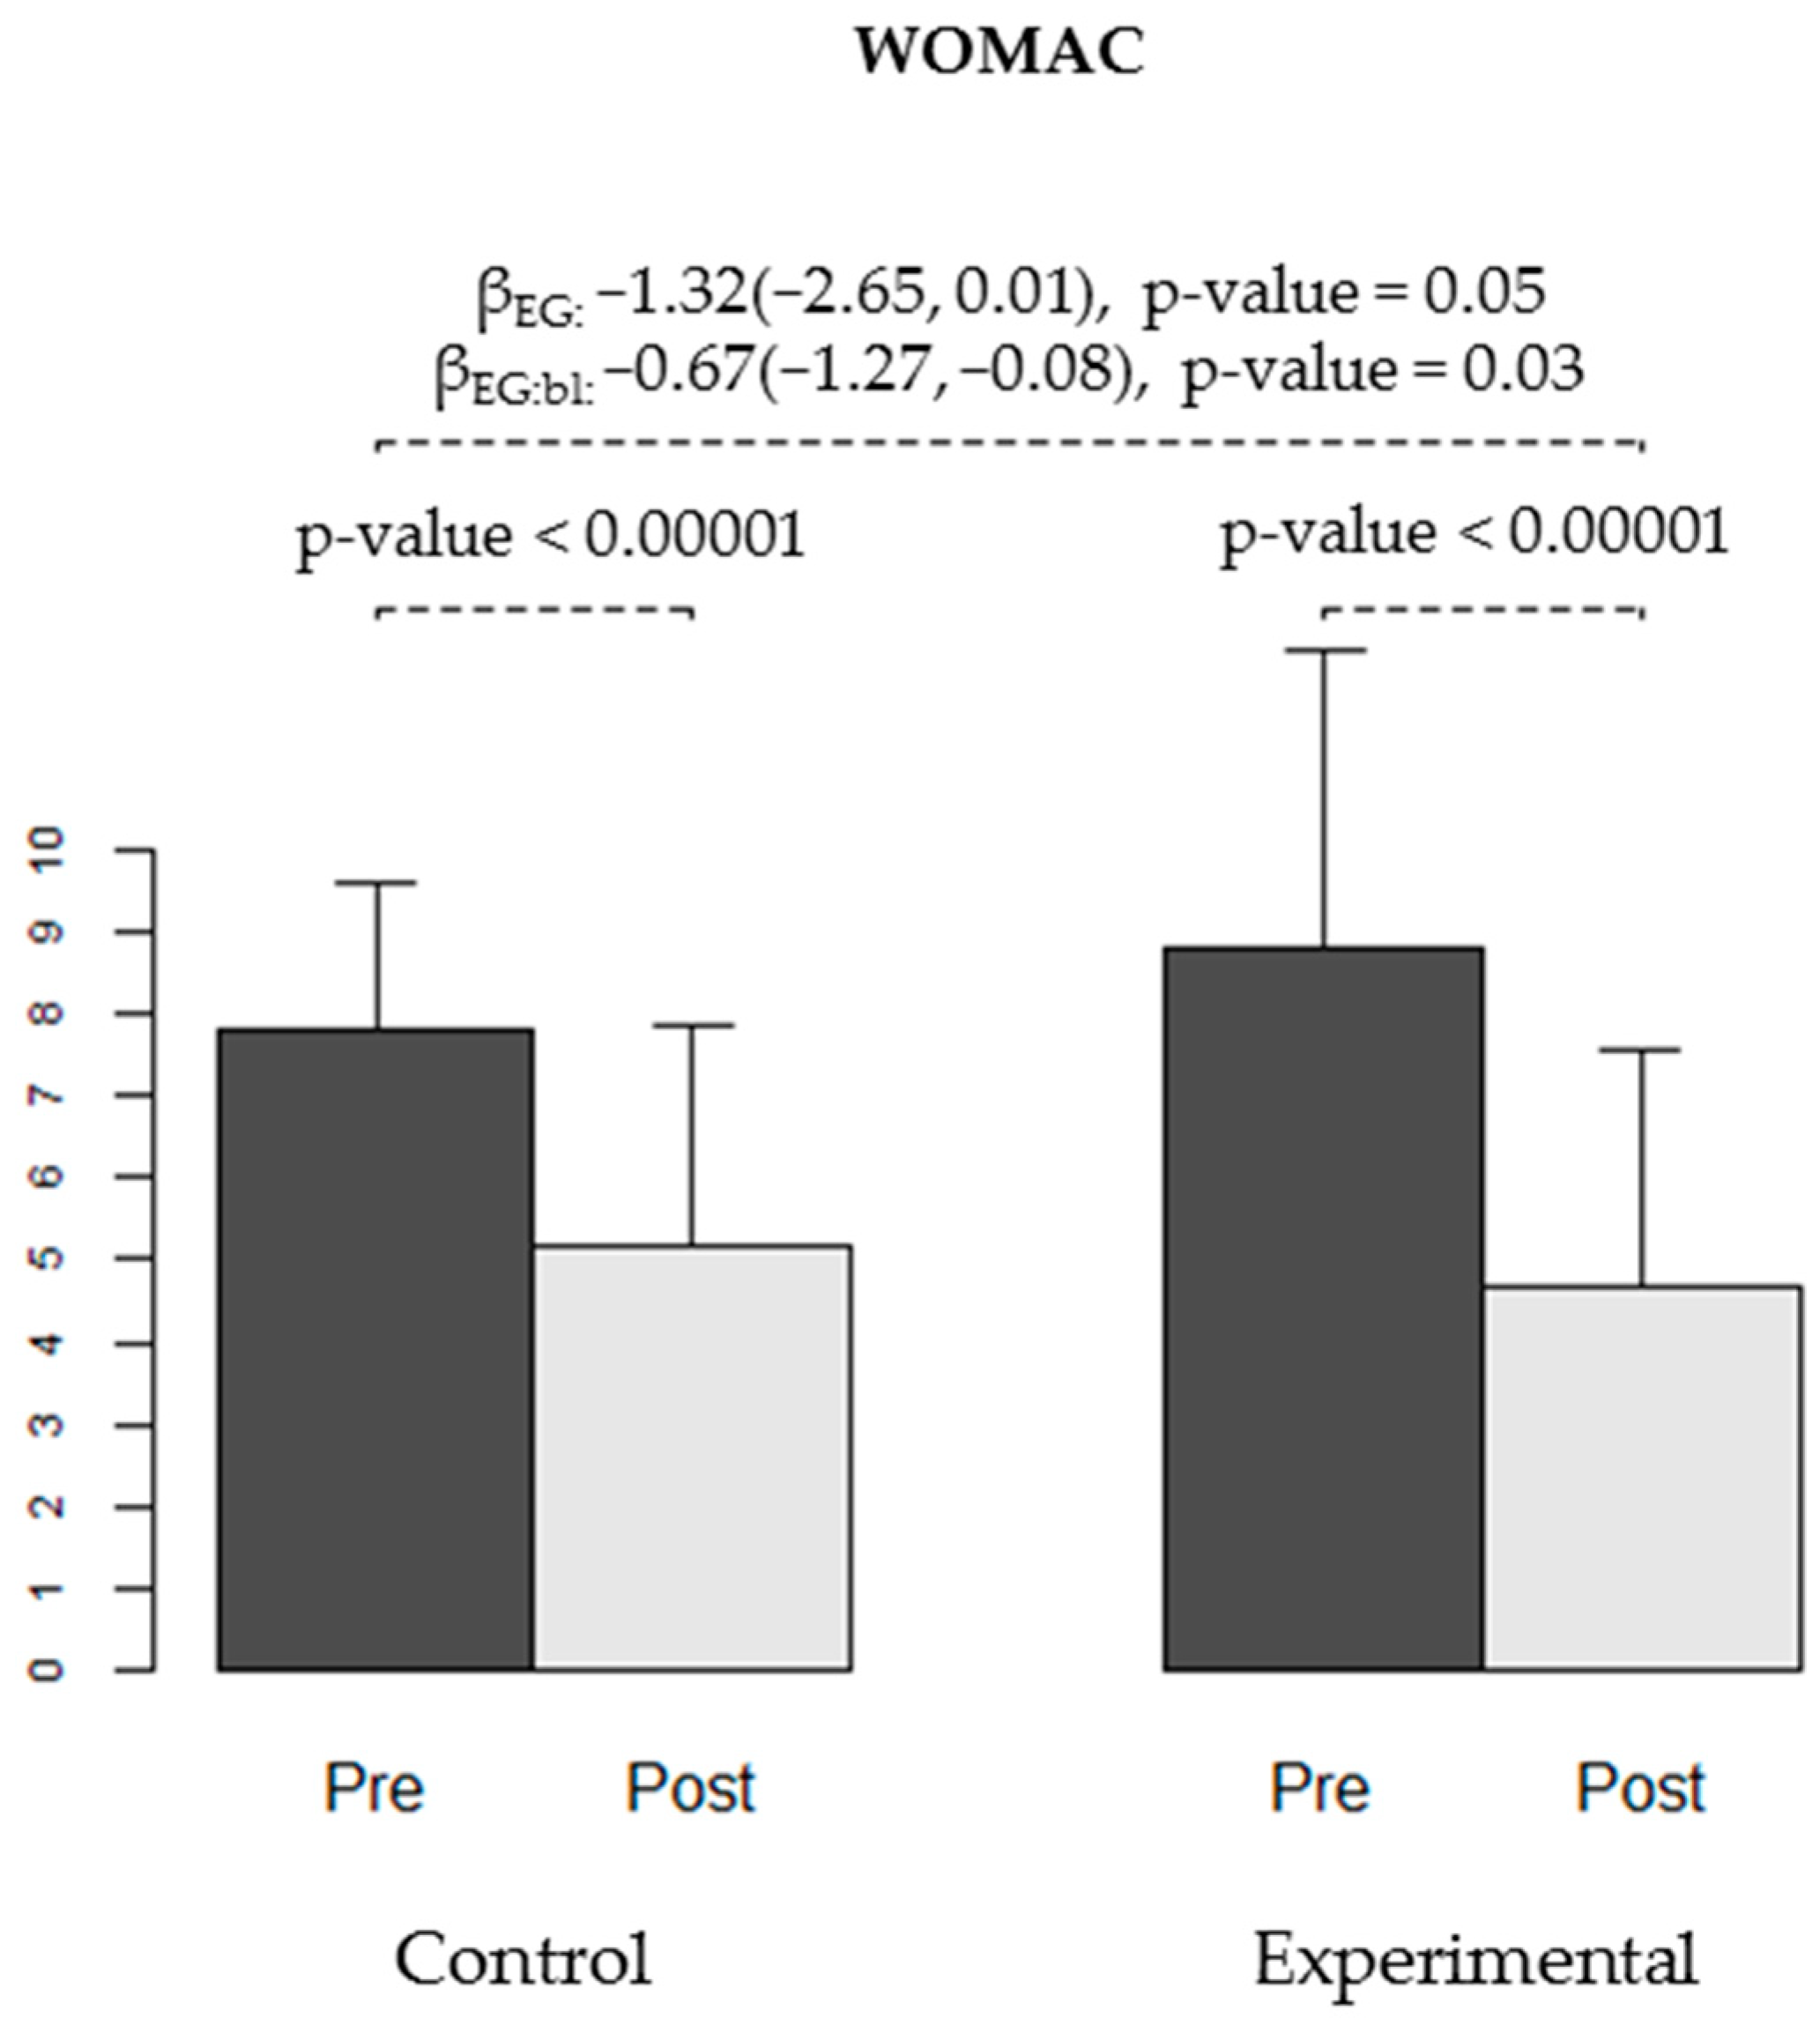
| Pain | 7.82 (1.82) | 5.18 (2.67) | −2.64 (1.81) | (−3.44, −1.83) | <0.00001 | 0.00008 | 8.83 (3.65) | 4.67 (2.9) | −4.17 (3.31) | (−5.4, −2.93) | <0.00001 | <0.00001 |
| Stiffness | 3.77 (1.11) | 2.5 (1.22) | −1.27 (1.35) | (−1.87, −0.67) | 0.0002 | 0.001 | 2.9 (1.32) | 2.3 (1.24) | −0.6 (1.16) | (−1.03, −0.17) | 0.008 | 0.009 |
| Functional capacity | 27.32 (7.21) | 19.95 (7.52) | −7.36 (5.55) | (−9.82, −4.9) | <0.00001 | 0.0002 | 27.93 (9.49) | 17.13 (8.61) | −10.8 (7.1) | (−13.45, −8.15) | <0.00001 | <0.00001 |
| Lattinen | ||||||||||||
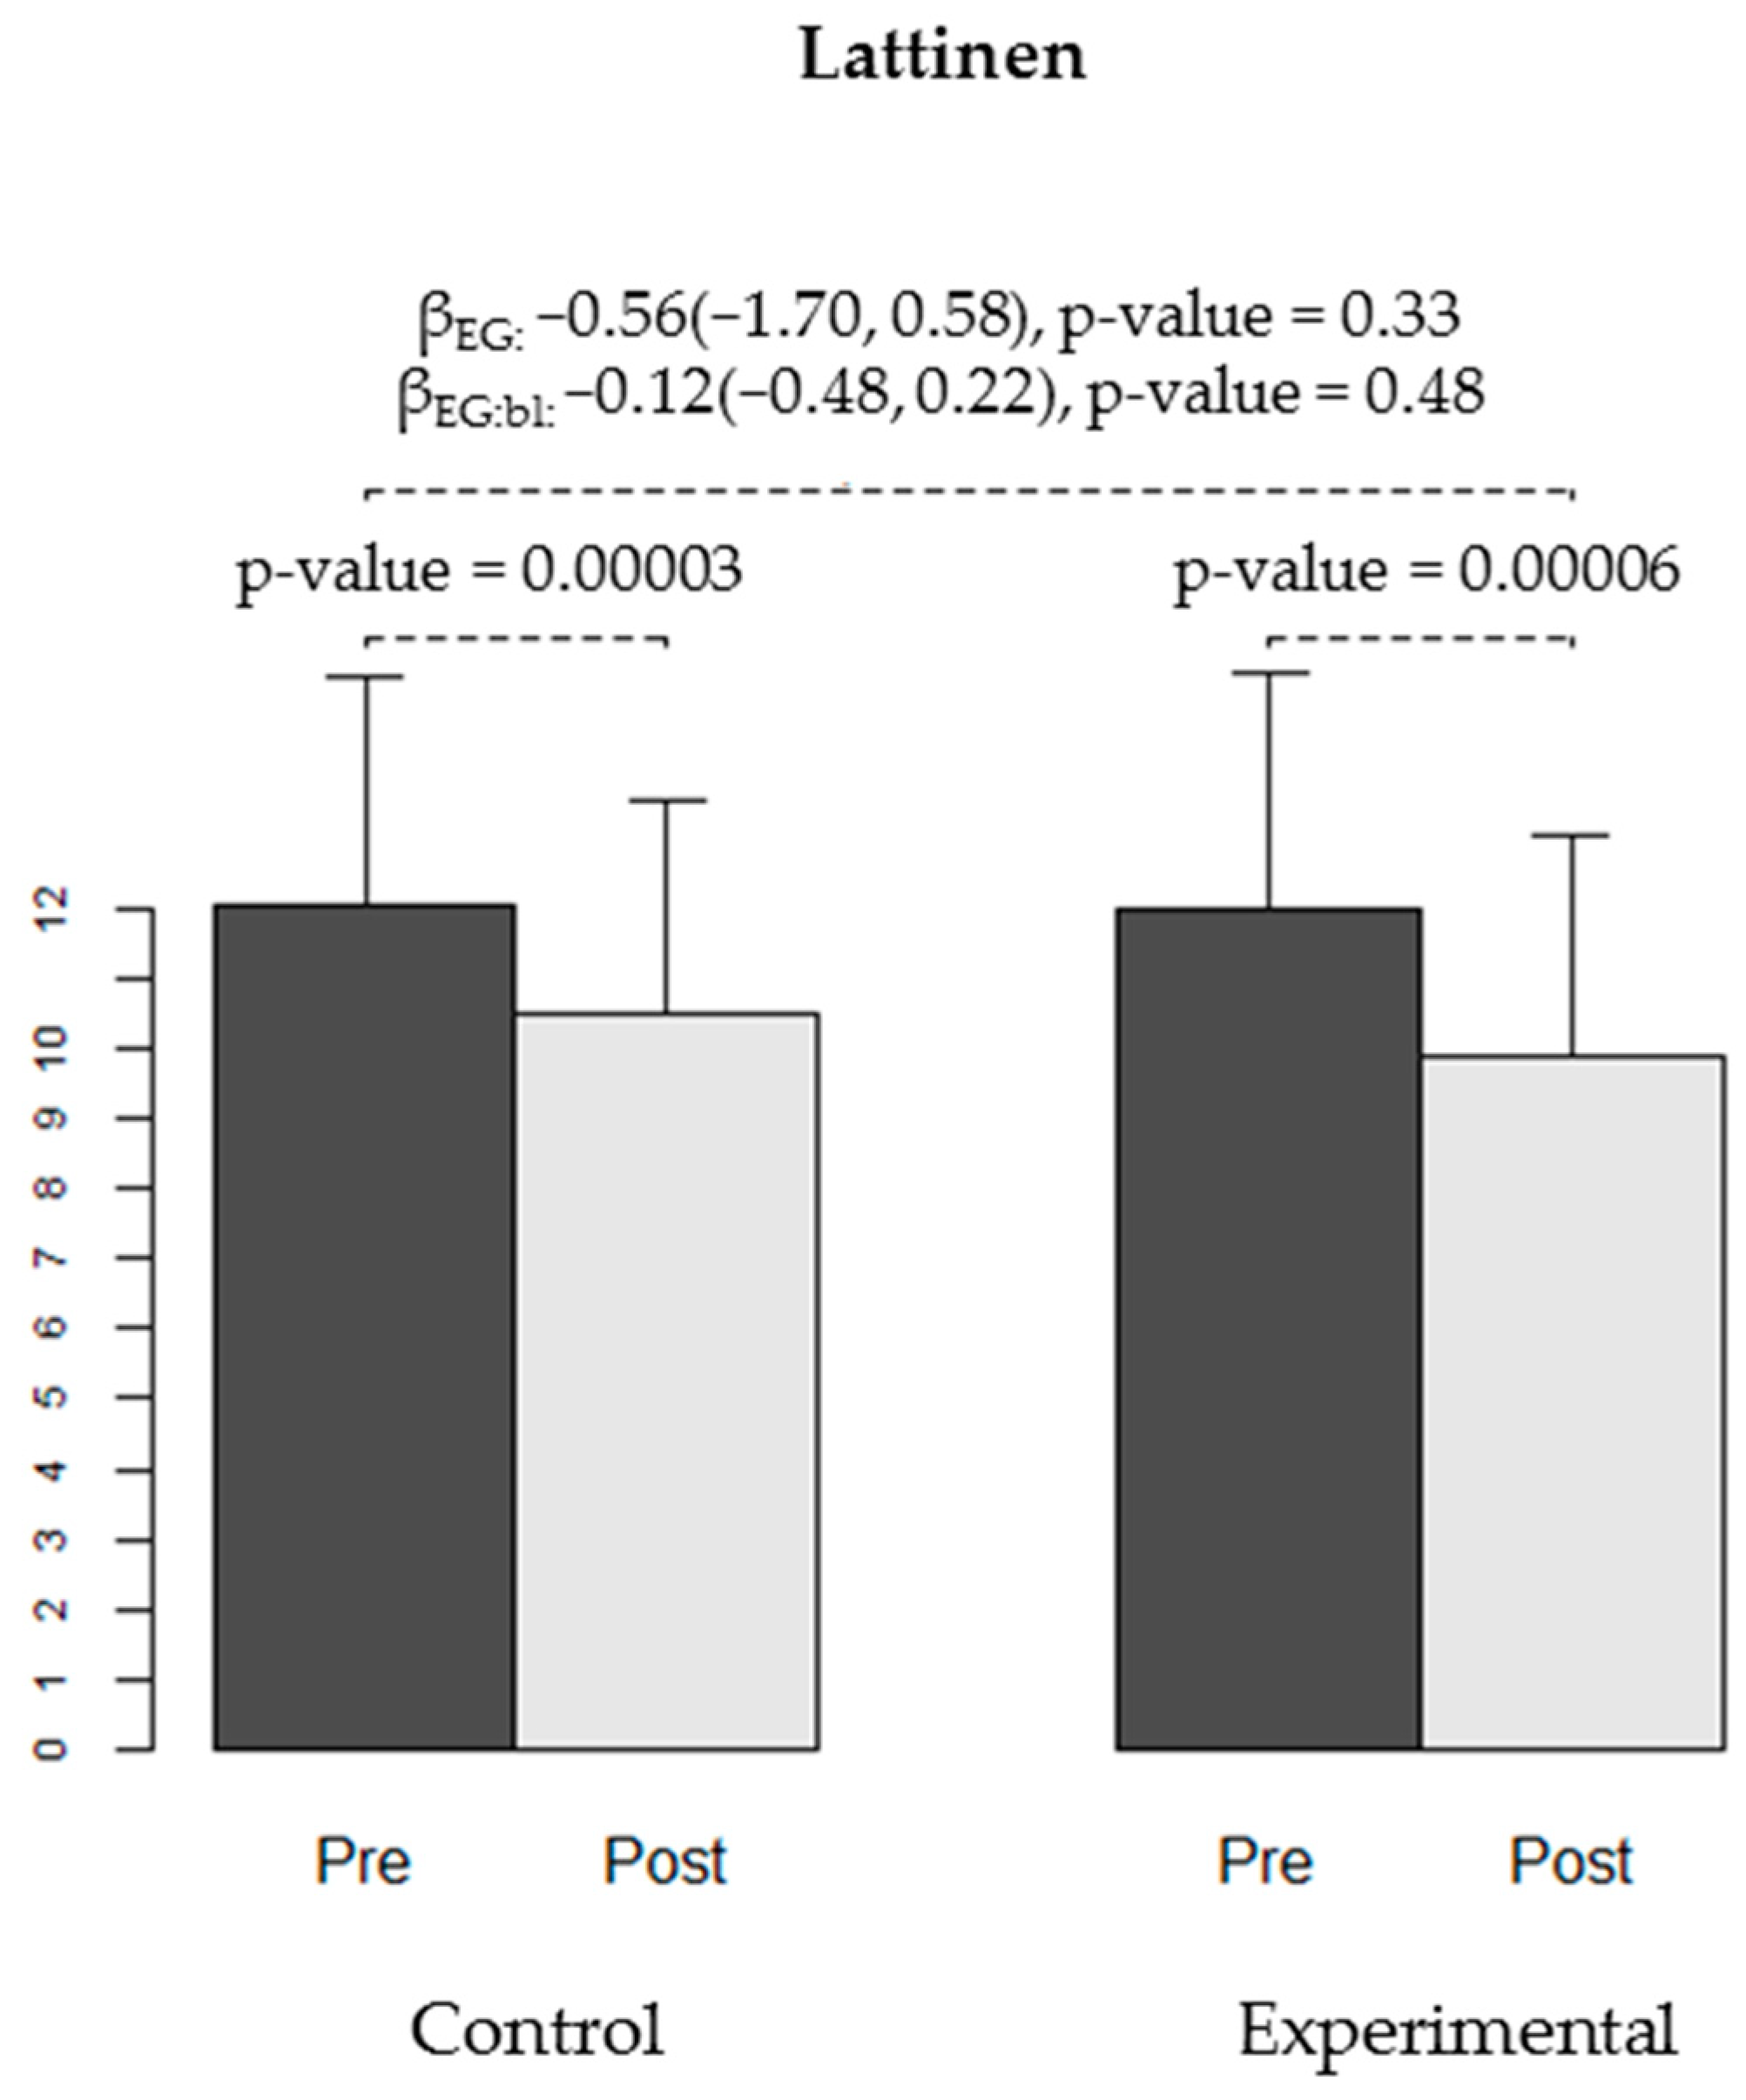
| General | 12.09 (3.28) | 10.5 (3.05) | −1.59 (1.74) | (−2.36, −0.82) | 0.0003 | 0.002 | 12.03 (3.38) | 9.9 (3.17) | −2.13 (2.49) | (−3.06, −1.2) | 0.00006 | 0.00008 |
| Intensity | 2.59 (0.96) | 1.86 (0.89) | −0.73 (0.83) | (−1.09, −0.36) | 0.0005 | 0.002 | 2.43 (0.86) | 1.93 (0.87) | −0.5 (0.9) | (−0.84, −0.16) | 0.005 | 0.007 |
| Frequency | 2.77 (0.92) | 2.41 (1.18) | −0.36 (0.85) | (−0.74, 0.01) | 0.06 | 0.06 | 2.87 (0.9) | 2.1 (0.84) | −0.77 (0.9) | (−1.1, −0.43) | 0.00006 | 0.0004 |
| Analgesics | 1.91 (0.81) | 1.86 (0.71) | −0.05 (0.58) | (−0.3, 0.21) | 0.71 | 0.78 | 2.27 (0.83) | 1.93 (0.83) | −0.33 (0.66) | (−0.58, −0.09) | 0.01 | 0.02 |
| lncapacity | 2 (0.62) | 1.82 (0.5) | −0.18 (0.5) | (−0.4, 0.04) | 0.1 | 0.13 | 1.9 (0.66) | 1.63 (0.61) | −0.27 (0.52) | (−0.46, −0.07) | 0.009 | 0.01 |
| Pain induced insomnia | 2.68 (1.25) | 2.5 (1.41) | −0.18 (0.59) | (−0.44, 0.08) | 0.16 | 0.2 | 2.3 (1.34) | 2.27 (1.44) | −0.03 (1.45) | (−0.57, 0.51) | 0.9 | 0.75 |
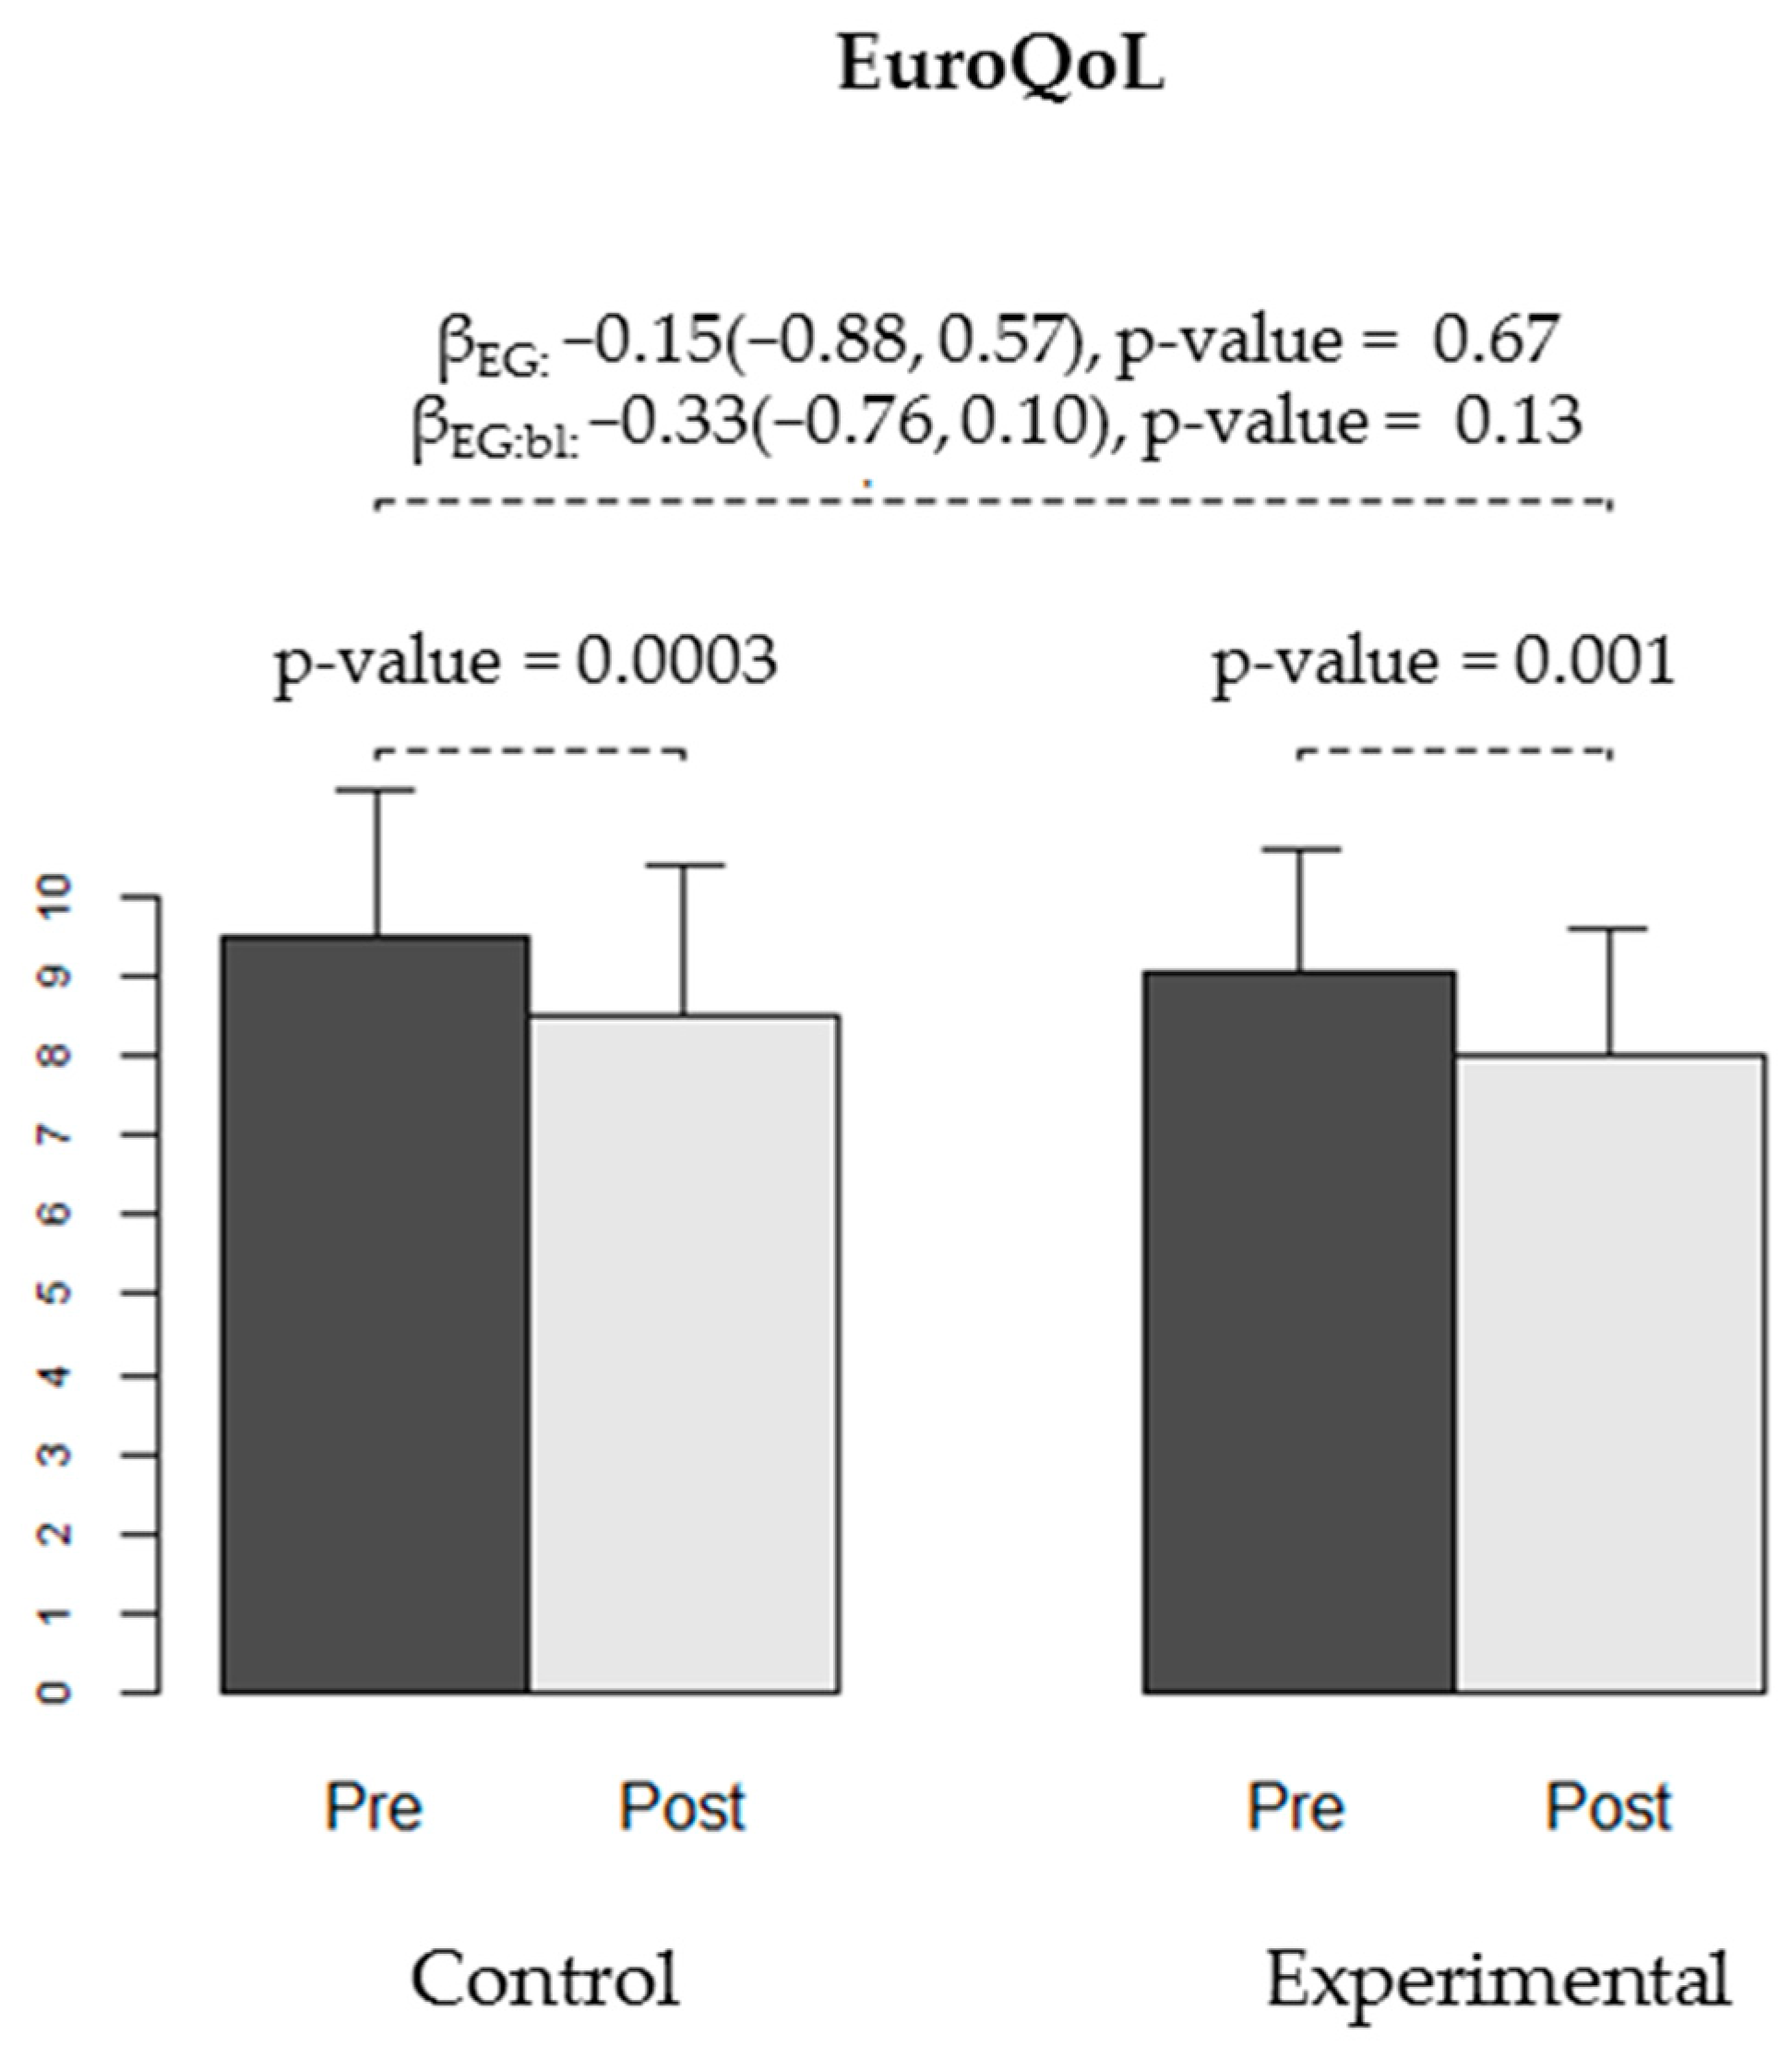
| EuroQoL | 9.5 (1.85) | 8.5 (1.9) | −1 (1.07) | (−1.47, −0.53) | 0.0003 | 0.0008 | 9.07 (1.55) | 8.03 (1.61) | −1.03 (1.56) | (−1.62, −0.45) | 0.001 | 0.002 |
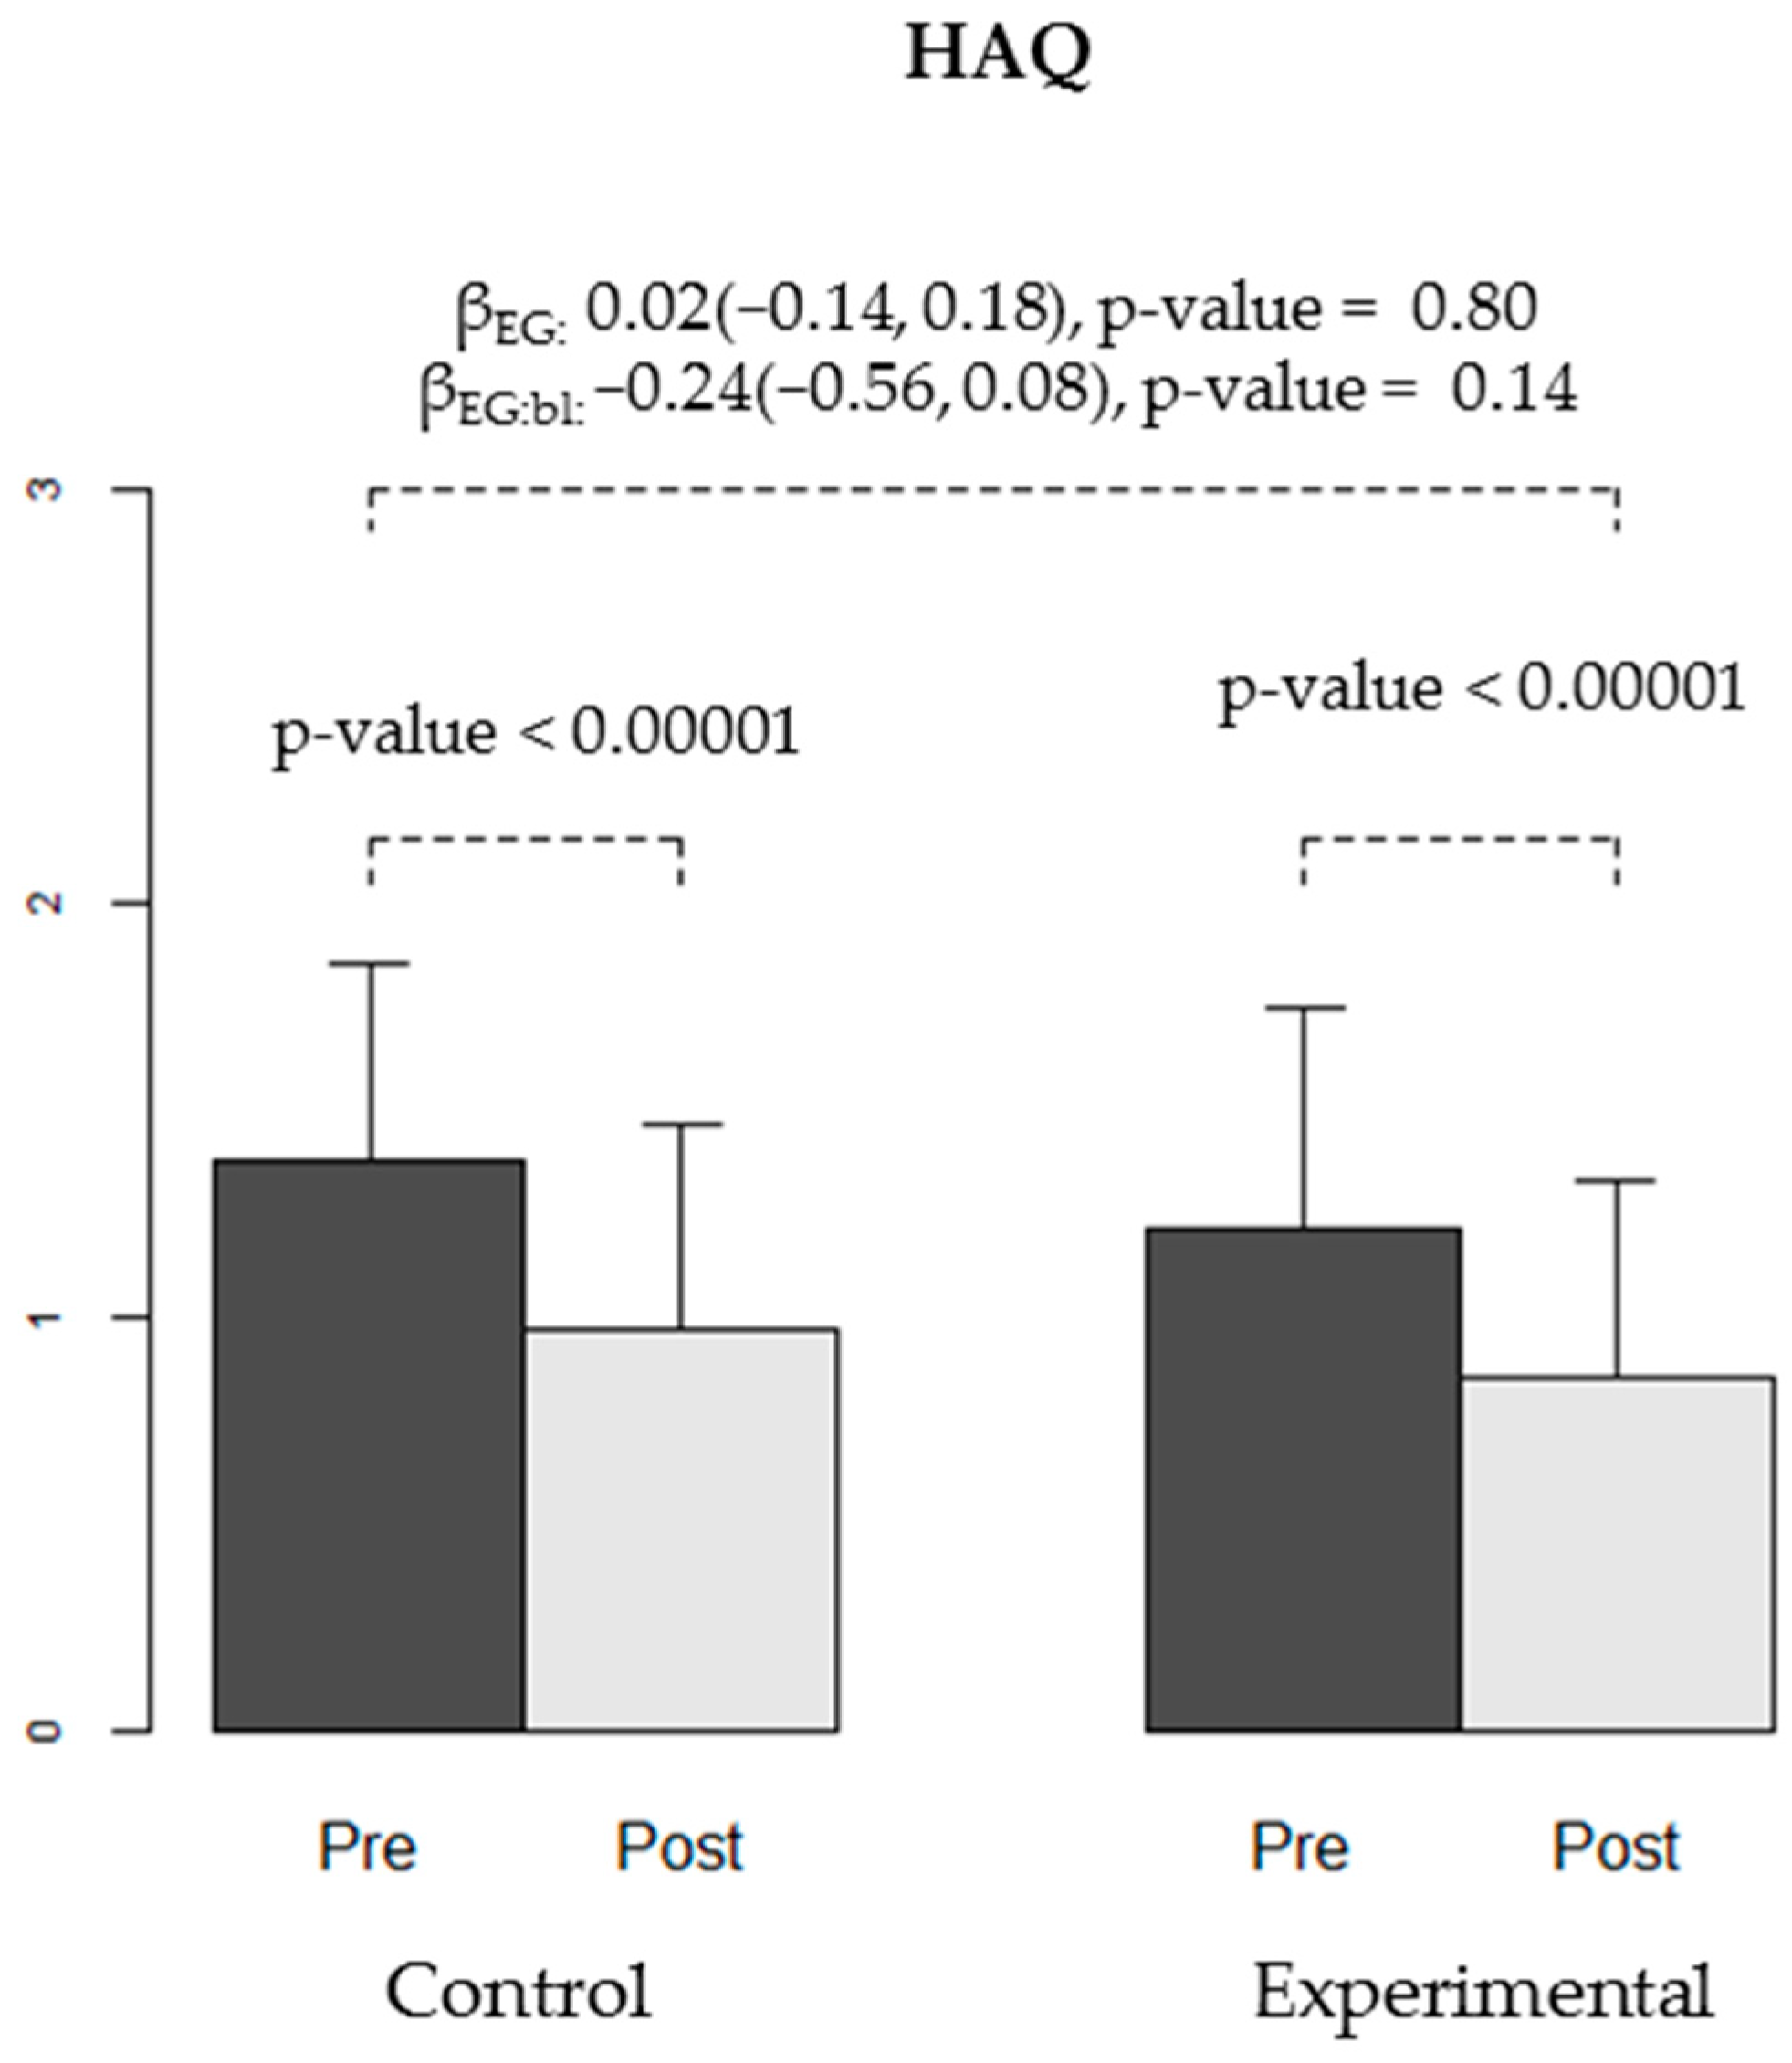
| HAQ | 1.38 (0.47) | 0.97 (0.49) | −0.4 (0.23) | (−0.5, −0.3) | <0.00001 | 0.00007 | 1.21 (0.54) | 0.85 (0.47) | −0.35 (0.34) | (−0.48, −0.23) | <0.00001 | 0.0001 |
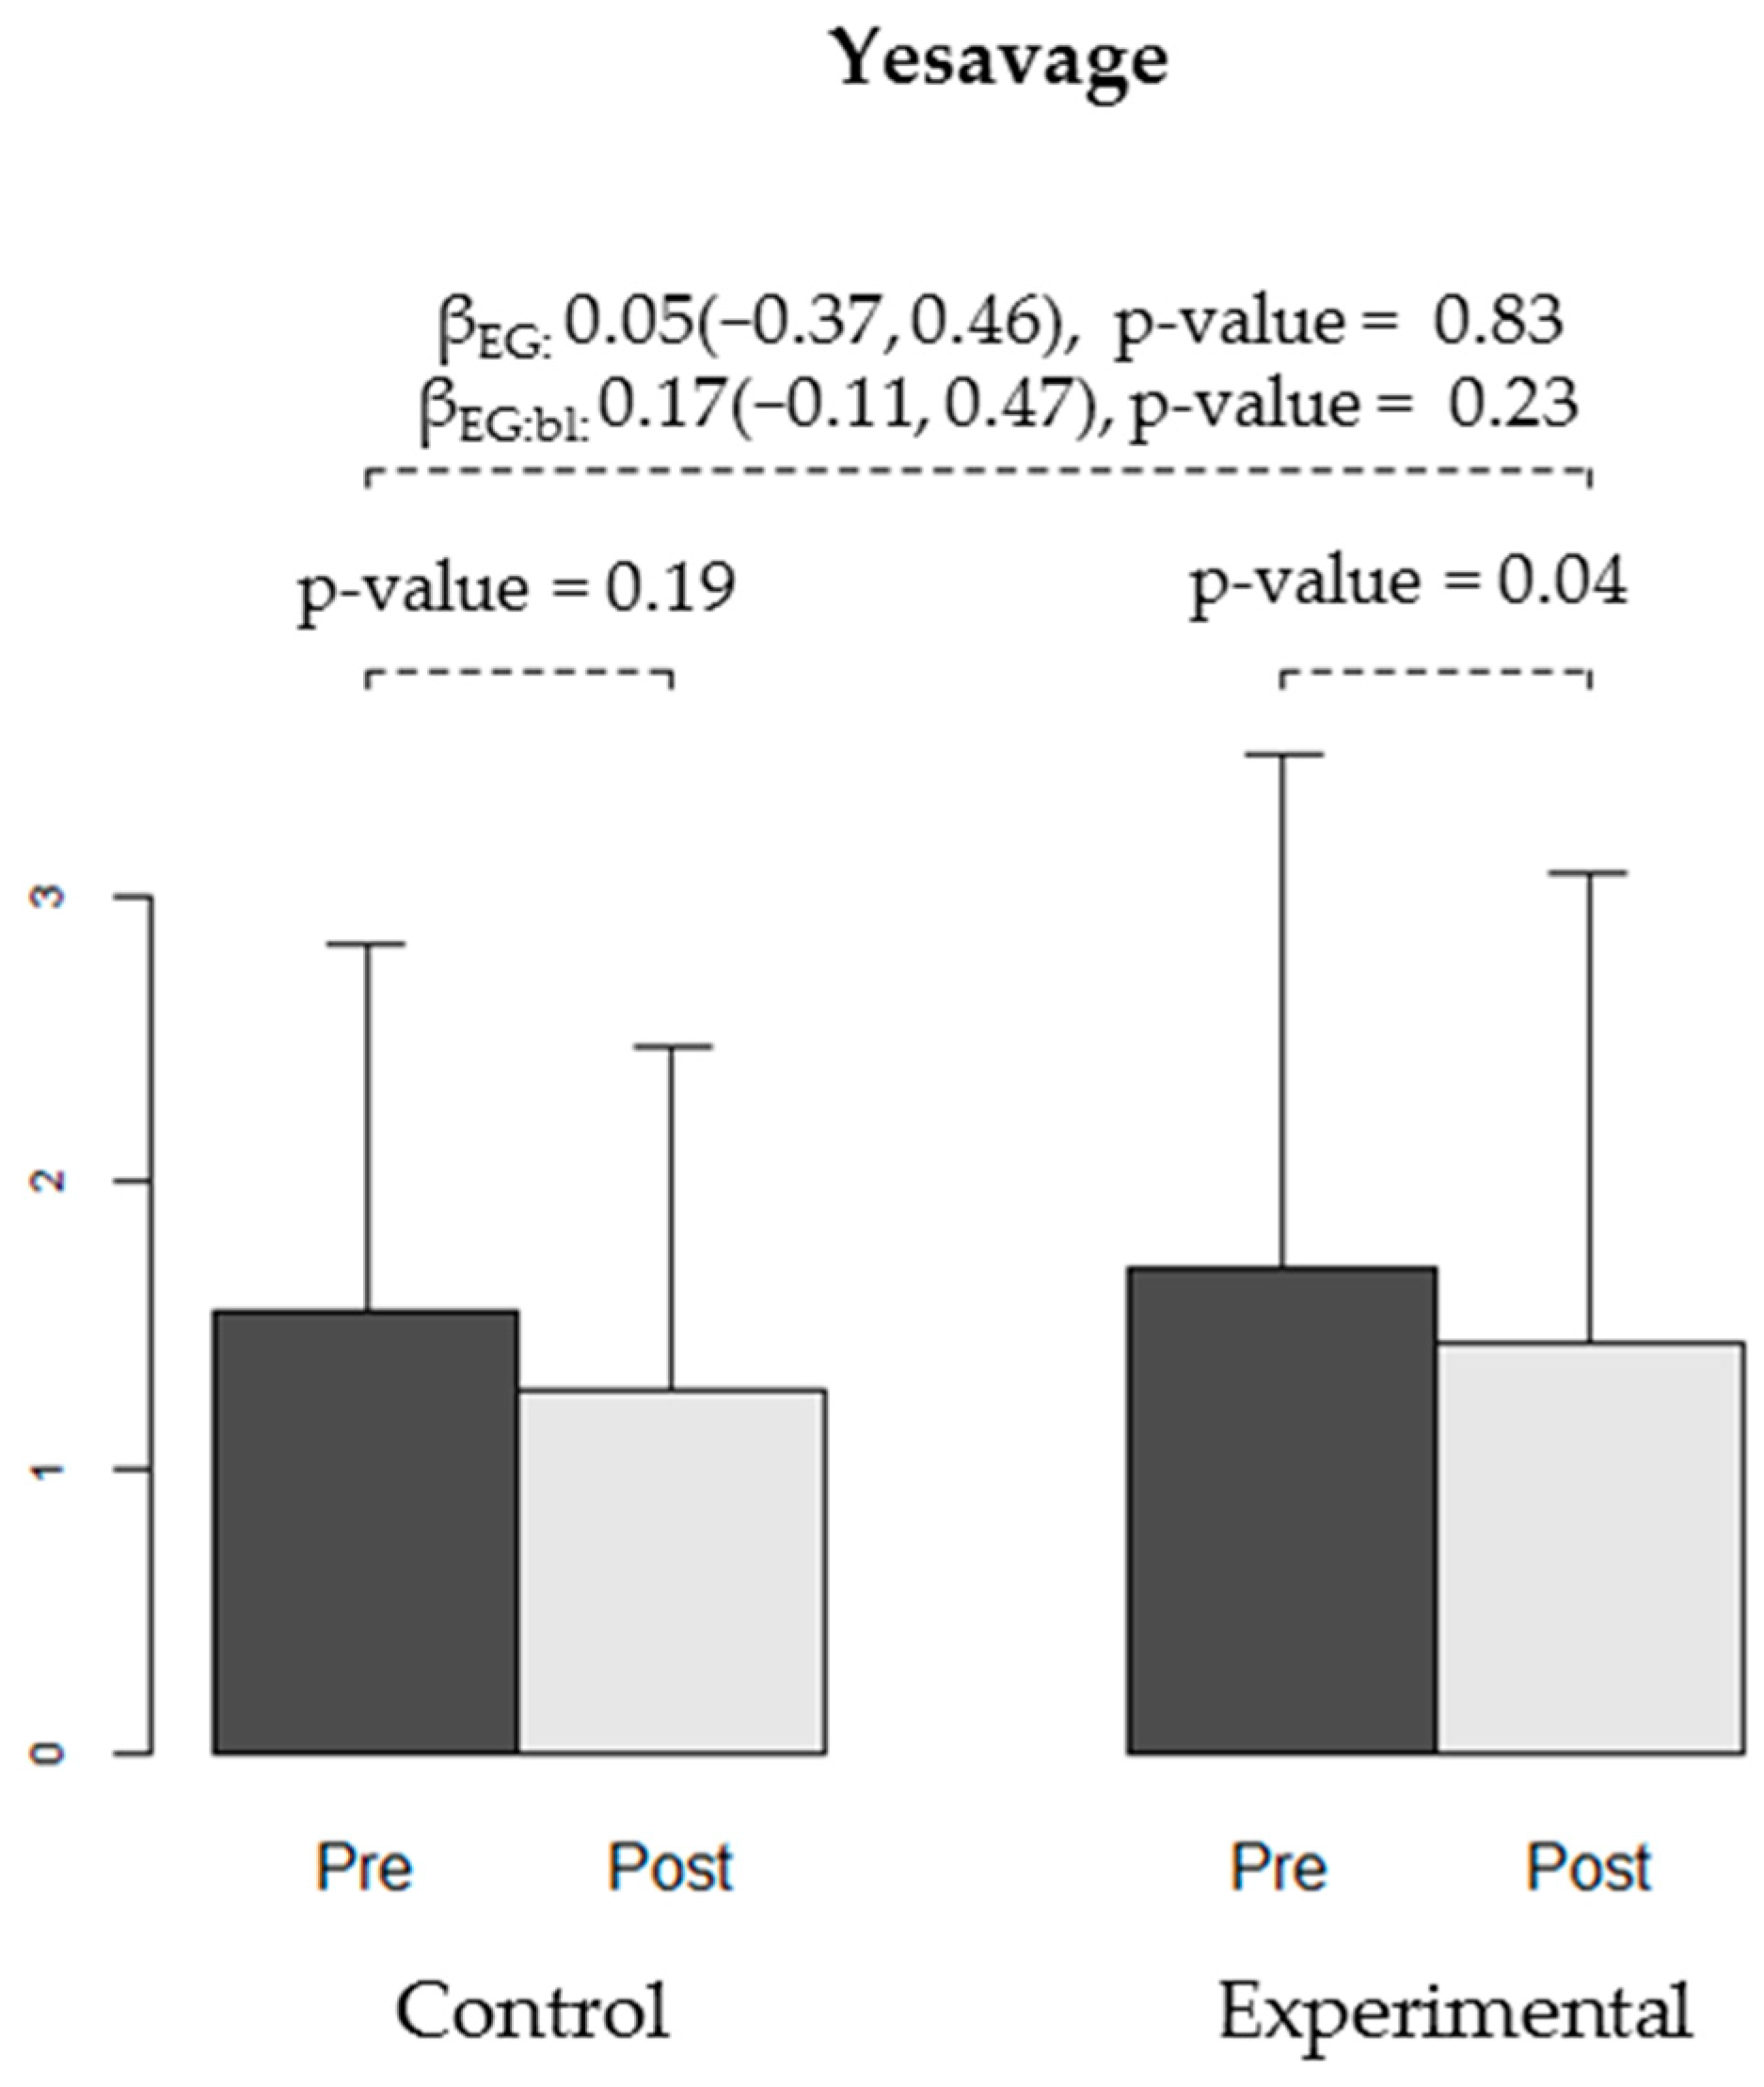
| Yesavage | 1.55 (1.3) | 1.27 (1.2) | −0.27 (0.94) | (−0.69, 0.14) | 0.19 | 0.22 | 1.7 (1.8) | 1.43 (1.65) | −0.27 (0.69) | (−0.52, −0.01) | 0.04 | 0.049 |
| Reduction VAS (Pre—Post) | 0.24 (0.90) | 0.06 (0.74) | −0.17 (1.06) | (−0.79, 0.44) | 0.56 | 0.53 | 1.26 (1.63) | 0.74 (1.20) | −0.52 (1.53) | (−1.15, 0.11) | 0.11 | 0.09 |
| Response Variables | EG Effect on Post Intervention Scores | |||||
|---|---|---|---|---|---|---|
| βEG | 95% CI | p-Value | βEG:bl | 95% CI | p-Value | |
| WOMAC | ||||||
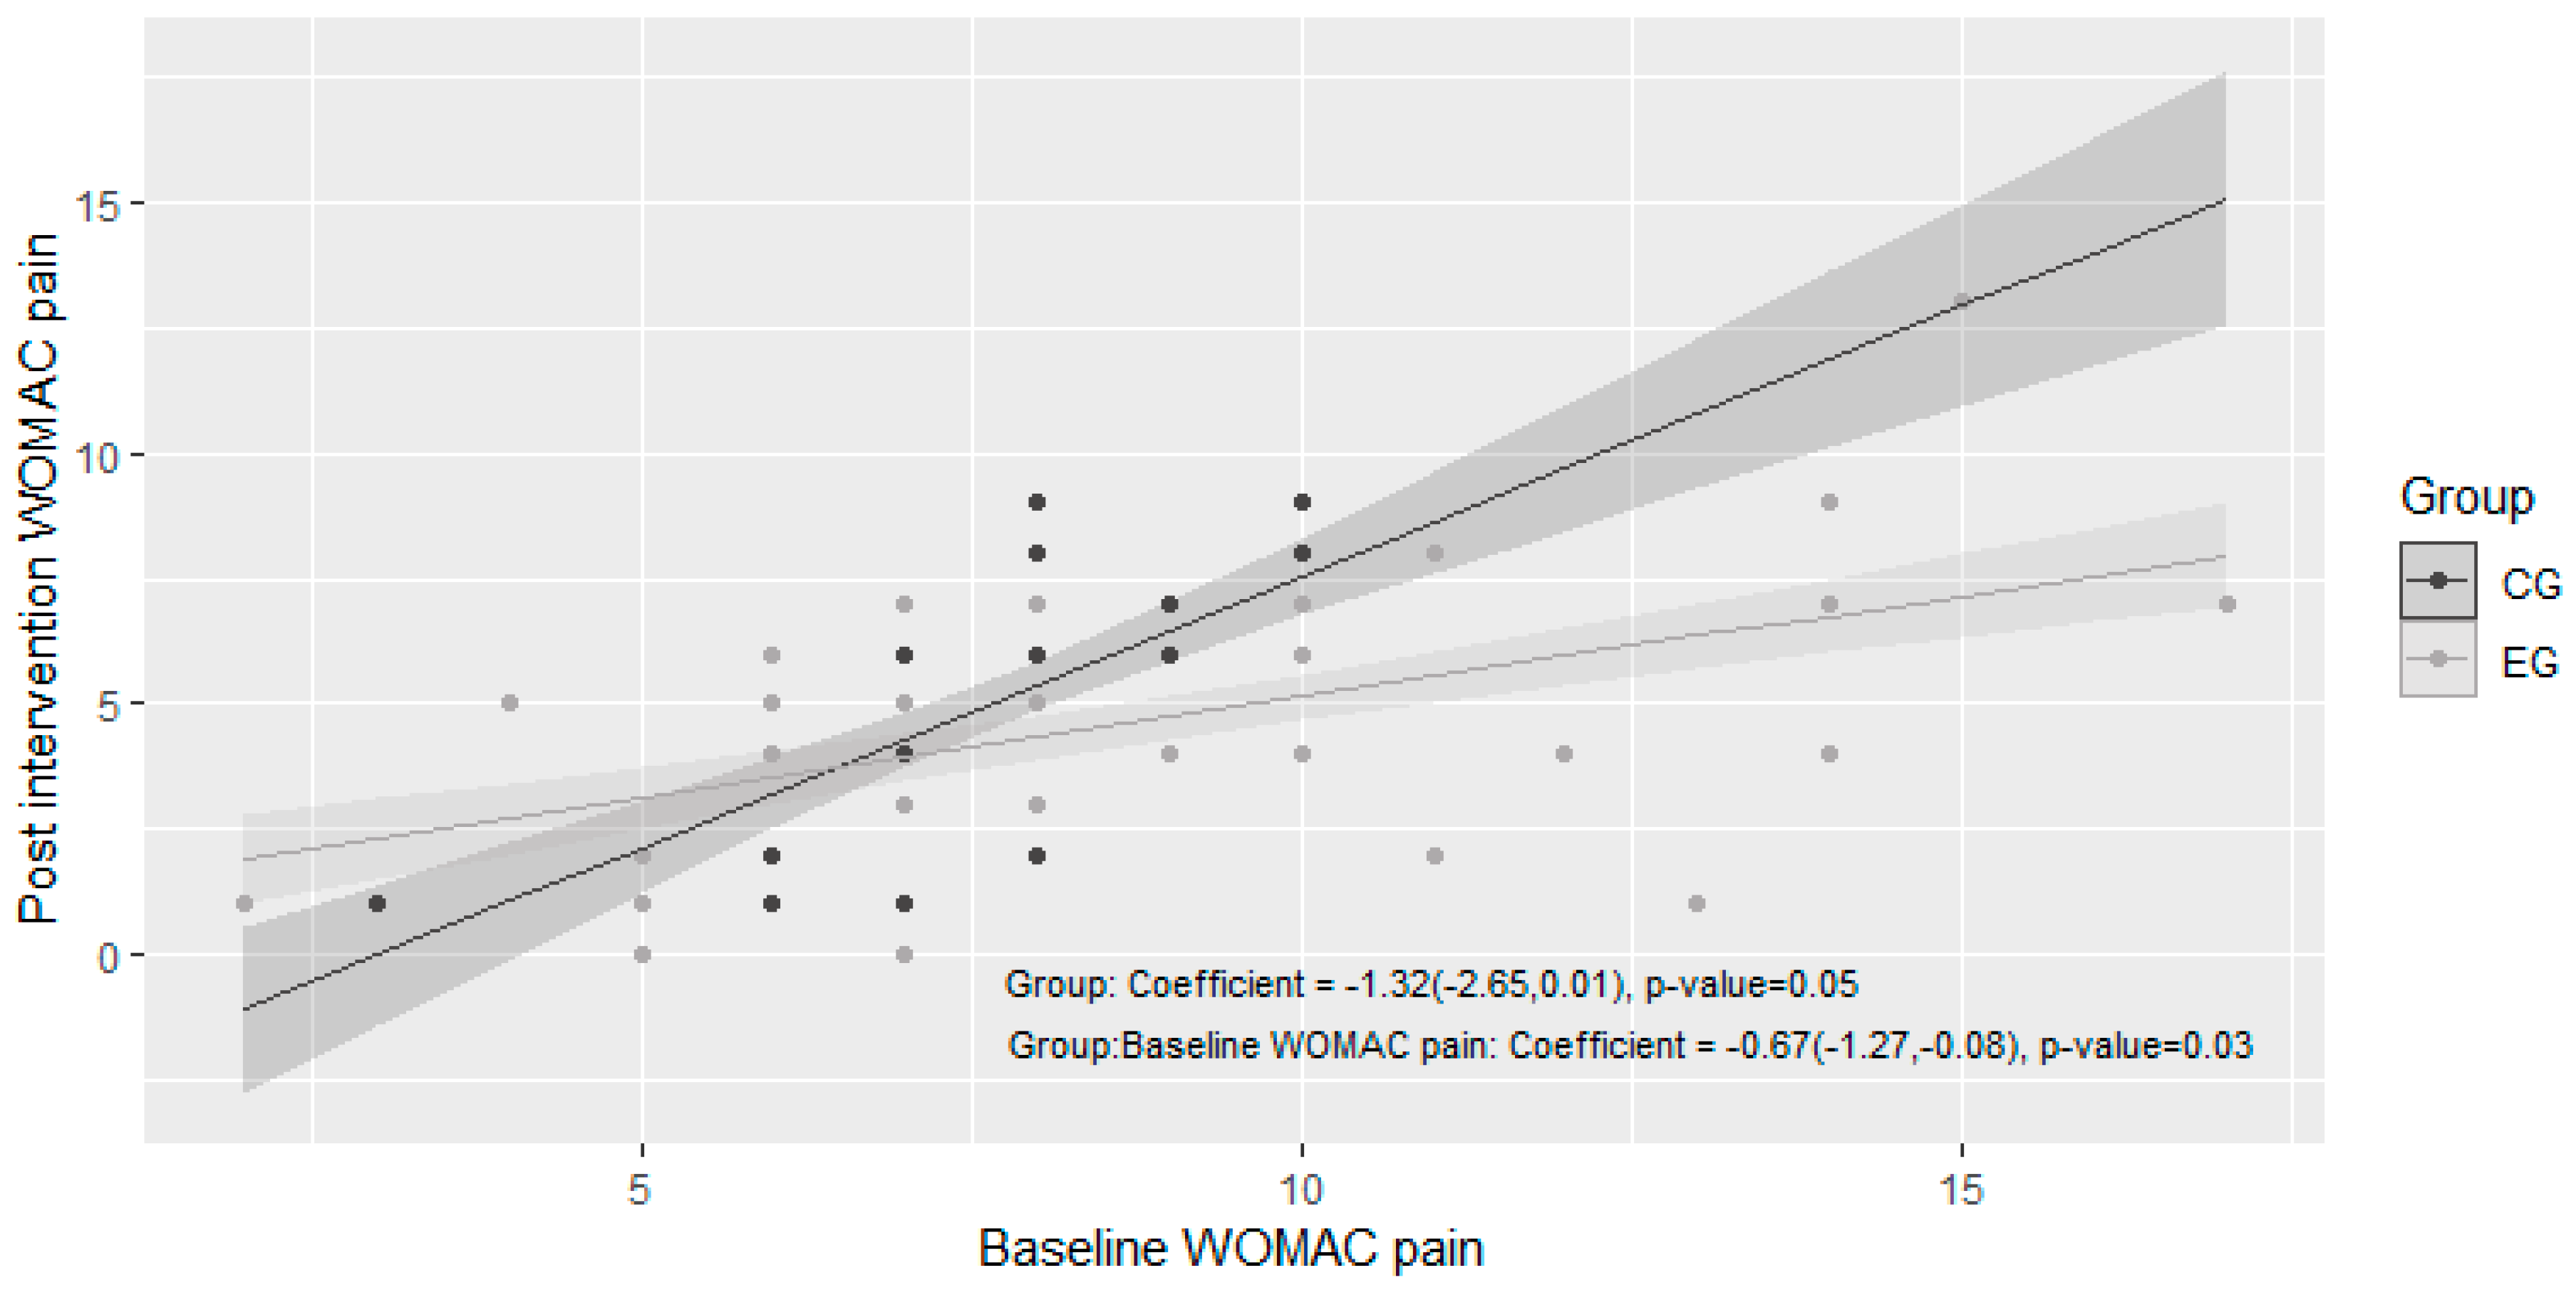
| Pain | −1.32 | (−2.65, 0.01) | 0.05 | −0.67 | (−1.27, −0.08) | 0.03 |
| Stiffness | 0.19 | (−0.47, 0.85) | 0.57 | 0.18 | (−0.35, 0.71) | 0.49 |
| Functional capacity | −3.25 | (−6.60, 0.10) | 0.06 | −0.12 | (−0.55, 0.31) | 0.60 |
| Lattinen | ||||||
| General | −0.56 | (−1.70, 0.58) | 0.33 | −0.12 | (−0.48, 0.22) | 0.48 |
| Intensity | 0.15 | (−0.28, 0.58) | 0.49 | −0.10 | (−0.58, 0.39) | 0.69 |
| Frequency | −0.37 | (−0.83, 0.08) | 0.10 | −0.46 | (−0.96, 0.05) | 0.08 |
| Analgesics | −0.16 | (−0.50, 0.17) | 0.32 | 0.04 | (−0.35, 0,45) | 0.8 |
| lncapacity | −0.12 | (−0.38, 0.11) | 0.30 | 0.12 | (−0.28, 0.52) | 0.54 |
| Pain induced insomnia | 0.07 | (−0.54, 0.68) | 0.82 | −0.53 | (−1.01, −0.05) | 0.02 |
| EuroQoL | −0.15 | (−0.88, 0.57) | 0.67 | −0.33 | (−0.76, 0.10) | 0.13 |
| HAQ | 0.02 | (−0.14, 0.18) | 0.80 | −0.24 | (−0.56, 0.08) | 0.14 |
| Yesavage | 0.05 | (−0.37, 0.46) | 0.83 | 0.17 | (−0.11, 0.47) | 0.23 |
| Session | Reduction in VAS (Pre—Post Session) | Difference in the Reduction (Experimental vs. Control) | ||||
|---|---|---|---|---|---|---|
| Control Group n = 22 (42.31%) | Experimental Group n = 30 (57.69%) | Difference | 95% CI | p-Value | ||
| A | B | |||||
| Session 1 | 0.43 (01.03) | 1.26 (1.63) | 0.83 | (−0.015, 1.66) | 0.054 | 0.21 |
| Session 2 | 0.68 (1.61) | 1.55 (1.95) | 0.87 | (−0.15, 1.89) | 0.09 | 0.044 |
| Session 3 | 0.89 (1.50) | 0.70 (1.36) | −0.19 | (−1.05, 0.68) | 0.66 | 0.81 |
| Session 4 | 1.24 (2.54) | 0.71 (1.95) | −0.53 | (−2.11, 1.04) | 0.49 | 0.48 |
| Session 5 | −0.018 (2.56) | 0.69 (1.56) | 0.71 | (−0.72,2.15) | 0.31 | 0.69 |
| Session 6 | 0.41 (1.48) | 0.87 (1.81) | 0.45 | (−0.56, 1.48) | 0.37 | 0.39 |
| Session 7 | 1.00 (2.14) | 0.35 (1.03) | −0.65 | (−2.00, 0.70) | 0.33 | 0.36 |
| Session 8 | 1.06 (1.06) | 0.31 (1.25) | −0.75 | (−1.54, 0.042) | 0.063 | 0.12 |
| Session 9 | 0.40 (1.05) | 0.80 (1.64) | 0.40 | (−0.45, 1.25) | 0.34 | 0.44 |
| Session10 | 0.90 (1.11) | 0.92 (1.16) | 0.02 | (−0.91, 0.96) | 0.96 | 0.98 |
| Session11 | 0.37 (0.84) | 1.16 (1.43) | 0.79 | (0.06, 1.53) | 0.04 | 0.02 |
| Session12 | −0.2 (1.55) | 0.8 (1.17) | 1.00 | (0.15, 1.85) | 0.02 | 0.02 |
| Satisfaction Variables | Groups | |||
|---|---|---|---|---|
| All Patients n = 52 (100%) | Control n = 22 (42.31%) | Experimental n = 30 (57.69%) | p-Value | |
| Did you like how the activity has developed? | 2.90 (0.36) | 2.90 (0.44) | 2.90 (0.31) | 0.55 |
| Do you consider that the exercises performed can be useful? | 2.75 (0.48) | 2.81 (0.51) | 2.70 (0.47) | 0.25 |
| Would you recommend this experience to a family member or friend? | 2.84 (0.37) | 2.76 (0.44) | 2.90 (0.31) | 0.19 |
| Do you consider the session schedule adequate? | 2.39 (0.63) | 2.38 (0.59) | 2.40 (0.67) | 0.81 |
| And its duration? | 2.45 (0.76) | 2.33 (0.80) | 2.53 (0.73) | 0.33 |
© 2019 by the authors. Licensee MDPI, Basel, Switzerland. This article is an open access article distributed under the terms and conditions of the Creative Commons Attribution (CC BY) license (http://creativecommons.org/licenses/by/4.0/).
Share and Cite
Rodrigo-Claverol, M.; Casanova-Gonzalvo, C.; Malla-Clua, B.; Rodrigo-Claverol, E.; Jové-Naval, J.; Ortega-Bravo, M. Animal-Assisted Intervention Improves Pain Perception in Polymedicated Geriatric Patients with Chronic Joint Pain: A Clinical Trial. Int. J. Environ. Res. Public Health 2019, 16, 2843. https://doi.org/10.3390/ijerph16162843
Rodrigo-Claverol M, Casanova-Gonzalvo C, Malla-Clua B, Rodrigo-Claverol E, Jové-Naval J, Ortega-Bravo M. Animal-Assisted Intervention Improves Pain Perception in Polymedicated Geriatric Patients with Chronic Joint Pain: A Clinical Trial. International Journal of Environmental Research and Public Health. 2019; 16(16):2843. https://doi.org/10.3390/ijerph16162843
Chicago/Turabian StyleRodrigo-Claverol, Maylos, Carles Casanova-Gonzalvo, Belén Malla-Clua, Esther Rodrigo-Claverol, Júlia Jové-Naval, and Marta Ortega-Bravo. 2019. "Animal-Assisted Intervention Improves Pain Perception in Polymedicated Geriatric Patients with Chronic Joint Pain: A Clinical Trial" International Journal of Environmental Research and Public Health 16, no. 16: 2843. https://doi.org/10.3390/ijerph16162843
APA StyleRodrigo-Claverol, M., Casanova-Gonzalvo, C., Malla-Clua, B., Rodrigo-Claverol, E., Jové-Naval, J., & Ortega-Bravo, M. (2019). Animal-Assisted Intervention Improves Pain Perception in Polymedicated Geriatric Patients with Chronic Joint Pain: A Clinical Trial. International Journal of Environmental Research and Public Health, 16(16), 2843. https://doi.org/10.3390/ijerph16162843