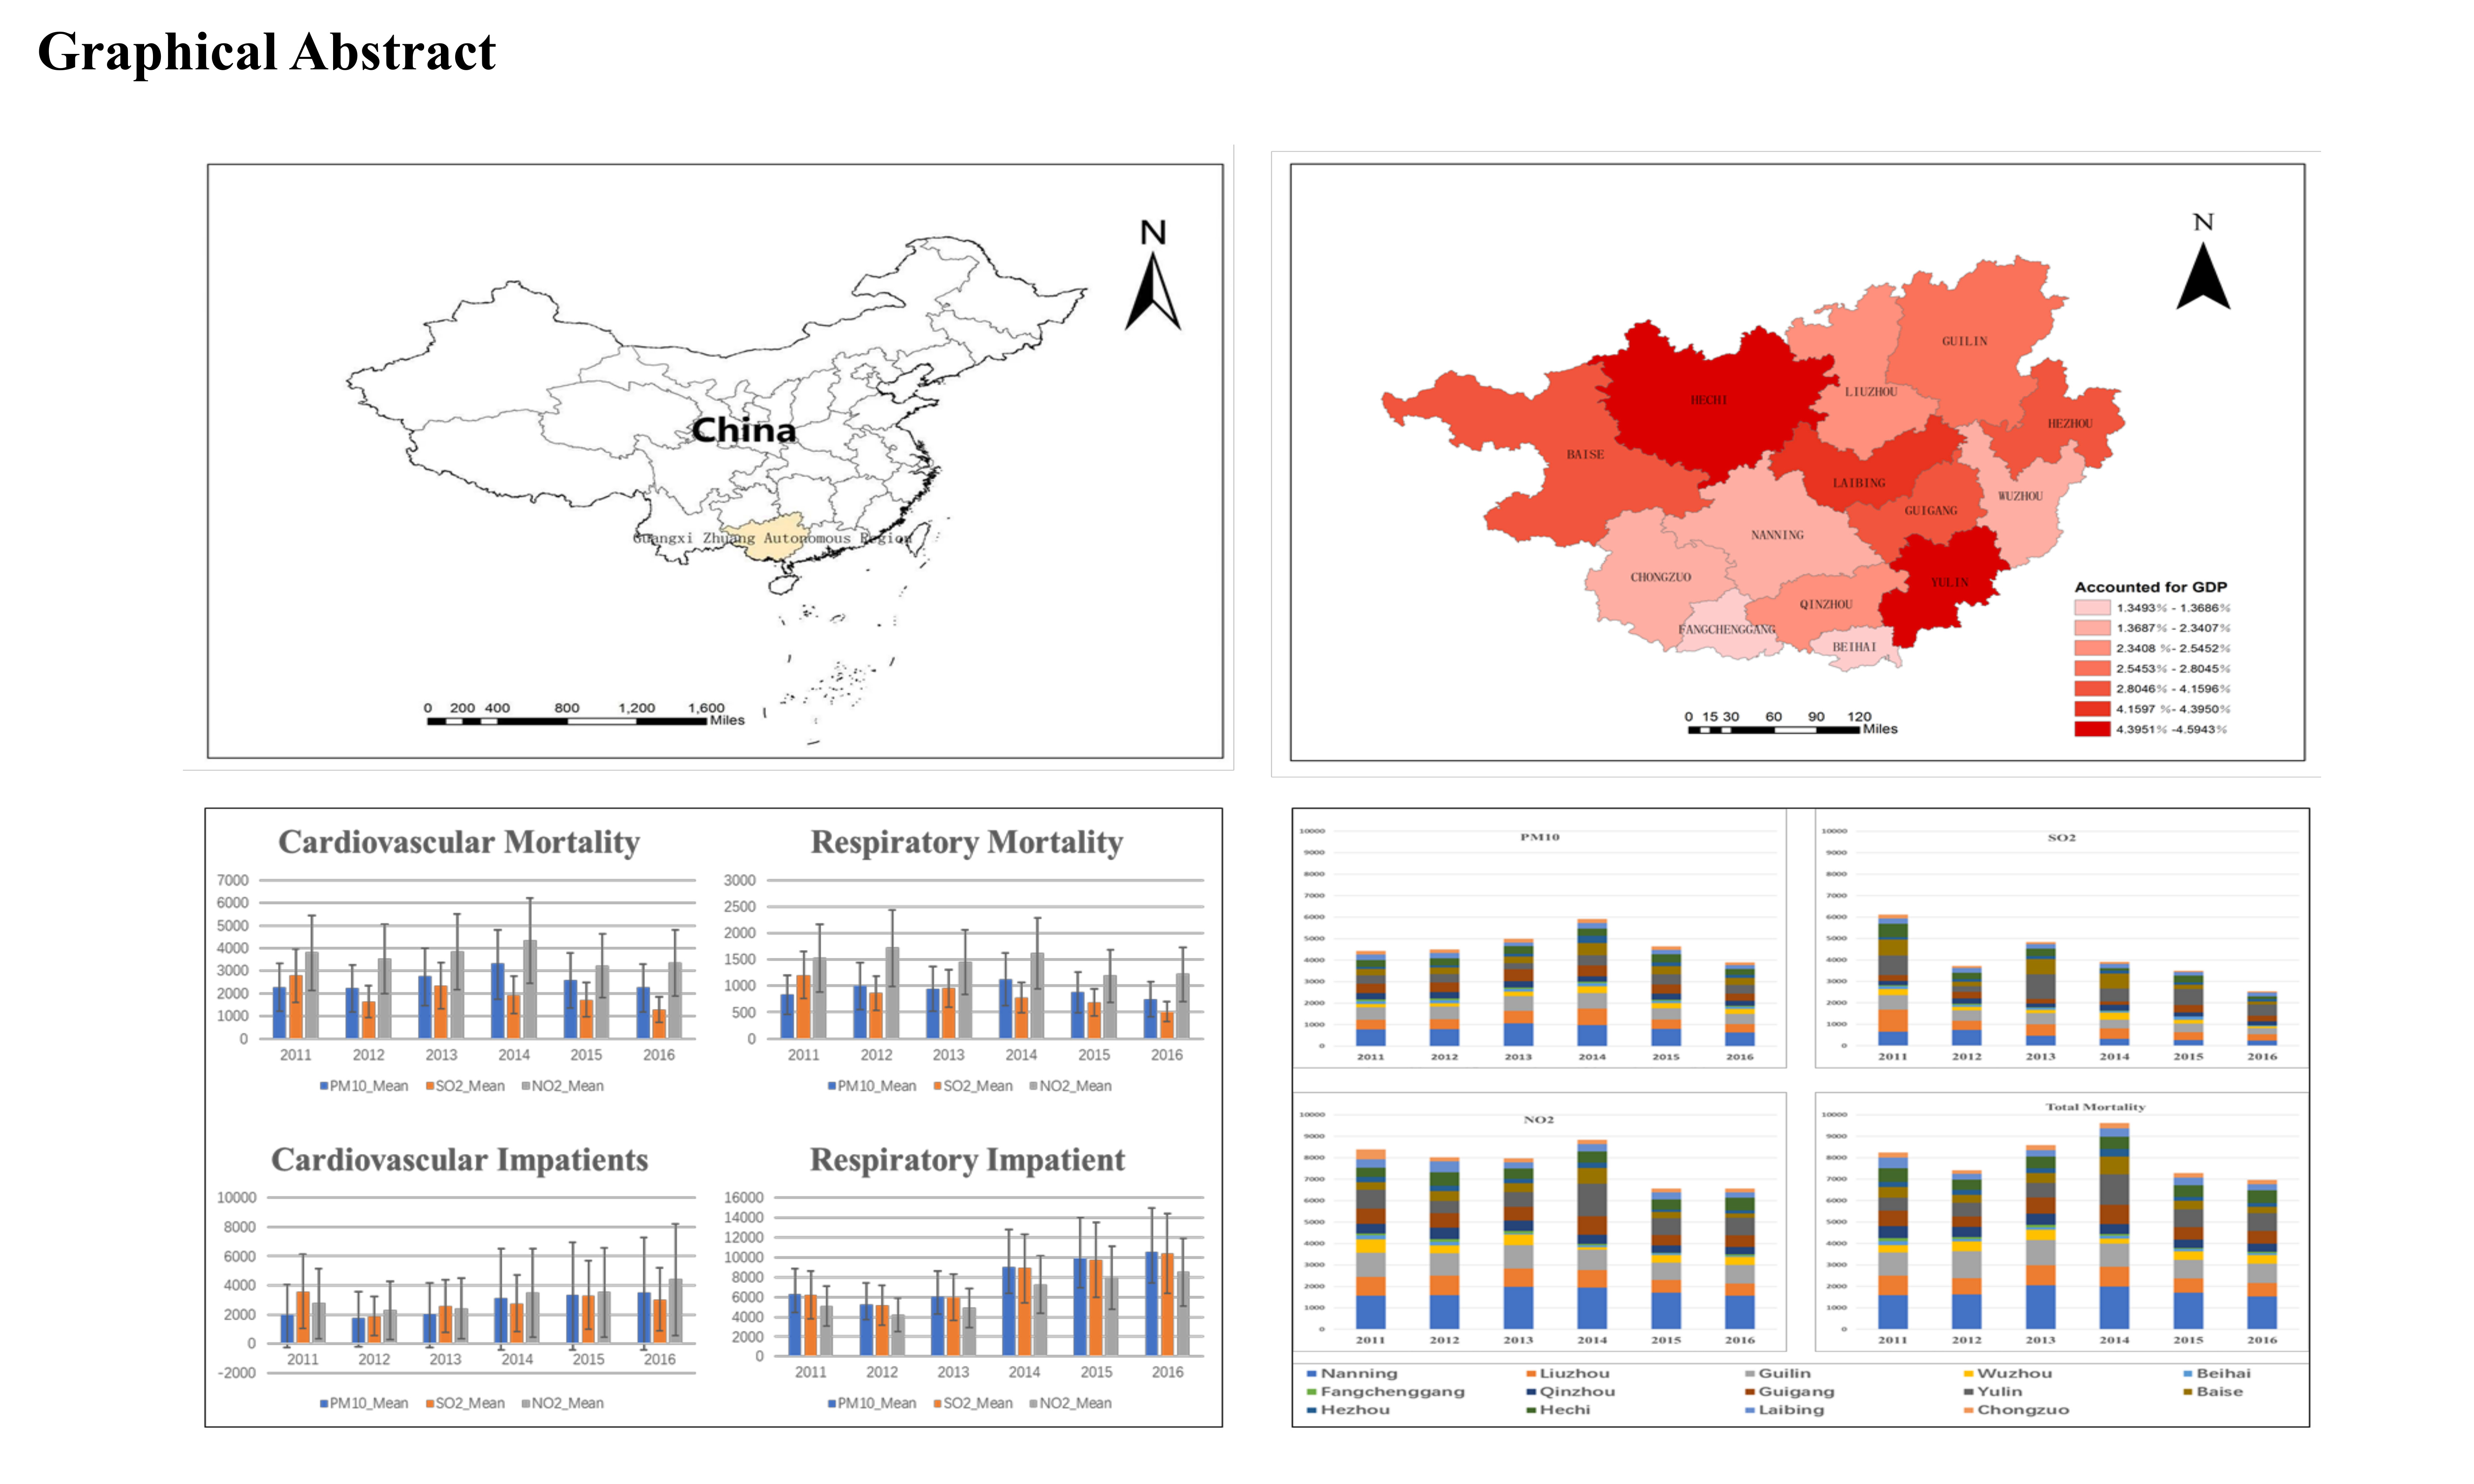
Estimation of Health Effects and Economic Losses from Ambient Air Pollution in Undeveloped Areas: Evidence from Guangxi, China

Abstract

1. Introduction
2. Materials and Methods
2.1. Estimating the Health Effect
2.2. Monetarizing the Health Damage
3. Results
3.1. Air Pollution
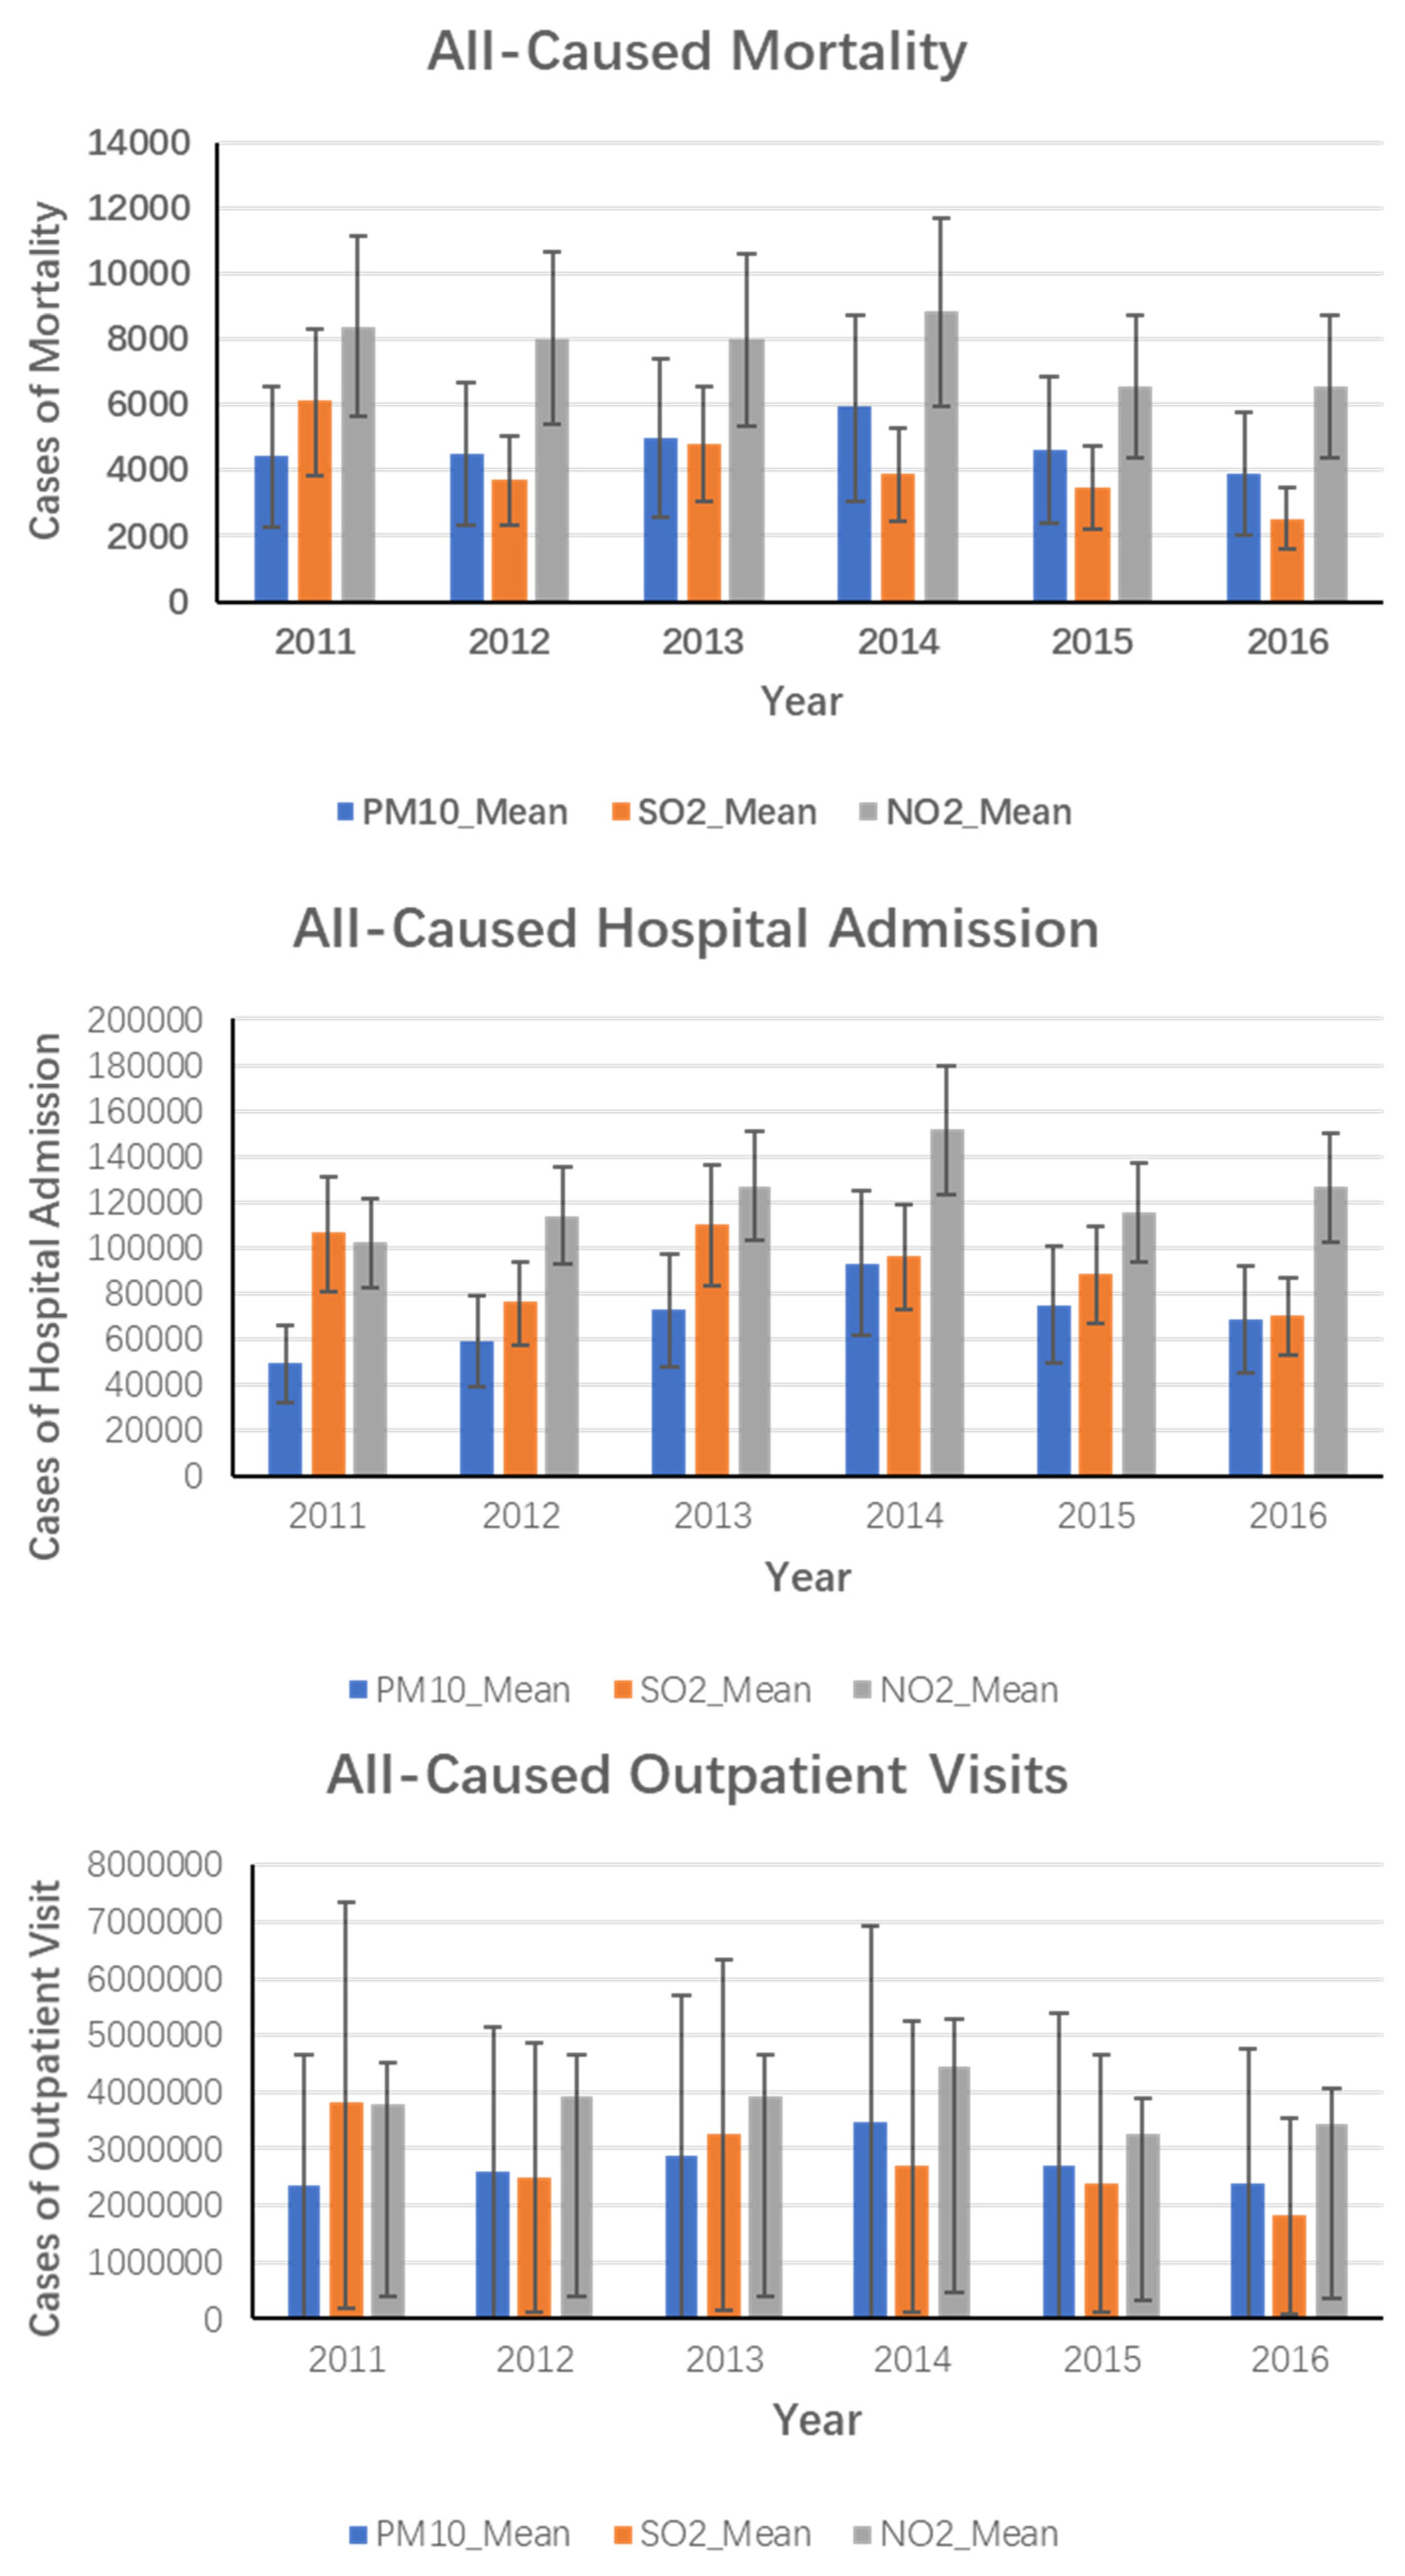
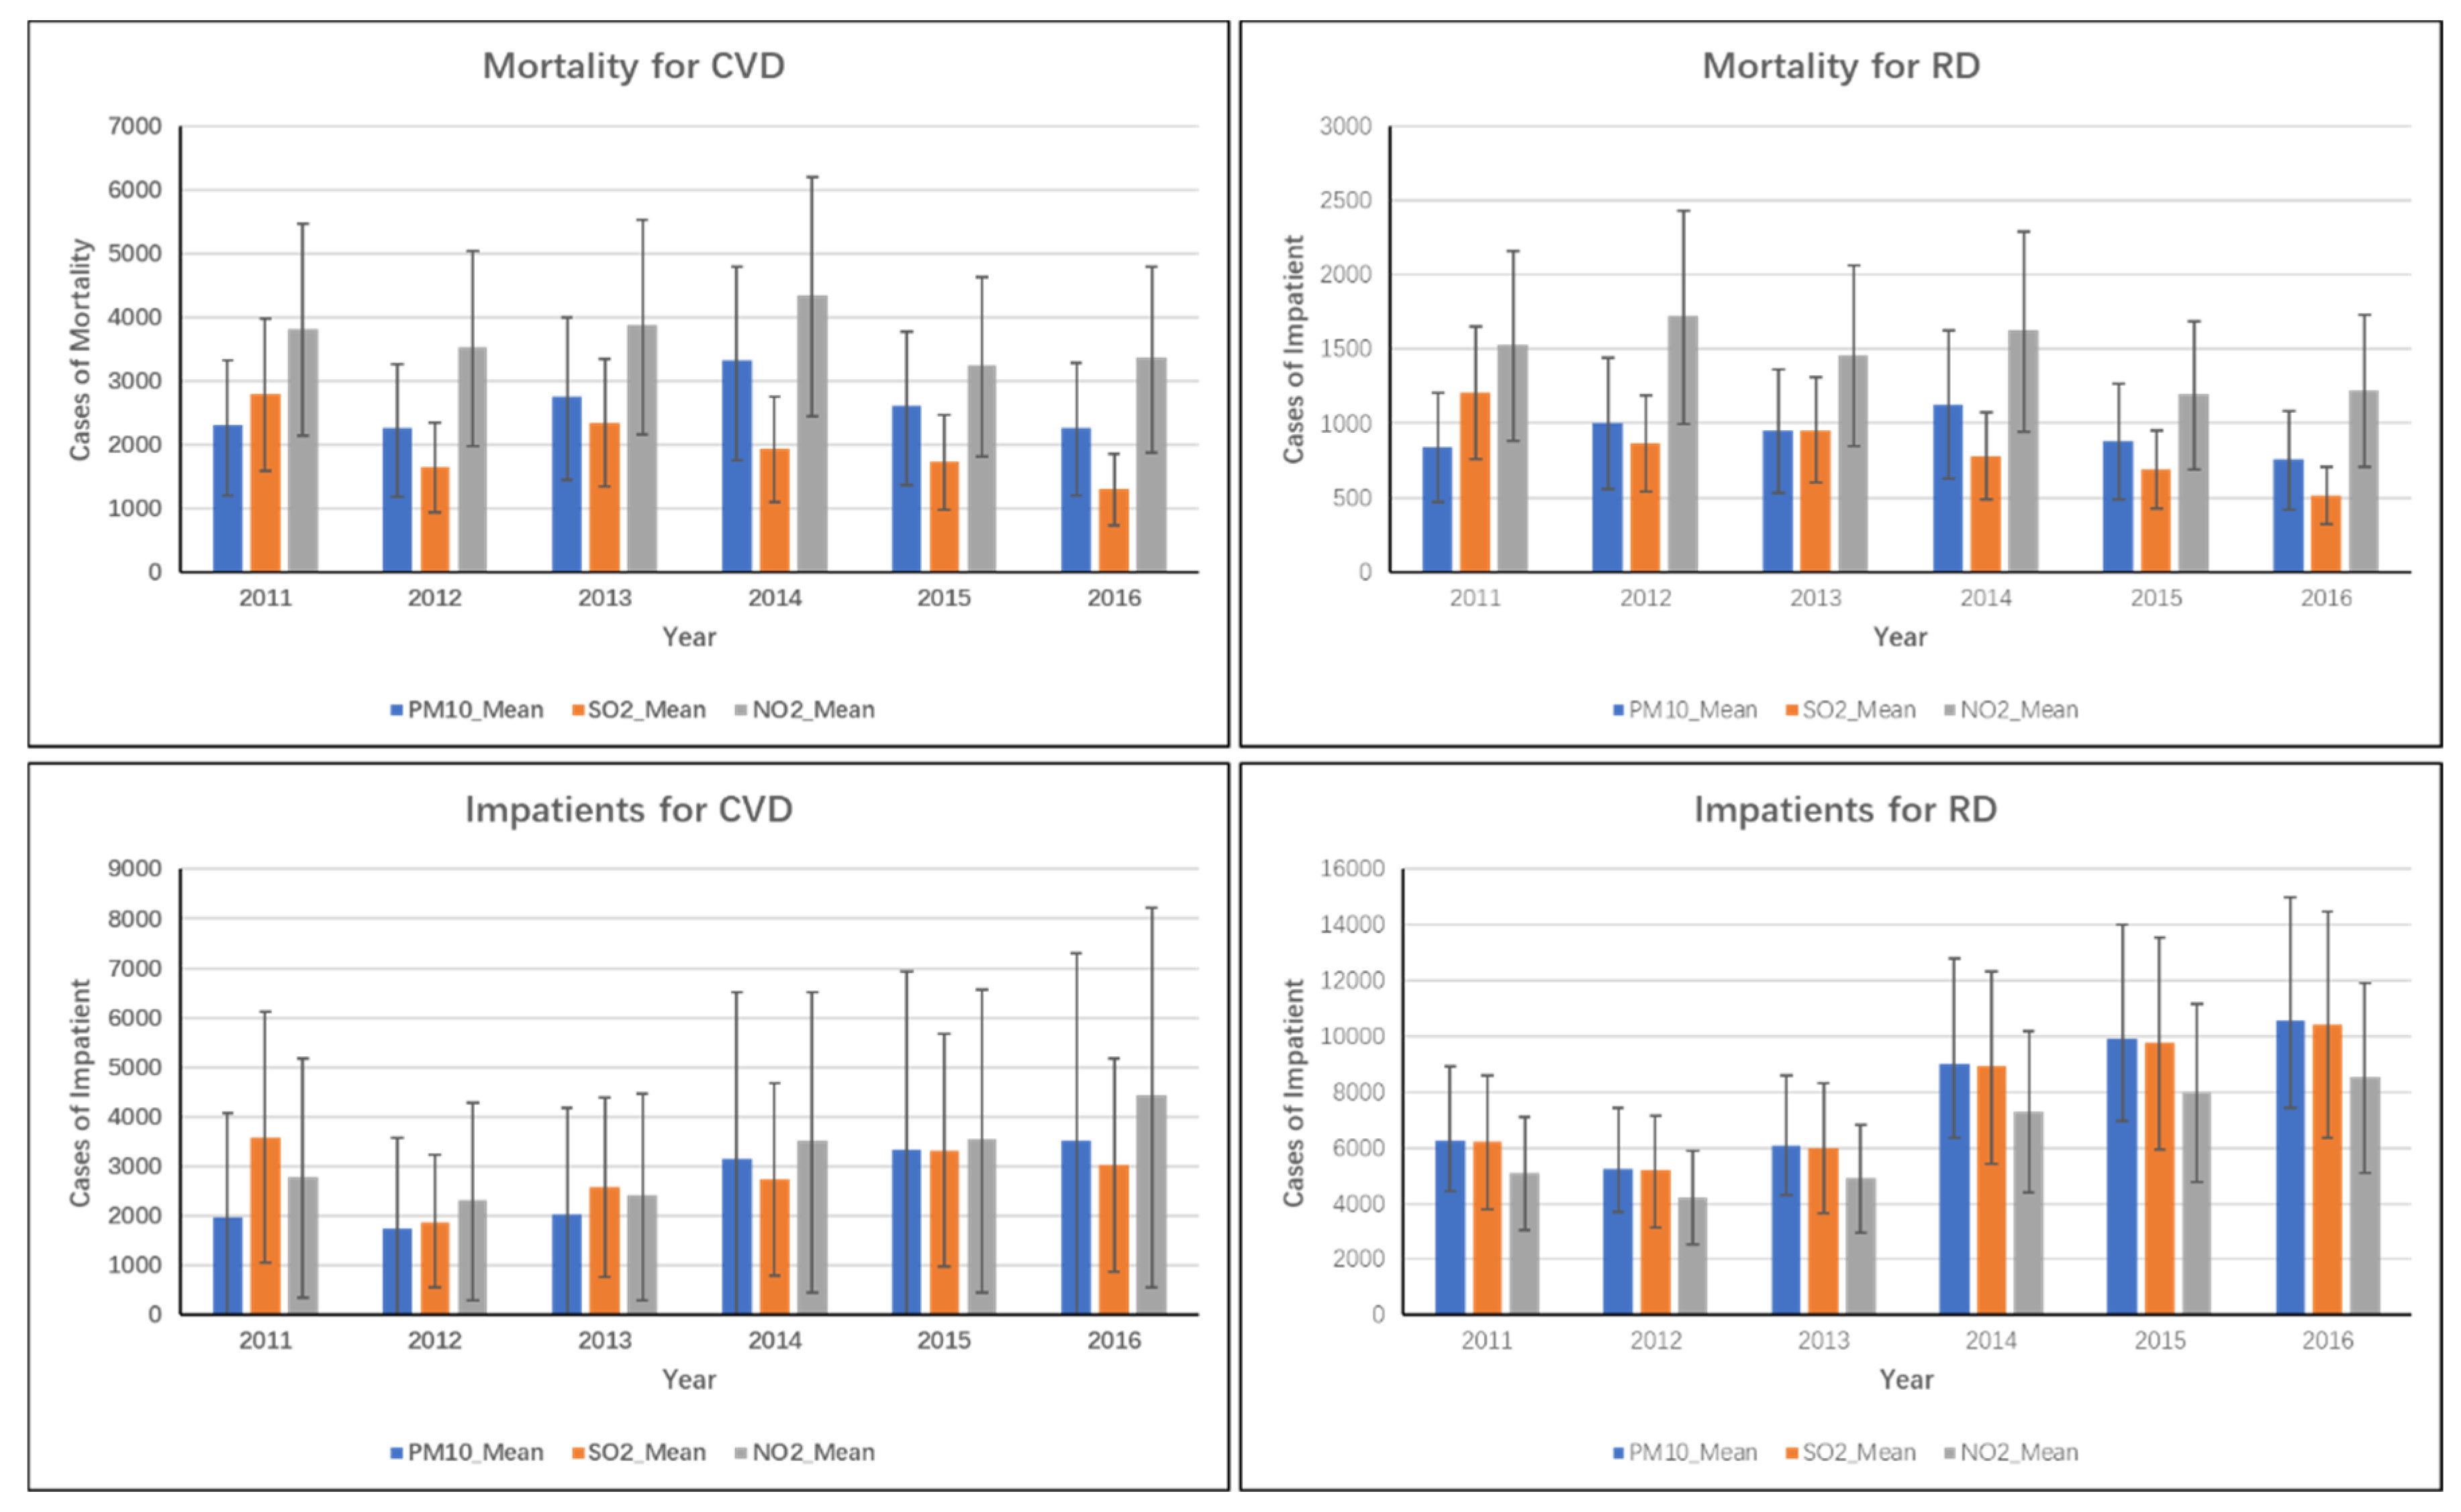
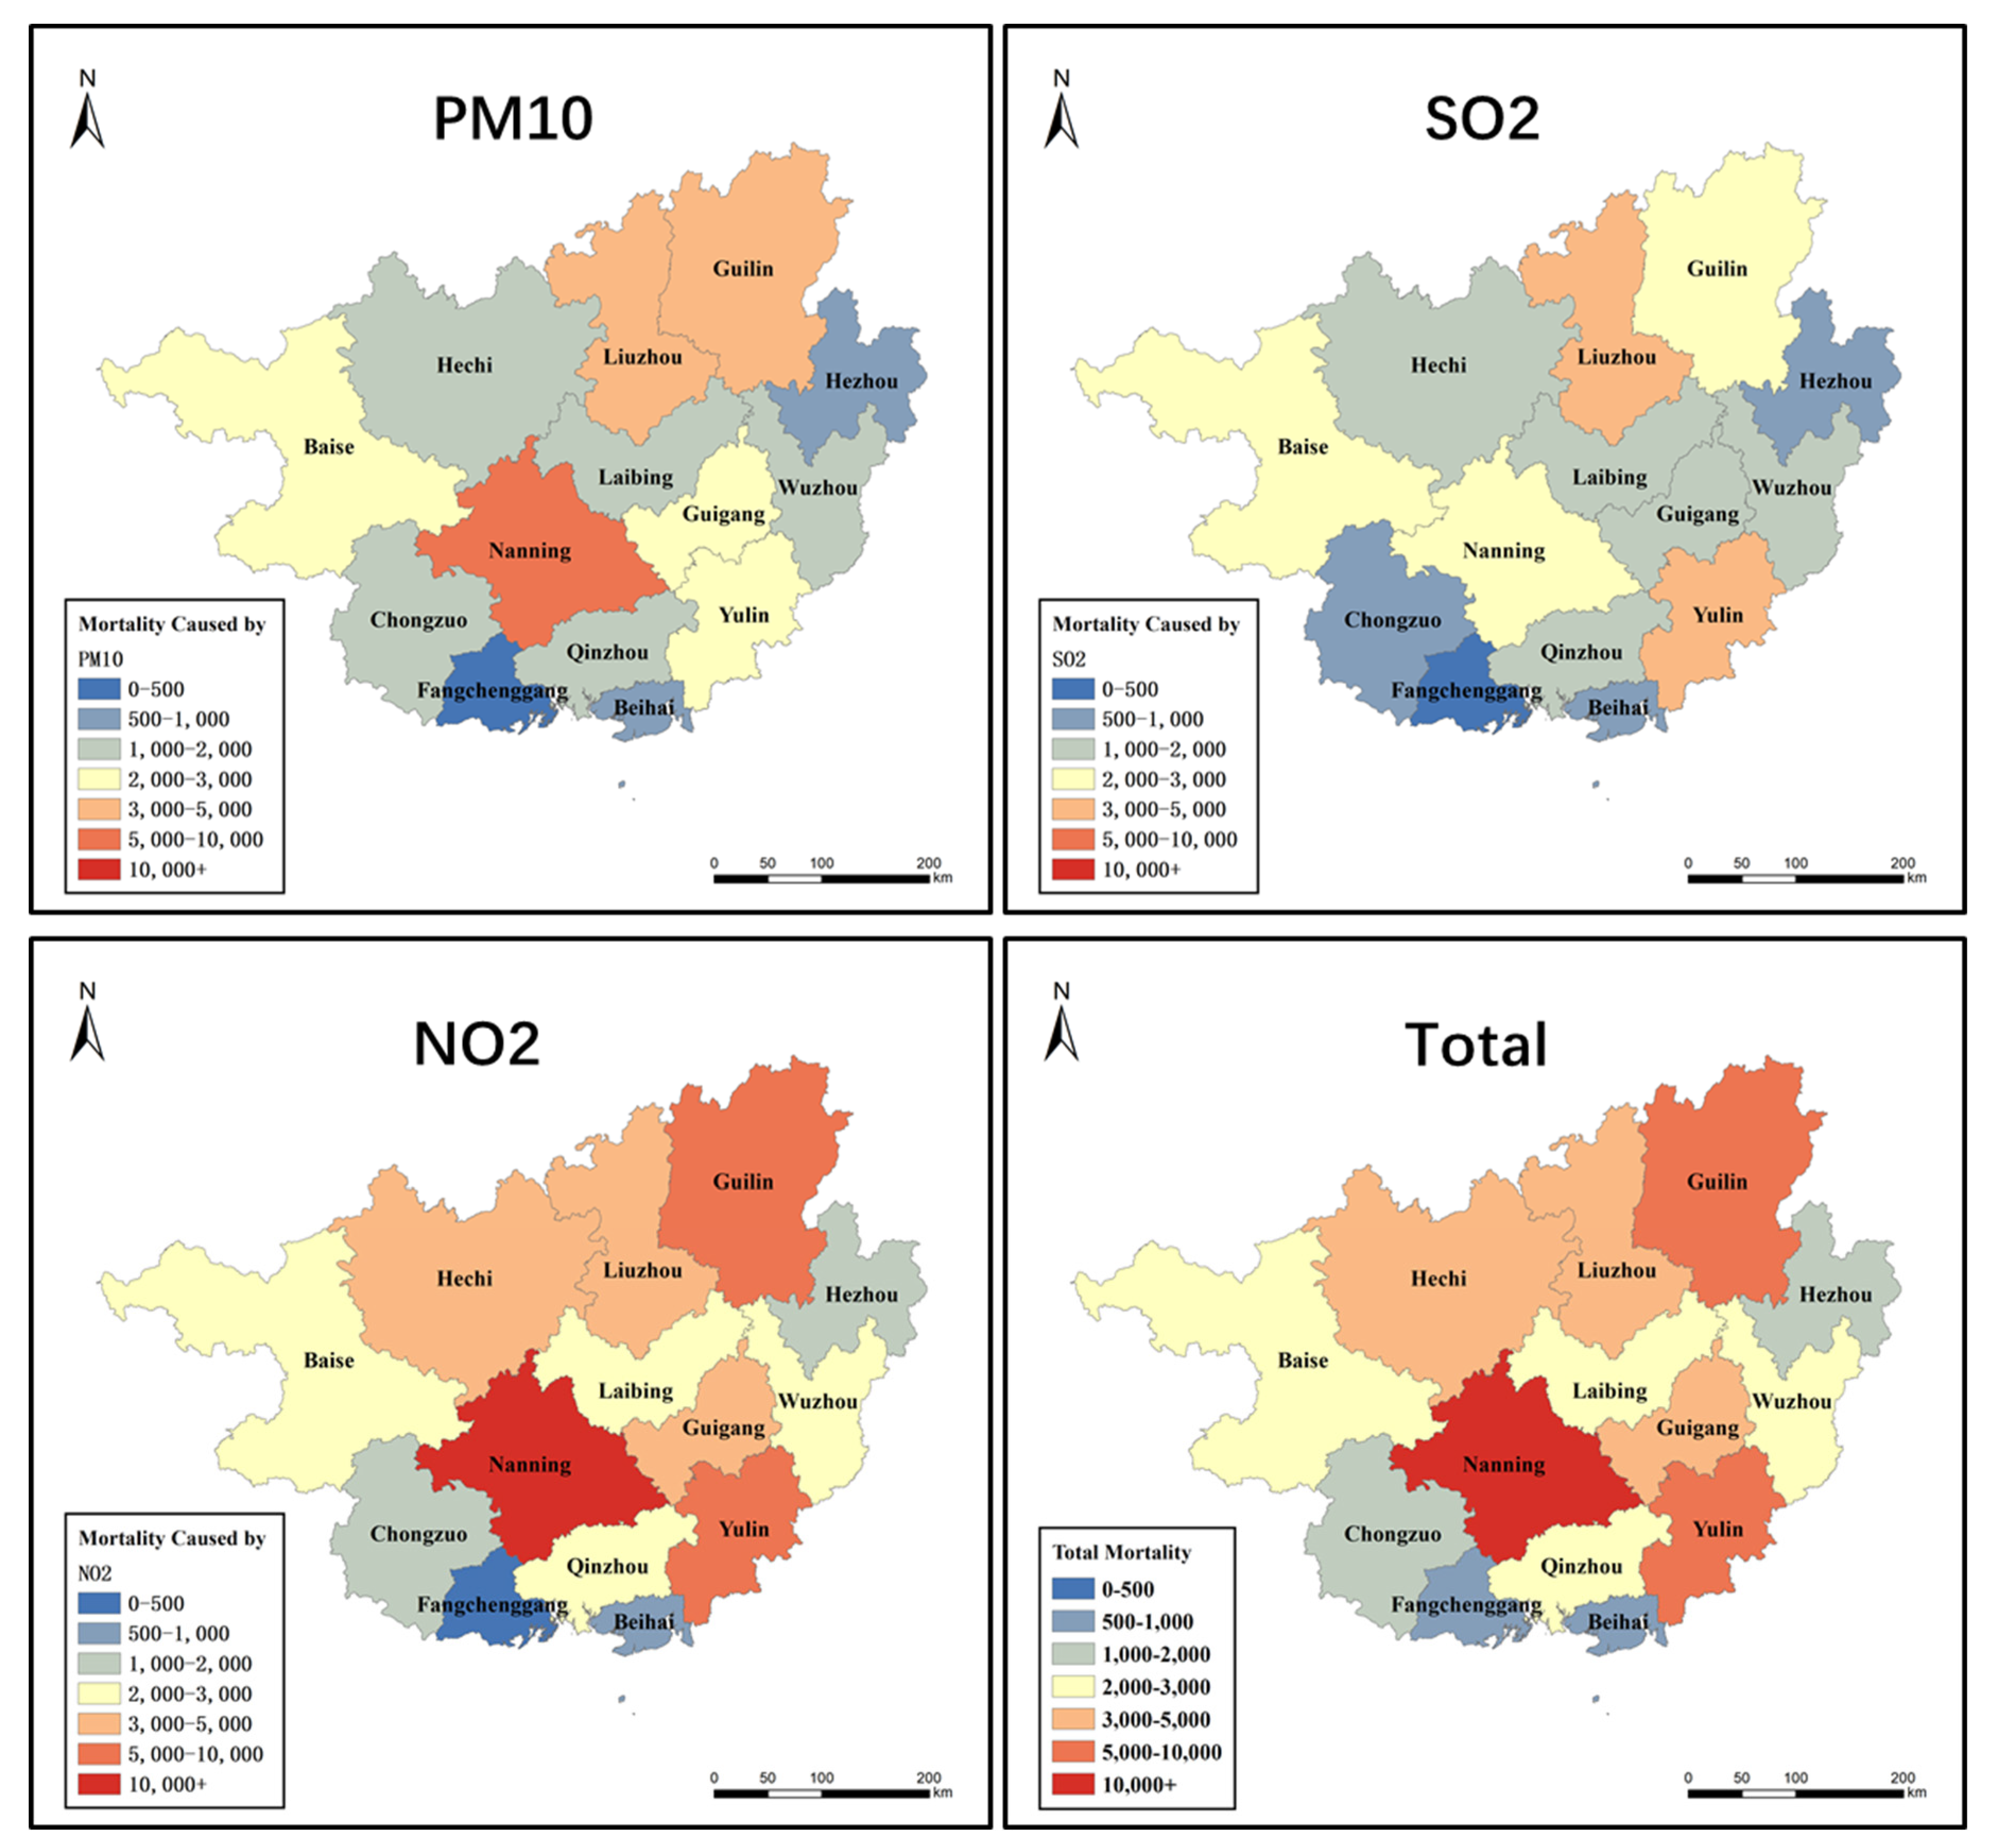
3.2. Health Damage
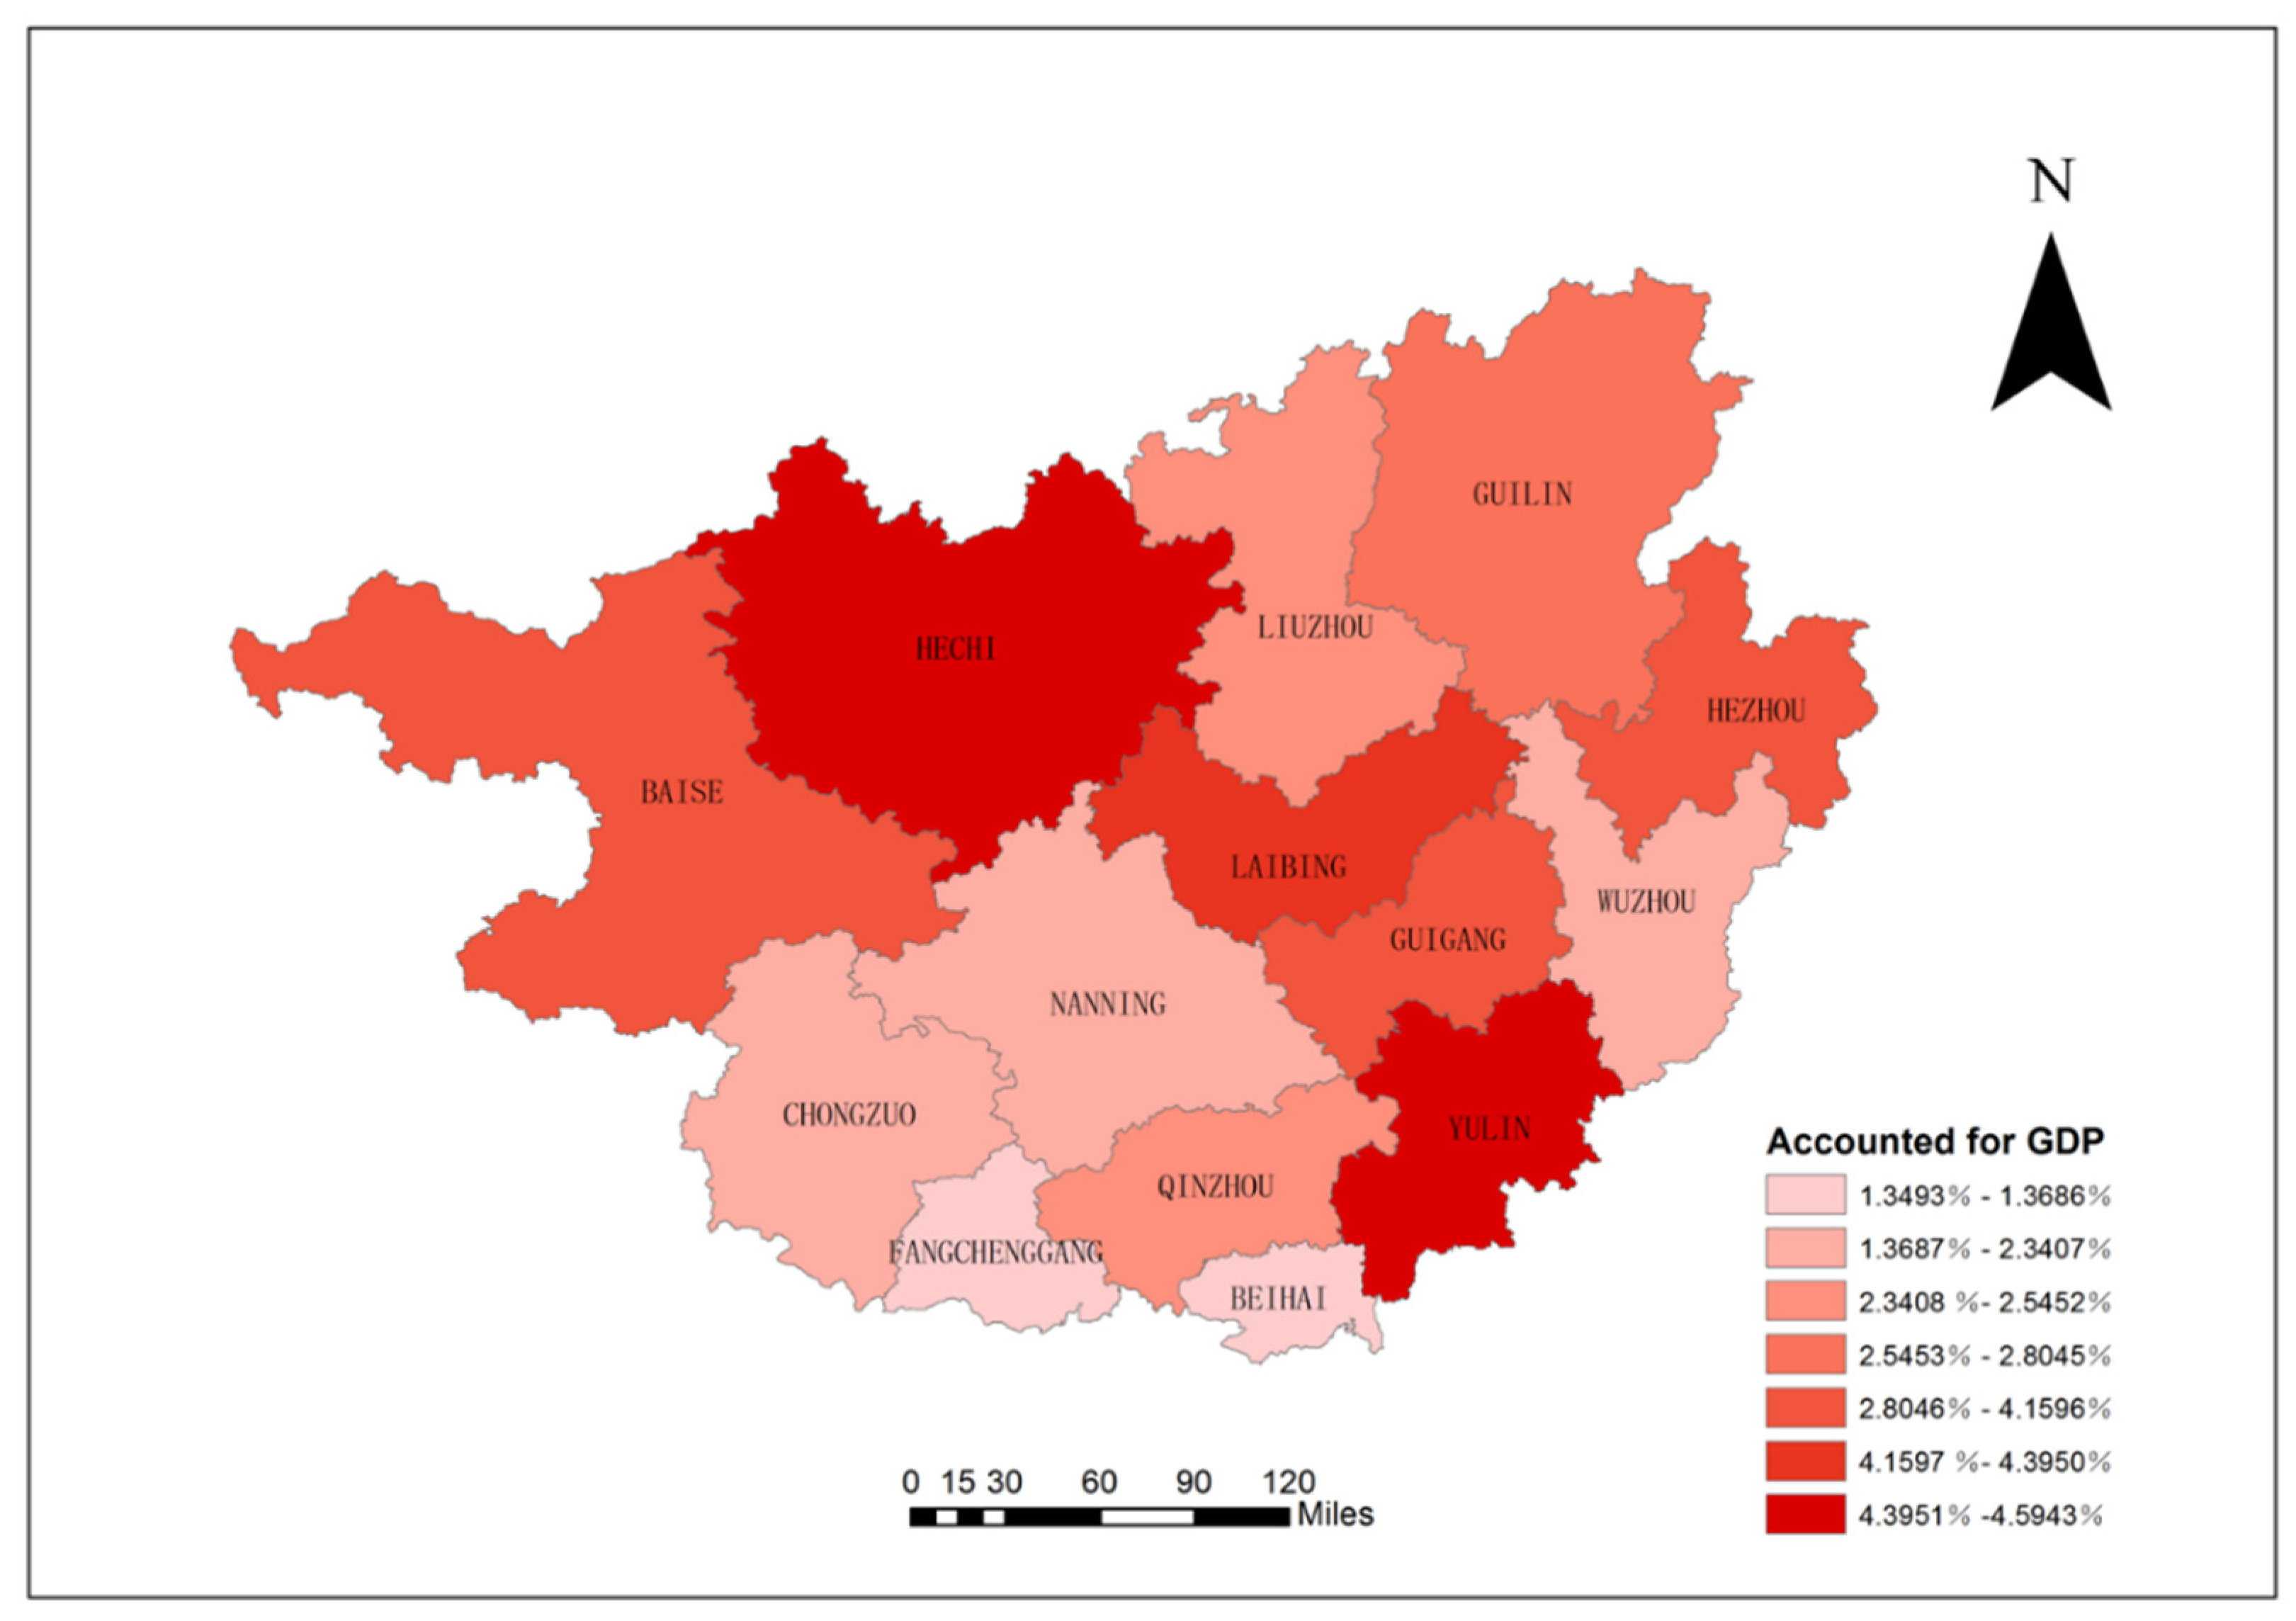
3.3. Estimation of Economic Loss
4. Discussion
4.1. Health Burden Analysis
4.2. Uncertainty Analysis
5. Conclusions
Supplementary Materials
Author Contributions
Funding
Conflicts of Interest
References
- Chen, W. Government Work Report of Guangxi ZAR; Guangxi Regional Government, Ed.; Guangxi Regional Government: Guangxi, China, 2017.
- Duan, Y.; Huang, L. Empirical Analysis of the Relation between Economic Growth and Environmental Pollution in Guangxi Based on Environmental Kuznets Curve. Contemp. Econ. 2015, 155–159. [Google Scholar] [CrossRef]
- Pan, R.; Chen, B.; Mo, Y.; Fu, J.; He, L.; Zhou, W.; Lu, X. Spatio-Temporal Characteristics of PM2.5 and Pollution Weather Types in Guangxi. Res. Environ. Sci. 2018, 31, 465–474. [Google Scholar] [CrossRef]
- Yang, S.; Zhou, C.; Huang, G.; Hun, H.; Qin, C. Influence of Urban Boundary Expansion on Atmosphere Environment—An Example of Nanning City. J. Guangxi Teach. Coll. (Nat. Sci. Ed.) 2003, 20, 10–14. [Google Scholar] [CrossRef]
- Data Center in Department of Environmental Protection Guangxi Zhuang Autonomous Region. Statistics of Air Quality in Guangxi. Available online: http://202.103.233.158:8060/wzsjzx/pages/qtwz/query.jsp?selType=kqzl (accessed on 7 January 2018).
- World Health Organization. WHO Air Quality Guidelines for Particulate Matter, Ozone, Nitrogen Dioxide and Sulfur Dioxide; World Health Organization: Geneva, Switzerland, 2005. [Google Scholar]
- Cohen, A.J.; Ross, A.H.B.; Pandey, K.D.; Krzyzanowski, M.; Kunzli, N.; Gutschmidt, K.; Pope, A.; Romieu, I.; Samet, J.M.; Smith, K.J.J.o.T.; et al. The global burden of disease due to outdoor air pollution. J. Toxicol. Environ. Health 2005, 68, 1301–1307. [Google Scholar] [CrossRef] [PubMed]
- Dockery, D.W.; Pope, C.A. Acute Respiratory Effects of Particulate Air Pollution. Annu. Rev. Public Health 1994, 15, 107–132. [Google Scholar] [CrossRef] [PubMed]
- Samet, J.M.; Zeger, S.L.; Dominici, F.; Curriero, F.; Coursac, I.; Dockery, D.W.; Schwartz, J.; Zanobetti, A. Distributed Lag between Air Pollution and Daily Deaths. The National Morbidity, Mortality, and Air Pollution Study. Part II: Morbidity and Mortality from Air Pollution in the United States (Appendix B). Res. Rep. Health Eff. Inst. 2000, 94, 54–61. [Google Scholar] [CrossRef]
- Cao, J.; Li, W.; Tan, J.; Song, W.; Xu, X.; Jiang, C.; Chen, G.; Chen, R.; Ma, W.; Chen, B.; et al. Association of ambient air pollution with hospital outpatient and emergency room visits in Shanghai, China. Sci. Total Environ. 2009, 407, 5531–5536. [Google Scholar] [CrossRef] [PubMed]
- Chen, R.; Chu, C.; Tan, J.; Cao, J.; Song, W.; Xu, X.; Jiang, C.; Ma, W.; Yang, C.; Chen, B.; et al. Ambient air pollution and hospital admission in Shanghai, China. J. Hazard. Mater. 2010, 181, 234–240. [Google Scholar] [CrossRef] [PubMed]
- Kan, H.; Huang, W.; Chen, B.; Zhao, N. Impact of outdoor air pollution on cardiovascular health in Mainland China. CVD Prev. Control 2009, 4, 71–78. [Google Scholar] [CrossRef]
- Matus, K.; Nam, K.M.; Selin, N.E.; Lamsal, L.N.; Reilly, J.M.; Paltsev, S. Health damages from air pollution in China. Glob. Environ. Chang. 2012, 22, 55–66. [Google Scholar] [CrossRef]
- Xia, Y.; Guan, D.; Jiang, X.; Peng, L.; Schroeder, H.; Zhang, Q. Assessment of socioeconomic costs to China’s air pollution. Assess. Socioecon. Costs China’s Air Pollut. 2016, 139, 147–156. [Google Scholar] [CrossRef]
- Huang, D.; Xu, J.; Zhang, S. Valuing the health risks of particulate air pollution in the Pearl River Delta, China. Environ. Sci. Policy 2012, 15, 38–47. [Google Scholar] [CrossRef]
- Lu, X.; Yao, T.; Fung, J.C.H.; Lin, C. Estimation of health and economic costs of air pollution over the Pearl River Delta region in China. Sci. Total Environ. 2016, 566–567, 134–143. [Google Scholar] [CrossRef] [PubMed]
- Zhao, X.; Yu, X.; Wang, Y.; Fan, C. Economic evaluation of health losses from air pollution in Beijing, China. Environ. Sci. Pollut. Res. 2016, 23, 11716–11728. [Google Scholar] [CrossRef] [PubMed]
- Yin, P.; He, G.; Fan, M.; Chiu, K.Y.; Fan, M.; Liu, C.; Xue, A.; Liu, T.; Pan, Y.; Mu, Q.; et al. Particulate air pollution and mortality in 38 of China’s largest cities: Time series analysis. BMJ 2017, 356, j667. [Google Scholar] [CrossRef] [PubMed]
- National Statistical Bureau of PRC. Gross Domestic Product. In China Statistical Yearbook; National Statistical Bureau of PRC, Ed.; National Statistical Bureau of PRC: Beijing, China, 2017; pp. 223–227. [Google Scholar]
- International Monetary Fund. World Economic Outlook, April 2017: Gaining Momentum; International Monetary Fund: Washington, DC, USA, 2017; pp. 5–8. [Google Scholar]
- Zou, W.; Zhang, S. Economic Valuation of Health Impact of PM10 Pollution in Beijing from 2001 to 2006. Chin. J. Popul. Resour. Environ. 2010, 8, 68–74. [Google Scholar] [CrossRef]
- Brunekreef, B.; Holgate, S.T. Air pollution and health. Lancet 2002, 360, 1233–1242. [Google Scholar] [CrossRef]
- Le Tertre, A.; Medina, S.; Samoli, E.; Forsberg, B.; Michelozzi, P.; Boumghar, A.; Vonk, J.M.; Bellini, A.; Atkinson, R.; Ayres, J.G.; et al. Short-term effects of particulate air pollution on cardiovascular diseases in eight European cities. J. Epidemiol. Community Health 2002, 56, 773. [Google Scholar] [CrossRef]
- National Health Comission of PRC. China Health Statistics Yearbook; Peking Uniion Medical College Press: Beijing, China, 2011–2017.
- WHO. Air Quality Guidelines for Europe; World Health Organization: Geneva, Switzerland, 2000. [Google Scholar]
- Chen, R. The Health Effects of Complex Air Pollution in 17 Chinese Cities; Fudan University: Shanghai, Beijing, 2013. [Google Scholar]
- Tian, Y.; Liu, H.; Liang, T.; Xiang, X.; Li, M.; Juan, J.; Song, J.; Cao, Y.; Wang, X.; Chen, L.; et al. Ambient air pollution and daily hospital admissions: A nationwide study in 218 Chinese cities. Environ. Pollut. 2018, 242, 1042–1049. [Google Scholar] [CrossRef]
- Tao, Y.; Mi, S.; Zhou, S.; Wang, S.; Xie, X. Air pollution and hospital admissions for respiratory diseases in Lanzhou, China. Environ. Pollut. 2014, 185, 196–201. [Google Scholar] [CrossRef]
- Wang, H.; He, J. The Value of Statistical Life: A Contingent Investigation in China. Soc. Sci. Electron. Publ. 2010, 28, 213–226. [Google Scholar] [CrossRef]
- OECD. The valuation of mortality risk. SourceOECD Soc. Issues/Migr./Health 2012, 2011, 17–38. [Google Scholar]
- Kan, H.; Wong, C.-M.; Vichit-Vadakan, N.; Qian, Z. Short-term association between sulfur dioxide and daily mortality: The Public Health and Air Pollution in Asia (PAPA) study. Environ. Res. 2010, 110, 258–264. [Google Scholar] [CrossRef] [PubMed]
- Guo, L.J.; Zhao, A.; Chen, R.J.; Kan, H.D.; Kuang, X.Y. Association between Ambient Air Pollution and Outpatient Visits for Acute Bronchitis in a Chinese City. Biomed. Environ. Sci. 2014, 27, 833–840. [Google Scholar] [CrossRef] [PubMed]
- Zhan, D.; Kwan, M.P.; Zhang, W.; Wang, S.; Yu, J. Spatiotemporal Variations and Driving Factors of Air Pollution in China. Int. J. Environ. Res. Public Health 2017, 14, 1538. [Google Scholar] [CrossRef] [PubMed]
- Lin, X.; Wang, D. Spatiotemporal evolution of urban air quality and socioeconomic driving forces in China. J. Geogr. Sci. 2016, 26, 1533–1549. [Google Scholar] [CrossRef]
- Liu, C.; Henderson, B.H.; Wang, D.; Yang, X.; Peng, Z.-R. A land use regression application into assessing spatial variation of intra-urban fine particulate matter (PM2.5) and nitrogen dioxide (NO2) concentrations in City of Shanghai, China. Sci. Total Environ. 2016, 565, 607–615. [Google Scholar] [CrossRef] [PubMed]
- Guangxi Zhuang Autonomous Region Bureau of Statistics. Main Social & Economic Indicators by City. In Guangxi Statistical Yearbook 2017; Guangxi Zhuang Autonomous Region Bureau of Statistics: Guangxi, China, 2010–2017; Volume 22, p. 223. [Google Scholar]
- State Council of the PRC (Ed.) The Action Plan for the Prevention and Control of Air Pollution; State Council of the PRC: Beijing, China, 2013.
- Xu, X. Meta-Analysis of Contingent Valuation Studies on Air Pollution-Related Value of Statistical Life in China. Chin. Health Resour. 2013, 16, 64–67. [Google Scholar] [CrossRef]
- Tian, T.; Chen, Y.; Zhu, J.; Liu, P. Effect of Air Pollution and Rural-Urban Difference on Mental Health of the Elderly in China. Iran. J. Public Health 2015, 44, 1084–1094. [Google Scholar] [CrossRef] [PubMed]
- Shuai, C.; Oliva, P.; Peng, Z. Air Pollution and Mental Health: Evidence from China. Natl. Bur. Econ. Res. 2018. [Google Scholar] [CrossRef]


| Health Effect | Pollutant | Coefficient (Per 10 μg/m3) | References |
|---|---|---|---|
| All-Cause Mortality | PM10 | 0.35% (0.18–0.52%) | [26] |
| SO2 | 0.75% (0.47–1.02%) | ||
| NO2 | 1.63% (1.09–2.17%) | ||
| Mortality for Cardiovascular | PM10 | 0.44% (0.23–0.64%) | |
| SO2 | 0.83% (0.47–1.19%) | ||
| NO2 | 1.80% (1.00–2.59%) | ||
| Mortality for Respiratory | PM10 | 0.56% (0.31–0.81%) | |
| SO2 | 1.25% (0.78–1.73%) | ||
| NO2 | 2.52% (1.44–3.59%) | ||
| All-Cause Outpatient Visits | PM10 | 0.25% (0.00–0.50%) | [10] |
| SO2 | 0.63% (0.03–1.23%) | ||
| NO2 | 0.99% (0.10–1.18%) | ||
| All-cause Hospital Admission | PM10 | 0.35% (0.23–0.47%) | [27] |
| SO2 | 1.18% (0.89–1.46%) | ||
| NO2 | 1.78% (1.44–2.12%) | ||
| Inpatients for Cardiovascular | PM10 | 0.23% (−0.03–0.47%) | [11] |
| SO2 | 0.65% (0.19–1.12%) | ||
| NO2 | 0.80% (0.10–1.49%) | ||
| Inpatients for Respiratory | PM10 | 0.77% (0.54–1.10%) | [28] |
| SO2 | 0.76% (0.46–1.06%) | ||
| NO2 | 0.62% (0.37–0.87%) |
| Pollutant | Year | 2011 | 2012 | 2013 | 2014 | 2015 | 2016 |
|---|---|---|---|---|---|---|---|
| PM10 | BAISE | 59.24 | 52.00 | 58.71 | 92.07 | 67.53 | 61.83 |
| BEIHAI | 60.23 | 52.81 | 53.27 | 58.07 | 48.28 | 44.42 | |
| CHONGZUO | 57.62 | 54.85 | 60.48 | 63.13 | 55.91 | 50.76 | |
| FANGCHENGGANG | 64.46 | 54.00 | 58.30 | 104.05 | 49.90 | 45.15 | |
| GUIGANG | 68.26 | 70.56 | 78.90 | 103.22 | 64.36 | 55.45 | |
| GUILIN | 75.82 | 70.46 | 83.65 | 132.38 | 66.70 | 64.12 | |
| HECHI | 63.68 | 63.77 | 65.37 | 63.29 | 68.79 | 55.24 | |
| HEZHOU | 40.63 | 45.38 | 51.15 | 96.29 | 60.58 | 54.68 | |
| LAIBING | 74.15 | 55.58 | 55.79 | 64.50 | 60.86 | 58.12 | |
| LIUZHOU | 74.40 | 71.43 | 88.02 | 91.79 | 69.65 | 66.47 | |
| NANNING | 72.98 | 68.51 | 90.08 | 83.88 | 71.79 | 62.18 | |
| QINZHOU | 63.61 | 58.06 | 62.61 | 105.07 | 58.15 | 54.50 | |
| WUZHOU | 42.55 | 48.04 | 52.65 | 68.88 | 56.63 | 57.09 | |
| YULIN | 51.70 | 42.01 | 43.06 | 97.71 | 57.09 | 53.18 | |
| SO2 | BAISE | 51.13 | 13.73 | 47.28 | 46.20 | 16.42 | 13.10 |
| BEIHAI | 23.11 | 18.19 | 17.74 | 13.47 | 8.85 | 9.16 | |
| CHONGZUO | 23.59 | 22.59 | 14.82 | 15.39 | 10.45 | 11.93 | |
| FANGCHENGGANG | 15.04 | 8.79 | 9.71 | 15.00 | 5.78 | 9.33 | |
| GUIGANG | 18.64 | 17.09 | 15.20 | 16.78 | 22.00 | 18.48 | |
| GUILIN | 35.23 | 23.10 | 27.42 | 43.33 | 21.88 | 17.28 | |
| HECHI | 45.08 | 20.44 | 26.20 | 11.75 | 24.25 | 12.36 | |
| HEZHOU | 16.29 | 15.09 | 20.75 | 19.90 | 16.30 | 18.00 | |
| LAIBING | 30.46 | 47.93 | 25.04 | 24.11 | 20.74 | 21.99 | |
| LIUZHOU | 64.01 | 48.79 | 34.42 | 31.35 | 24.42 | 21.36 | |
| NANNING | 25.76 | 19.22 | 19.18 | 14.89 | 12.93 | 12.45 | |
| QINZHOU | 19.14 | 17.88 | 17.20 | 33.00 | 17.36 | 17.39 | |
| WUZHOU | 25.73 | 14.16 | 16.24 | 28.72 | 17.69 | 11.03 | |
| YULIN | 40.44 | 43.68 | 48.68 | 42.36 | 32.39 | 24.83 | |
| NO2 | BAISE | 22.15 | 18.37 | 20.82 | 29.35 | 17.04 | 14.73 |
| BEIHAI | 19.50 | 13.21 | 12.85 | 14.27 | 13.95 | 12.51 | |
| CHONGZUO | 18.98 | 15.20 | 18.56 | 19.09 | 17.70 | 18.07 | |
| FANGCHENGGANG | 23.33 | 19.17 | 21.81 | 21.42 | 12.32 | 17.30 | |
| GUIGANG | 25.14 | 17.55 | 23.97 | 32.56 | 20.36 | 22.19 | |
| GUILIN | 30.63 | 35.64 | 31.39 | 50.19 | 25.15 | 26.85 | |
| HECHI | 27.55 | 21.12 | 23.28 | 23.99 | 22.45 | 26.56 | |
| HEZHOU | 21.58 | 20.70 | 18.98 | 21.63 | 14.92 | 16.46 | |
| LAIBING | 32.56 | 20.85 | 22.20 | 24.89 | 23.96 | 20.97 | |
| LIUZHOU | 32.67 | 27.37 | 31.08 | 30.05 | 23.73 | 24.17 | |
| NANNING | 32.52 | 33.15 | 37.85 | 37.06 | 33.05 | 31.92 | |
| QINZHOU | 26.40 | 23.19 | 24.56 | 27.74 | 19.46 | 20.05 | |
| WUZHOU | 21.62 | 25.35 | 25.61 | 13.39 | 20.90 | 21.81 | |
| YULIN | 19.22 | 20.84 | 21.35 | 40.71 | 22.74 | 23.72 |
| Year | All-Cause Mortality | All Caused Hospital Admission | Total | GDP Rate |
|---|---|---|---|---|
| Total | 4028 (1376–6656) | 36,528 (22,797–50,929) | 40,555 (24,172–57,585) | 2.86% (1.70–4.06%) |
| 2011 | 1096 (457–1730) | 5918 (3688–8218) | 7014 (4145–9948) | 3.97% (2.35–5.63%) |
| 2012 | 1259 (513–1997) | 5599 (3491–7793) | 6857 (4004–9790) | 3.30% (1.93–4.71%) |
| 2013 | 555 (117–988) | 6890 (4299–9597) | 7446 (4416–1,0585) | 3.23% (1.91–4.59%) |
| 2014 | 658 (137–1172) | 7096 (4435–9912) | 7754 (4572–11,083) | 3.03% (1.78–4.32%) |
| 2015 | 235 (78–392) | 6038 (3770–8434) | 6273 (3,848–8827) | 2.32% (1.42–3.26%) |
| 2016 | 225 (74–377) | 4987 (3114–6974) | 5212 (3188–7351) | 1.89% (1.16–2.67%) |
| Pollutant | Socioeconomic Indicator | R |
|---|---|---|
| PM10 | Gross industrial production | 0.69 * |
| Developed area | 0.63 * | |
| Number of motor vehicles | 0.53 * | |
| NO2 | Developed area | 0.74 ** |
| Number of motor vehicles | 0.74 * | |
| Gross industrial production | 0.65 ** |
| Socioeconomic Indicator | R |
|---|---|
| Residential Income | 0.86 ** |
| Population Density | 0.65 * |
| Rate of Urbanization | 0.60 * |
| Industry’s share of GDP | 0.58 * |
© 2019 by the authors. Licensee MDPI, Basel, Switzerland. This article is an open access article distributed under the terms and conditions of the Creative Commons Attribution (CC BY) license (http://creativecommons.org/licenses/by/4.0/).
Share and Cite
Han, F.; Lu, X.; Xiao, C.; Chang, M.; Huang, K. Estimation of Health Effects and Economic Losses from Ambient Air Pollution in Undeveloped Areas: Evidence from Guangxi, China. Int. J. Environ. Res. Public Health 2019, 16, 2707. https://doi.org/10.3390/ijerph16152707
Han F, Lu X, Xiao C, Chang M, Huang K. Estimation of Health Effects and Economic Losses from Ambient Air Pollution in Undeveloped Areas: Evidence from Guangxi, China. International Journal of Environmental Research and Public Health. 2019; 16(15):2707. https://doi.org/10.3390/ijerph16152707
Chicago/Turabian StyleHan, Feng, Xingcheng Lu, Cuicui Xiao, Miao Chang, and Ke Huang. 2019. "Estimation of Health Effects and Economic Losses from Ambient Air Pollution in Undeveloped Areas: Evidence from Guangxi, China" International Journal of Environmental Research and Public Health 16, no. 15: 2707. https://doi.org/10.3390/ijerph16152707
APA StyleHan, F., Lu, X., Xiao, C., Chang, M., & Huang, K. (2019). Estimation of Health Effects and Economic Losses from Ambient Air Pollution in Undeveloped Areas: Evidence from Guangxi, China. International Journal of Environmental Research and Public Health, 16(15), 2707. https://doi.org/10.3390/ijerph16152707