Human Error: The Impact of Job Insecurity on Attention-Related Cognitive Errors and Error Detection


Abstract
1. Introduction
1.1. Quantitative and Qualitative Job Insecurity
1.2. Cognitive Errors
1.3. Indirect Effects via Burnout
1.4. Error Detection: Misses and False Positives
1.5. The Present Research
2. Materials and Methods
2.1. Pilot Studies
2.2. Participants and Procedure
2.3. Measures
2.3.1. Questionnaire
2.3.2. Error Detection Task
2.3.3. Principles Underlying the Error Detection Task
2.4. Analytical Strategy
Analytical Strategy for the Error Detection Task
3. Results
3.1. Validity of the Error Detection Task
3.2. Direct and Indirect Effects
4. Discussion
4.1. Theoretical Implications
4.2. Practical Implications
4.3. Limitations and Future Research
5. Conclusions
Author Contributions
Funding
Acknowledgments
Conflicts of Interest
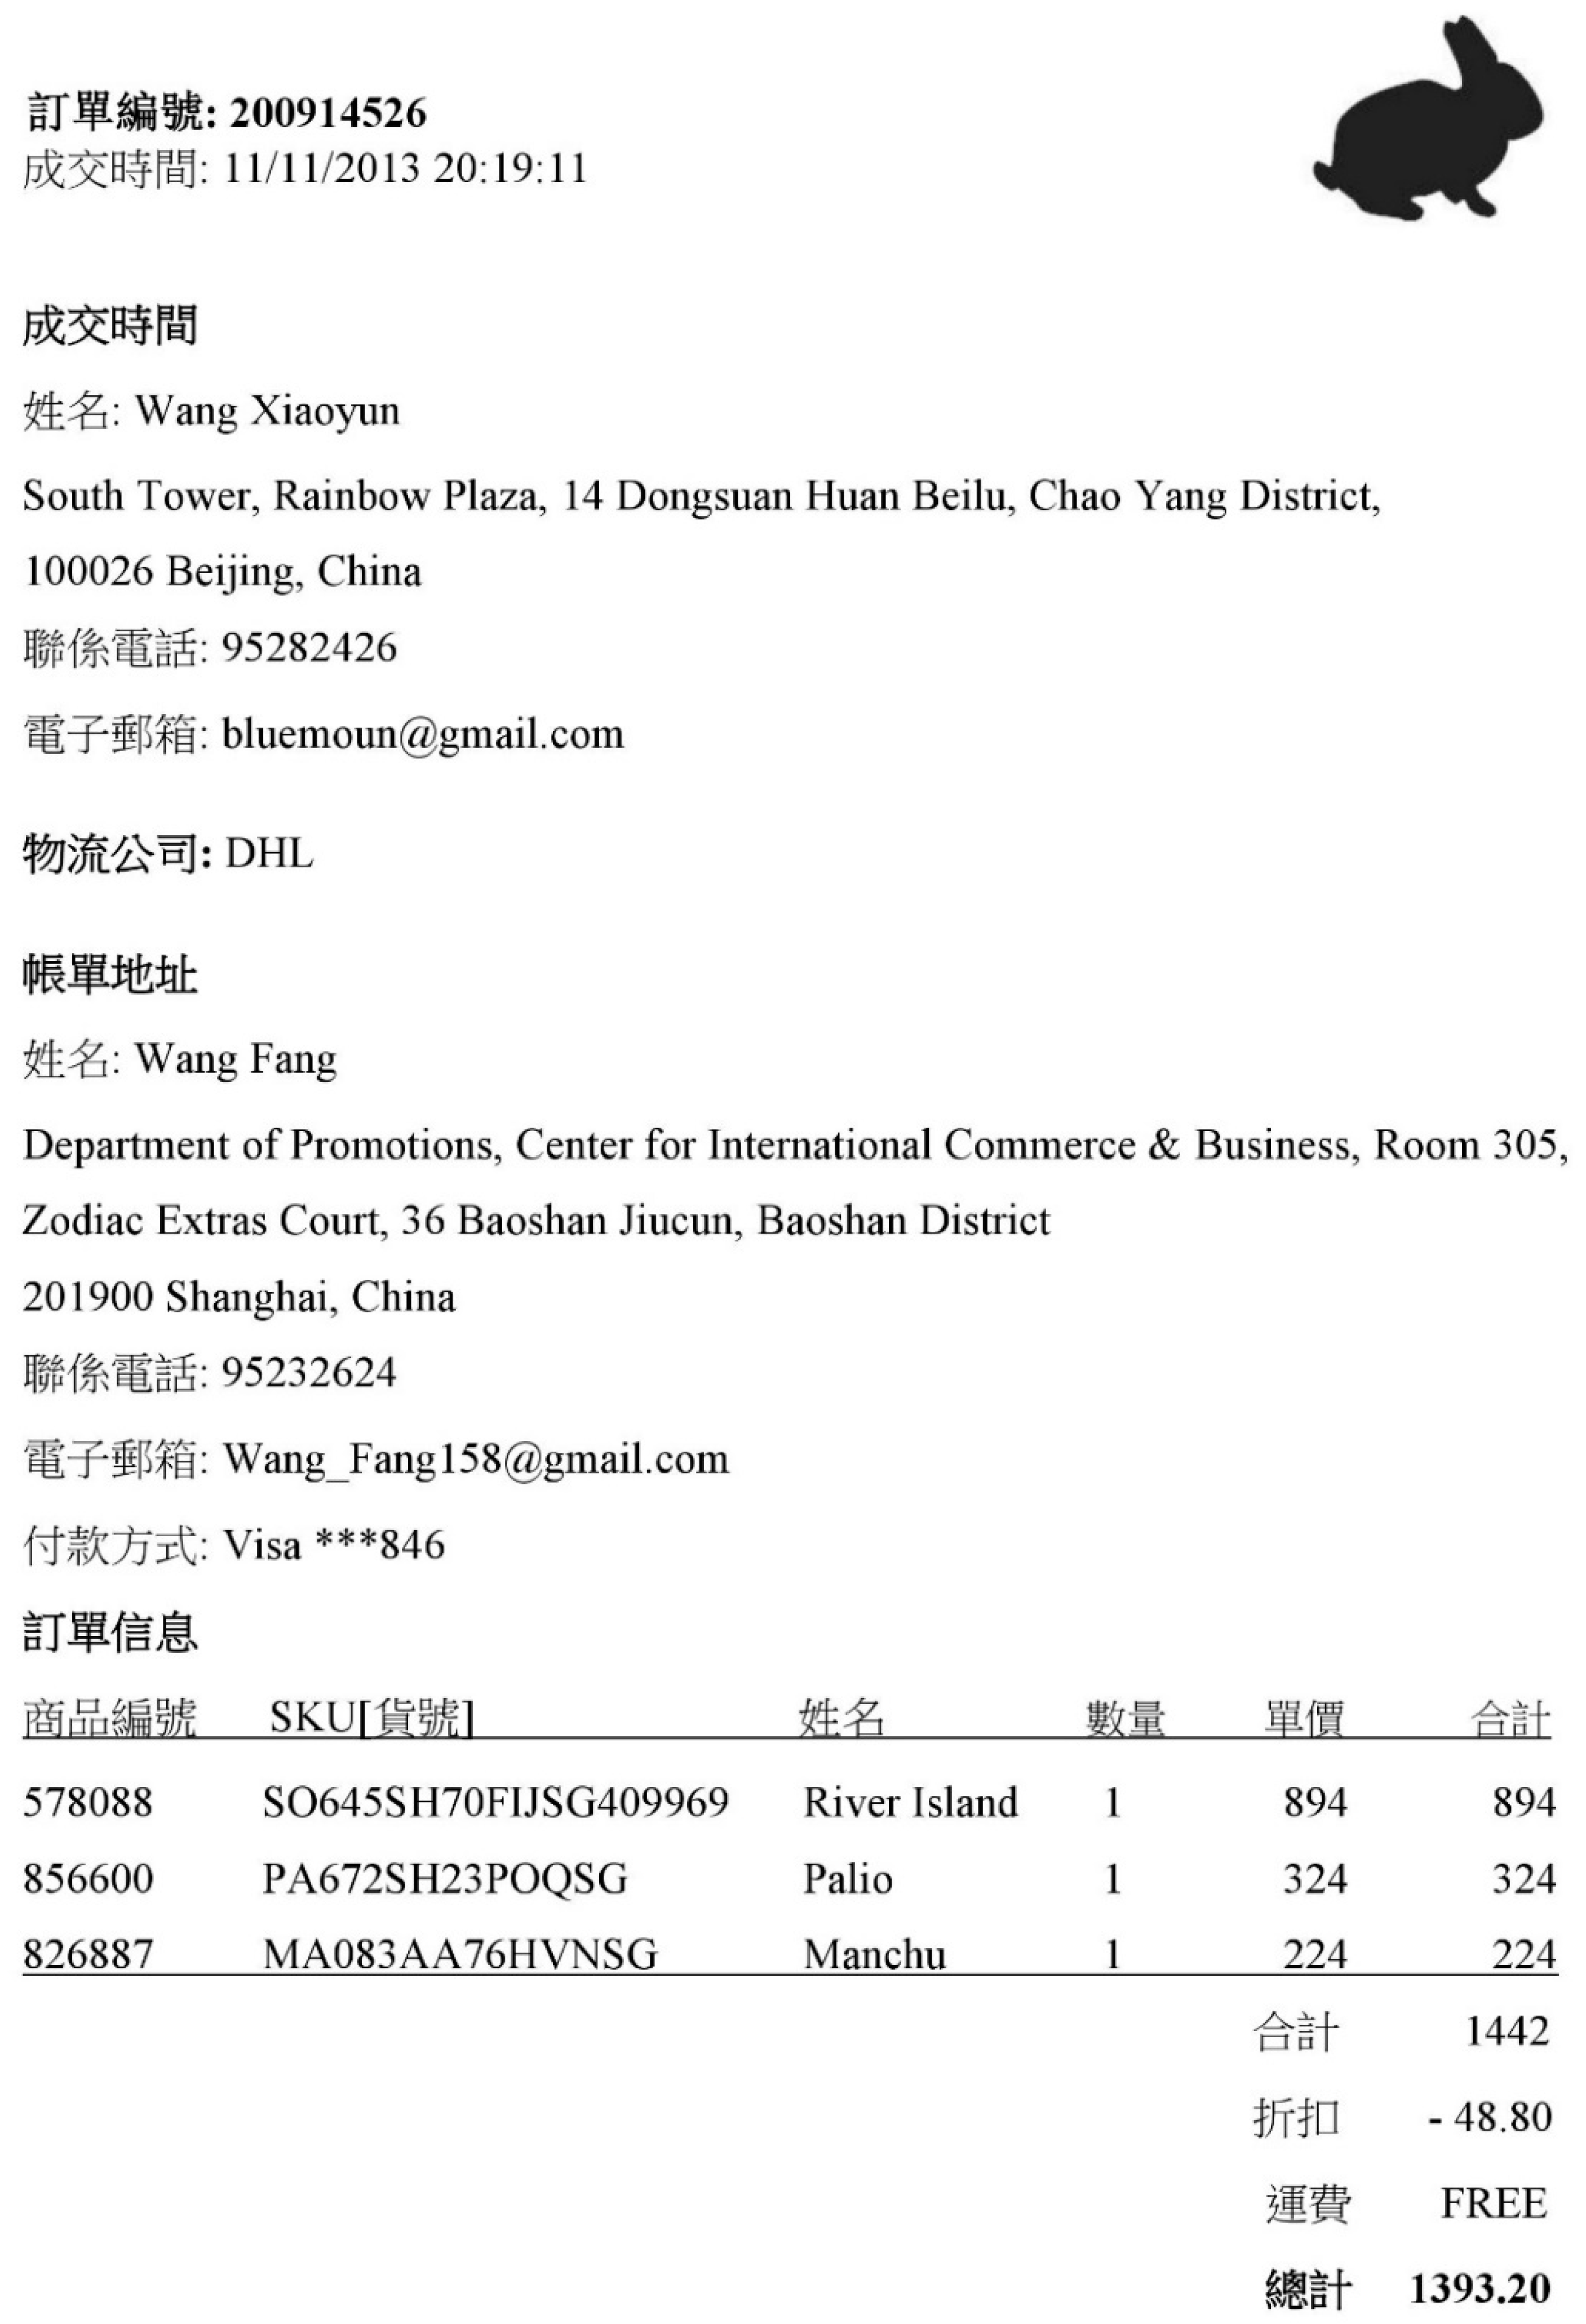
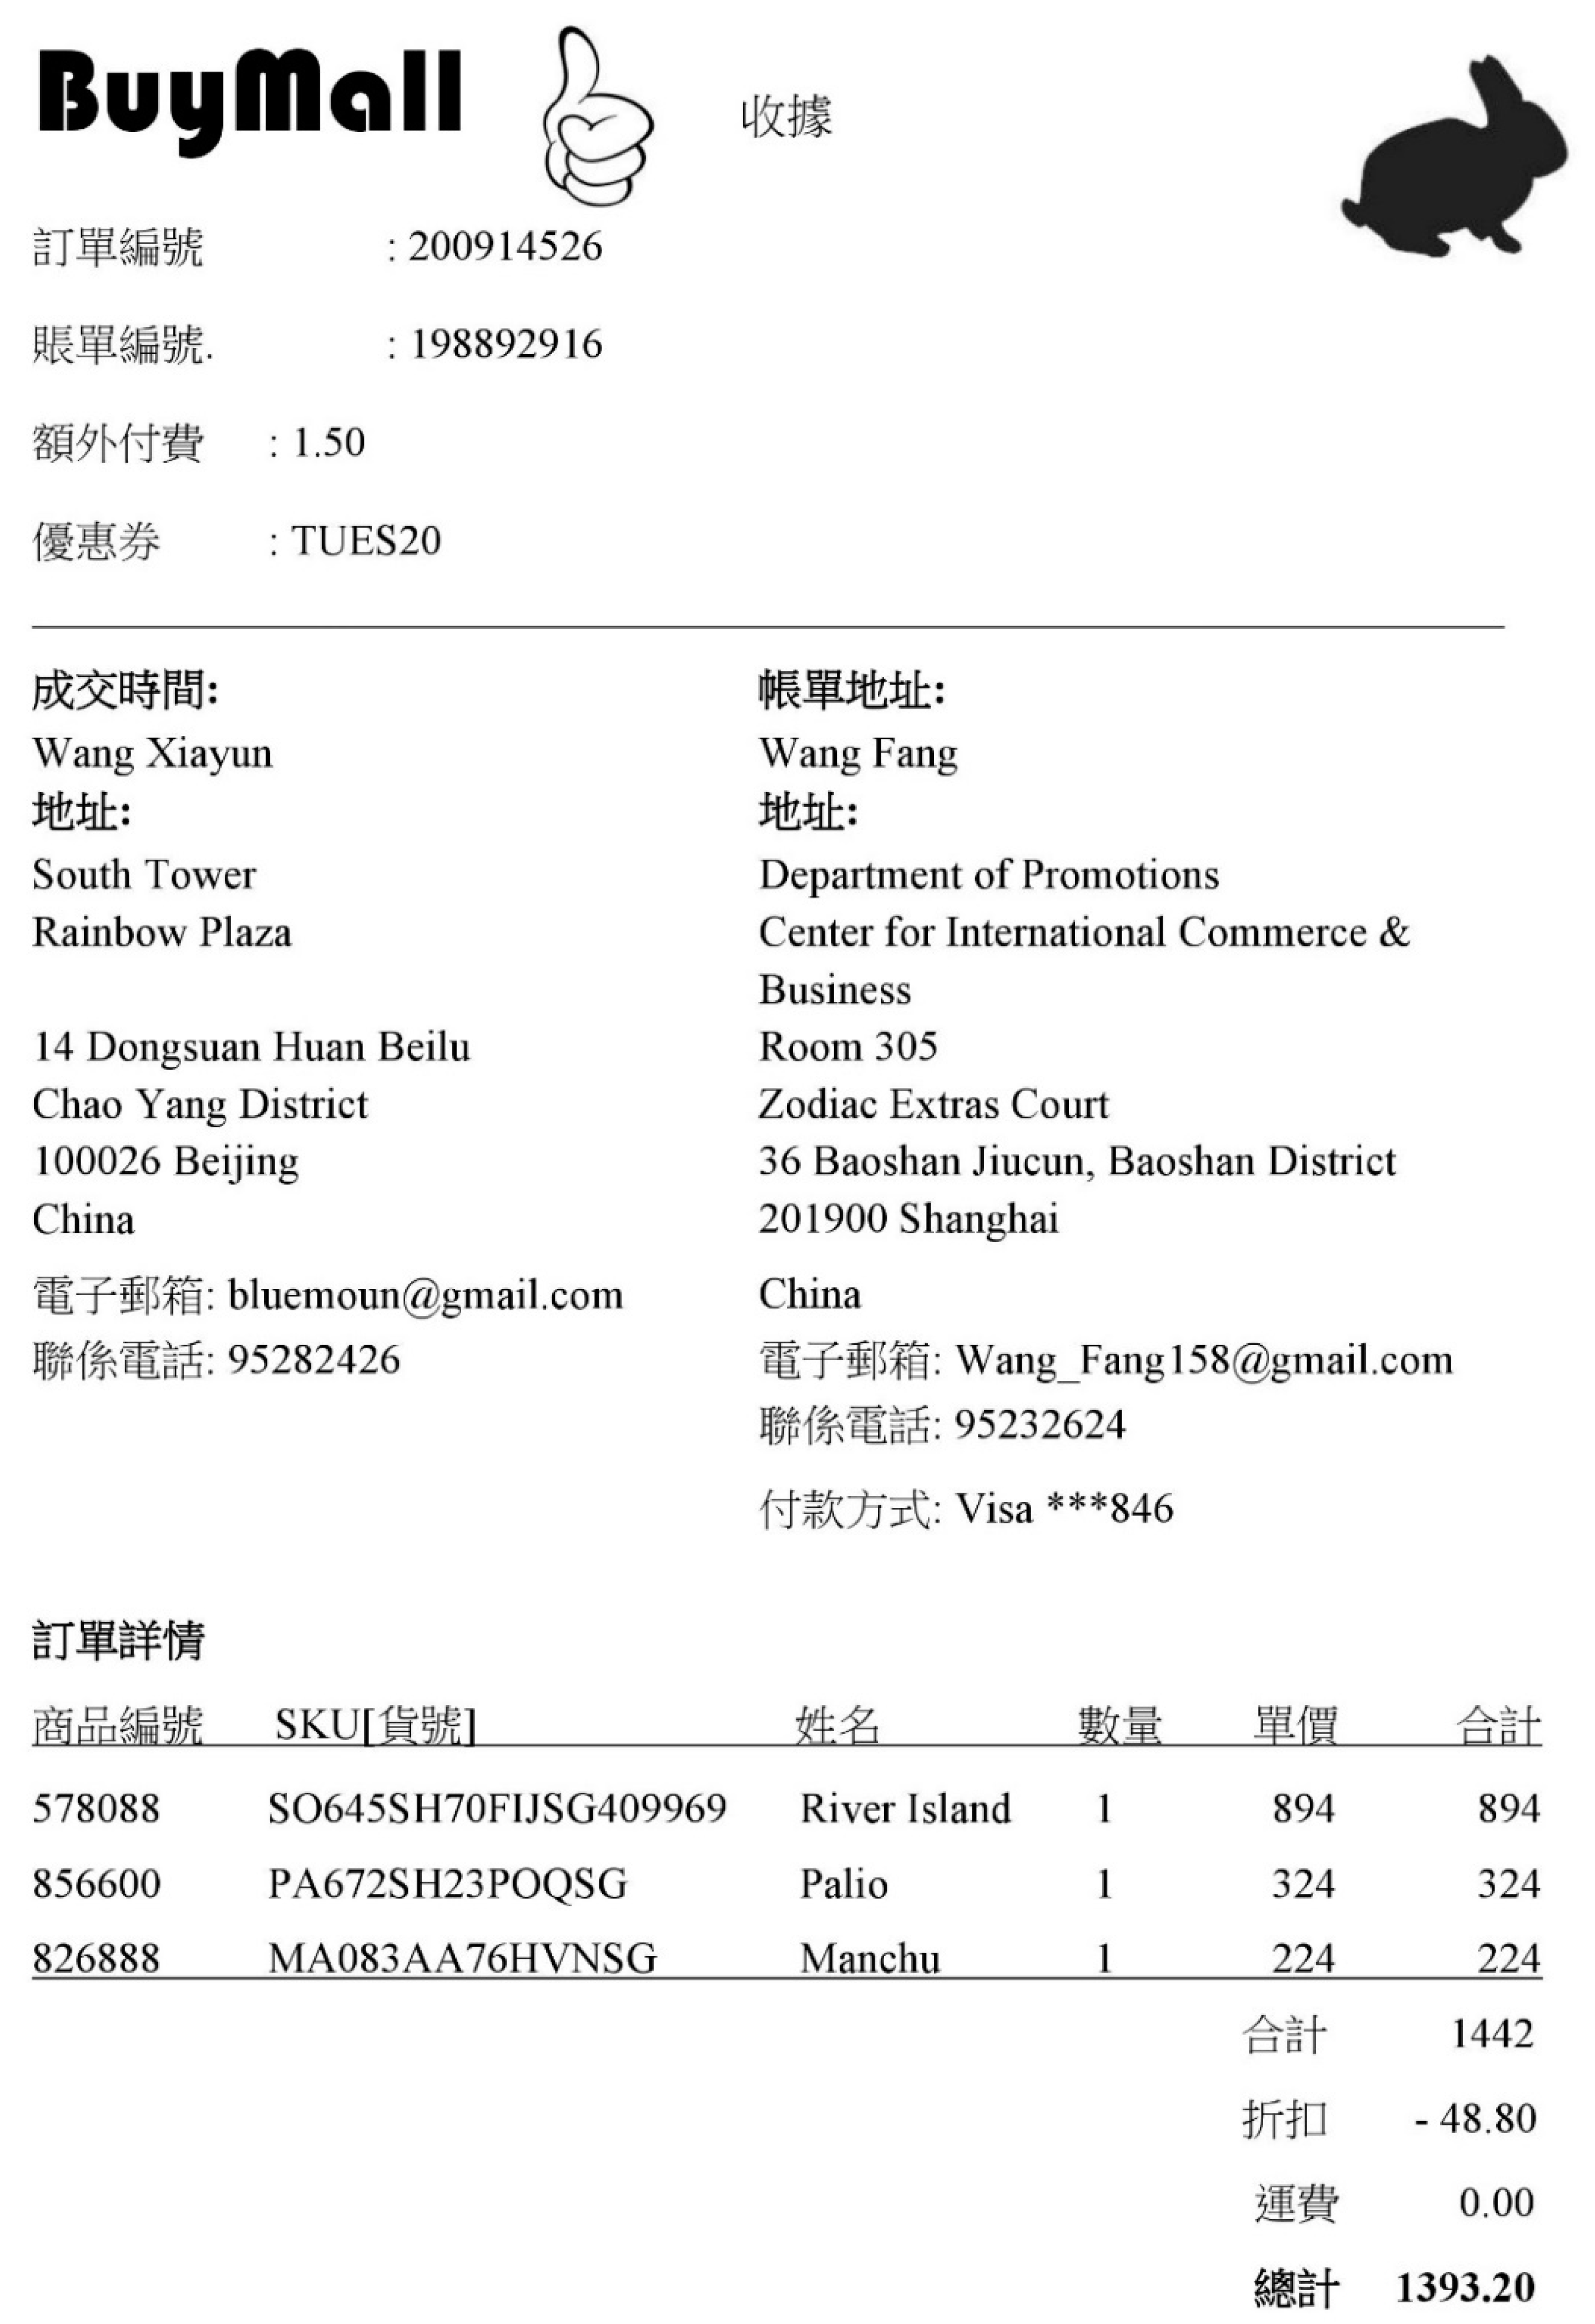
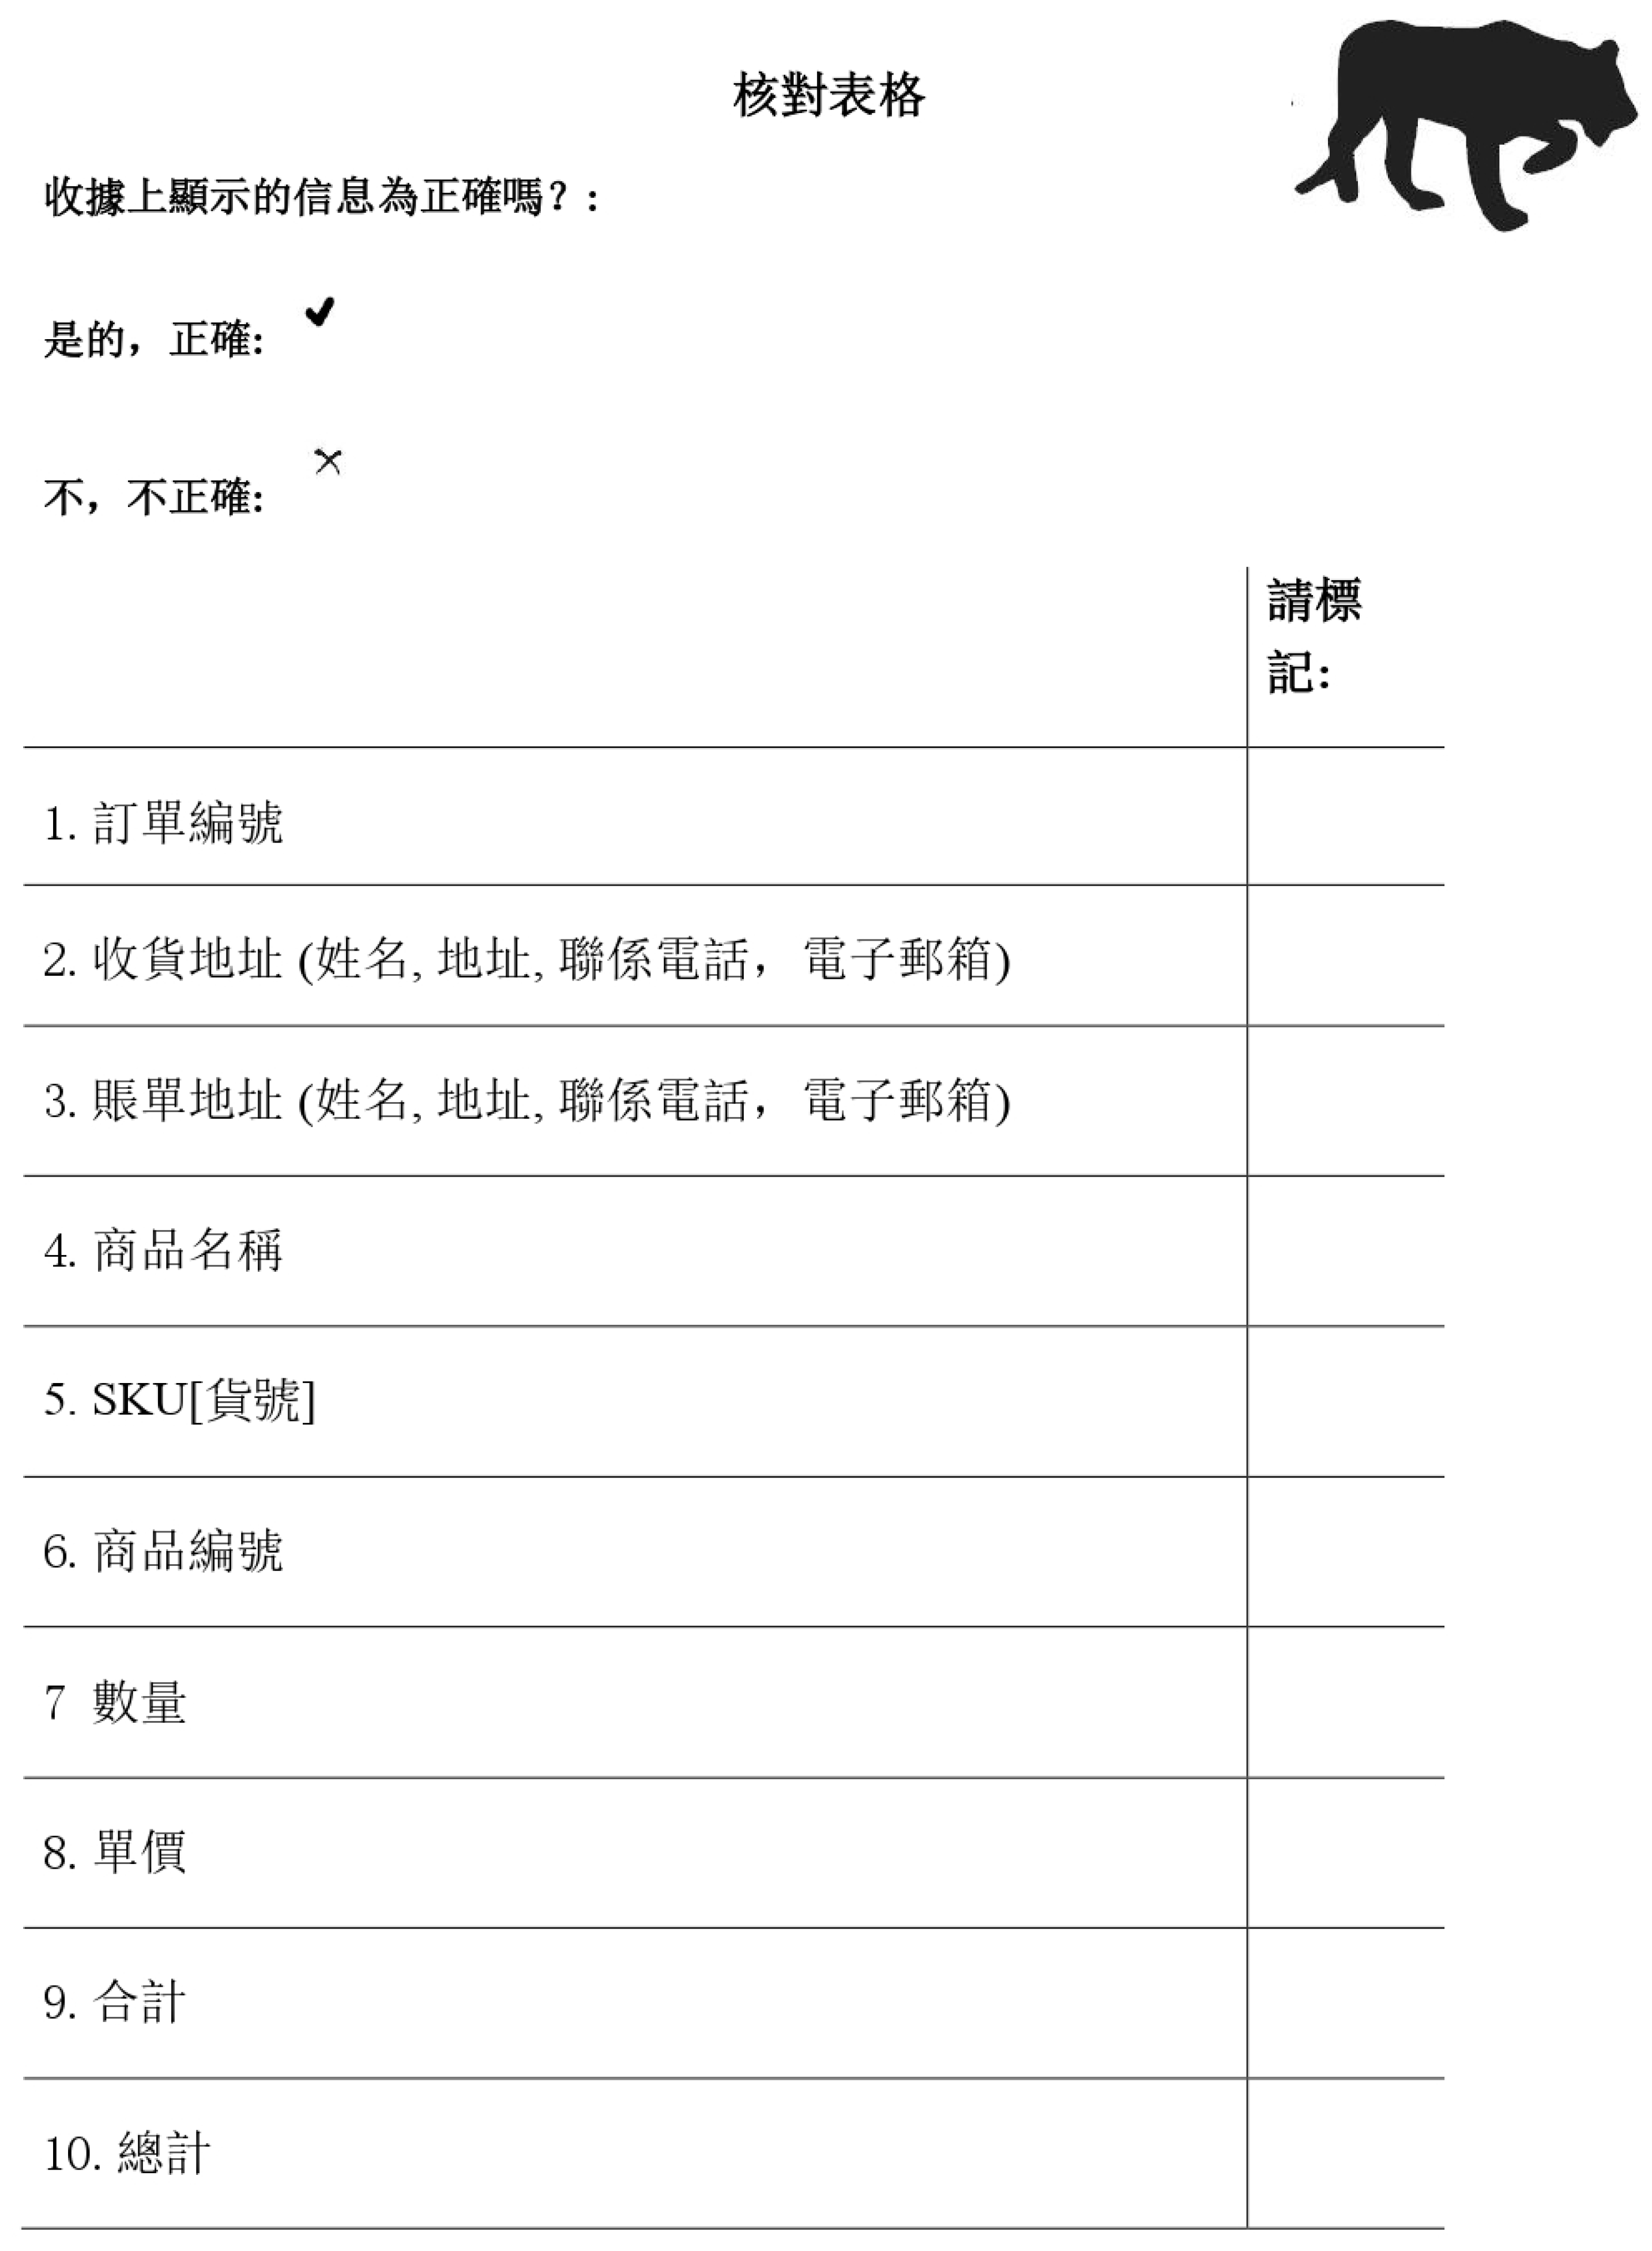
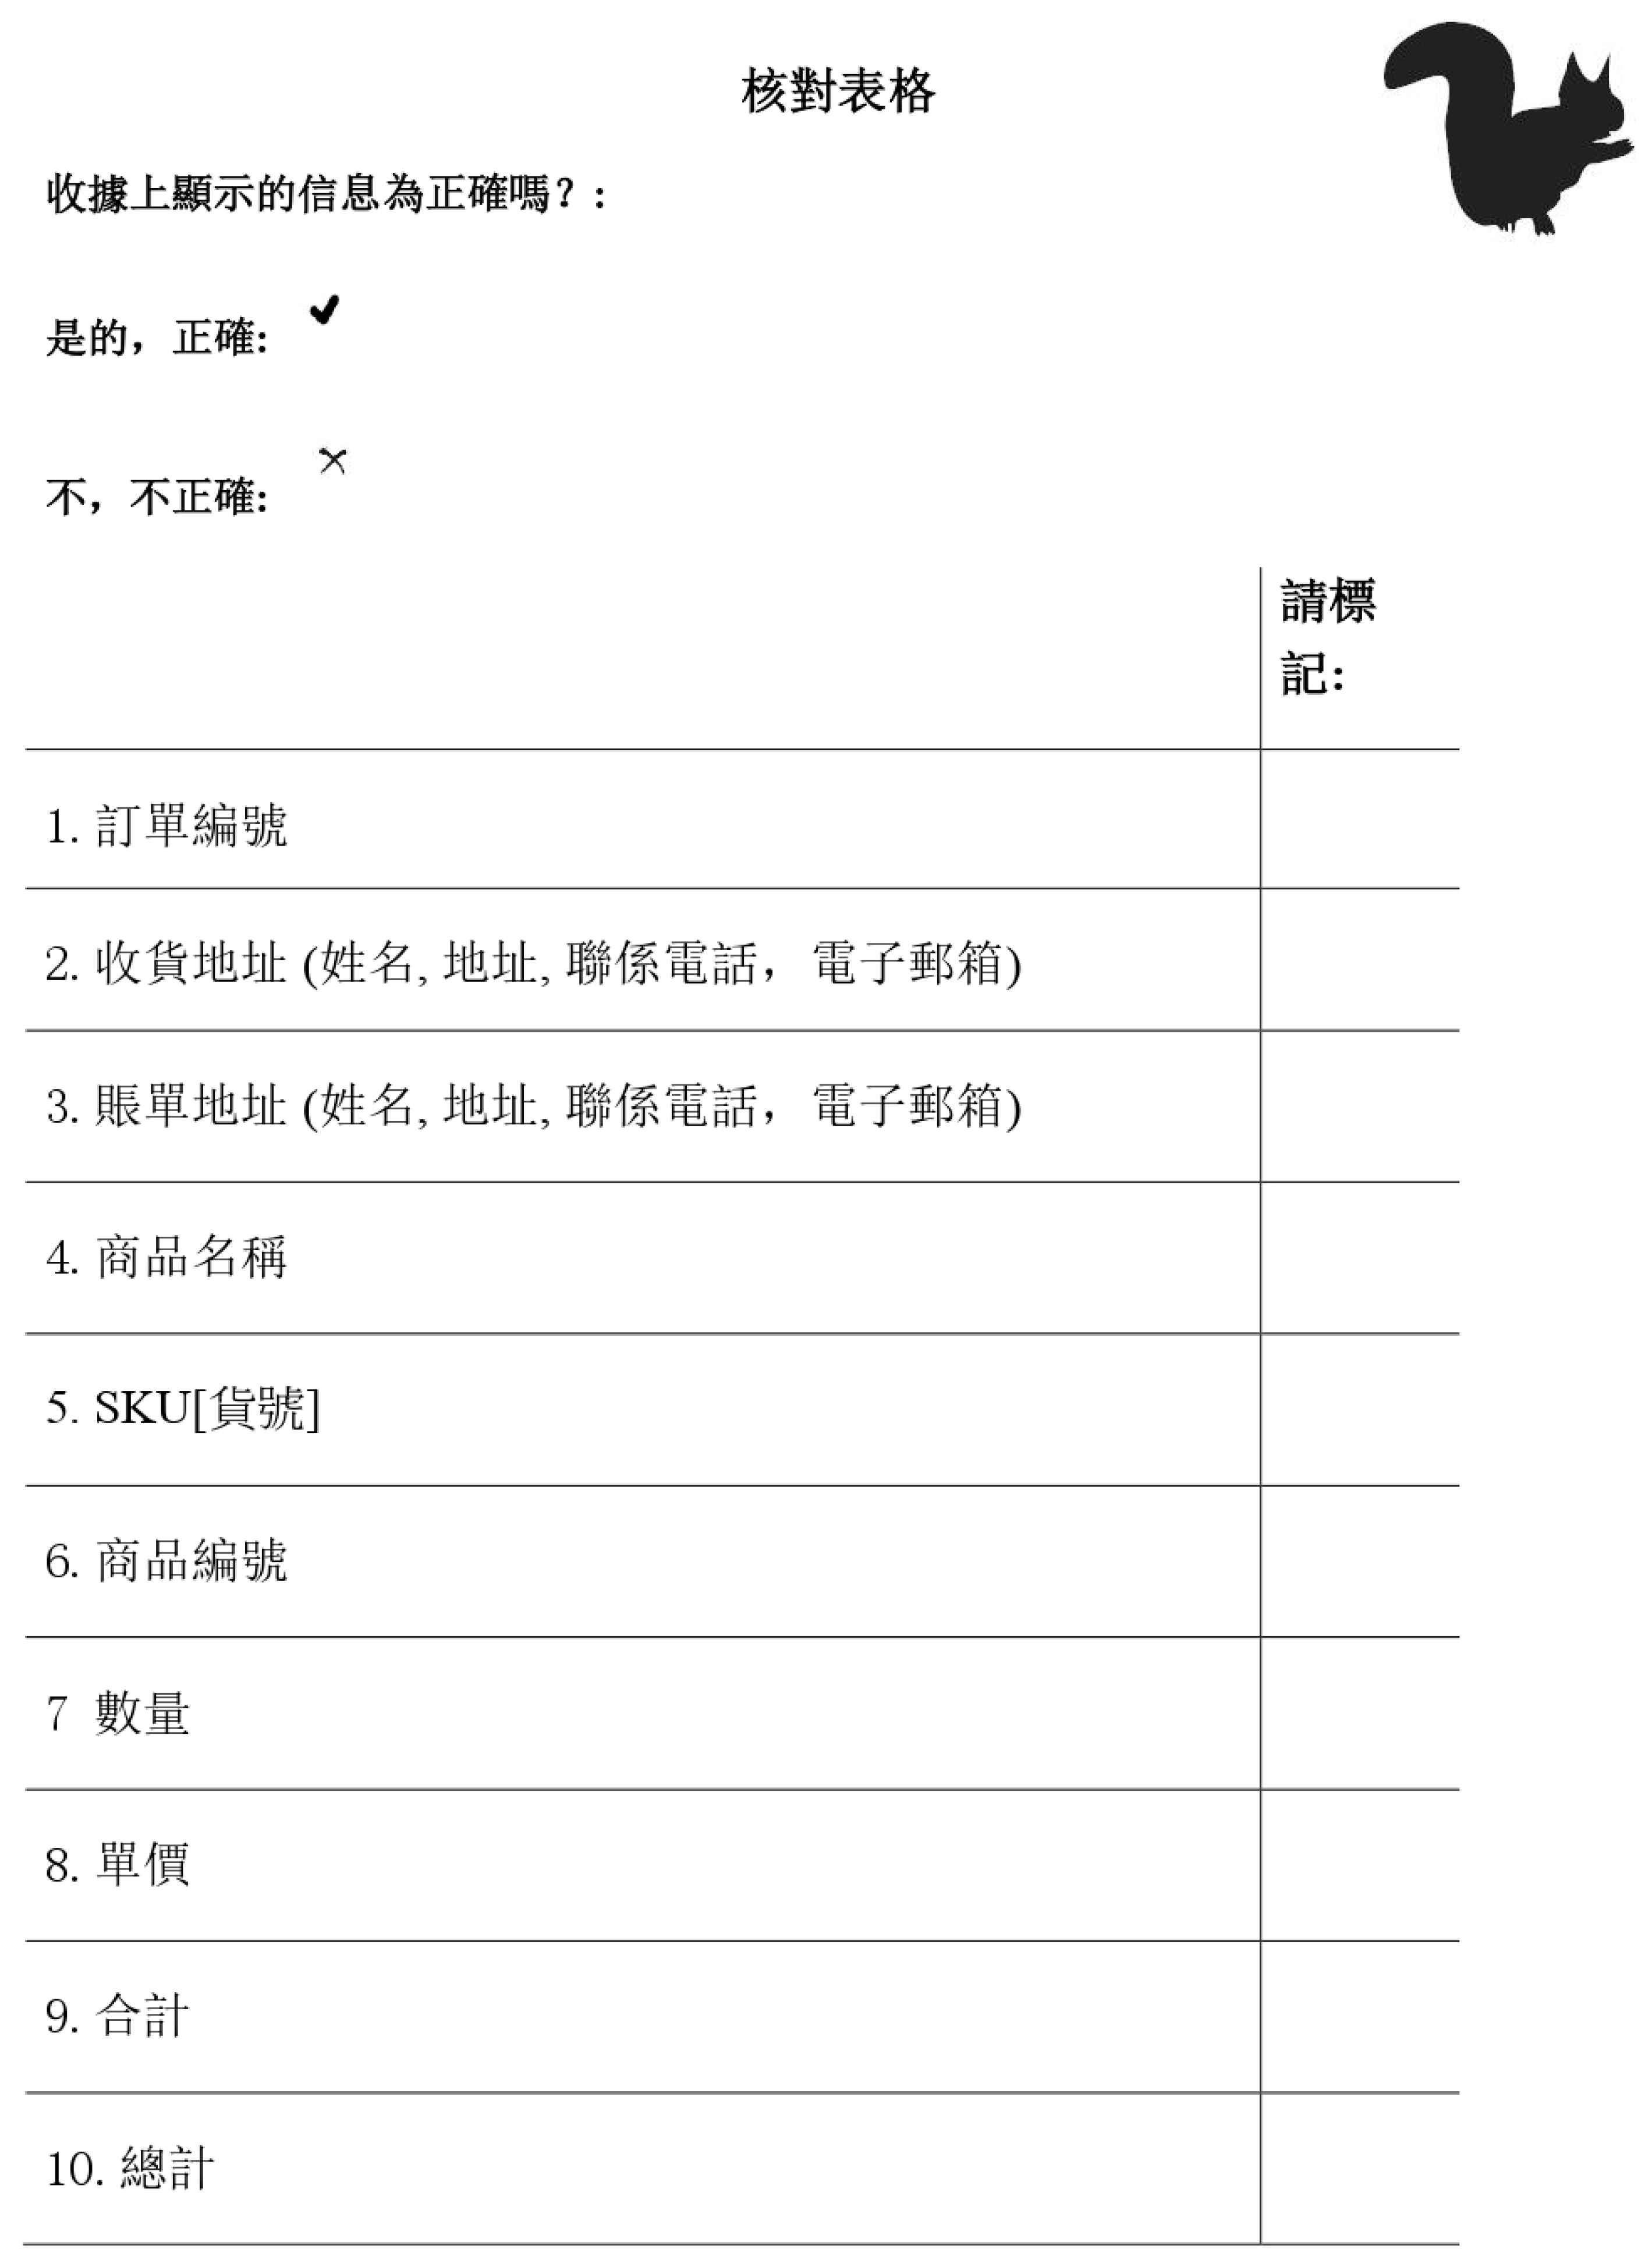
Appendix A
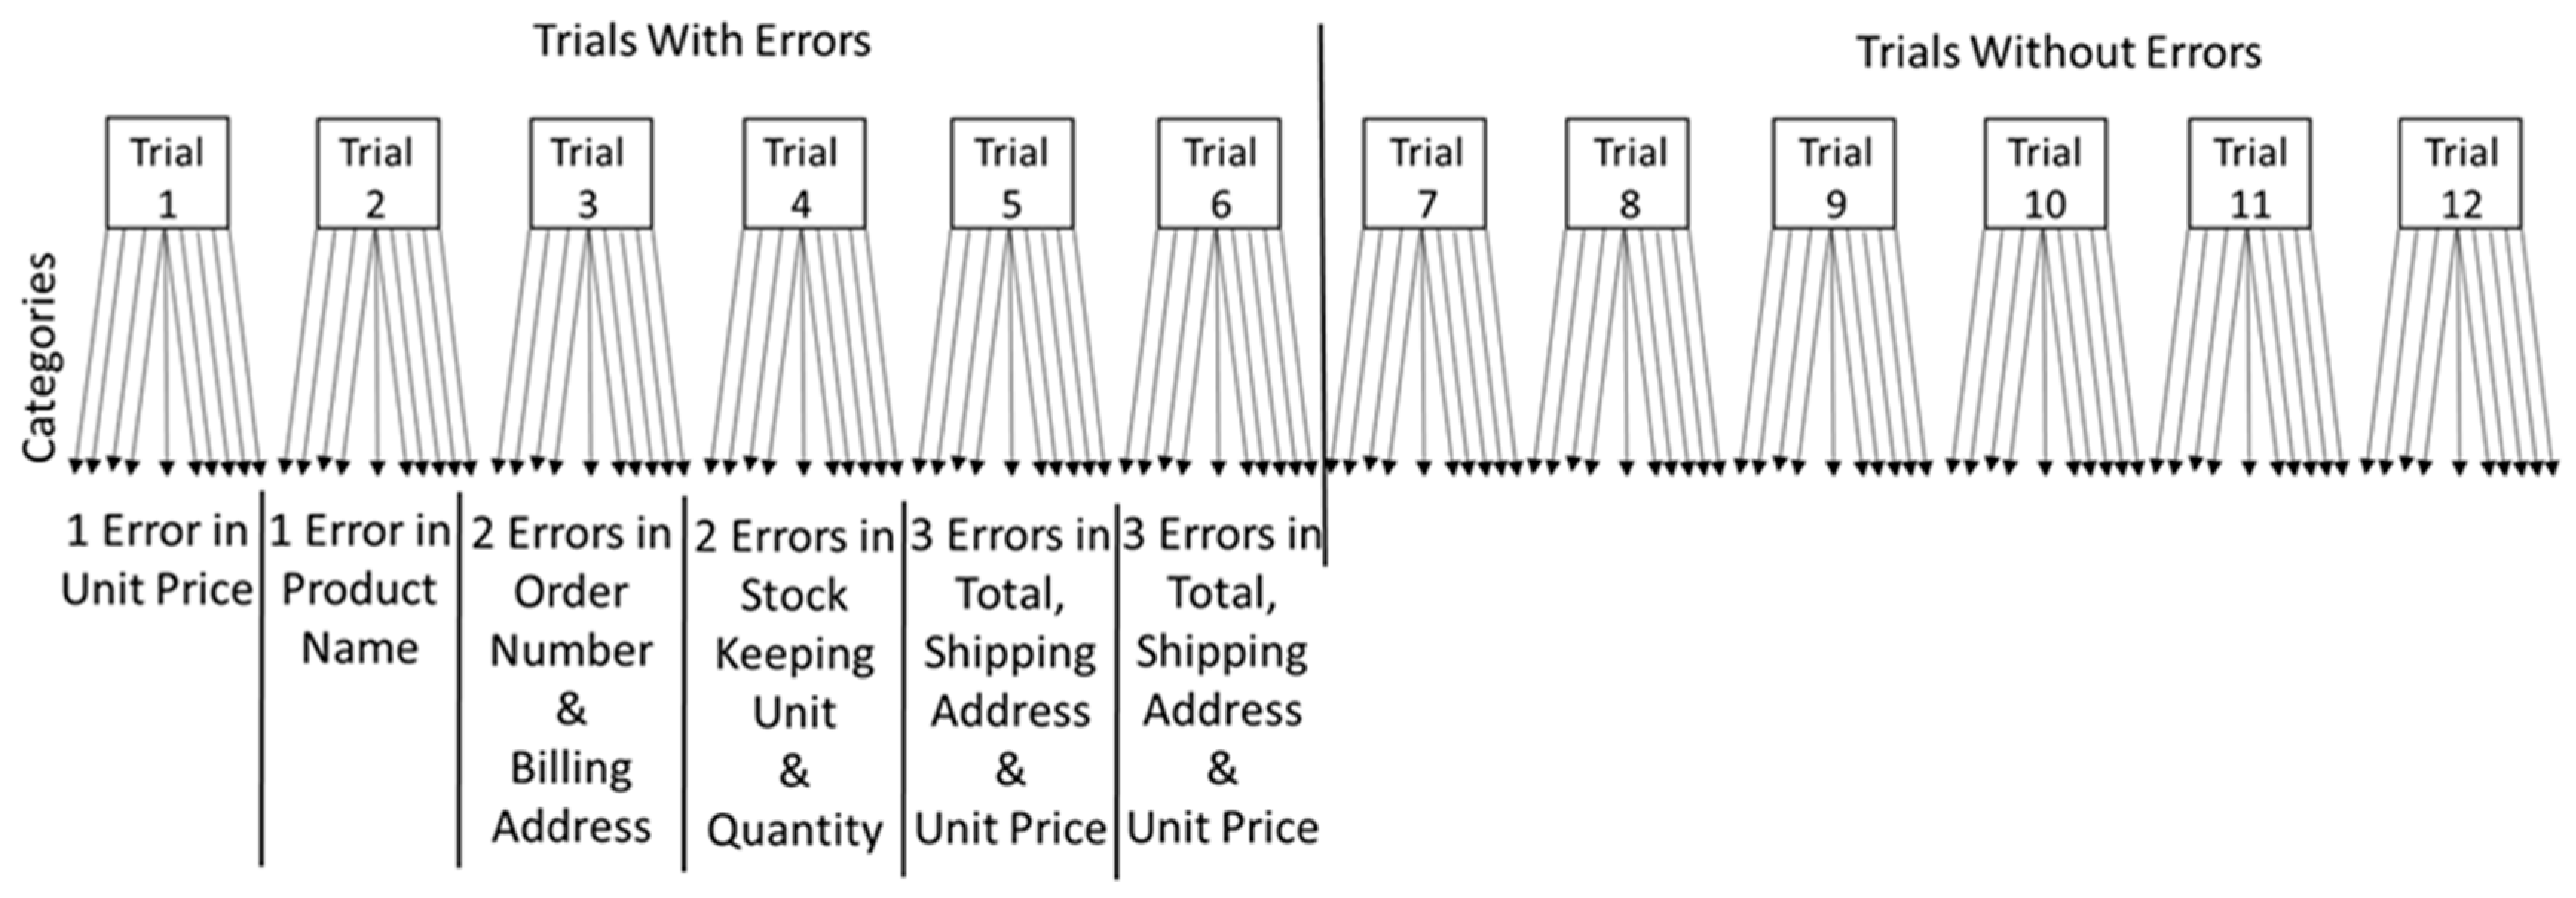
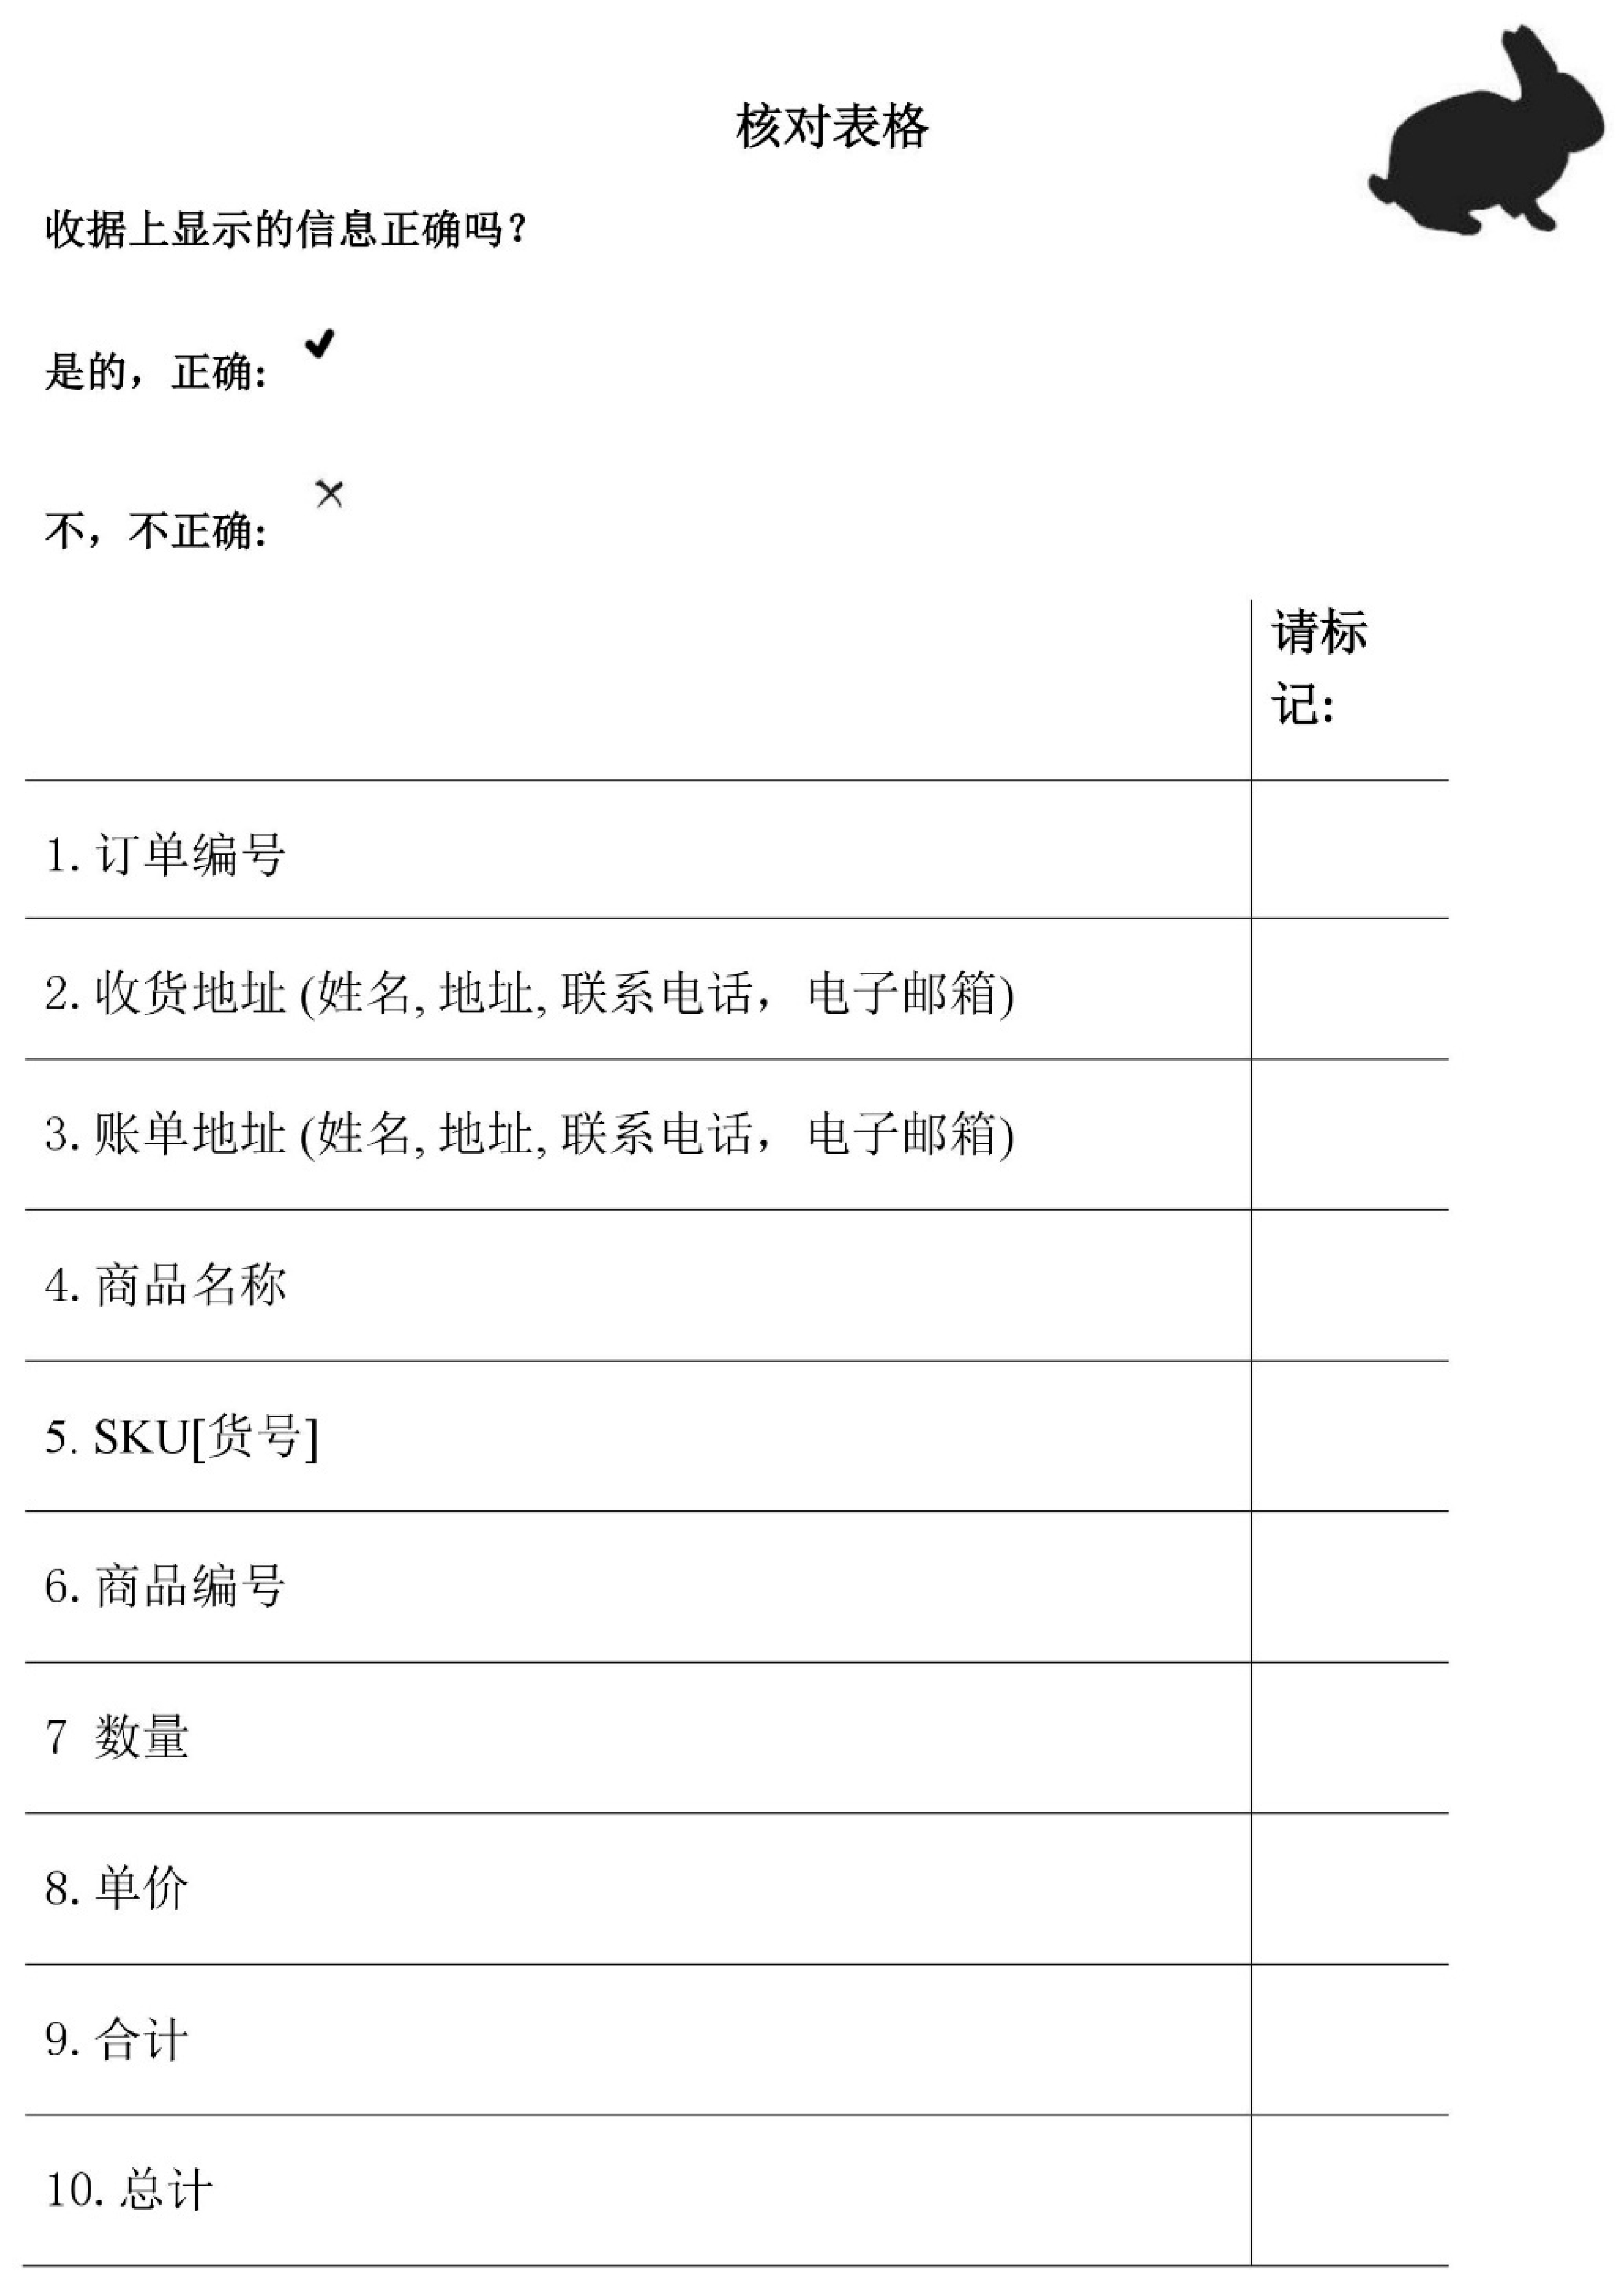
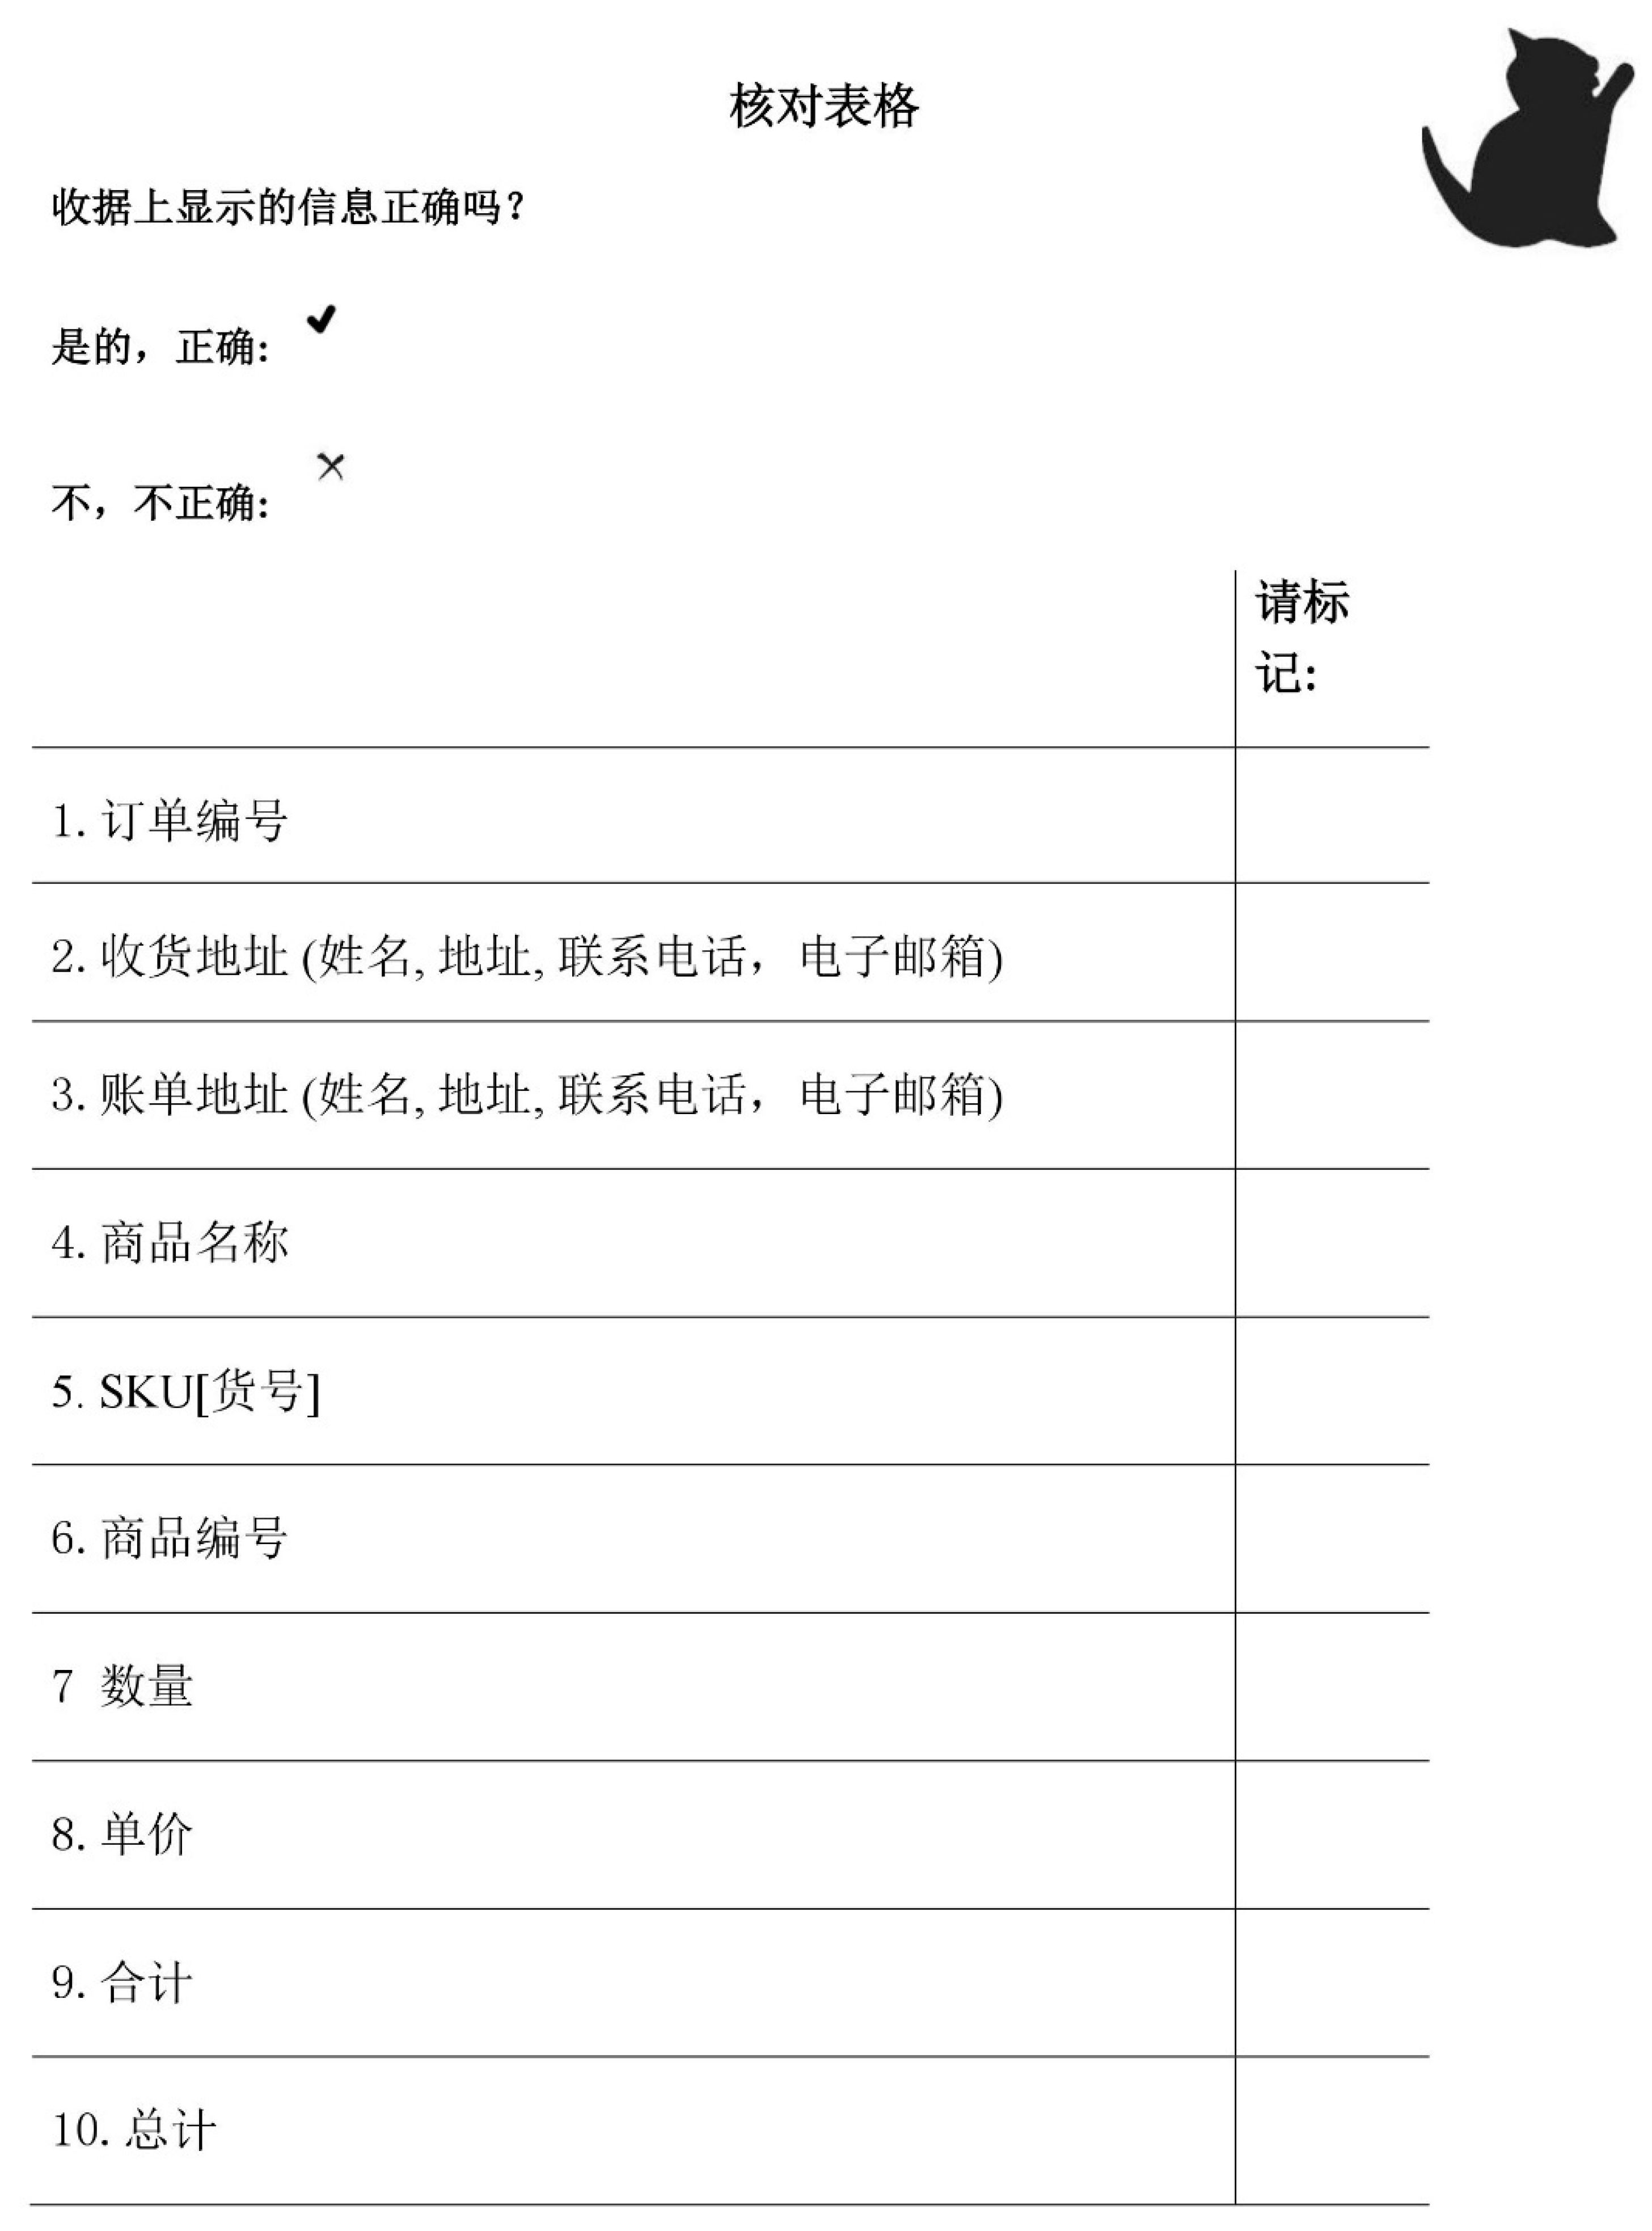
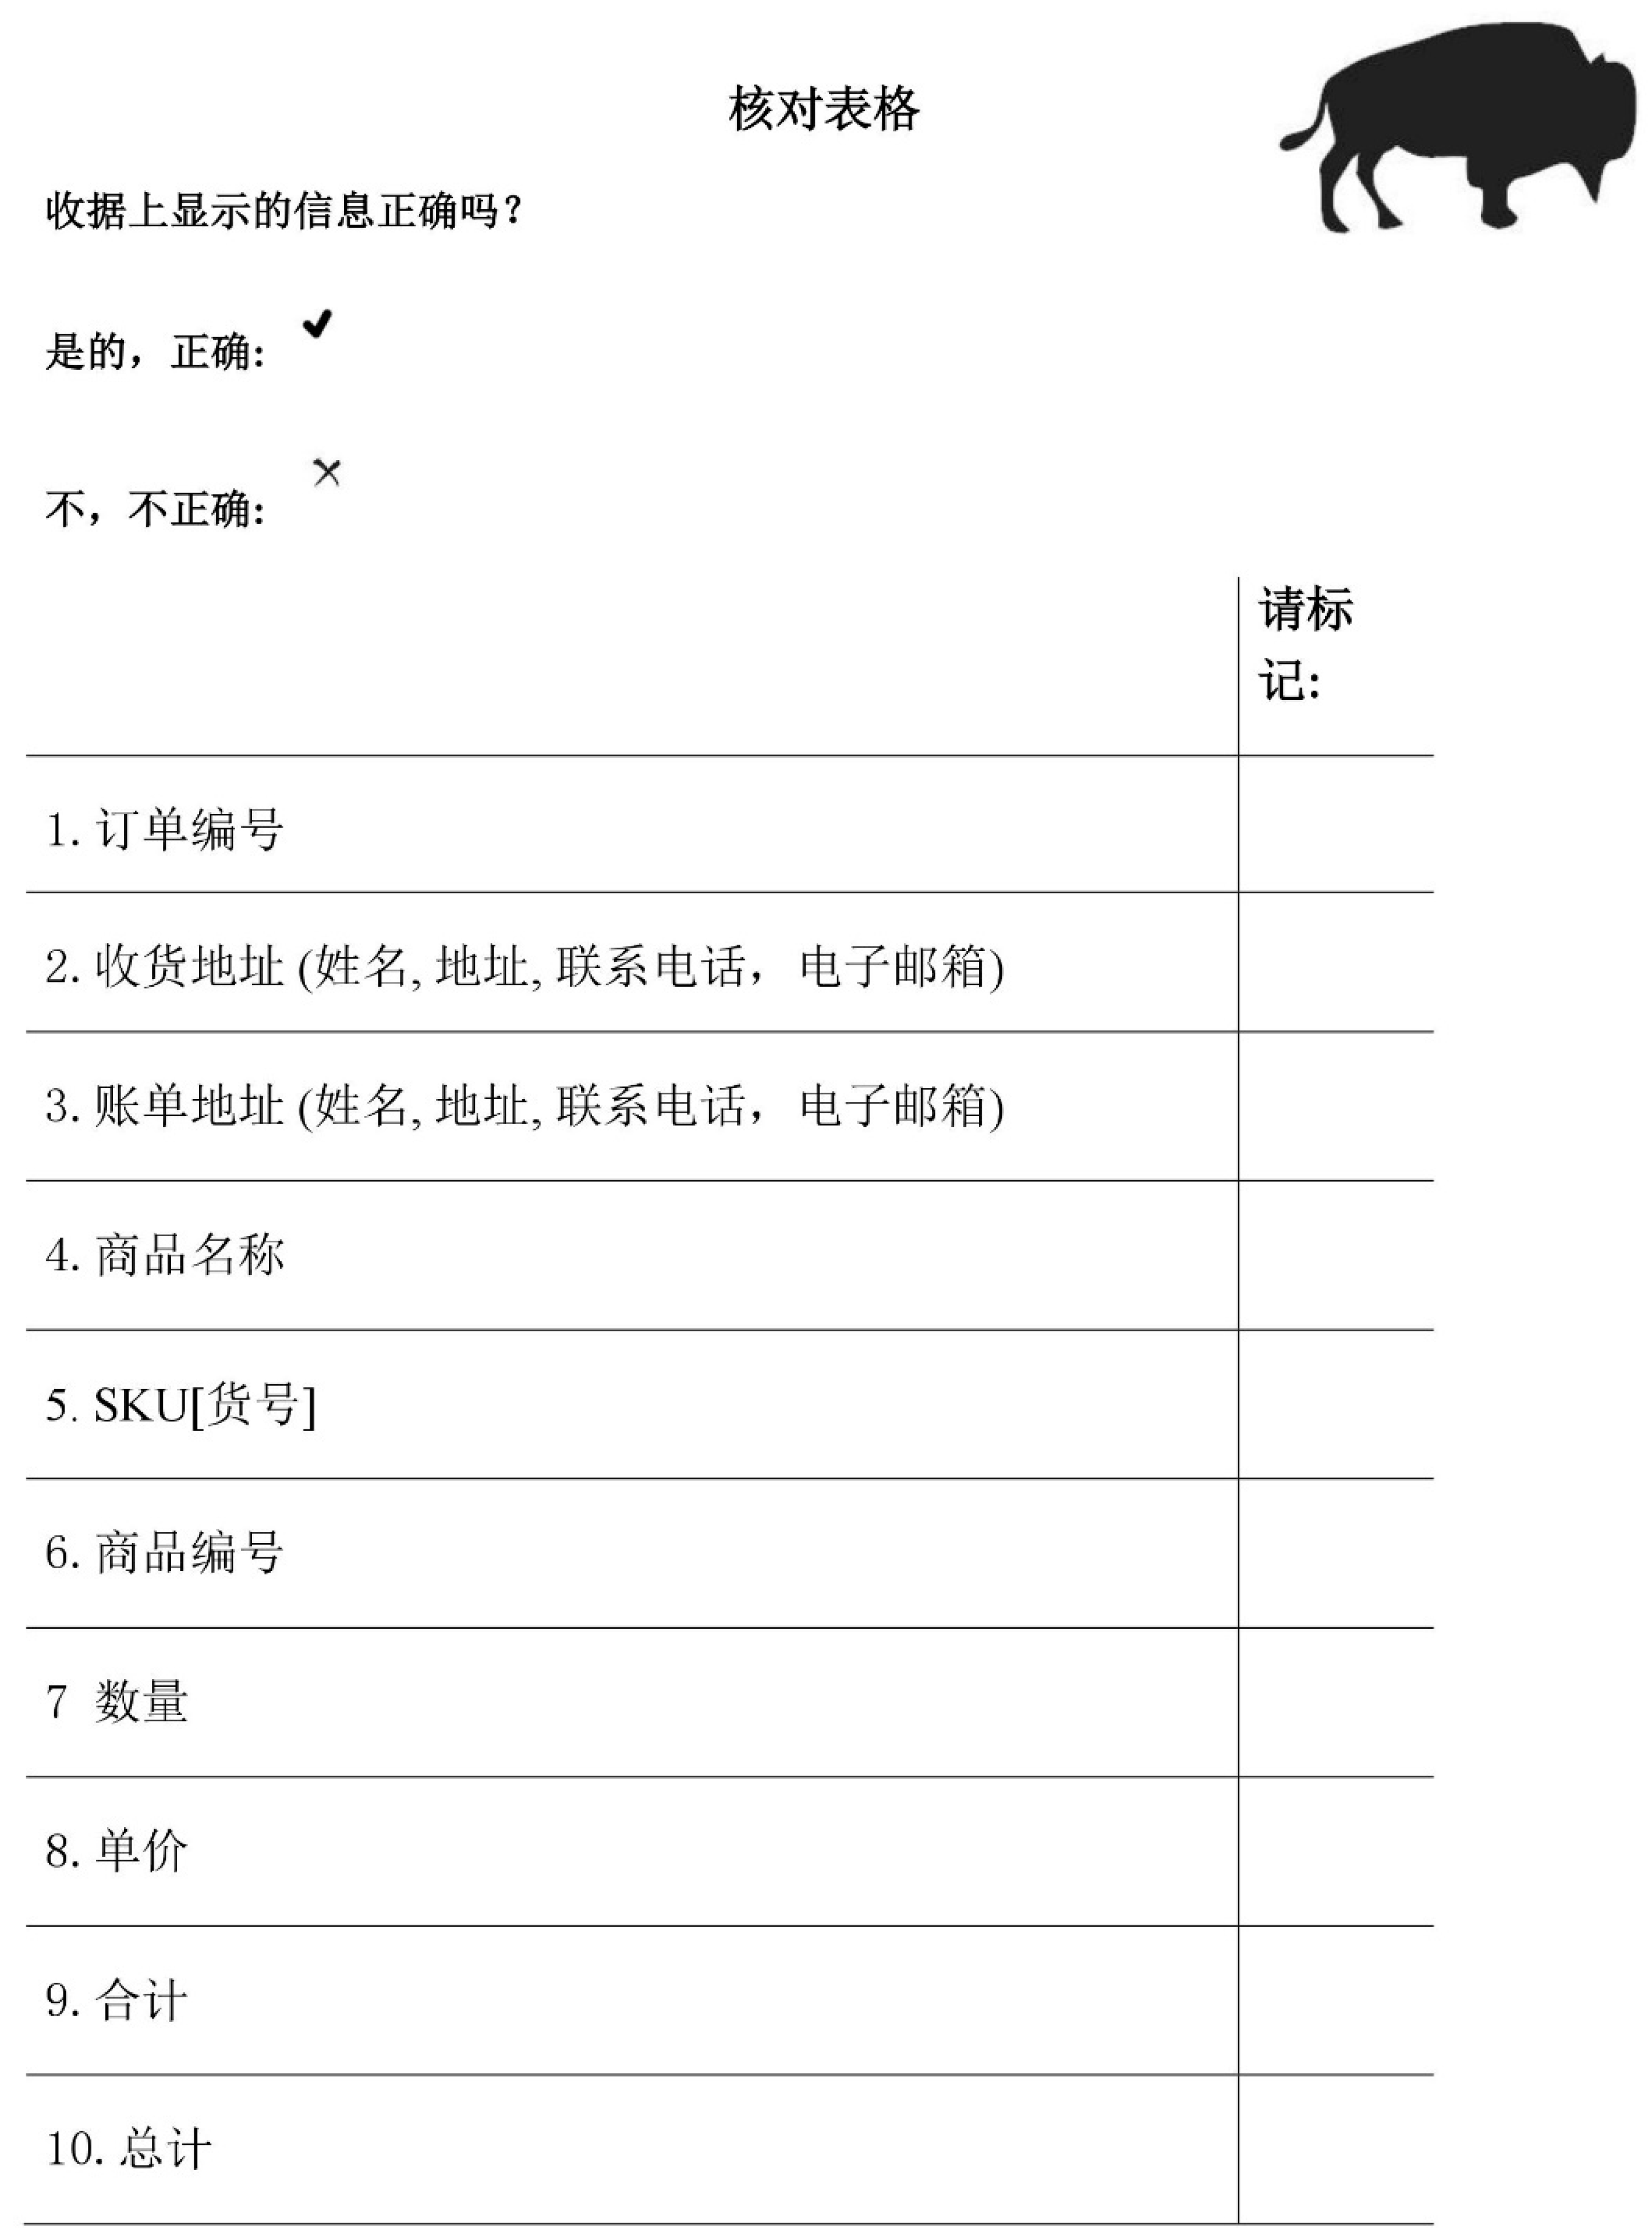
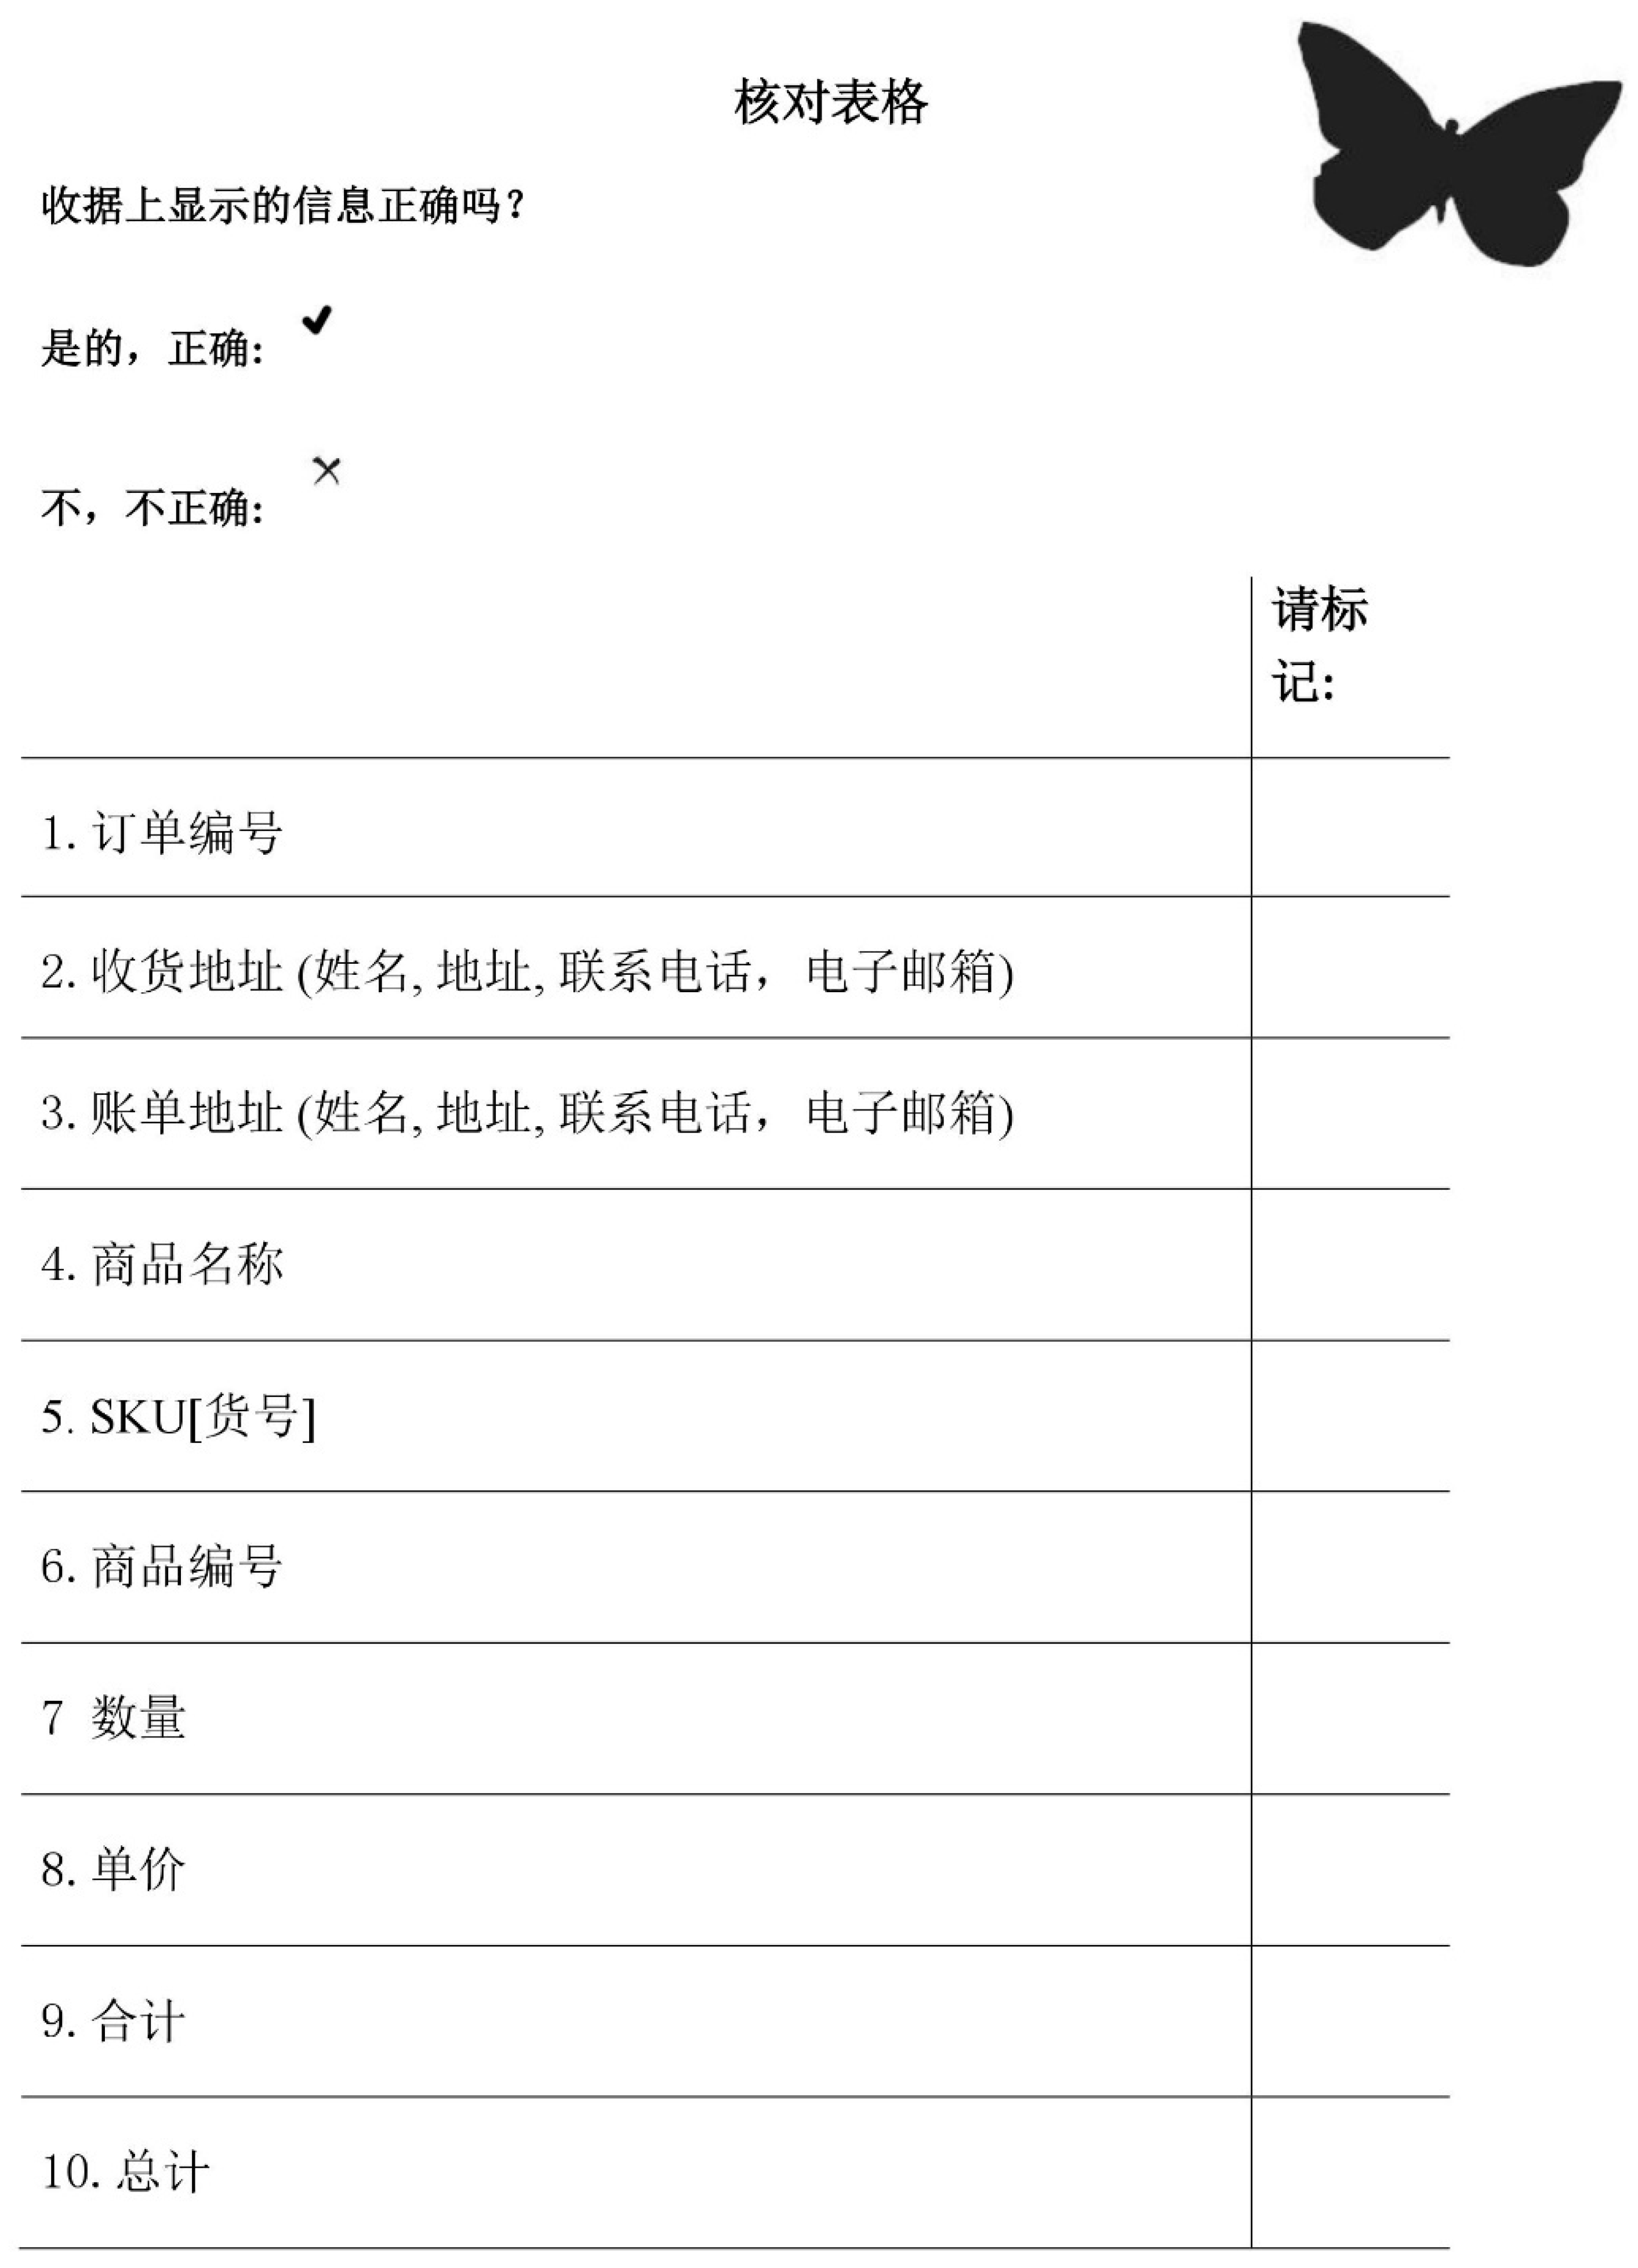
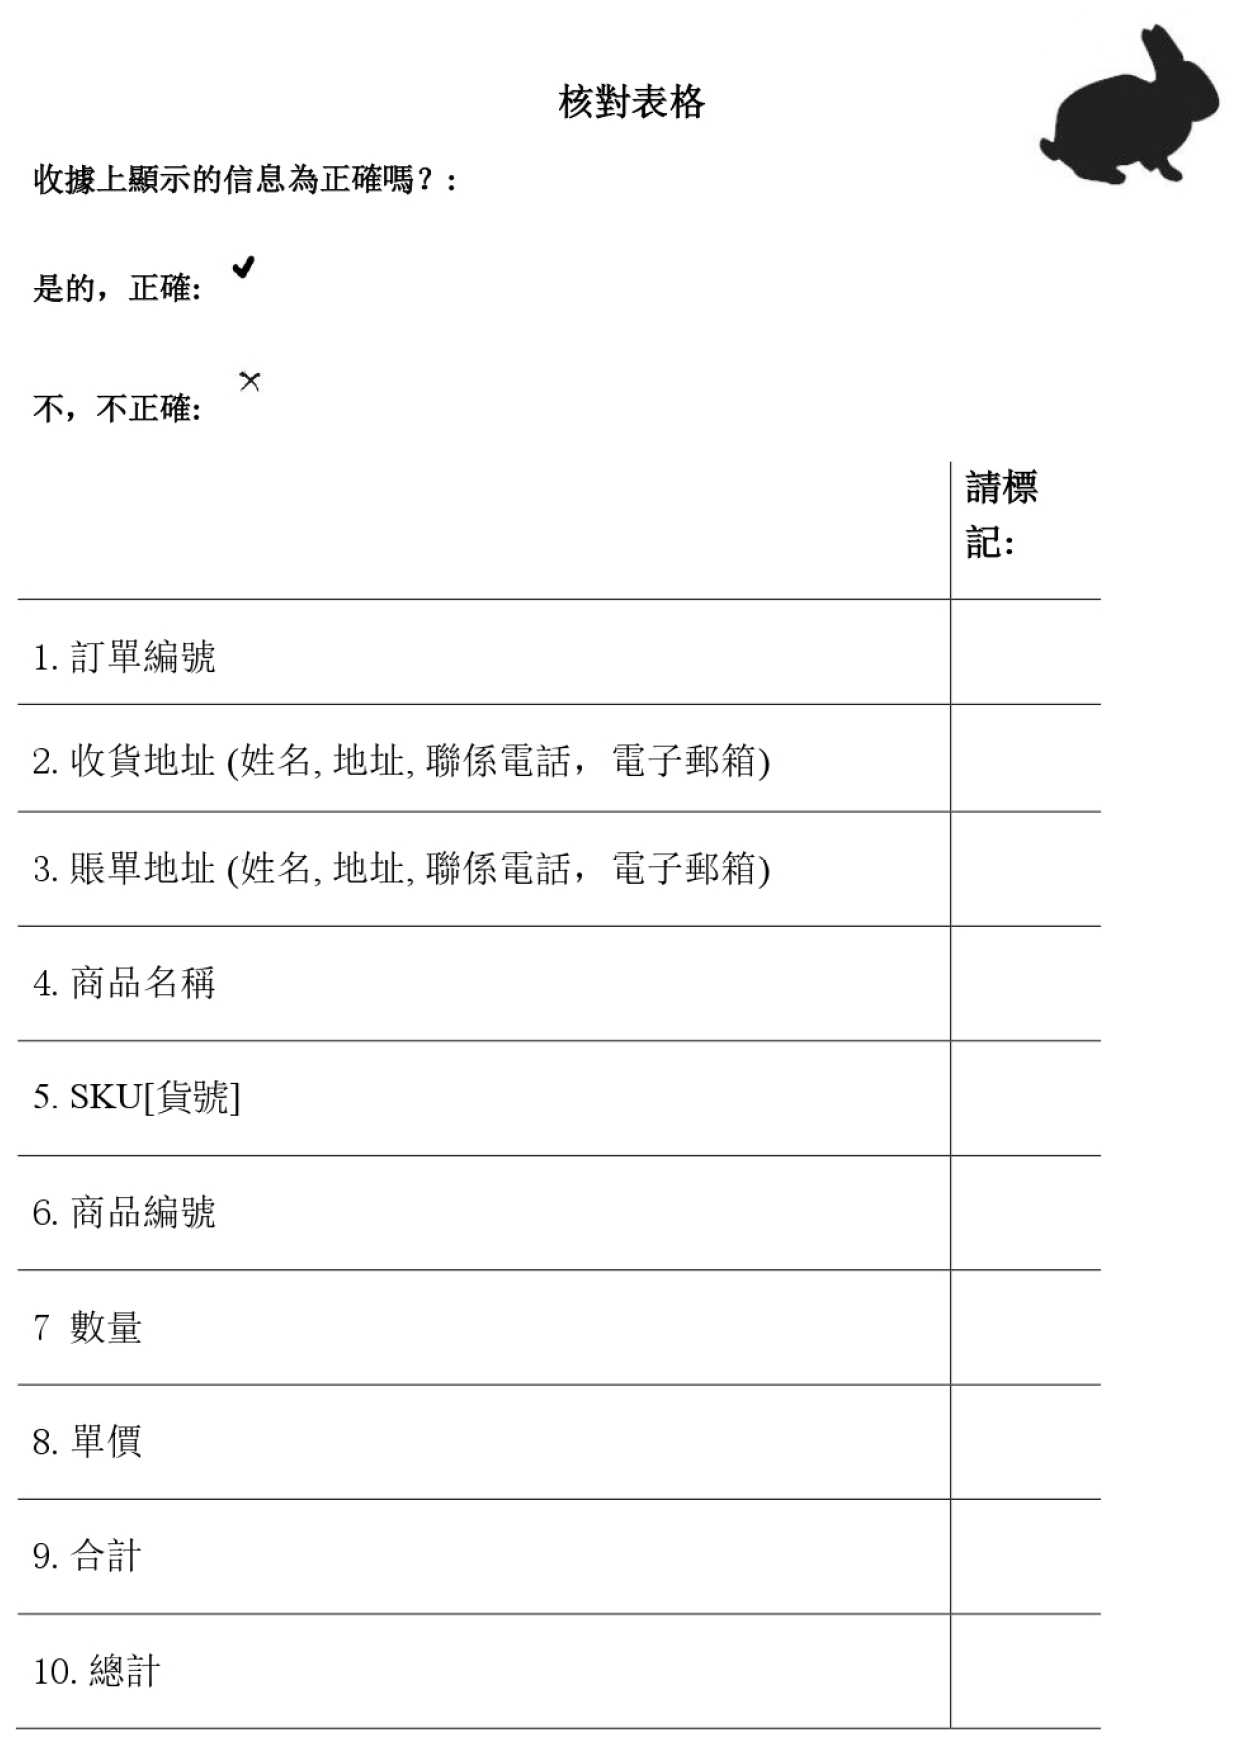
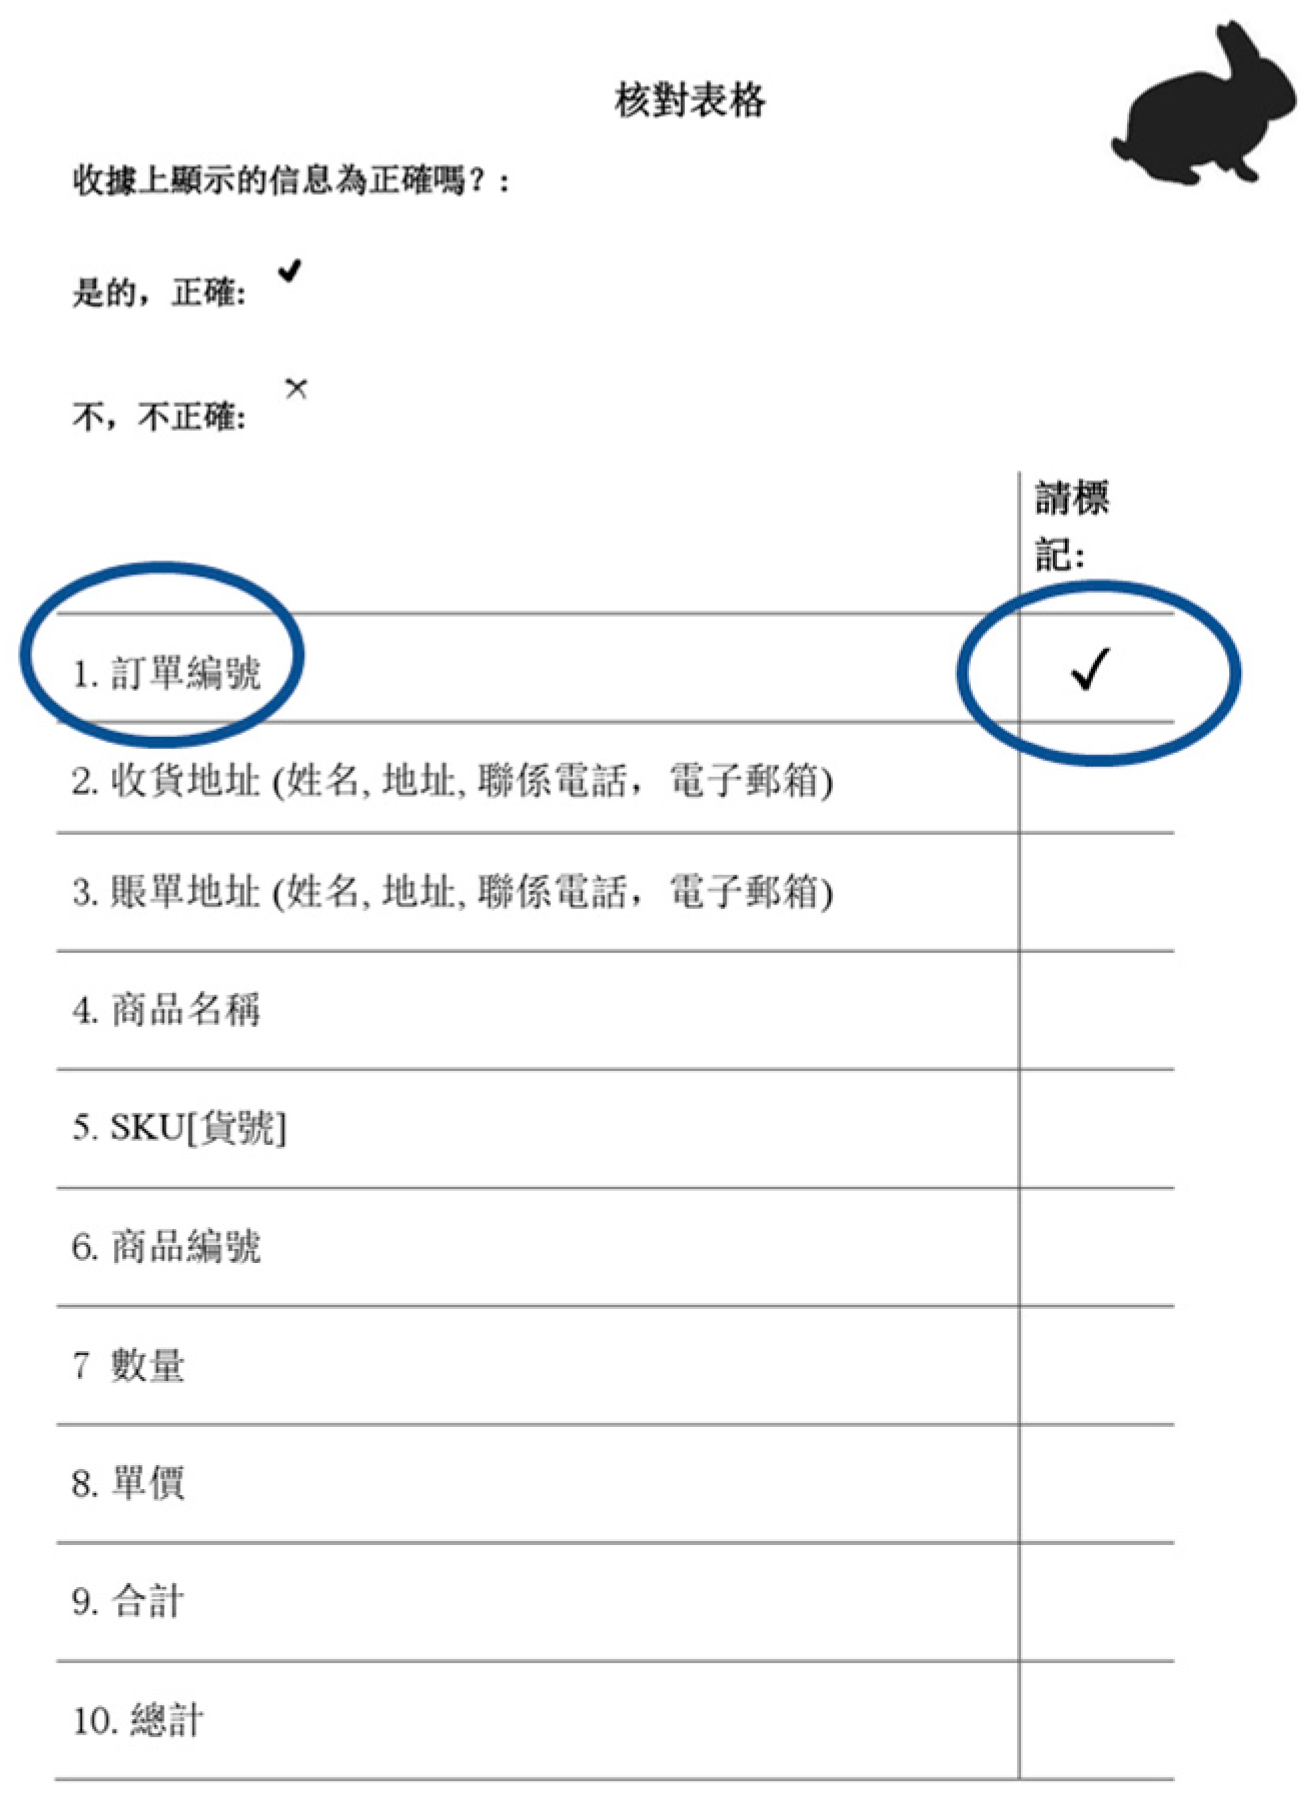
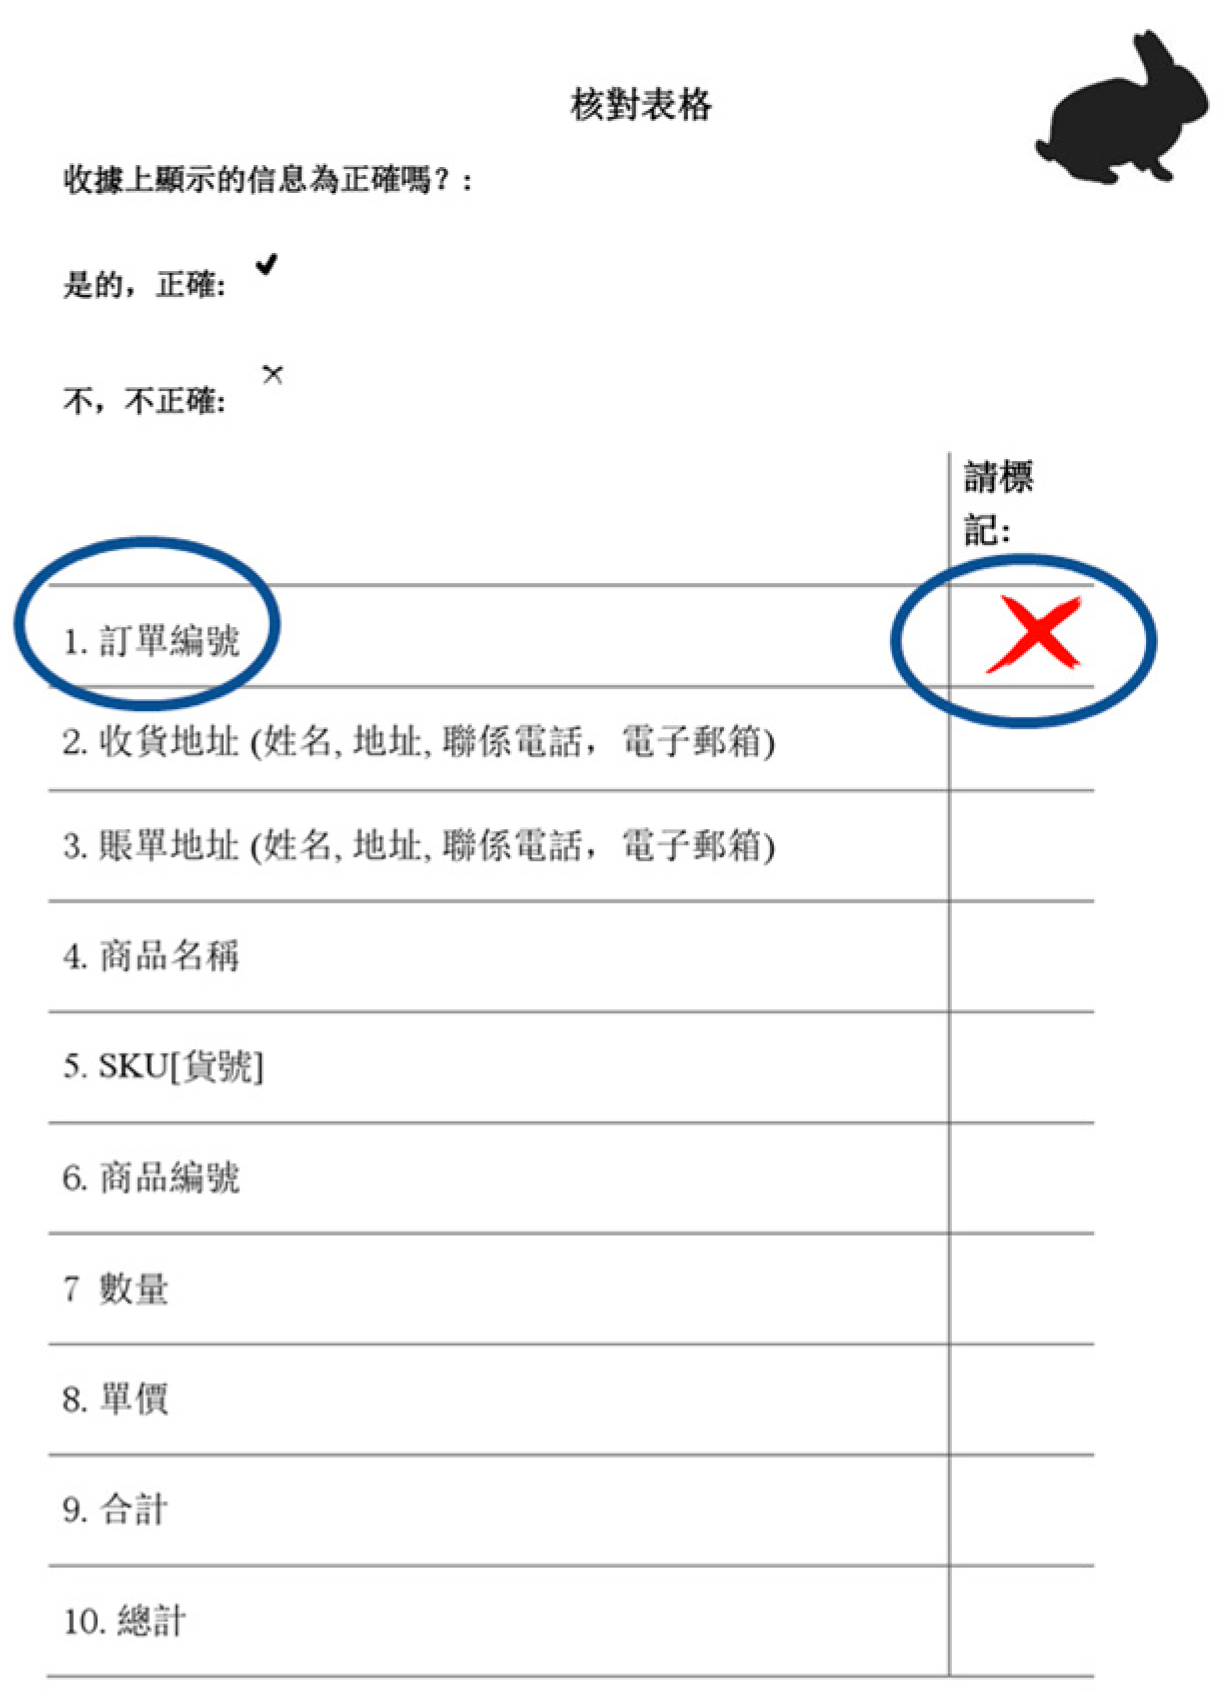
Error Detection Task


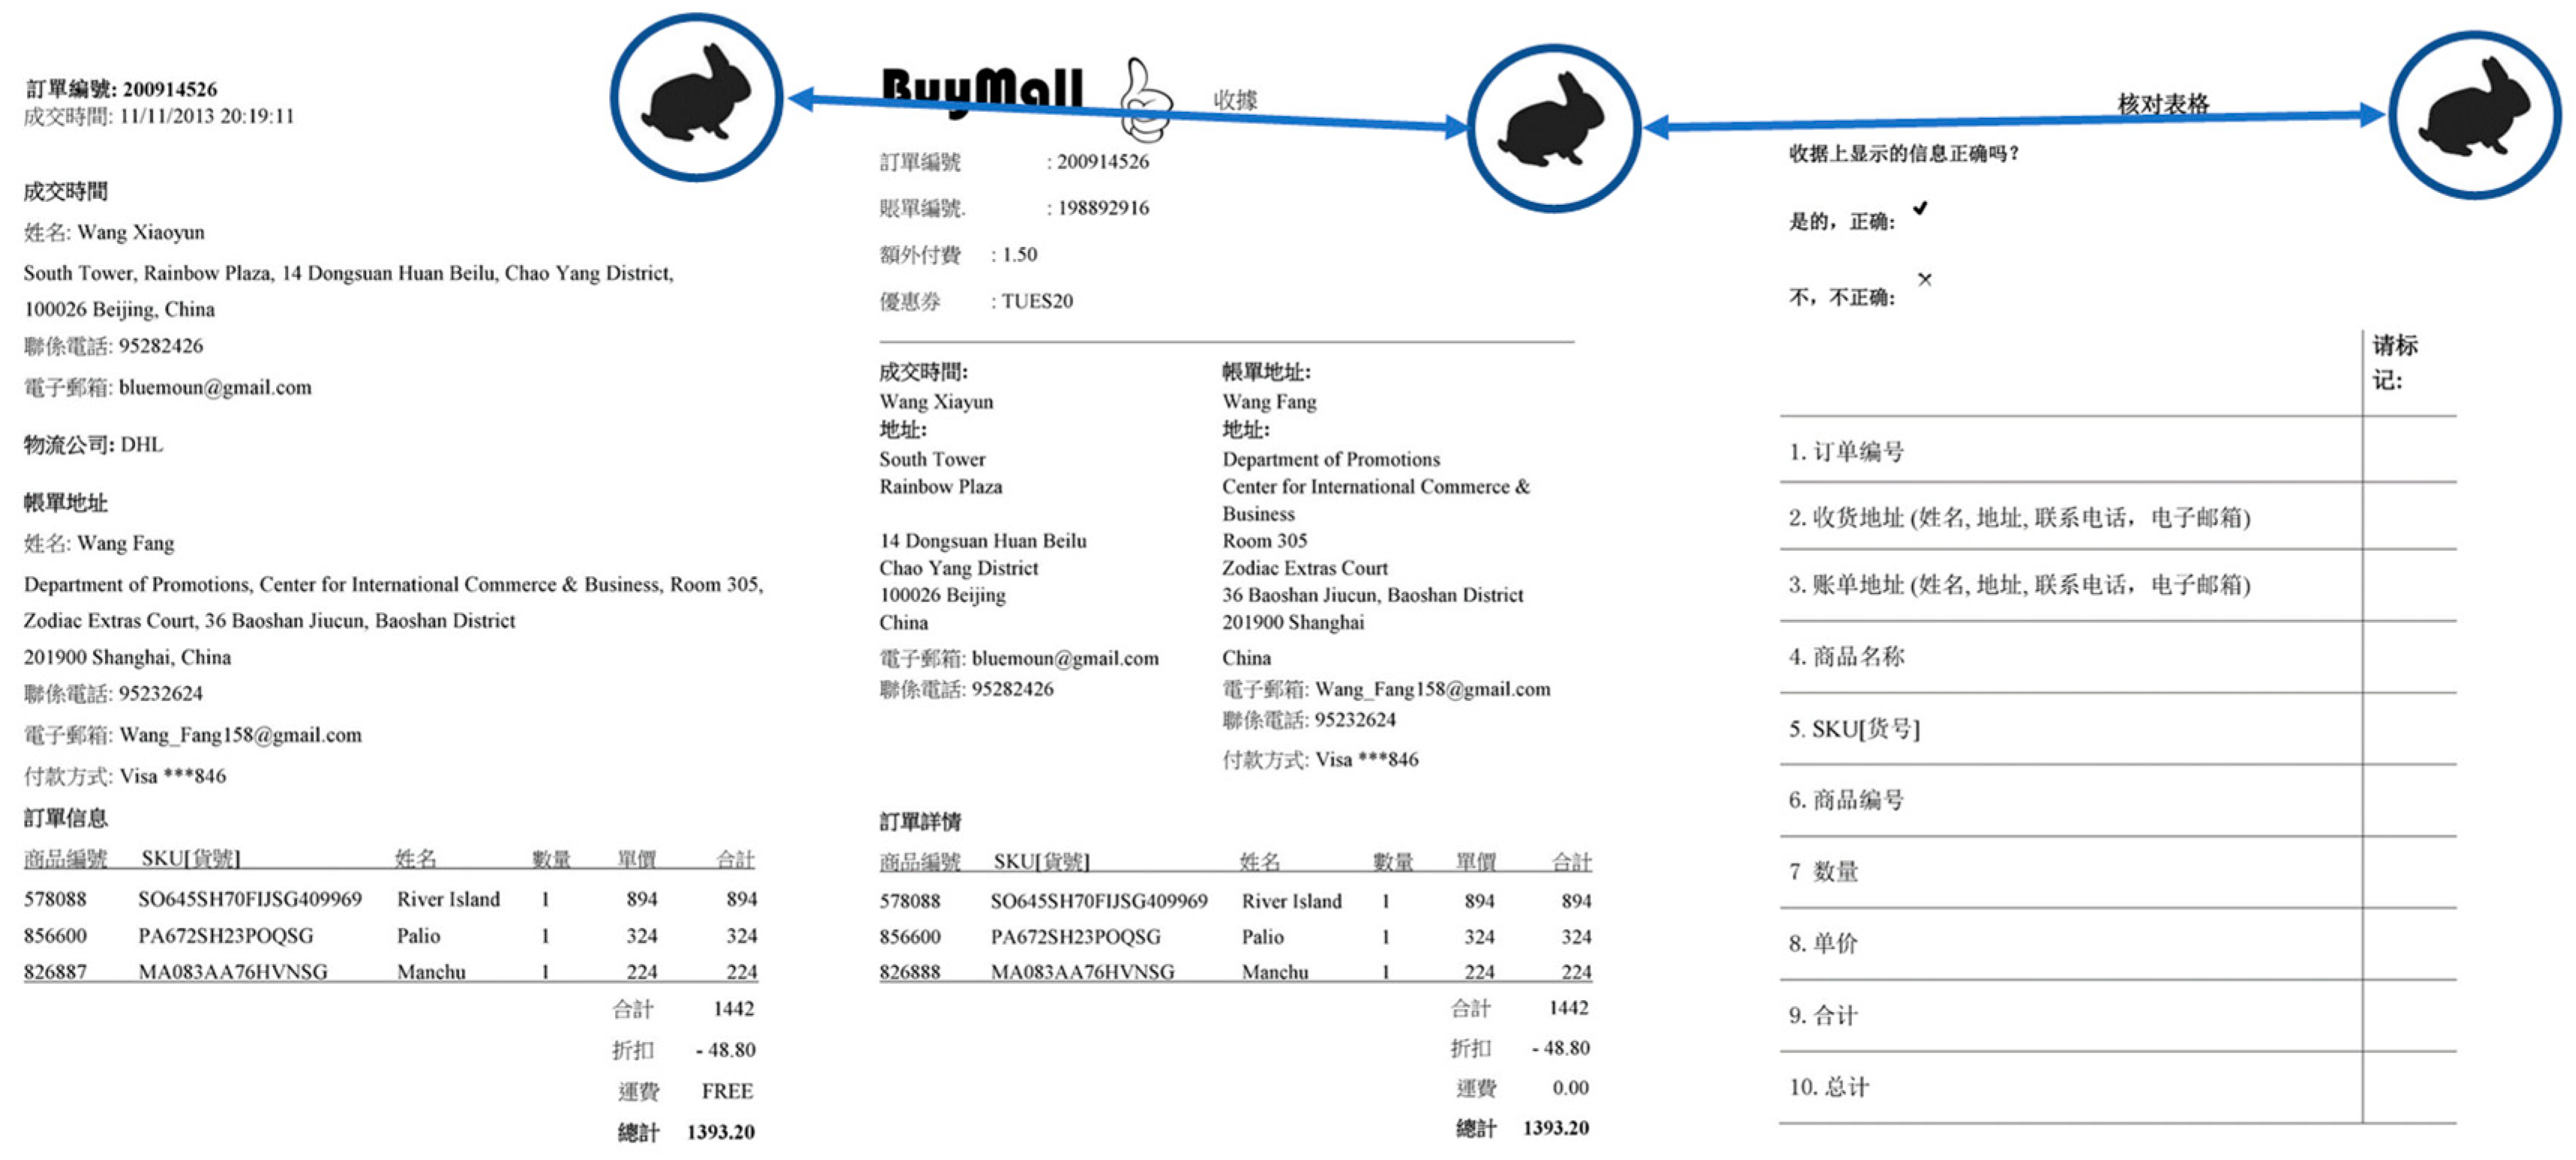
Appendix B
Illustration of the Procedure of the Error Detection Task


References
- Gros, D.; Alcidi, C.; Busse, M.; Elkerbout, M.; Laurentsyeva, N.; Renda, A. Global Trends to 2035—Economy and Society; European Parliamentary Research Service: Brussels, Belgium, 2018. [Google Scholar]
- Park, J.H.; Ono, M. Effects of workplace bullying on work engagement and health: The mediating role of job insecurity. Int. J. Hum. Resour. Manag. 2017, 28, 3202–3225. [Google Scholar] [CrossRef]
- Greenhalgh, L.; Rosenblatt, Z. Job Insecurity: Toward Conceptual Clarity. Acad. Manag. Rev. 1984, 9, 438. [Google Scholar] [CrossRef]
- De Witte, H. Job Insecurity and Psychological Well-being: Review of the Literature and Exploration of Some Unresolved Issues. Eur. J. Work Organ. Psychol. 1999, 8, 155–177. [Google Scholar] [CrossRef]
- De Witte, H.; Vander Elst, T.; De Cuyper, N. Job Insecurity, Health and Well-Being. In Sustainable Working Lives; Vuori, J., Blonk, R., Price, R.H., Eds.; Springer: Dordrecht, The Netherlands, 2015; pp. 109–128. ISBN 978-94-017-9797-9. [Google Scholar]
- Sverke, M.; Hellgren, J. The Nature of Job Insecurity: Understanding Employment Uncertainty on the Brink of a New Millennium. Appl. Psychol. 2002, 51, 23–42. [Google Scholar] [CrossRef]
- Ruokolainen, M.; Mauno, S.; Diehl, M.-R.; Tolvanen, A.; Mäkikangas, A.; Kinnunen, U. Patterns of psychological contract and their relationships to employee well-being and in-role performance at work: Longitudinal evidence from university employees. Int. J. Hum. Resour. Manag. 2018, 29, 2827–2850. [Google Scholar] [CrossRef]
- Rothmann, S.; Kruger, M.M.; Jackson, L.T.B. Burnout and job stress in a local government: The Moderating Effect of Sense of Coherence. Available online: https://www.ingentaconnect.com/content/sabinet/psyc/2003/00000029/00000004/art00006 (accessed on 17 June 2019).
- Maslach, C.; Schaufeli, W.B.; Leiter, M.P. Job Burnout. Annu. Rev. Psychol. 2001, 52, 397–422. [Google Scholar] [CrossRef] [PubMed]
- Horn, J.E.; Schaufeli, W.B.; Enzmann, D. Teacher Burnout and Lack of Reciprocity1. J. Appl. Soc. Psychol. 1999, 29, 91–108. [Google Scholar] [CrossRef]
- Linden, D.V.D.; Keijsers, G.P.J.; Eling, P.; Schaijk, R.V. Work stress and attentional difficulties: An initial study on burnout and cognitive failures. Work Stress 2005, 19, 23–36. [Google Scholar] [CrossRef]
- Probst, T.M.; Brubaker, T.L. The Effects of Job Insecurity on Employee Safety Outcomes: Cross-Sectional and Longitudinal Explorations. J. Occup. Health Psychol. 2001, 6, 139–159. [Google Scholar] [CrossRef] [PubMed]
- Byrd, J.; Gailey, N.J.; Probst, T.M.; Jiang, L. Explaining the job insecurity-safety link in the public transportation industry: The mediating role of safety-production conflict. Saf. Sci. 2018, 106, 255–262. [Google Scholar] [CrossRef]
- Van Vuuren, T. Met Ontslag Bedreigd: Werknemers in Onzekerheid over Hun Arbeidsplaats Bij Veranderingen in de Organisatie. Job Insecurity. Insecurity among Workers during Organizational Changes. Ph.D. Thesis, VU Uitgeverij, Amsterdam, The Netherlands, 25 October 1990. [Google Scholar]
- De Witte, H.; Cuyper, N.D.; Elst, T.V.; Vanbelle, E.; Niesen, W. Job Insecurity: Review of the Literature and a Summary of Recent Studies from Belgium. Rom. J. Appl. Psychol. 2012, 14, 11–17. [Google Scholar]
- Akerman, A.; Williams, M.E.; Meunier, J. Perception versus Reality: An Exploration of Children’s Measured Body Mass in Relation to Caregivers’ Estimates. J. Health Psychol. 2007, 12, 871–882. [Google Scholar] [CrossRef] [PubMed]
- De Cuyper, N.; De Witte, H. Job insecurity and employability among temporary workers: A theoretical approach based on the psychological contract. In The Individual in the Changing Working Life; Naswall, K., Hellgren, J., Sverke, M., Eds.; Cambridge University Press: Cambridge, UK, 2008; pp. 88–107. ISBN 978-0-511-49006-4. [Google Scholar]
- Hellgren, J.; Sverke, M.; Isaksson, K. A Two-dimensional Approach to Job Insecurity: Consequences for Employee Attitudes and Well-being. Eur. J. Work Organ. Psychol. 1999, 8, 179–195. [Google Scholar] [CrossRef]
- Roskies, E.; Louis-Guerin, C. Job insecurity in managers: Antecedents and consequences. J. Organ. Behav. 1990, 11, 345–359. [Google Scholar] [CrossRef]
- Handaja, Y.; De Witte, H. Kwantitatieve en kwalitative baanonzekerheid: Samenhangen met arbeidstevredenheid en psychisch welzijn. Quantitative and qualitative job insecurity: Associations with job satisfaction and mental well-being. Gedrag Organ. 2007, 20, 137–159. [Google Scholar]
- De Witte, H.; De Cuyper, N.; Handaja, Y.; Sverke, M.; Näswall, K.; Hellgren, J. Associations Between Quantitative and Qualitative Job Insecurity and Well-Being: A Test in Belgian Banks. Int. Stud. Manag. Organ. 2010, 40, 40–56. [Google Scholar] [CrossRef]
- Reason, J.T. Understanding adverse events. In Adult Learning: Psychological Research and Applications; Reason, J.T. Wiley: London, UK, 1977. [Google Scholar]
- Reason, J.T.; Underwood, G.; Stevens, R. Aspects of Consciousness; Penguin: London, UK, 1979. [Google Scholar]
- Cheyne, J.A.; Carriere, J.S.A.; Smilek, D. Absent-mindedness: Lapses of conscious awareness and everyday cognitive failures. Conscious. Cogn. 2006, 15, 578–592. [Google Scholar] [CrossRef]
- Larson, G.E.; Alderton, D.L.; Neideffer, M.; Underhill, E. Further evidence on dimensionality and correlates of the Cognitive Failures Questionnaire. Br. J. Psychol. 1997, 88, 29–38. [Google Scholar] [CrossRef]
- Quinlan, M. The hidden epidemic of injuries and illness associated with the global expansion of precarious employment. In Occupational Health and Safety: International Influences and the New Epidemic; Baywood Publishing: Amityville, NY, USA, 2005; pp. 53–74. [Google Scholar]
- Jiang, L.; Probst, T.M. Organizational communication: A buffer in times of job insecurity? Econ. Ind. Democr. 2014, 35, 557–579. [Google Scholar] [CrossRef]
- Fabiano, B.; Currò, F.; Reverberi, A.P.; Pastorino, R. A statistical study on temporary work and occupational accidents: Specific risk factors and risk management strategies. Saf. Sci. 2008, 46, 535–544. [Google Scholar] [CrossRef]
- Saloniemi, A.; Salminen, S. Do fixed-term workers have a higher injury rate? Saf. Sci. 2010, 48, 693–697. [Google Scholar] [CrossRef]
- Seo, D.-C. An explicative model of unsafe work behavior. Saf. Sci. 2005, 43, 187–211. [Google Scholar] [CrossRef]
- Hobfoll, S.E. Conservation of resources: A new attempt at conceptualizing stress. Am. Psychol. 1989, 44, 513–524. [Google Scholar] [CrossRef] [PubMed]
- Hobfoll, S.E. The Influence of Culture, Community, and the Nested-Self in the Stress Process: Advancing Conservation of Resources Theory. Appl. Psychol. 2001, 50, 337–421. [Google Scholar] [CrossRef]
- Van Hootegem, A.; De Witte, H. Qualitative Job Insecurity and Informal Learning: A Longitudinal Test of Occupational Self-Efficacy and Psychological Contract Breach as Mediators. Int. J. Environ. Res. Public. Health 2019, 16, 1847. [Google Scholar] [CrossRef] [PubMed]
- Staw, B.M.; Sandelands, L.E.; Dutton, J.E. Threat Rigidity Effects in Organizational Behavior: A Multilevel Analysis. Adm. Sci. Q. 1981, 26, 501–524. [Google Scholar] [CrossRef]
- Hootegem, A.V.; Niesen, W.; Witte, H.D. Does job insecurity hinder innovative work behaviour? A threat rigidity perspective. Creat. Innov. Manag. 2019, 28, 19–29. [Google Scholar] [CrossRef]
- De Witte, H. Arbeidsethos en jobonzekerheid: Meting en gevolgen voor welzijn, tevredenheid en inzet op het werk. Work ethic and job insecurity: Measurement and consequences for well-being, satisfaction and productivity. In Van Groep Naar Gemeenschap; Bouwen, K., De Witte, H., Taillieu, T., Eds.; Garant: Leuven, Belgium, 2000; pp. 325–350. [Google Scholar]
- Maslach, C.; Jackson, S.E. Burnout in organizational settings. Appl. Soc. Psychol. Annu. 1984, 5, 133–153. [Google Scholar]
- Contte, J.M.; Jacobs, R.R. Redundant Systems Influences on Performance. Hum. Perform. 1997, 10, 361–380. [Google Scholar] [CrossRef]
- Shanafelt, T.D.; Balch, C.M.; Bechamps, G.J.; Russell, T.; Dyrbye, L.; Satele, D.; Collicott, P.; Novotny, P.J.; Sloan, J.; Freischlag, J.A. Burnout and Career Satisfaction Among American Surgeons. Trans. Meet. Am. Surg. Assoc. 2009, 127, 107–115. [Google Scholar] [CrossRef]
- Nahrgang, J.D.; Morgeson, F.P.; Hofmann, D.A. Safety at work: A meta-analytic investigation of the link between job demands, job resources, burnout, engagement, and safety outcomes. J. Appl. Psychol. 2011, 96, 71–94. [Google Scholar] [CrossRef] [PubMed]
- Bakker, A.B.; Demerouti, E. The Job Demands-Resources model: State of the art. J. Manag. Psychol. 2007, 22, 309–328. [Google Scholar] [CrossRef]
- Demerouti, E.; Bakker, A.B.; Nachreiner, F.; Schaufeli, W.B. A model of burnout and life satisfaction amongst nurses. J. Adv. Nurs. 2000, 32, 454–464. [Google Scholar] [CrossRef] [PubMed]
- Schaufeli, W.B. Job Insecurity Research is Still Alive and Kicking Twenty Years Later: A Commentary: Job insecurity research. Aust. Psychol. 2016, 51, 32–35. [Google Scholar] [CrossRef]
- Nozari, N.; Dell, G.S.; Schwartz, M.F. Is comprehension necessary for error detection? A conflict-based account of monitoring in speech production. Cogn. Psychol. 2011, 63, 1–33. [Google Scholar] [CrossRef] [PubMed]
- Simões-Franklin, C.; Hester, R.; Shpaner, M.; Foxe, J.J.; Garavan, H. Executive function and error detection: The effect of motivation on cingulate and ventral striatum activity. Hum. Brain Mapp. 2010, 31, 458–469. [Google Scholar] [CrossRef]
- Reason, J. Understanding adverse events: Human factors. BMJ Qual. Saf. 1995, 4, 80–89. [Google Scholar] [CrossRef] [PubMed]
- Price, R.H.; Fang, L. Unemployed Chinese workers: The survivors, the worried young and the discouraged old. Int. J. Hum. Resour. Manag. 2002, 13, 416–430. [Google Scholar] [CrossRef]
- Zhao, J.; Rust, K.G.; McKinley, W.; Edwards, J.C. Downsizing, ideology and contracts: A Chinese perspective. Chin. Manag. Stud. 2010, 4, 119–140. [Google Scholar] [CrossRef]
- Logan, G.D.; Crump, M.J.C. Cognitive Illusions of Authorship Reveal Hierarchical Error Detection in Skilled Typists. Science 2010, 330, 683–686. [Google Scholar] [CrossRef]
- Mitroff, S.R.; Biggs, A.T. The Ultra-Rare-Item Effect: Visual Search for Exceedingly Rare Items Is Highly Susceptible to Error. Psychol. Sci. 2014, 25, 284–289. [Google Scholar] [CrossRef] [PubMed]
- Manly, T.; Lewis, G.H.; Robertson, I.H.; Watson, P.C.; Datta, A.K. Coffee in the cornflakes: Time-of-day as a modulator of executive response control. Neuropsychologia 2002, 40, 1–6. [Google Scholar] [CrossRef]
- Wild-Wall, N.; Falkenstein, M.; Gajewski, P.D. Neural Correlates of Changes in a Visual Search Task due to Cognitive Training in Seniors. Neural Plast. 2012, 2012, 1–11. [Google Scholar] [CrossRef] [PubMed]
- Wang, L.; Lewin, K. Introduction to the Development of Basic Education in China. In Two Decades of Basic Education in Rural China: Transitions and Challenges for Development; Wang, L., Lewin, K., Eds.; New Frontiers of Educational Research; Springer: Singapore, 2016; pp. 1–23. ISBN 978-981-10-2120-6. [Google Scholar]
- Brislin, R.W. Translation and content analysis of oral and written materials. In Handbook of Cross Cultural Psychology; Triandis, H.C., Berry, J.W., Eds.; Allyn & Bacon: Boston, MA, USA, 1980; pp. 389–444. [Google Scholar]
- Vander Elst, T.; De Witte, H.; De Cuyper, N. The Job Insecurity Scale: A psychometric evaluation across five European countries. Eur. J. Work Organ. Psychol. 2014, 23, 364–380. [Google Scholar] [CrossRef]
- Bland, J.M.; Altman, D.G. Statistics notes: Cronbach’s alpha. BMJ 1997, 314, 572. [Google Scholar] [CrossRef] [PubMed]
- Goncalves, L.L.; Egidio Nardi, A.; Guedes, E.; Santos, H.D.; King Padua, M.; Guimaraes, F.L.; Rodrigues, D.; Spear King, A.L. Scale to Assess Leaders’ Perceptions about their Workers’ Digital Addiction. Addict. Health 2018, 10, 223–230. [Google Scholar] [PubMed]
- Schaufeli, W.B.; Leiter, M.P.; Maslach, C.; Jackson, S.E. The Maslach Burnout Inventory-General Survey. In Maslach Burnout Inventory; Maslach, C., Jackson, S.E., Leiter, M.P., Eds.; Consulting Psychologists Press: Palo Alto, CA, USA, 1996. [Google Scholar]
- Wolfe, J.M. Visual search. In Attention; Pashler, H., Ed.; Psychology Press Ltd.: East Sussex, UK, 1998; pp. 13–74. [Google Scholar]
- Wolfe, J.M.; Horowitz, T.S.; Kenner, N.M. Rare items often missed in visual searches. Nature 2005, 435, 439–440. [Google Scholar] [CrossRef]
- Wiseman, S.; Cairns, P.; Cox, A. A Taxonomy of Number Entry Error. In Proceedings of the BCS-HCI ‘11 Proceedings of the 25th BCS Conference on Human-Computer Interaction, Newcastle, UK, 4–8 July 2011; Volume 9. [Google Scholar]
- Hayes, A.F. Introduction to Mediation, Moderation, and Conditional Process Analysis: A Regression-Based Approach; Guilford Press: New York, NY, USA, 2013. [Google Scholar]
- Hayes, A.F.; Montoya, A.K.; Rockwood, N.J. The analysis of mechanisms and their contingencies: PROCESS versus structural equation modeling. Australas. Mark. J. AMJ 2017, 25, 76–81. [Google Scholar] [CrossRef]
- Hoogland, J.J.; Boomsma, A. Robustness Studies in Covariance Structure Modeling. Sociol. Methods Res. 1998, 26, 329–367. [Google Scholar] [CrossRef]
- Hayes, A.F. Beyond Baron and Kenny: Statistical Mediation Analysis in the New Millennium. Commun. Monogr. 2009, 76, 408–420. [Google Scholar] [CrossRef]
- Rucker, D.D.; Preacher, K.J.; Tormala, Z.L.; Petty, R.E. Mediation Analysis in Social Psychology: Current Practices and New Recommendations. Soc. Personal. Psychol. Compass 2011, 5, 359–371. [Google Scholar] [CrossRef]
- Roll, L.C.; Siu, O.; Li, S.Y.W.; De Witte, H. Job insecurity: Cross-cultural comparison between Germany and China. J. Organ. Eff. People Perform. 2015, 2, 36–54. [Google Scholar] [CrossRef]
- Wearden, A.; Appleby, L. Cognitive performance and complaints of cognitive impairment in chronic fatigue syndrome (CFS). Psychol. Med. 1997, 27, 81–90. [Google Scholar] [CrossRef] [PubMed]
- Fry, A.M.; Martin, M. Fatigue in the chronic fatigue syndrome: A cognitive phenomenon? J. Psychosom. Res. 1996, 41, 415–426. [Google Scholar] [CrossRef]
- Wiegmann, D.A.; Shappell, S.A. A human error analysis of commercial aviation accidents using the Human Factors Analysis and Classification System (HFACS). Aviat. Space Environ. Med. 2001, 72, 1006–1016. [Google Scholar] [PubMed]


| Variables | Means | SDs | 1 | 2 | 3 | 4 | 5 | 6 | 7 | 8 | 9 | 10 | 11 |
|---|---|---|---|---|---|---|---|---|---|---|---|---|---|
| 1. Quant. JI | 2.09 | 1.07 | |||||||||||
| 2. Qual. JI | 2.46 | 0.97 | 0.58 ** | ||||||||||
| 3. BO Total | 2.89 | 0.60 | 0.29 ** | 0.36 ** | |||||||||
| 4. ARCES | 2.82 | 0.78 | 0.13 | 0.11 | 0.59 ** | ||||||||
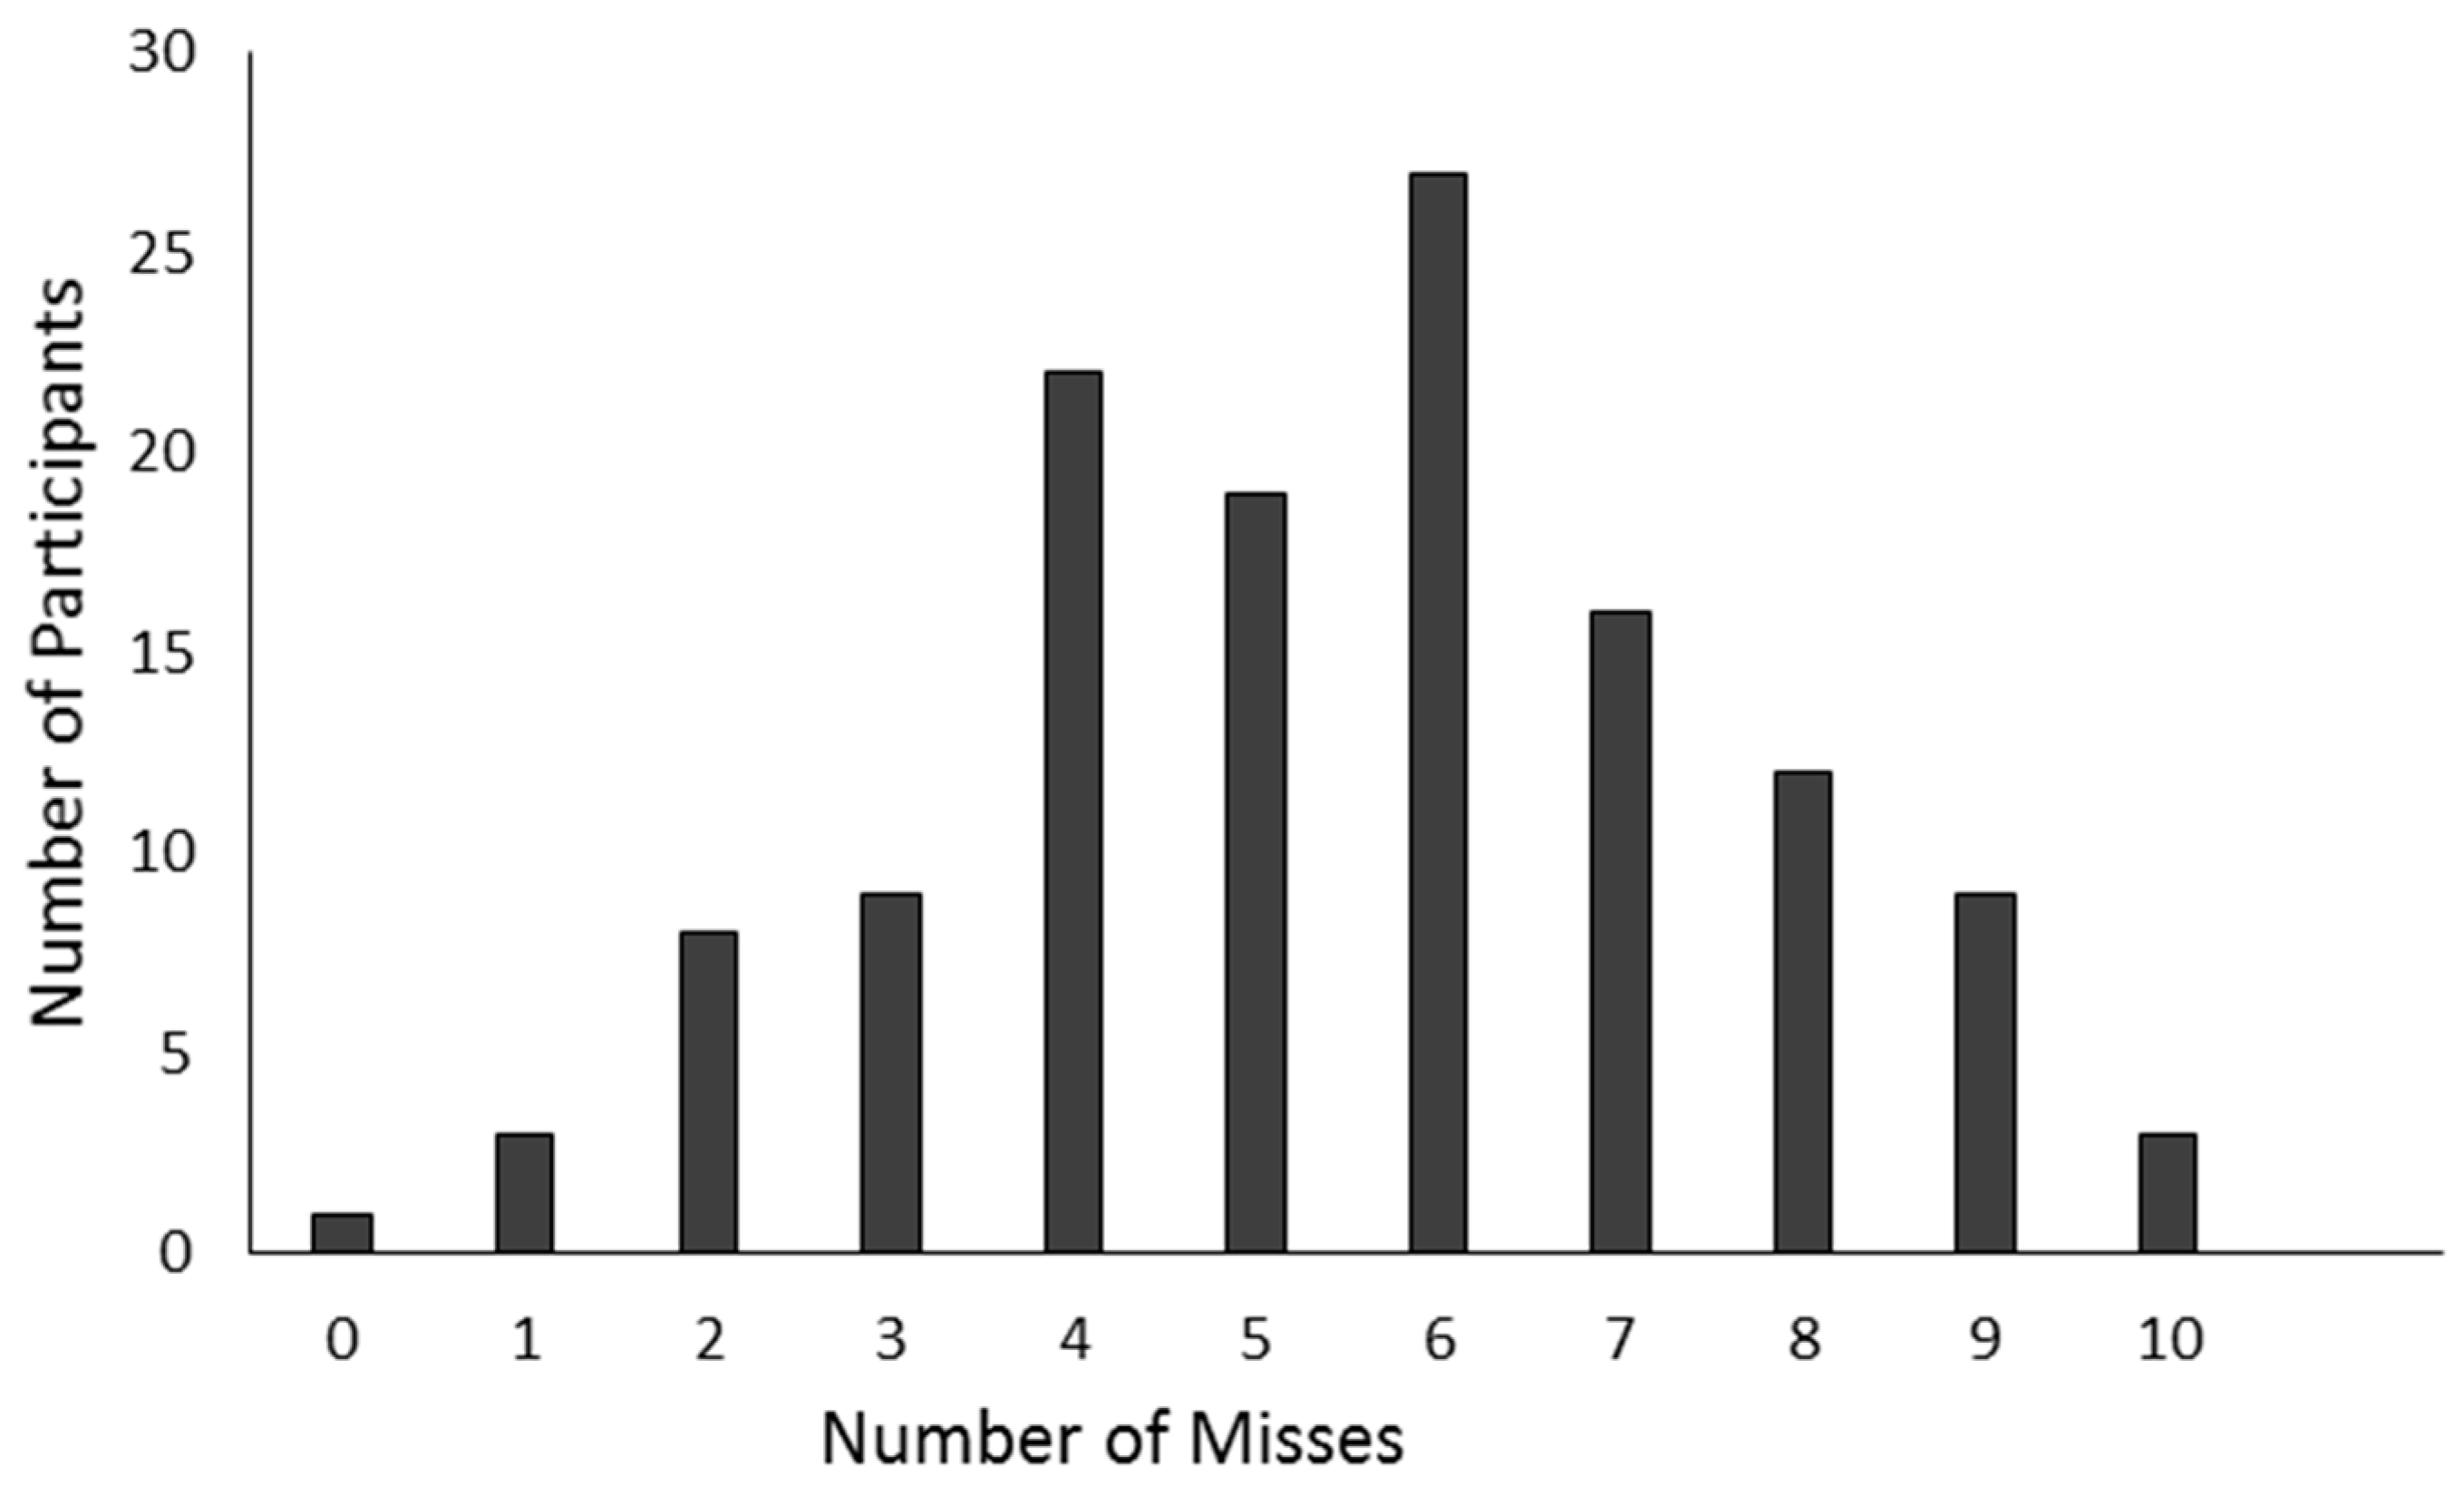
| 5. Misses | 54.28 | 22.05 | 0.10 | 0.03 | 0.16 * | 0.19 * | |||||||
| 6. False Pos. | 1.84 | 3.01 | −0.01 | −0.11 | 0.01 | 0.05 | −0.11 | ||||||
| 7. Edu | n.a. | n.a. | −0.08 | −0.01 | −0.02 | −0.01 | −0.27 ** | 0.09 | |||||
| 8. Age | 42.3 | 9.3 | 0.13 | 0.04 | 0.03 | 0.11 | 0.43 ** | −0.05 | −0.11 | ||||
| 9. Gender | n.a. | n.a. | 0.19 * | 0.09 | −0.09 | −0.17 * | 0.26 ** | −0.01 | −0.06 | 0.23 ** | |||
| 10. Tenure | 20.3 | 10.3 | 0.01 | −0.02 | 0.03 | 0.18 * | 0.31 ** | −0.05 | −0.05 | 0.90 ** | 0.13 | ||
| 11. Hours/w | 38.9 | 15.0 | −0.09 | −0.01 | −0.03 | −0.07 | −0.28 ** | −0.10 | 0.01 | −0.25 ** | −0.11 | −0.17 | |
| 12. Contract | n.a. | n.a. | 0.04 | 0.16 | 0.06 | −0.03 | −0.28 ** | 0.01 | −0.05 | −0.57 ** | −0.02 | −0.52 ** | 0.11 |
| Error Type | Example |
|---|---|
| 1. Digit(s) wrong | 826887 for 826878 |
| 2. Digit(s)/Letter added | Quyiang Road instead of Quyang Road |
| 3. Incorrect pattern use | Kumning instead of Kunming |
| 4. Out by one | 2 instead of 3 |
© 2019 by the authors. Licensee MDPI, Basel, Switzerland. This article is an open access article distributed under the terms and conditions of the Creative Commons Attribution (CC BY) license (http://creativecommons.org/licenses/by/4.0/).
Share and Cite
Roll, L.C.; Siu, O.-l.; Li, S.Y.W.; De Witte, H. Human Error: The Impact of Job Insecurity on Attention-Related Cognitive Errors and Error Detection. Int. J. Environ. Res. Public Health 2019, 16, 2427. https://doi.org/10.3390/ijerph16132427
Roll LC, Siu O-l, Li SYW, De Witte H. Human Error: The Impact of Job Insecurity on Attention-Related Cognitive Errors and Error Detection. International Journal of Environmental Research and Public Health. 2019; 16(13):2427. https://doi.org/10.3390/ijerph16132427
Chicago/Turabian StyleRoll, Lara Christina, Oi-ling Siu, Simon Y.W. Li, and Hans De Witte. 2019. "Human Error: The Impact of Job Insecurity on Attention-Related Cognitive Errors and Error Detection" International Journal of Environmental Research and Public Health 16, no. 13: 2427. https://doi.org/10.3390/ijerph16132427
APA StyleRoll, L. C., Siu, O.-l., Li, S. Y. W., & De Witte, H. (2019). Human Error: The Impact of Job Insecurity on Attention-Related Cognitive Errors and Error Detection. International Journal of Environmental Research and Public Health, 16(13), 2427. https://doi.org/10.3390/ijerph16132427