Article

Combining Heart Rate Variability with Disease Severity Score Variables for Mortality Risk Stratification in Septic Patients Presenting at the Emergency Department

1
Duke-NUS Medical School, National University of Singapore, Singapore 169857, Singapore
2
Health Services Research Unit, Singapore General Hospital, Singapore 169608, Singapore
3
Department of Emergency Medicine, Singapore General Hospital, Singapore 169608, Singapore
4
General Medicine, Ministry of Health Holdings, Singapore 099253, Singapore
5
Department of Emergency and Critical Care Medicine, Nippon Medical School Tama Nagayama Hospital, Tokyo 206-8512, Japan
6
Preventive Medicine Residency Program, National University Health System, Singapore 119228, Singapore
7
Department of General Surgery, Singapore General Hospital, Singapore 169608, Singapore
8
Health Services Research Centre, Singapore Health Services, Singapore 169856, Singapore
*
Author to whom correspondence should be addressed.
Int. J. Environ. Res. Public Health 2019, 16(10), 1725; https://doi.org/10.3390/ijerph16101725
Submission received: 16 April 2019 / Revised: 13 May 2019 / Accepted: 14 May 2019 / Published: 16 May 2019
(This article belongs to the Section Health Care Sciences & Services)

Abstract

:
The emergency department (ED) serves as the first point of hospital contact for many septic patients, where risk-stratification would be invaluable. We devised a combination model incorporating demographic, clinical, and heart rate variability (HRV) parameters, alongside individual variables of the Sequential Organ Failure Assessment (SOFA), Acute Physiology and Chronic Health Evaluation II (APACHE II), and Mortality in Emergency Department Sepsis (MEDS) scores for mortality risk-stratification. ED patients fulfilling systemic inflammatory response syndrome criteria were recruited. National Early Warning Score (NEWS), Modified Early Warning Score (MEWS), quick SOFA (qSOFA), SOFA, APACHE II, and MEDS scores were calculated. For the prediction of 30-day in-hospital mortality, combination model performed with an area under the receiver operating characteristic curve of 0.91 (95% confidence interval (CI): 0.88–0.95), outperforming NEWS (0.70, 95% CI: 0.63–0.77), MEWS (0.61, 95% CI 0.53–0.69), qSOFA (0.70, 95% CI 0.63–0.77), SOFA (0.74, 95% CI: 0.67–0.80), APACHE II (0.76, 95% CI: 0.69–0.82), and MEDS scores (0.86, 95% CI: 0.81–0.90). The combination model had an optimal sensitivity and specificity of 91.4% (95% CI: 81.6–96.5%) and 77.9% (95% CI: 72.6–82.4%), respectively. A combination model incorporating clinical, HRV, and disease severity score variables showed superior predictive ability for the mortality risk-stratification of septic patients presenting at the ED.

1. Introduction

Sepsis is a life-threatening organ dysfunction that arises from a dysregulated host response to infection [1]. Worldwide, it has been estimated to impact up to 50 million people annually, potentially leading to five million deaths [2]. Even when it does not lead to mortality, sepsis can cause a myriad of complications that result in long-term morbidity [3], with significant implications for healthcare policy and resources. Although the diagnostic criteria of sepsis have been defined [1,4], sepsis severity and associated mortality risk exists in a spectrum, with no consensus on a method for grading or prognosticating it. As the emergency department (ED) is the first point of healthcare contact for many septic patients, an accurate tool for mortality risk-stratification would be invaluable in guiding management.
The ability to prognosticate and risk-stratify septic patients presenting at the ED is manifold. For the individual patient, risk-stratification can guide triage priority, the intended aggressiveness of management, candidacy for invasive monitoring or procedures, and disposition from the ED. In an administrative setting, accurate risk-stratification allows for prudent resource allocation and appropriate classification for research or administrative purposes. Indeed, objective estimates of mortality risk have been noted to provide greater certainty for the expected clinical course, allowing for management decisions to be made more confidently [5]. Scoring systems have also been shown to aid in the optimization and cost-effective use of healthcare resources [4,6].
Disease severity scoring systems have been developed to assess severity of illness and to predict the risk of mortality. Several of the more widely used scores include the National Early Warning Score (NEWS) [7], Modified Early Warning Score (MEWS) [8], Sequential Organ Failure Assessment (SOFA) [9], quick SOFA (qSOFA) [10], Acute Physiology and Chronic Health Evaluation II (APACHE II) [11], and the Mortality in Emergency Department Sepsis (MEDS) score [12]. The scores differ in their intended population of use (septic patients versus the general population), intended location of use (ED versus intensive care unit versus general use) and in how much information, and hence time, is required for their calculation. Studies that have utilized these scoring systems in the population of septic patients presenting at the ED have been promising, with the purpose-built MEDS score and the more elaborate scoring systems such as SOFA and APACHE II exhibiting superior predictive abilities [13,14,15,16].
Heart rate variability (HRV) analysis is a technique that utilizes electrocardiogram (ECG) tracings to examine beat-to-beat variations in heartbeats [17]. This provides a quick and non-invasive method of evaluating the autonomic modulation of the cardiovascular system, which has been shown to be dysregulated in sepsis [18]. Abnormalities in HRV parameters present themselves far before clinical signs become apparent [19,20] and have been found to correlate well with subsequent patient deterioration and mortality [13,21,22,23,24,25,26]. HRV analysis may thus represent a potentially useful method for the early risk-stratification of septic patients presenting at the ED and can be considered as a standalone predictor or as an augmentation of the other disease severity scores.
In this study, we aimed to devise a model incorporating clinically relevant and best-performing demographic, clinical, and HRV parameters, along with the individual variables of SOFA, APACHE II, and MEDS scores for the prediction of 30-day in-hospital mortality (IHM) in septic patients presenting to the ED. We also aimed to create a model for rapid triage with variables that can be quickly ascertained on initial patient presentation.

2. Materials and Methods

2.1. Study Design and Setting

We conducted a retrospective data analysis on a convenience sample of patients presenting to the ED of Singapore General Hospital (SGH) between September 2014 to April 2017. The study was approved by SingHealth Centralized Institutional Review Board with a waiver of patient consent (CIRB Ref No.: 2016/2858). SGH is a tertiary care hospital in Singapore, with 300 to 500 patients seen in the ED per day. On presentation at the ED, patients are triaged with the national Singaporean Patient Acuity Category Scale (PACS), a symptom-based triage system without strict physiological criteria. Patients are assigned a PACS score ranging from 1 to 4, reflecting the urgency of their need for consultation with a physician. Patients triaged to PACS 1 are critically ill, those to PACS 2 are non-ambulant, those to PACS 3 are ambulant, and those to PACS 4 are non-emergencies.

2.2. Study Population and Eligibility

Adult patients (aged 18 years and above) presenting to the ED, clinically suspected to have sepsis by their treating physicians and fulfilling at least two of the four systemic inflammatory response syndrome (SIRS) criteria [4] were recruited. The four SIRS criteria are a temperature of >38 °C or <36 °C, an elevated heart rate >90 beats per minute, a respiratory rate >20 breaths per minute, and a total white blood cell count >12,000 cells per mm3 or <4000 cells per mm3. Although a recent revision in 2016 was made to the criteria for sepsis with a recommendation to use qSOFA [1], the SIRS criteria of 1991 was used to define the septic population in this study. This is based on subsequent evidence that has found qSOFA to have poor sensitivity for septic patients, calling into question its suitability for ED sepsis screening as compared to the SIRS criteria [27,28,29,30]. Utilizing the SIRS criteria to define the septic population also allows for comparability with previously conducted studies.
Patients who had ECG readings which were not suitable for HRV analysis were excluded. Inapplicable ECG readings included non-sinus rhythms (asystole, ventricular or supra-ventricular arrhythmias) or readings with a high proportion of artefacts or ectopics exceeding 30% of the recording. Patients lost to follow-up or transferred to other hospitals within 30 days of initial ED presentation were also excluded. The study was limited to patients triaged to PACS 1 or 2.

2.3. Data Collection

Patients who met inclusion criteria received six-minute one-lead ECG monitoring immediately upon triage with the X-Series Monitor (ZOLL Medical Corporation, Chelmsford, MA, USA). ECG recordings were subsequently loaded onto the Kubios HRV program version 2.2 (Kuopio, Finland) for analysis. Noise removal was performed to suppresses high-frequency interference and low-frequency variations due to baseline wander and motion artefacts. RR interval sequences were generated for the computation of HRV parameters of the time domain, frequency domain and non-linear variables. Time-domain parameters quantify variability between successive heart beats, frequency-domain parameters quantify the signal energy in each of the three frequency bands (very low, low, and high frequency), while non-linear parameters quantify the organization and complexity of the time series [31]. A comprehensive description of HRV parameters can be found in the paper by Shaffer and colleagues [31].
Patient demographic data, comorbidities, clinical and laboratory parameters and treatment received for the duration of the patient’s ED stay were retrieved from the electronic medical records. The primary outcome was 30-day IHM following ED presentation.

2.4. Disease Severity Score Calculation

NEWS, MEWS and qSOFA were calculated with the first recorded value obtained upon patient presentation. SOFA, APACHE II and MEDS score utilized the most abnormal value recorded for the duration of the patient’s ED stay. For patients who did not have their NN triangular index (HRV parameter) calculated or serum bilirubin values obtained, the median value of the other patients served as a replacement. Parameters required for the calculation of NEWS, MEWS, qSOFA, SOFA, APACHE II, and MEDS score are listed in the Appendix A Table A1.
For the purposes of disease severity score calculations, we defined variables with reference to their original papers [7,8,9,10,11,12] unless stated otherwise. Both SOFA and APACHE II utilize the partial pressure of arterial oxygen (PaO2) as a component of their scores. As an arterial blood gas (ABG) is required for data on PaO2 and is infrequently performed, peripheral capillary oxygen saturation (SpO2) was used as a surrogate measurement where PaO2 was not available—a technique that has been described in the literature [21,32]. APACHE II incorporates pH as one of its variables but allows for the use of serum bicarbonate as a surrogate when pH data is unavailable [21]. In the clarification of several MEDS score variables, a patient was considered to have an altered mental state (AMS) if they had a Glasgow coma scale (GCS) score of less than 15, or if it was noted that they were ‘drowsy’ or ‘confused’ in their records. As our hospital does not routinely check for percentage bands on differential count, they were assumed to be normal if not reported.

2.5. Statistical Analysis

Statistical analysis was conducted using SPSS version 25 (IBM corporation, Armonk, NY, USA). Univariable analyses of patient baseline characteristics, clinical parameters, and HRV measurements were reported by primary outcome (30-day IHM). Continuous variables were presented as mean (standard deviation) and compared between groups with the Mann–Whitney U test. Categorical variables were presented as a number (percentage) and compared between groups with Pearson’s chi-squared test or Fisher’s exact test as appropriate. Univariable analysis was similarly conducted for the individual components of the SOFA, APACHE II, and MEDS score, with their p-value guiding their inclusion or not into the multivariable logistic regression model.
Two logistic regression models were created for the prediction of the primary outcome. In the first model (rapid triage model), variables which could be ascertained within six minutes of patient presentation and with a p-value ≤0.2 for univariable analysis were considered as possible covariables for logistic regression. Such a model would have use for rapid triage while awaiting investigative data. The second model (combination model) considered demographic, clinical, and HRV parameters as well as the individual variables of the SOFA, MEDS score and APACHE II with a p-value ≤0.2 on univariable analysis and with non-zero counts as possible covariables for logistic regression. Clinical judgement was utilized to deconflict similar variables, and continuous variables were chosen over categorical variables where possible. In the combination model, we utilize the entirely of information garnered during a patient’s ED stay to maximize the predictive ability for the primary outcome.
The predictive performance of disease severity scores was assessed alongside logistic regression models for receiver operating characteristic (ROC) analysis. Sensitivities, specificities, positive and negative predictive values for each score were determined at the optimal cut-off point as indicated by the point on the ROC curve nearest to the upper left corner of the ROC graph.

3. Results

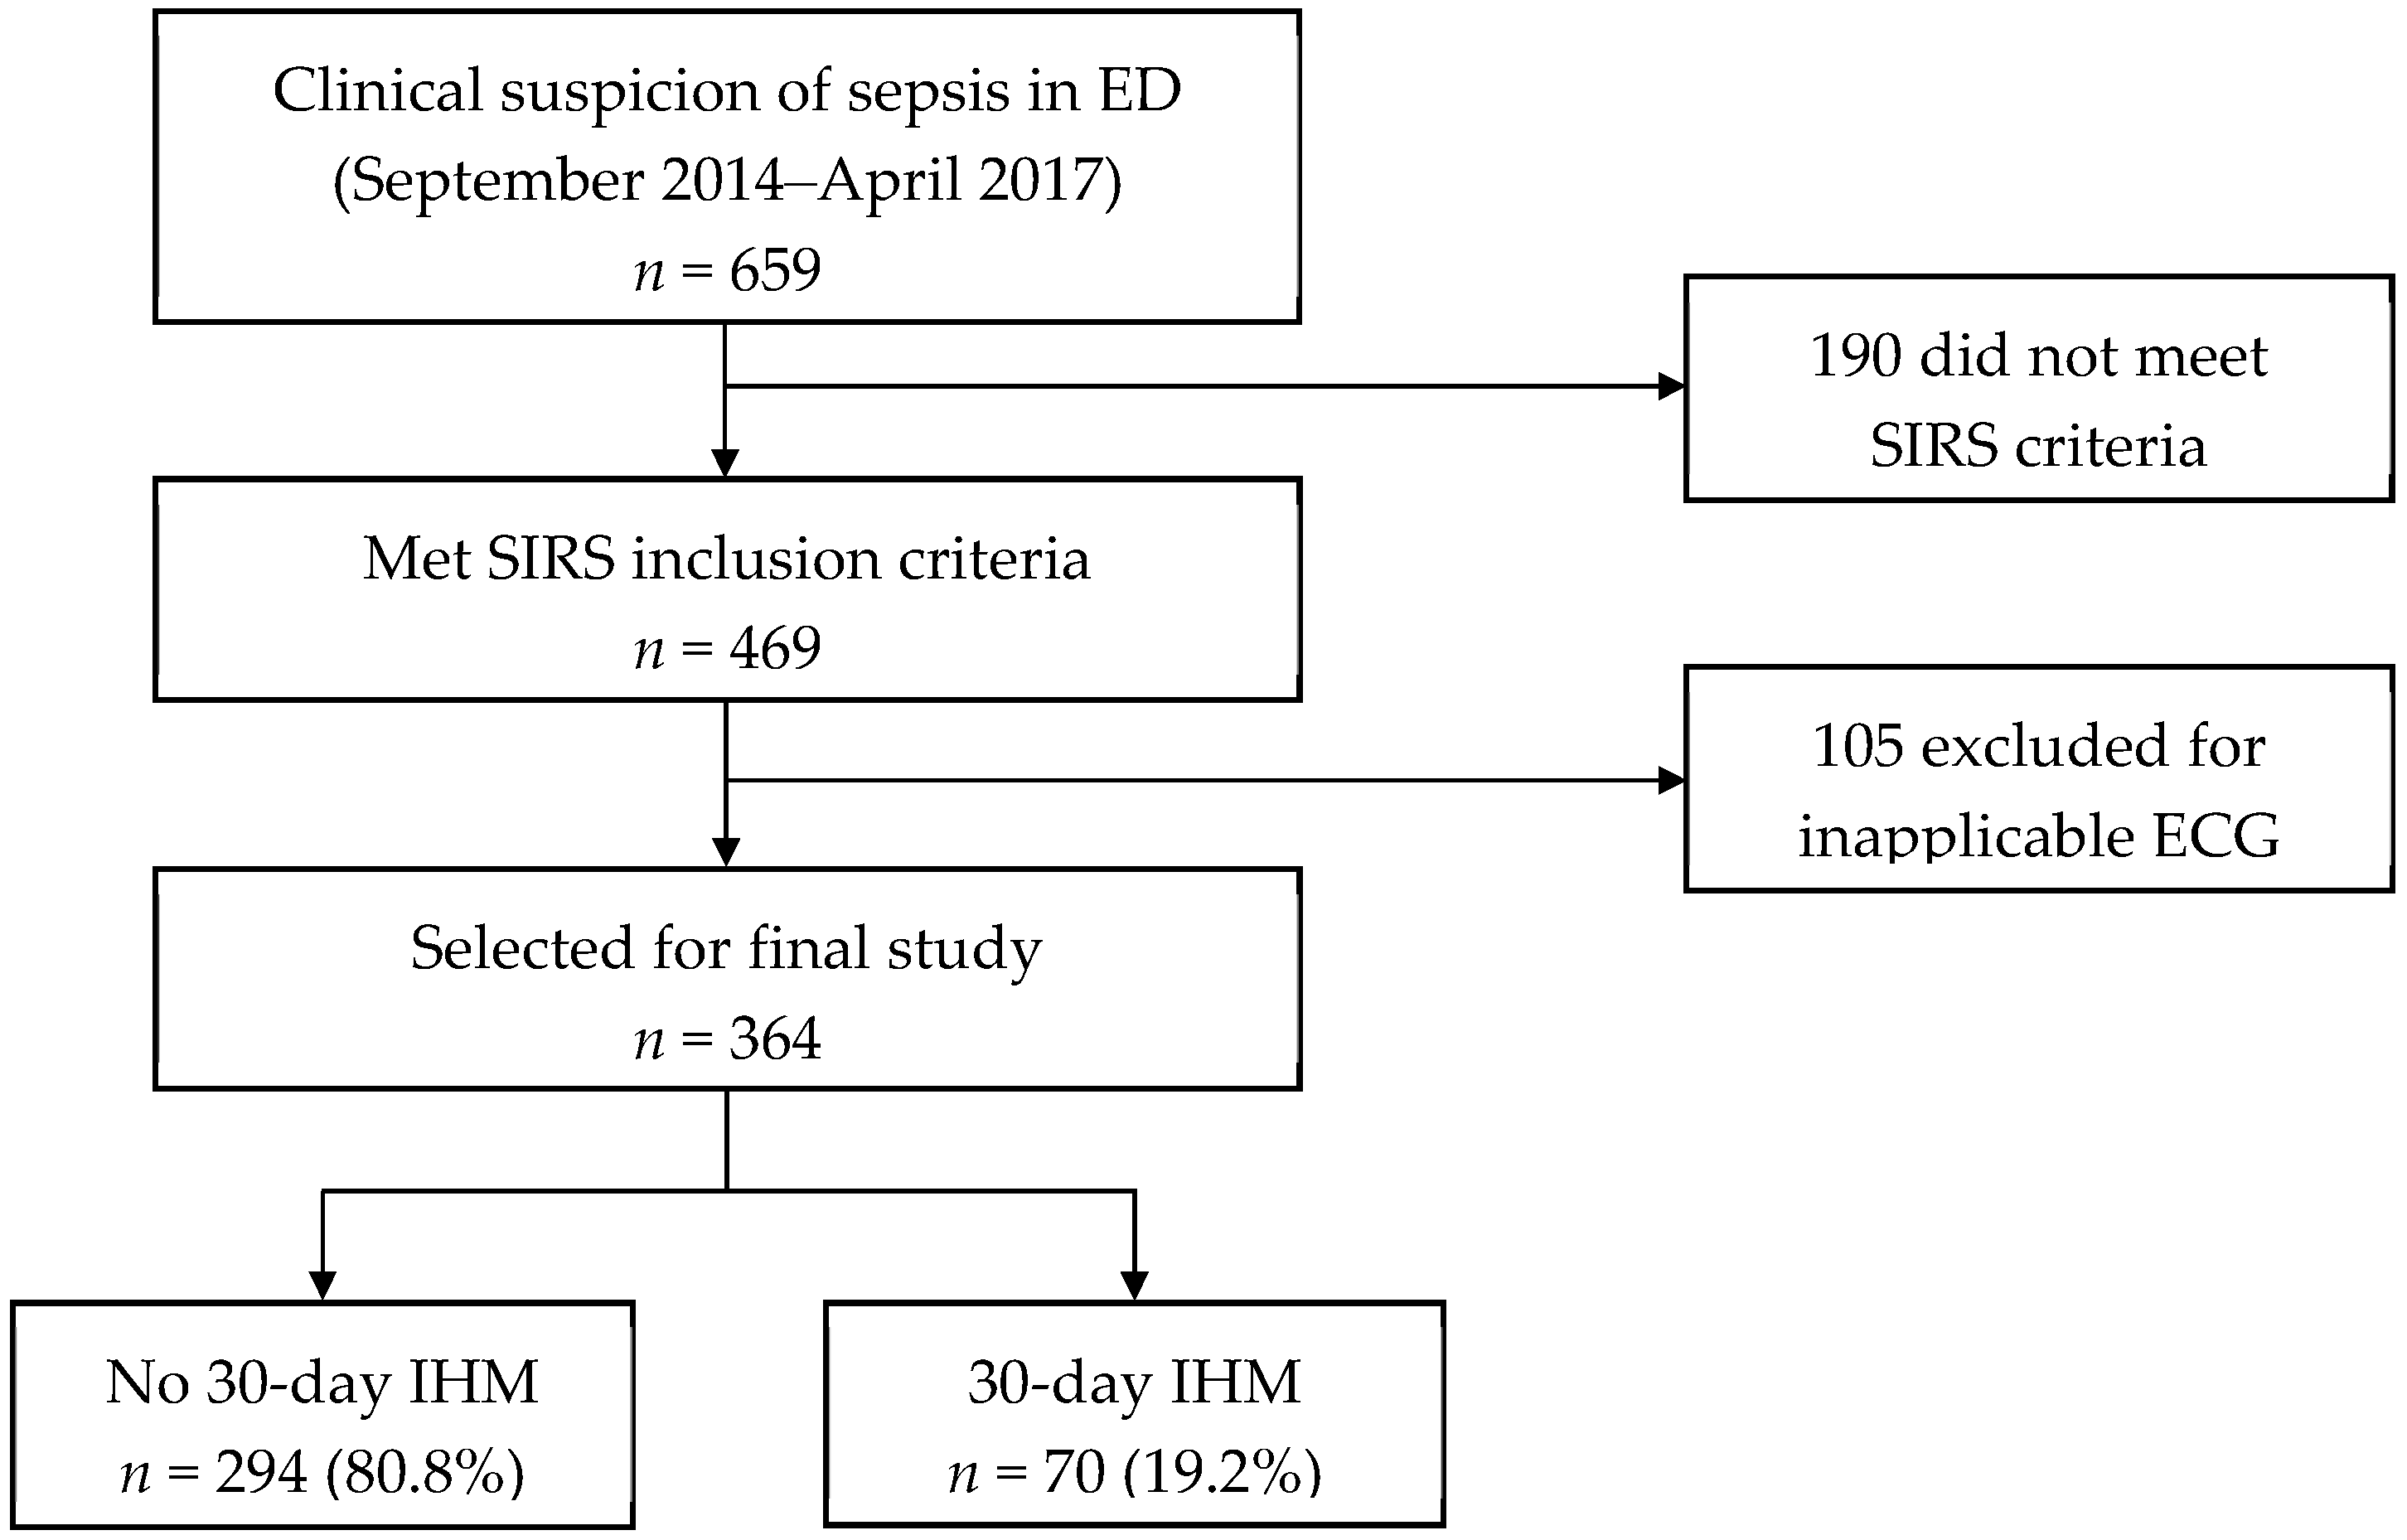
3.1. Patient Recruitment and Outcomes

Figure 1 shows the patient recruitment flow chart. A total of 659 patients clinically suspected to have sepsis presented at the ED between September 2014 to April 2017. One hundred and ninety patients did not meet the criteria for SIRS and were excluded. Of the 469 patients that met SIRS criteria, 105 were excluded for having an inapplicable ECG reading. Three hundred and sixty-four patients were selected for the final study, with 70 (19.2%) meeting the primary outcome of 30-day IHM.

3.2. Baseline Characteristics, Clinical and Heart Rate Variability Parameters

Univariable analysis of patient baseline characteristics and clinical parameters are presented in Table 1. Patients who met the primary outcome were older and presented with a lower systolic blood pressure, higher respiratory rate, lower temperature and lower GCS. During their stay in the ED, the worst recorded values of systolic blood pressure, respiratory rate and GCS were also more abnormal for this group of patients.
Univariable analyses of HRV parameters are shown in Table 2. Patients who met the primary outcome had an increased standard deviation of NN (beat-to-beat) time intervals (SD NN), standard deviation of heart rate (SD HR), root mean square of successive NN interval differences (RMSSD), number of pairs of successive NN intervals that differ by more than 50 milliseconds (NN50), proportion of successive NN intervals that differ by more than 50 milliseconds (pNN50), baseline width of the NN interval histogram (TINN), high frequency (HF) power (ms2), HF power (nu) and Poincaré plot standard deviation (SD) 1. Parameters which were decreased include low-frequency (LF) power (nu), LF/HF, detrended fluctuation analysis (DFA) alpha 1 and DFA alpha 2.

3.3. Components of Logistic Regression Models

Table 3 shows independent predictors of 30-day IHM as included in the combination model and the rapid triage model. The combination model is comprised of two clinical variables (presenting temperature and the worst respiratory rate recorded), one HRV parameter (Poincaré plot standard deviation 2), four MEDS score variables (terminal illness, lower respiratory tract infection (LRTI) suspicion, respiratory distress, and septic shock), and one SOFA variable (platelet count). The rapid triage model is comprised of four clinical variables (presenting systolic blood pressure, respiratory rate, temperature, and GCS) and one HRV parameter (DFA alpha 2). Collinearity testing revealed no multicollinearity between independent predictors for both models (data not shown).

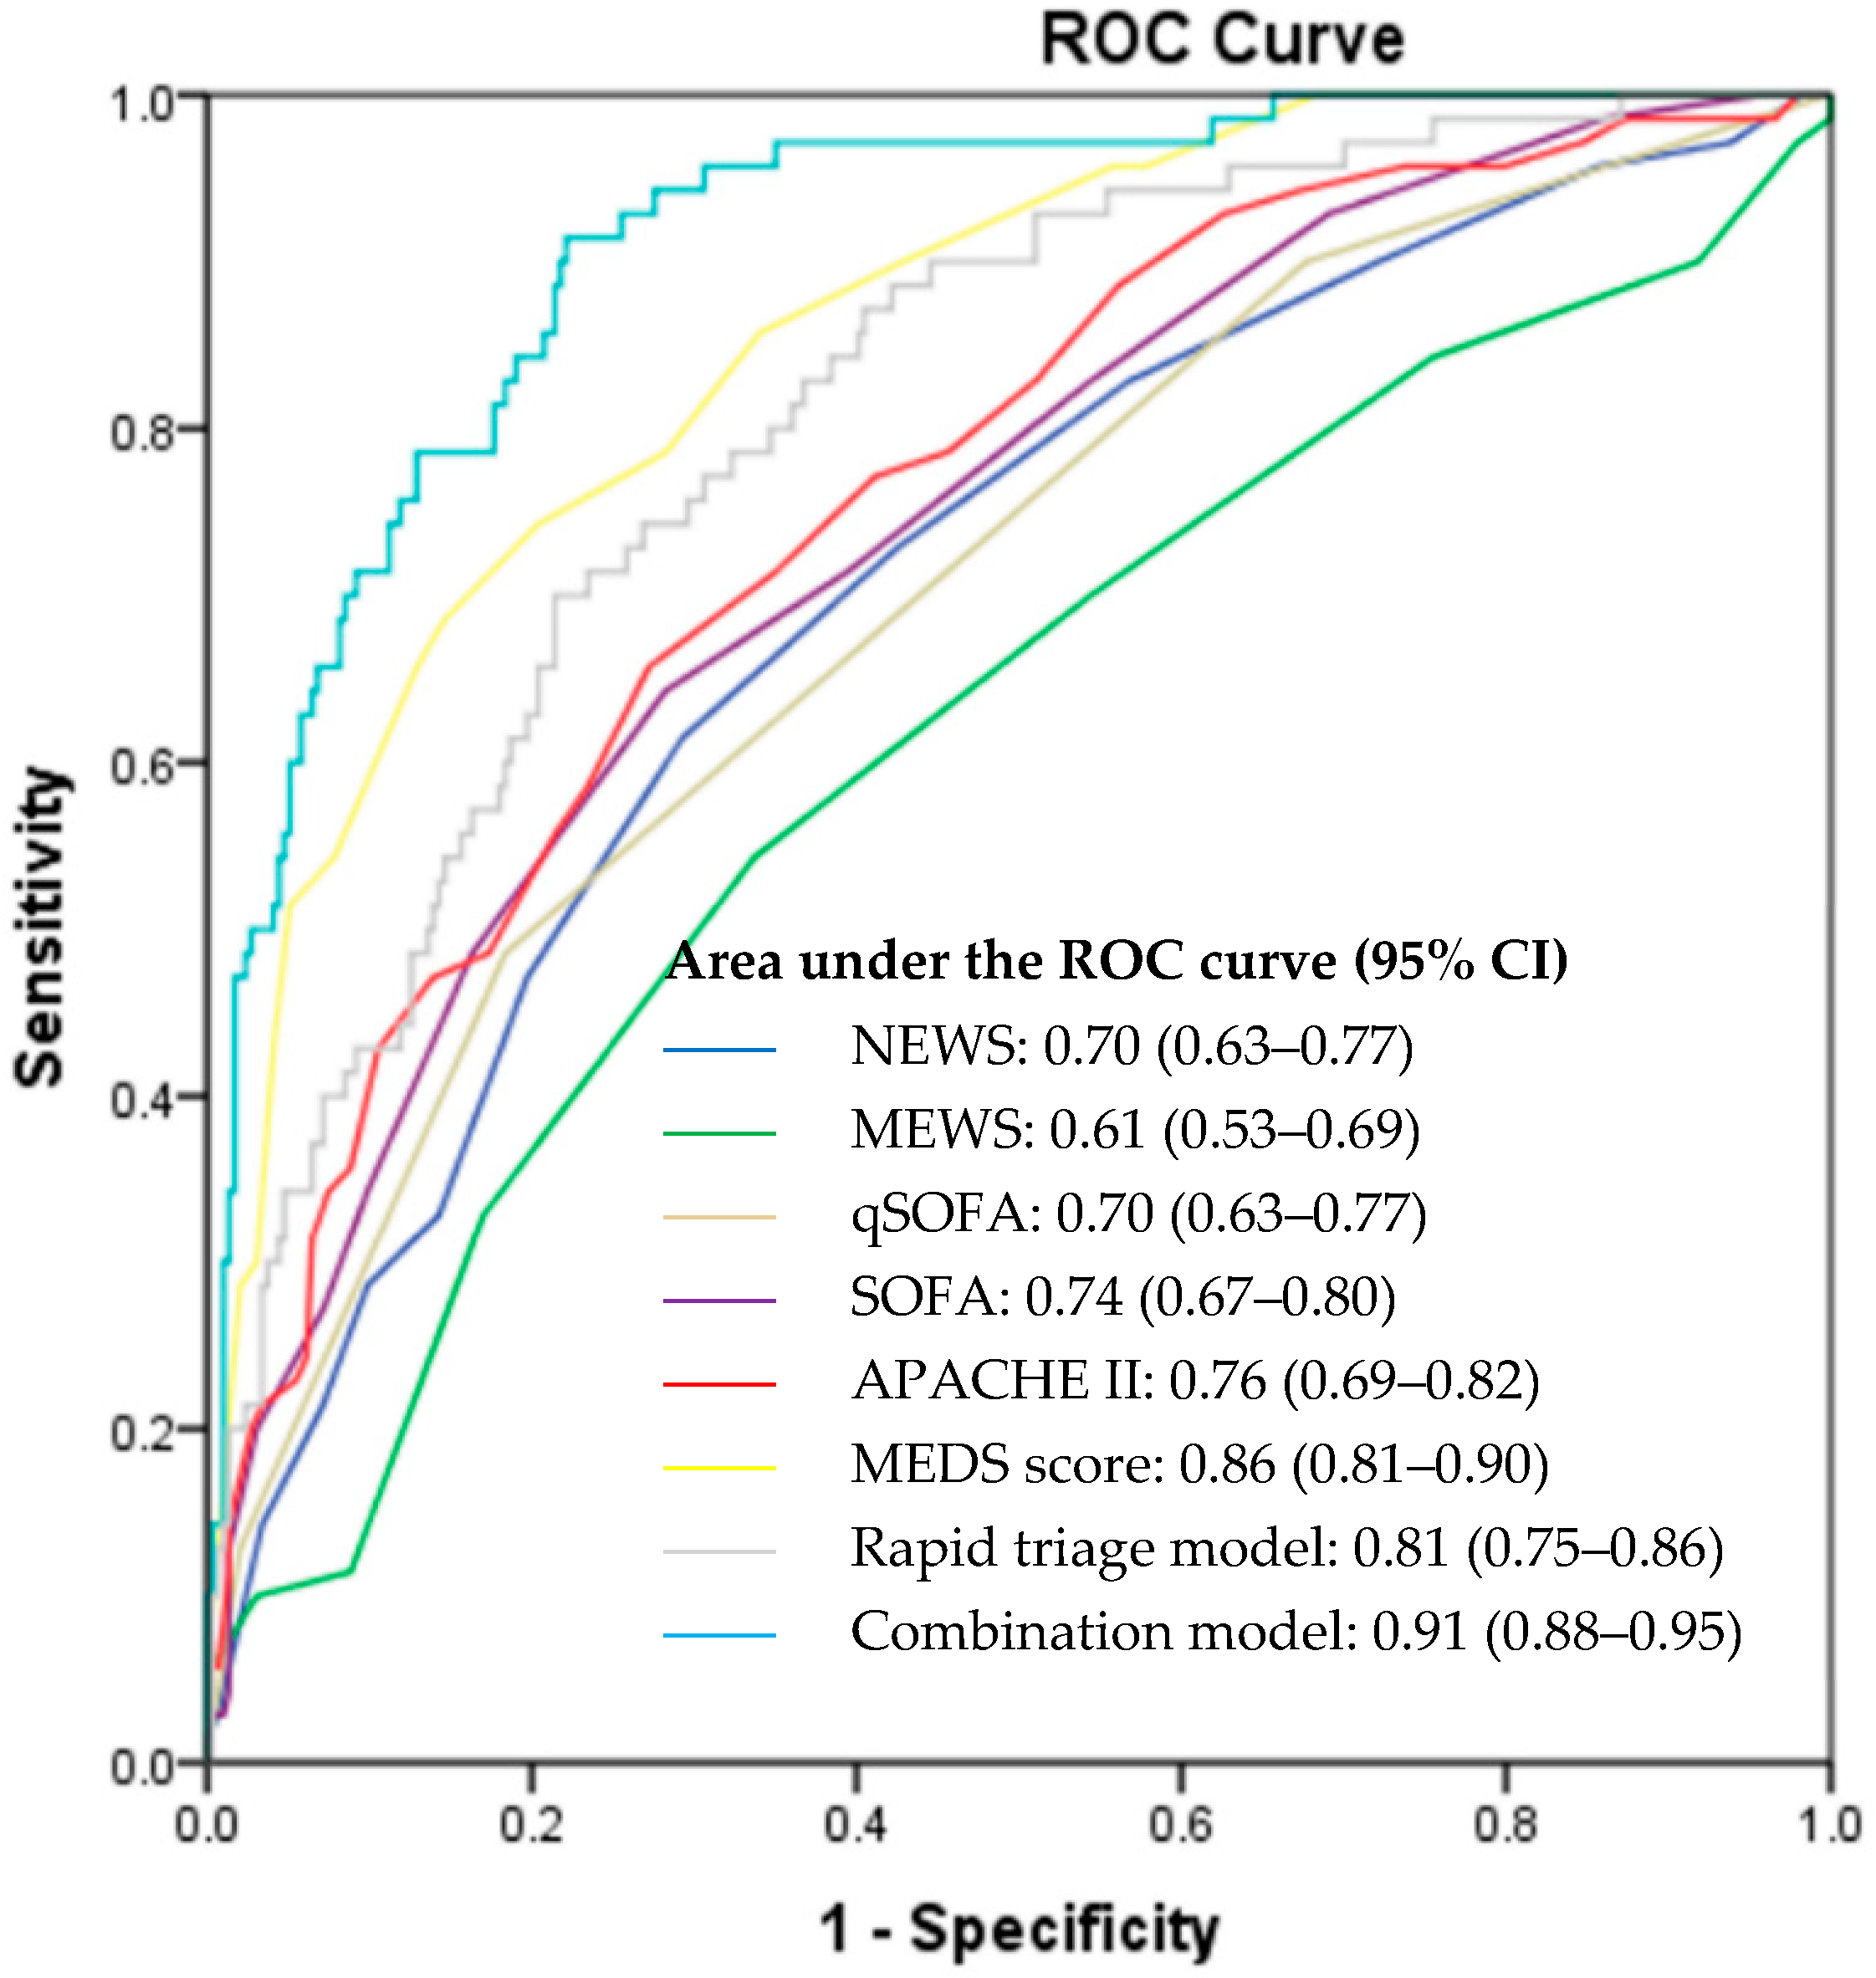
3.4. Prediction of Primary Outcome

Figure 2 illustrates the ROC curves of the rapid triage model, combination model and calculated disease severity scores for the prediction of 30-day IHM. Among the scores which utilized information determined from the initial patient presentation, the rapid triage model outperformed NEWS, MEWS, and qSOFA with an area under the ROC curve (AUC) of 0.81 (95% CI: 0.75–0.86), 0.70 (95% CI: 0.63–0.77), 0.61 (95% CI: 0.53–0.69), and 0.70 (95% CI: 0.63–0.77), respectively. For scoring systems which utilized information obtained throughout the patient’s ED stay, the combination model displayed superior predictive ability as compared to SOFA, APACHE II, and MEDS scores, with an AUC of 0.91 (95% CI: 0.88–0.95), 0.74 (95% CI: 0.67–0.80), 0.76 (95% CI: 0.69–0.82), and 0.86 (95% CI: 0.81–0.90), respectively.
Table 4 displays the sensitivities, specificities, positive predictive values (PPV), and negative predictive values (NPV) of the rapid triage model, combination model, and calculated disease severity scores. The rapid triage model sensitivity, specificity, PPV and NPV were 68.6%, 78.6%, 43.2%, and 91.3%, respectively, while the combination model sensitivity, specificity, PPV and NPV were 91.4%, 77.9%, 49.6%, and 97.4%, respectively.

4. Discussion

In this study, we derived a combination model which exhibits superior predictive ability over established disease severity scoring systems for the prediction of 30-day IHM in septic patients presenting at the ED. A second model (rapid triage model) that can be quickly determined on patient presentation outperforms commonly used quick scoring systems (qSOFA, NEWS, and MEWS) and even the comprehensive scores (SOFA and APACHE II) while requiring less time, information and procedures to derive. With their enhanced predictive ability and ease of use, the models created can be used to risk-stratify the patient at two crucial timepoints: early risk-stratification with the rapid triage model on presentation, and re-stratification with the combination model for improved accuracy on transfer out of the ED.
In the creation of the combination model, we sought to maximize the predictive ability in a scoring system which utilized all available information gathered over a patient’s time at the ED. The combination model achieved an AUC of 0.91 (95% CI: 0.88–0.95) and included two clinical variables (presenting temperature and worst respiratory rate recorded), one HRV parameter (Poincaré plot standard deviation 2), four MEDS score variables (terminal illness, LRTI suspicion, respiratory distress, and septic shock) and one SOFA variable (platelet count). The predictive performance of the combination model exceeded the other disease severity scores, and the variables included can be used as information regarding significant factors which influence mortality. MEDS score variables included in the combination score had the strongest predictive values (respiratory distress adjusted odds ratio (aOR): 7.17 (95% CI: 1.88–27.40); terminal illness aOR: 5.93 (95% CI: 2.85–12.35)) while the HRV parameter included contributed to a lesser extent (Poincaré plot standard deviation 2 aOR: 1.03 (95% CI: 1.01–1.04)). The creation of the combination model, however, may have been limited by the study sample size. APACHE II and SOFA variables were ordinal and included up to eight ordinal categories in which patients would be sorted. As we excluded variables that had zero counts for any category, several APACHE II variables (mean arterial pressure, respiratory distress, and serum sodium) were not considered as covariables in the creation of the combination model even when found to be statistically different on univariable analysis. The predictive ability of the combination model may therefore be further enhanced given a larger sample size that would allow for the consideration of the omitted variables.
The rapid triage model utilizes parameters which can be readily ascertained on initial patient presentation. Demographic characteristics and vital signs have long been used for a quick assessment of the patient but can be supplemented with HRV analysis. On logistic regression, HRV parameter DFA alpha 2 was included together with presenting systolic blood pressure, respiratory rate, temperature, and GCS as independent predictors of 30-day IHM. Among the independent predictors, DFA alpha 2 had the strongest predictive value (aOR: 0.28 (95% CI: 0.14–0.57)), emphasizing the utility of HRV analysis in supplementing information derived from the traditional vital signs. DFA describes the relationship between successive RR intervals over different time frames, with DFA alpha 1 representing short-term fluctuations and DFA alpha 2 representing long-term fluctuations [31]. Although the physiological meaning of DFA has not been well elucidated, it has been postulated that short-term fluctuations represent the baroreceptor reflex, while long-term fluctuations reflect regulatory mechanisms of the heart beat cycle [31]. DFA has also been found to be related to LF power, HF power, and the LF/HF ratio [33], possibly integrating the interplay of sympathetic and parasympathetic influences into its calculations. In our study, an increase in DFA alpha 2 is associated with a significant decrease in the odds for 30-day IHM. The ability of DFA to predict deterioration or risk of mortality in septic patients is consistent with other studies [20,25]. Apart from its use in septic patients, DFA has also been found to be a predictor for outcome after myocardial infarction [34] and in heart failure [35].
The performance of the established disease severity scores in our patient population may also be assessed in this study. We note that scores which utilized basic, easily obtainable parameters (NEWS, MEWS, and qSOFA) had poorer performance on ROC analysis as compared to scores which included more detailed information (SOFA, APACHE II, and MEDS score). The more comprehensive scores offered better predictive capability, at the cost of additional time and procedures required for the gathering of information. Among the rapid scoring systems, qSOFA (AUC: 0.70) and NEWS (AUC: 0.70) exhibited an improved predictive ability as compared to MEWS (AUC: 0.61). Among the comprehensive scoring systems, MEDS score (AUC: 0.86) exhibited a superior predictive ability as compared to SOFA (AUC: 0.74) and APACHE II (AUC: 0.76). It is interesting to note that qSOFA, which is comprised of only three variables (GCS < 15, respiratory rate ≥ 22, and systolic blood pressure ≤ 100) to be selected in binary format (yes or no), shows an appreciable predictive ability for 30-day IHM and has an AUC superior to NEWS and similar to MEWS, both of which require more variables for calculation. The utility and applicability of qSOFA for initial triage, which can be employed quickly and with minimal information, is thus highlighted in this study. Among the comprehensive scoring systems, the MEDS score demonstrated the highest AUC. This is not unexpected as the MEDS score was purpose-built for use in the population of septic patients presenting at the ED. SOFA and APACHE II were developed for use in the general ICU population, and although both perform well, they require more invasive procedures for their calculations.
There are several limitations to this study. First, our predictive models were able to achieve good AUC values on derivation but will require external validations to evaluate their effectiveness. Second, we excluded a sizable portion of septic patients (22.4%) due to ECG readings which were not suitable for HRV analysis. This patient group would likely have a distinct clinical profile, and our interpretation of findings are therefore limited only to patients with applicable ECG readings. Third, as our study was limited to sicker patients triaged to PACS 1 and 2, further studies will be required for generalization to all patients presenting at the ED. Our future work aims to enhance the model’s robustness by utilizing novel heart rate n-variability (HRnV) measures [36] to better interrogate the autonomic modulation of the cardiovascular system during sepsis. These additional HRnV measurements could improve the predictive ability of conventional HRV-based models.

5. Conclusions

A combination model incorporating best-performing clinical and HRV parameters alongside individual components of the SOFA and MEDS score shows a superior predictive ability for the mortality risk-stratification (30-day IHM) of septic patients presenting at the ED. With its enhanced predictive ability and practical ease of use, the combination model can provide additional information on the severity of sepsis and be considered for implementation to inform diagnostic and therapeutic decisions, patient disposition and resource allocation, as well as for patient classification for administrative or research purposes.

Author Contributions

Conceptualization, J.Z.P., M.E.H.O. and N.L.; supervision, M.E.H.O. and N.L.; data curation, J.Z.P., Z.X.K. and M.I.S.; formal analysis, J.Z.P., S.F.-C. and N.L.; funding acquisition, J.Z.P. and N.L.; methodology, J.Z.P., S.F.-C., T.T., C.J.W., T.H.W., A.F.W.H. and N.L.; project administration, J.Z.P., Z.X.K., M.E.H.O. and N.L.; writing—original draft, J.Z.P., M.E.H.O. and N.L.; writing—review and editing, J.Z.P., S.F.-C., Z.X.K., M.I.S., T.T., C.J.C., T.H.W., A.F.W.H., M.E.H.O. and N.L.

Funding

This study was supported by the AM-ETHOS Duke-NUS Medical Student Fellowship from the Joint Office of Academic Medicine of Duke-NUS Medical School and Singapore Health Services. Grant number: AM-ETHOS01/FY2018/30-A30.

Acknowledgments

The authors would like to express thanks and gratitude for all contributions made from doctors, nurses, and research assistants from the Department of Emergency Medicine, Singapore General Hospital.

Conflicts of Interest

The authors declare no conflict of interest. The funder had no role in the design of the study; in the collection, analyses, or interpretation of data; in the writing of the manuscript, or in the decision to publish the results.

Appendix A

Table A1. Information required for the calculation of disease severity scores.
Variables NEWSMEWSqSOFASOFAAPACHE IIMEDS Score
Age
Nursing home resident
Chronic health problems
Terminal illness
Heart rate
Blood pressure
Respiratory rate/supplementary oxygen
Temperature
PaO2
SpO2
FiO2
AVPU
GCS
AMS
Hematocrit
White blood cell count
Percentage bands
Platelet count
Serum sodium
Serum potassium
Serum creatinine
Arterial pH or serum bicarbonate
Serum bilirubin
Suspicion of LRTI
Septic shock
Acute renal failure
Use of vasopressors
AMS: altered mental status; APACHE II: Acute Physiology and Chronic Health Evaluation II; AVPU: alert, verbal, pain, unresponsive; FiO2: fraction of inspired oxygen; GCS: Glasgow coma scale; LRTI: lower respiratory tract infection; MEDS: Mortality in Emergency Department Sepsis; MEWS: Modified Early Warning Score; NEWS: National Early Warning Score; PaO2: partial pressure of arterial oxygen; qSOFA: Quick Sequential Organ Failure Assessment; SOFA: Sequential Organ Failure Assessment; SpO2: peripheral capillary oxygen saturation.

References

  1. Singer, M.; Deutschman, C.S.; Seymour, C.W.; Shankar-Hari, M.; Annane, D.; Bauer, M.; Bellomo, R.; Bernard, G.R.; Chiche, J.-D.; Coopersmith, C.M.; et al. The Third International Consensus Definitions for Sepsis and Septic Shock (Sepsis-3). JAMA 2016, 315, 801–810. [Google Scholar] [CrossRef] [PubMed] [Green Version]
  2. Fleischmann, C.; Scherag, A.; Adhikari, N.K.; Hartog, C.S.; Tsaganos, T.; Schlattmann, P.; Angus, D.C.; Reinhart, K.; the International Forum of Acute Care Trialists. Assessment of Global Incidence and Mortality of Hospital-treated Sepsis. Current Estimates and Limitations. Am. J. Respir. Crit. Care Med. 2016, 193, 259–272. [Google Scholar] [CrossRef]
  3. Iwashyna, T.J.; Ely, E.W.; Smith, D.M.; Langa, K.M. Long-term cognitive impairment and functional disability among survivors of severe sepsis. JAMA 2010, 304, 1787–1794. [Google Scholar] [CrossRef]
  4. Bone, R.C.; Balk, R.A.; Cerra, F.B.; Dellinger, R.P.; Fein, A.M.; Knaus, W.A.; Schein, R.; Sibbald, W.J. Definitions for sepsis and organ failure and guidelines for the use of innovative therapies in sepsis. The ACCP/SCCM Consensus Conference Committee. American College of Chest Physicians/Society of Critical Care Medicine. Chest 1992, 101, 1644–1655. [Google Scholar] [CrossRef]
  5. Knaus, W.A.; Wagner, D.P.; Lynn, J. Short-term mortality predictions for critically ill hospitalized adults: Science and ethics. Science 1991, 254, 389–394. [Google Scholar] [CrossRef] [PubMed]
  6. Naylor, C.D.; Baigrie, R.S.; Goldman, B.S.; Cairns, J.A.; Beanlands, D.S.; Berman, N.; Borts, D.; Fitchett, D.H.; Haq, A.; Hess, A. Assigning priority to patients requiring coronary revascularization: Consensus principles from a panel of cardiologists and cardiac surgeons. Can. J. Cardiol. 1991, 7, 207–213. [Google Scholar]
  7. Prytherch, D.R.; Smith, G.B.; Schmidt, P.E.; Featherstone, P.I. ViEWS—Towards a national early warning score for detecting adult inpatient deterioration. Resuscitation 2010, 81, 932–937. [Google Scholar] [CrossRef]
  8. Subbe, C.P.; Kruger, M.; Rutherford, P.; Gemmel, L. Validation of a modified Early Warning Score in medical admissions. QJM 2001, 94, 521–526. [Google Scholar] [CrossRef] [Green Version]
  9. Vincent, J.L.; Moreno, R.; Takala, J.; Willatts, S.; De Mendonça, A.; Bruining, H.; Reinhart, C.K.; Suter, P.M.; Thijs, L.G. The SOFA (Sepsis-related Organ Failure Assessment) score to describe organ dysfunction/failure. On behalf of the Working Group on Sepsis-Related Problems of the European Society of Intensive Care Medicine. Intensive Care Med. 1996, 22, 707–710. [Google Scholar] [CrossRef] [PubMed]
  10. Seymour, C.W.; Liu, V.X.; Iwashyna, T.J.; Brunkhorst, F.M.; Rea, T.D.; Scherag, A.; Rubenfeld, G.; Kahn, J.M.; Shankar-Hari, M.; Singer, M.; et al. Assessment of Clinical Criteria for Sepsis: For the Third International Consensus Definitions for Sepsis and Septic Shock (Sepsis-3). JAMA 2016, 315, 762–774. [Google Scholar] [CrossRef]
  11. Knaus, W.A.; Draper, E.A.; Wagner, D.P.; Zimmerman, J.E. APACHE II: A severity of disease classification system. Crit. Care Med. 1985, 13, 818–829. [Google Scholar] [CrossRef]
  12. Shapiro, N.I.; Wolfe, R.E.; Moore, R.B.; Smith, E.; Burdick, E.; Bates, D.W. Mortality in Emergency Department Sepsis (MEDS) score: A prospectively derived and validated clinical prediction rule. Crit. Care Med. 2003, 31, 670–675. [Google Scholar] [CrossRef] [PubMed]
  13. Samsudin, M.I.; Liu, N.; Prabhakar, S.M.; Chong, S.-L.; Lye, W.K.; Koh, Z.X.; Guo, D.; Rajesh, R.; Ho, A.F.W.; Ong, M.E.H. A novel heart rate variability based risk prediction model for septic patients presenting to the emergency department. Medicine 2018, 97, e10866. [Google Scholar] [CrossRef]
  14. Macdonald, S.P.; Arendts, G.; Fatovich, D.M.; Brown, S.G. Comparison of PIRO, SOFA, and MEDS scores for predicting mortality in emergency department patients with severe sepsis and septic shock. Acad. Emerg. Med. 2014, 21, 1257–1263. [Google Scholar] [CrossRef]
  15. Williams, J.M.; Greenslade, J.H.; Chu, K.; Brown, A.F.; Lipman, J. Severity Scores in Emergency Department Patients with Presumed Infection: A Prospective Validation Study. Crit. Care Med. 2016, 44, 539–547. [Google Scholar] [CrossRef]
  16. Hilderink, M.J.; Roest, A.A.; Hermans, M.; Keulemans, Y.C.; Stehouwer, C.D.; Stassen, P.M. Predictive accuracy and feasibility of risk stratification scores for 28-day mortality of patients with sepsis in an emergency department. Eur. J. Emerg. Med. 2015, 22, 331–337. [Google Scholar] [CrossRef]
  17. Malik, M.; Camm, A.J.; Bigger, J.T.; Breithardt, G.; Cerutti, S.; Cohen, R.J. Heart rate variability. Standards of measurement, physiological interpretation, and clinical use. Task Force of the European Society of Cardiology and the North American Society of Pacing and Electrophysiology. Eur. Heart J. 1996, 17, 354–381. [Google Scholar] [CrossRef]
  18. Scheff, J.D.; Griffel, B.; Corbett, S.A.; Calvano, S.E.; Androulakis, I.P. On heart rate variability and autonomic activity in homeostasis and in systemic inflammation. Math. Biosci. 2014, 252, 36–44. [Google Scholar] [CrossRef] [PubMed] [Green Version]
  19. Barnaby, D.P.; Fernando, S.M.; Ferrick, K.J.; Herry, C.L.; Seely, A.J.E.; Bijur, P.E.; Gallagher, J. Use of the low-frequency/high-frequency ratio of heart rate variability to predict short-term deterioration in emergency department patients with sepsis. Emerg. Med. J. 2018, 35, 96–102. [Google Scholar] [CrossRef] [PubMed]
  20. Barnaby, D.P.; Fernando, S.M.; Herry, C.L.; Scales, N.B.; Gallagher, E.J.; Seely, A.J.E. Heart Rate Variability, Clinical and Laboratory Measures to Predict Future Deterioration in Patients Presenting with Sepsis. Shock 2019, 51, 416–422. [Google Scholar] [CrossRef]
  21. Barnaby, D.; Ferrick, K.; Kaplan, D.T.; Shah, S.; Bijur, P.; Gallagher, E.J. Heart rate variability in emergency department patients with sepsis. Acad. Emerg. Med. 2002, 9, 661–670. [Google Scholar] [CrossRef]
  22. De Castilho, F.M.; Ribeiro, A.L.P.; da Silva, J.L.P.; Nobre, V.; de Sousa, M.R. Heart rate variability as predictor of mortality in sepsis: A prospective cohort study. PLoS ONE 2017, 12, e0180060. [Google Scholar] [CrossRef]
  23. Chen, W.L.; Kuo, C.D. Characteristics of heart rate variability can predict impending septic shock in emergency department patients with sepsis. Acad. Emerg. Med. 2007, 14, 392–397. [Google Scholar] [CrossRef] [PubMed]
  24. Chen, W.L.; Chen, J.H.; Huang, C.C.; Kuo, C.D.; Huang, C.I.; Lee, L.S. Heart rate variability measures as predictors of in-hospital mortality in ED patients with sepsis. Am. J. Emerg. Med. 2008, 26, 395–401. [Google Scholar] [CrossRef] [PubMed]
  25. Arnold, R.; Green, G.; Bravi, A.; Hollenberg, S.; Seely, A. Impaired heart rate variability predicts clinical deterioration and progressive organ failure in emergency department sepsis patients. Crit. Care 2012, 16, P37. [Google Scholar] [CrossRef]
  26. Prabhakar, S.M.; Tagami, T.; Liu, N.; Samsudin, M.I.; Ng, J.C.J.; Koh, Z.X.; Ong, M.E.H. Combining quick sequential organ failure assessment score with heart rate variability may improve predictive ability for mortality in septic patients at the emergency department. PLoS ONE 2019, 14, e0213445. [Google Scholar] [CrossRef]
  27. Simpson, S.Q. New Sepsis Criteria: A Change We Should Not Make. Chest 2016, 149, 1117–1118. [Google Scholar] [CrossRef]
  28. Fernando, S.M.; Tran, A.; Taljaard, M.; Cheng, W.; Rochwerg, B.; Seely, A.J.E.; Perry, J.J. Prognostic Accuracy of the Quick Sequential Organ Failure Assessment for Mortality in Patients with Suspected Infection: A Systematic Review and Meta-analysis. Ann. Intern. Med. 2018, 168, 266–275. [Google Scholar] [CrossRef]
  29. Van der Woude, S.W.; van Doormaal, F.F.; Hutten, B.A.; Nellen, F.J.; Holleman, F. Classifying sepsis patients in the emergency department using SIRS, qSOFA or MEWS. Neth. J. Med. 2018, 76, 158–166. [Google Scholar]
  30. Usman, O.A.; Usman, A.A.; Ward, M.A. Comparison of SIRS, qSOFA, and NEWS for the early identification of sepsis in the Emergency Department. Am. J. Emerg. Med. 2018. [Google Scholar] [CrossRef] [PubMed]
  31. Shaffer, F.; Ginsberg, J.P. An Overview of Heart Rate Variability Metrics and Norms. Front. Public Health 2017, 5, 258. [Google Scholar] [CrossRef]
  32. Pandharipande, P.P.; Shintani, A.K.; Hagerman, H.E.; St Jacques, P.J.; Rice, T.W.; Sanders, N.W.; Ware, L.B.; Bernard, G.R.; Ely, E.W. Derivation and validation of Spo2/Fio2 ratio to impute for Pao2/Fio2 ratio in the respiratory component of the Sequential Organ Failure Assessment score. Crit. Care Med. 2009, 37, 1317–1321. [Google Scholar] [CrossRef] [PubMed]
  33. Willson, K.; Francis, D.P.; Wensel, R.; Coats, A.J.; Parker, K.H. Relationship between detrended fluctuation analysis and spectral analysis of heart-rate variability. Physiol. Meas. 2002, 23, 385–401. [Google Scholar] [CrossRef] [PubMed]
  34. Huikuri, H.V.; Makikallio, T.H.; Peng, C.K.; Goldberger, A.L.; Hintze, U.; Moller, M. Fractal correlation properties of R-R interval dynamics and mortality in patients with depressed left ventricular function after an acute myocardial infarction. Circulation 2000, 101, 47–53. [Google Scholar] [CrossRef]
  35. Ho, K.K.; Moody, G.B.; Peng, C.K.; Mietus, J.E.; Larson, M.G.; Levy, D.; Goldberger, A.L. Predicting survival in heart failure case and control subjects by use of fully automated methods for deriving nonlinear and conventional indices of heart rate dynamics. Circulation 1997, 96, 842–848. [Google Scholar] [CrossRef]
  36. Liu, N.; Guo, D.; Koh, Z.X.; Ho, A.F.W.; Ong, M.E.H. Heart Rate n-Variability (HRnV): A Novel Representation of Beat-to-Beat Variation in Electrocardiogram. bioRxiv 2019, 449504. [Google Scholar] [CrossRef]
Figure 1. Patient recruitment flowchart. ECG: electrocardiogram; ED: emergency department; IHM: in-hospital mortality; SIRS: systemic inflammatory response syndrome.
Ijerph 16 01725 g001
Figure 2. Receiver operator characteristic (ROC) curves for the prediction of 30-day IHM. APACHE II: Acute Physiology and Chronic Health Evaluation II; CI: confidence interval; IHM: in-hospital mortality; MEDS: Mortality in Emergency Department Sepsis; MEWS: Modified Early Warning Score; NEWS: National Early Warning Score; qSOFA: Quick Sequential Organ Failure Assessment; ROC: receiver operating characteristic; SOFA: Sequential Organ Failure Assessment.
Ijerph 16 01725 g002
Table 1. Baseline characteristics and clinical parameters.
VariablesNo 30-Day IHM
(n = 294)
30-Day IHM
(n = 70)
p-Value
Age in years, mean (SD)65.7 (16.4)72.8 (15.0)0.001
Gender, n (%) 0.595
  Male 147 (50.0)32 (45.7)
  Female 147 (50.0)38 (54.3)
Race, n (%) 0.659
  Chinese 213 (72.4)53 (75.7)
  Malay 44 (15.0)7 (10.0)
  Indian22 (7.5)7 (10.0)
  Other 15 (5.1)3 (4.3)
Medical history, n (%)
  Ischemic heart disease76 (25.9)23 (32.9)0.236
  Diabetes 118 (40.1)27 (38.6)0.892
  Hypertension 162 (55.1)35 (50.0)0.505
  Cancer 88 (29.9)25 (35.7)0.389
  Serious infection 121 (41.2)30 (42.9)0.789
Drug history, n (%)
  Beta-blocker96 (32.7)16 (22.9)0.116
  Digoxin 11 (3.7)2 (2.9)1.000
  Calcium channel blocker 73 (24.8)17 (24.3)1.000
  Amiodarone 4 (1.4)0 (0.0)1.000
Vital signs at presentation, mean (SD)
  Heart rate, bpm117.5 (21.8)116.7 (23.4)0.622
  Systolic blood pressure, mm Hg115.5 (33.1)103.3 (31.1)0.004
  Diastolic blood pressure, mm Hg63.4 (17.7)60.2 (16.0)0.200
  Respiratory rate, bpm20.2 (3.9)23.4 (5.7)<0.001
  Temperature, °C38.1 (1.2)37.2 (1.4)<0.001
  Glasgow coma scale (3–15)13.4 (3.0)12.2 (3.9)0.002
Vital signs worst recorded, mean (SD)
  Systolic blood pressure, mm Hg96.0 (25.3)80.5 (21.3)<0.001
  Respiratory rate, bpm22.8 (5.3)27.9 (6.8)<0.001
  Glasgow coma scale (3–15) 13.2 (3.3)12.1 (3.9)0.002
WBC count, mean (SD)14.3 (7.2)14.0 (10.2)0.291
Source of infection, n (%) 0.041
  Respiratory 83 (28.2)32 (45.7)
  Urinary tract 71 (24.1)6 (8.6)
  Gastrointestinal 16 (5.4)5 (7.1)
  Musculoskeletal 11 (3.7)2 (2.9)
  Hepatobiliary21 (7.1)3 (4.3)
  Peritoneum3 (1.0)1 (1.4)
  Skin 10 (3.4)0 (0.0)
  Line 9 (3.1)0 (0.0)
  Cardiac 6 (2.0)2 (2.9)
  Central nervous system 1 (0.3)0 (0.0)
  Unknown 45 (15.3)16 (22.9)
  No infection 18 (6.1)3 (4.3)
Disposition from ED, n (%) <0.001
  General ward 251 (85.4)52 (74.3)
  High dependency 26 (8.8)3 (4.3)
  Intensive care unit17 (5.8)15 (21.4)
ED: emergency department; IHM: in-hospital mortality; WBC: white blood cell.
Table 2. Heart rate variability parameters.
Variable, Mean (SD)No 30-Day IHM (n = 294)30-Day IHM (n = 70)p-Value
Time domain
   Mean NN, s 559.20 (117.90)561.47 (130.81)0.866
   Standard deviation of NN, s21.96 (24.85)31.98 (34.38)0.050
   Mean heart rate, bpm 111.95 (21.44)112.79 (23.93)0.742
   Standard deviation of heart rate, bpm4.84 (5.87)6.78 (7.37)0.011
   RMSSD, s26.56 (39.08)42.66 (50.00)<0.001
   NN50, n48.60 (114.22)72.80 (121.94)<0.001
   pNN50, %7.47 (17.43)11.98 (20.12)<0.001
   NN triangular index3.87 (3.45)4.55 (5.39)0.918
   TINN137.60 (147.02)194.86 (180.16)0.004
Frequency domain
   Total power, ms2514.81 (1737.84)1276.95 (3254.90)0.176
   VLF power, ms2117.57 (307.02)254.08 (833.86)0.939
   LF power, ms2120.47 (476.99)305.57 (826.58)0.485
   HF power, ms2274.43 (1005.67)713.44 (1763.77)0.011
   LF power, nu47.32 (28.82)35.46 (25.76)0.002
   HF power, nu51.93 (28.33)63.73 (25.44)0.002
   LF/HF2.59 (4.47)1.65 (4.88)0.002
Non-linear domain
   Poincaré plot standard deviation 1, ms18.80 (27.66)30.19 (35.39)<0.001
   Poincaré plot standard deviation 2, ms23.05 (23.39)32.42 (34.39)0.147
   Approximate entropy0.98 (0.34)1.02 (0.35)0.304
   Sample entropy1.07 (0.55)1.13 (0.59)0.454
   DFA, alpha 10.67 (0.38)0.54 (0.27)0.016
   DFA, alpha 20.95 (0.42)0.71 (0.41)<0.001
DFA: detrended fluctuation analysis; HF: high frequency; IHM: in-hospital mortality; LF: low frequency; NN: beat-to-beat time interval; NN50: number of pairs of successive NN intervals that differ by more than 50 milliseconds; pNN50: proportion of successive NN intervals that differ by more than 50 milliseconds; RMSSD: root mean square of successive NN interval differences; TINN: baseline width of the NN interval histogram; VLF: very low frequency.
Table 3. Multivariable logistic regression models for prediction of 30-day IHM. The combination model utilizes information made available over the entire course of a patient’s emergency department stay. The rapid triage model utilizes variables that can be obtained within six minutes of patient presentation.
VariablesCombination ModelRapid Triage Model
Adjusted Odds Ratio (95% CI)
Clinical parameters
  Systolic blood pressure (presenting) 0.99 (0.98–1.00)
  Respiratory rate (presenting) 1.13 (1.06–1.20)
  Temperature (presenting)0.61 (0.45–0.81)0.60 (0.47–0.77)
  Glasgow coma scale (presenting) 0.91 (0.84–0.99)
  Respiratory rate (worst)1.09 (1.02–1.16)
HRV parameters
  Poincaré plot standard deviation 21.03 (1.01–1.04)
  DFA, alpha 2 0.28 (0.14–0.57)
MEDS score variables
  Terminal illness5.93 (2.85–12.35)
  LRTI suspicion3.09 (1.45–6.59)
  Respiratory distress7.17 (1.88–27.40)
  Septic shock3.11 (1.51–6.37)
SOFA variables
  Coagulation (platelet count)
    ≥150,000Reference
    100,00–149,9990.54 (0.11–2.58)
    50,000–99,9991.76 (0.48–6.52)
    20,000–49,9999.43 (1.89–47.07)
    <20,0001.19 (0.10–15.00)
CI: confidence interval; DFA: detrended fluctuation analysis; HRV: heart rate variability; LRTI: lower respiratory tract infection; MEDS: mortality in emergency department sepsis; SOFA: sequential organ failure assessment.
Table 4. Performance of scoring systems for the prediction of 30-day IHM.
Clinical ScoresSensitivity, % (95% CI)Specificity, % (95% CI)PPV, % (95% CI)NPV, % (95% CI)
Quick scoring systems
Rapid triage model ≥ 0.20168.6 (56.2–78.9)78.6 (73.3–83.0)43.2 (34.0–53.0)91.3 (87.0–94.3)
NEWS ≥ 861.4 (49.0–72.8)70.8 (65.2–75.9)33.3 (27.9–39.3)88.5 (85.0–91.3)
MEWS ≥ 654.3 (41.9–66.3)66.3 (60.6–71.7)27.7 (22.7–33.4)85.9 (82.3–88.9)
qSOFA ≥ 248.6 (36.4–60.8)81.6 (76.7–85.9)38.6 (30.9–47.0)87.0 (84.1–89.4)
Comprehensive scoring systems
Combination model ≥ 0.15691.4 (81.6–96.5)77.9 (72.6–82.4)49.6 (40.7–58.5)97.4 (94.3–99.0)
APACHE II ≥ 2365.7 (53.3–76.4)72.8 (67.3–77.7)36.5 (28.3–45.6)89.9 (85.2–93.3)
SOFA ≥ 664.3 (51.9–75.4)71.8 (66.3–76.8)35.2 (29.6–41.1)89.4 (85.9–92.1)
MEDS ≥ 1274.3 (62.4–84.0)79.6 (74.5–84.1)46.4 (40.0–53.0)92.9 (89.7–95.1)
NPV: negative predictive value; PPV: positive predictive value.

