1. Background
With economic growth and changes in diet and lifestyle habits, people are increasingly being diagnosed with metabolic syndrome (MetS). MetS is associated with gender, age, and obesity [
1]. In the United States, 34% of adults met the criteria for MetS [
2]. Moreover, men and women older than 60 years are more likely to have MetS. In São Paulo, Brazil, the prevalence of MetS in adults was 30.3% [
3]. In Taiwan, the prevalence of MetS in women was markedly higher in postmenopausal women, for whom the prevalence exceeded that among men [
4]. Some research evidences exist in Korea [
5], Thailand [
6], and Malaysia [
7]. Thus, MetS is a global health risk, and thus places a substantial burden on health care [
8]. Because MetS is highly correlated with other diseases [
4,
9,
10,
11,
12], MetS management is key for adult health management.
People with MetS have increased risks of cardiovascular disease [
10,
13], type 2 diabetes mellitus [
9], and stroke [
11,
12]. Hwang et al. demonstrated that MetS was highly correlated with overweight status and obesity [
4]. In [
3], the researchers used logistic regression models and reported that the glycemic index (GI) and dietary glycemic load were positively associated with high-density lipoprotein cholesterol (HDL-C) reduction in adult residents of São Paulo, Brazil.
Mohammadifard et al. [
14] revealed that a high GI was significantly associated with MetS. Chen et al. [
15] discovered that fasting glucose (FG), blood pressure (BP), triglycerides (TG), glutamate pyruvate transaminase, and white blood cell (WBC) count were the most critical risk factors. Ushida et al. [
16] discovered that a combination of elevated
-glutamyltranspeptidase and WBC count was the most significant combination of risk factors. Worachartcheewan et al. [
6] demonstrated that the combination of TG, BP, and fasting plasma glucose (FPG) were strong predictors of MetS. Mohammadifard et al. [
14] indicated that a high GI and FG were significantly associated with MetS. In summary, significant factors differ when different predictors are considered.
Upon careful review of the literature, we discovered some gaps in this area of study. We like to fill some gaps of existing research. First, we incorporated the five indices for MetS diagnosis defined by the modified Adult Treatment Panel III (ATP III) to evaluate across multiple age groups. The present study analyzes the five indices defined by the ATP III, identify the significant risk factors, and achieve early prevention of associated health complications for some age groups. Achievement of the aforementioned goals constitutes a significant contribution of this research.
Finally, because MetS is an increasingly significant health problem in Taiwan [
17], we analyzed actual patient cases in Taiwan. The results could serve as a reference for other countries. The remainder of this paper is organized as follows. Because this study utilized the definition of MetS from the Ministry of Health and Welfare in Taiwan and a decision tree algorithm, we present the criteria and then introduce the decision tree algorithm in
Section 2. In
Section 3, we illustrate descriptive statistics related to MetS and show the results of the decision tree algorithm which extracts significant risk factors. Finally, this paper discusses the extracted risk factors and offers conclusions in
Section 4 and
Section 5, respectively.
2. Research Methods
2.1. Criteria of Metabolic Syndrome
According to the Health Promotion Administration, Ministry of Health and Welfare in Taiwan, the prevalence of MetS is estimated using the definitions of the modified ATP III and MetS criteria for Taiwanese people. The five major criteria shown in
Table 1, can be used to determine whether a person has MetS. The first criterion is waist circumference (WC) according gender. If a man or woman has a WC of more than 90 or 80 cm, respectively, that person has an abnormal WC. The second criterion—high BP—includes the rates of systolic BP (SBP) and diastolic BP (DBP). If either the SBP or DBP is abnormal, the individual in question fits the criterion. The third criterion evaluates FPG. If the first FG test fails, secondary blood sugar data can be used. We selected secondary blood sugar data for this study. The fourth criterion is TG, where normal is defined as less than 150 mg/dL. If the TG value is larger than or equal to 150 mg/dL, the individual in question meets this MetS criterion. Finally, the fifth criterion is high density lipoprotein cholesterol (HDL-C). The modified ATP III states that if there are three or more of the following conditions: abdominal obesity, high TG, low HDL-C, hypertension, and hyperglycemia, this person meets the criteria for MetS.
Table 1 describes the criteria in detail.
2.2. Data Source
This study analyzed datasets from the MJ Group—a major health screening center in Taiwan—from 2010 to 2015. The MJ Health-Check-Up-Based Population Database (MJPD) collected from four MJ clinics provides periodic health examinations to the center’s approximately 71,000 members and contains 201,087 cases. All of the datasets used in this study have been authorized by and received from the MJ Health Research Foundation (Authorization Code: AP_A2016002; Approval No.: MJHRF-2016005A). The data application procedures are described at
http://www.mjhrf.org/main/page/release1/en/#release01. The MJPD database is accessible to academic researchers upon request. With respect to ethical issues regarding usage of data in the database, the protocol of this study was evaluated and deemed acceptable by the Research Ethics Review Committee at the Far Eastern Memorial Hospital (FEMH-IRB-107126-E) and the MJ Health Research Foundation.
2.3. Decision Tree Algorithm
The main differences among decision tree algorithms are the pruning strategy and the rule for splitting nodes [
18]. A decision tree algorithm builds decision trees in a top-down recursive partitioning manner; that is, the attribute with the highest information gain (Equations (1)–(4)) is selected as the split node. This algorithm is run recursively until one class demonstrates that a clear majority does not generate a subproblem. Many decision tree algorithms apply the binary split.
In Equation (1), a subset of dataset
is the input, and its entropy is calculated as follows:
where
Pi is the probability of class
i in the subset of data
D and
C is the number of classes. In Equation (2),
Gain is the reduction in entropy when the value of attribute
A in the dataset is known.
where
v is the number of classes of attribute
A and |
Dj| is the number of observations with class
j in the subset of data
D. Equation (3) calculates the attribute of the normalized information gain.
Finally, Equation (4) evaluates the gain ratio of attribute
A. A decision algorithm selects the attribute that exhibits the highest rate.
3. Experimental Results
We purchased a dataset from a major health screening company in Taiwan called MJ Group. The dataset period was 2010–2015. This study was approved by the Research Ethics Review Committee and Institutional Review Board of the Far Eastern Memorial Hospital (IRB No. FEMH-IRB-106058-F, date: 20170501). The personal information of all subjects was removed to protect privacy. A total of 201,087 records with 77 variables were obtained, including the five MetS criteria and other details such as age, height, and occupation. Each subject was aged ≥20 years. We analyzed the data by using descriptive statistics, as described in
Section 3.1.
Section 3.2 describes the application of the decision tree to analyze the importance of the five MetS criteria for the whole dataset. We divided the dataset into three groups, namely, younger (age less than 45 years), middle-aged (age is greater than 45 and less than 65 years), and older (age is greater than or equal to 65 years) groups.
3.1. Descriptive Statistics
As listed in
Table 2, the dataset contained 201,087 cases, namely, 87,289 younger cases, 100,170 middle-aged cases, and 13,628 older cases. The middle-aged group had the largest proportion of cases and the most patients with MetS. The younger and older groups had the lowest and highest MetS rates, respectively. In our dataset, 7% of the patients had MetS. A dataset in a prior study [
2] showed that 34% of adults in the United States met the criteria for MetS. Thus, the MetS rate in Taiwan is lower than that in the United States.
The records for each age group are presented in
Figure 1. Each dot represents an age record with a different color. The number of complete records is over 6000 for the middle-age group. Our data were obtained from a health check-up company, and most of the subjects aged 35–40 years underwent annual examinations paid for by their companies. Clearly, the number of subjects over the age of 42 years was lower. In addition, each color represents the mean MetS rate of a different age. If the color is lighter, the average value of the age span in question is higher.
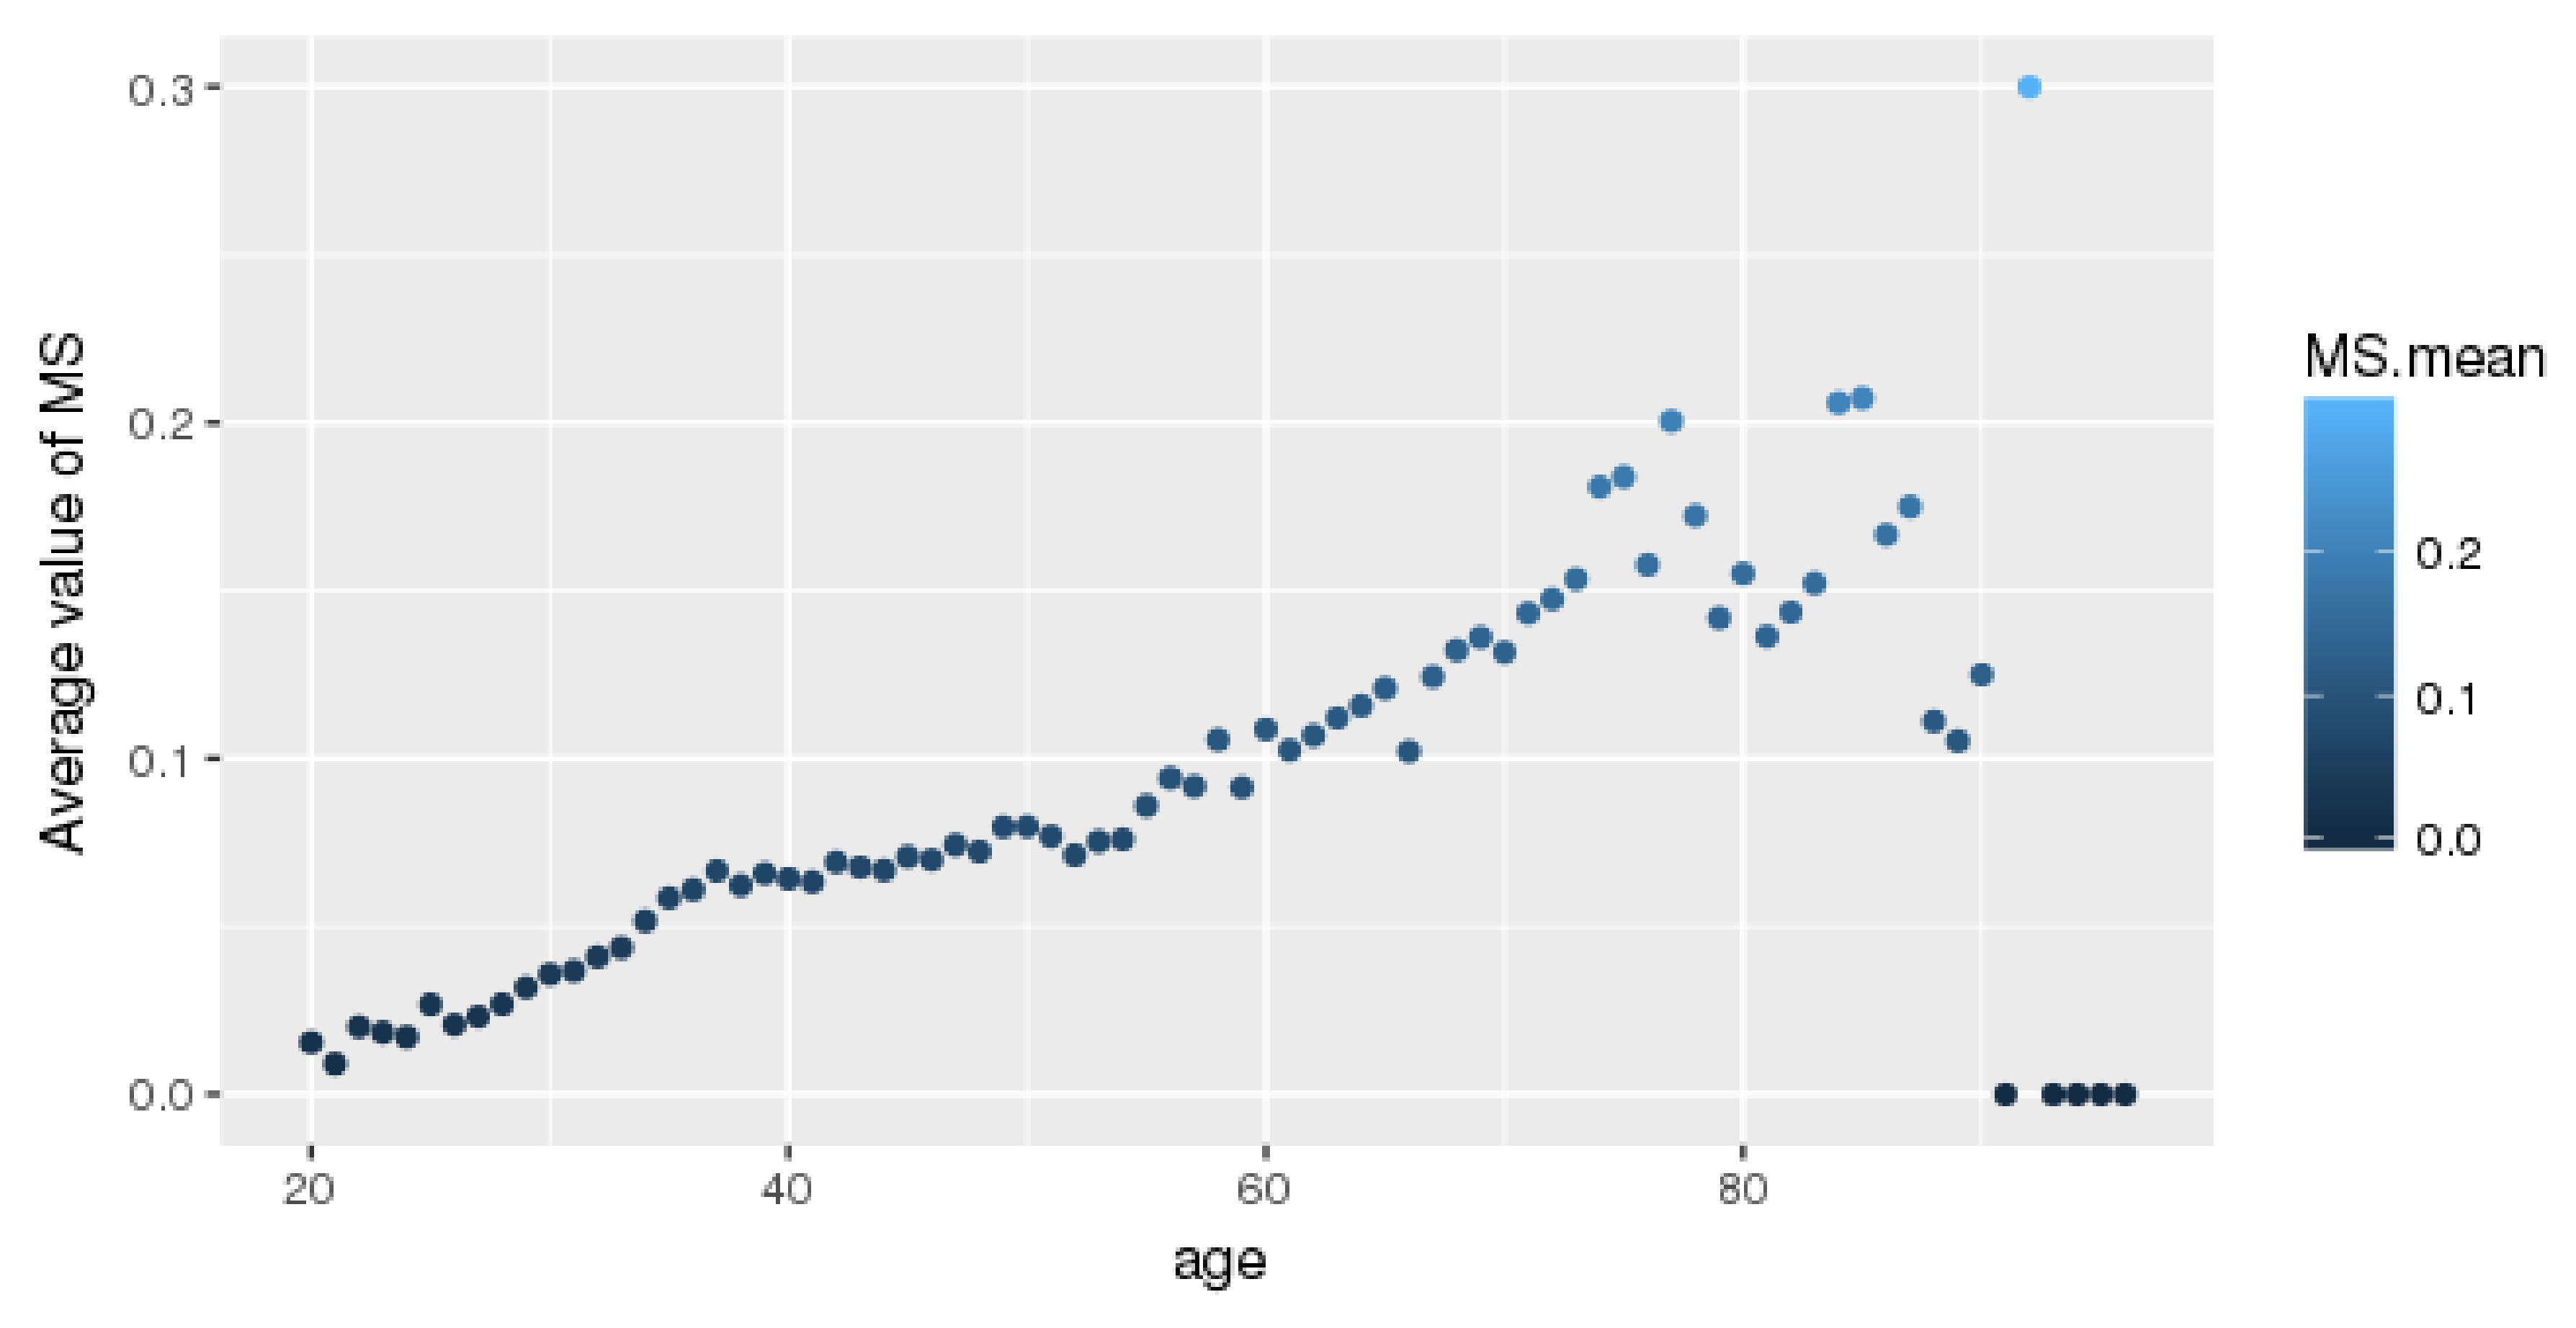
The average MetS value for each age is shown in
Figure 2. Older age is associated with a higher likelihood of having MetS. Thus, elderly people should be aware of MetS. An increasing pattern similar to that demonstrated by Hwang et al. [
2] is shown in
Figure 2. Some exceptions over the age of 90 years were noted.
3.2. Decision-Making Model for the Whole Population
The five MetS criteria determine whether a person has MetS. These criteria are WC (g_wc), high BP (g_ssr), FPG (dm_fg), TG (l_tg), and HDL-C (l_hdlc). The importance of these factors is unknown when screening people with MetS. Determining the importance of these five factors could facilitate the development of guidelines for preventing this disease. This subsection describes the application of the decision tree technique, which filters characteristics based on information gain. The factor that provides the most distinguishable information is shown at the top of the tree. We ran the decision tree in R language.
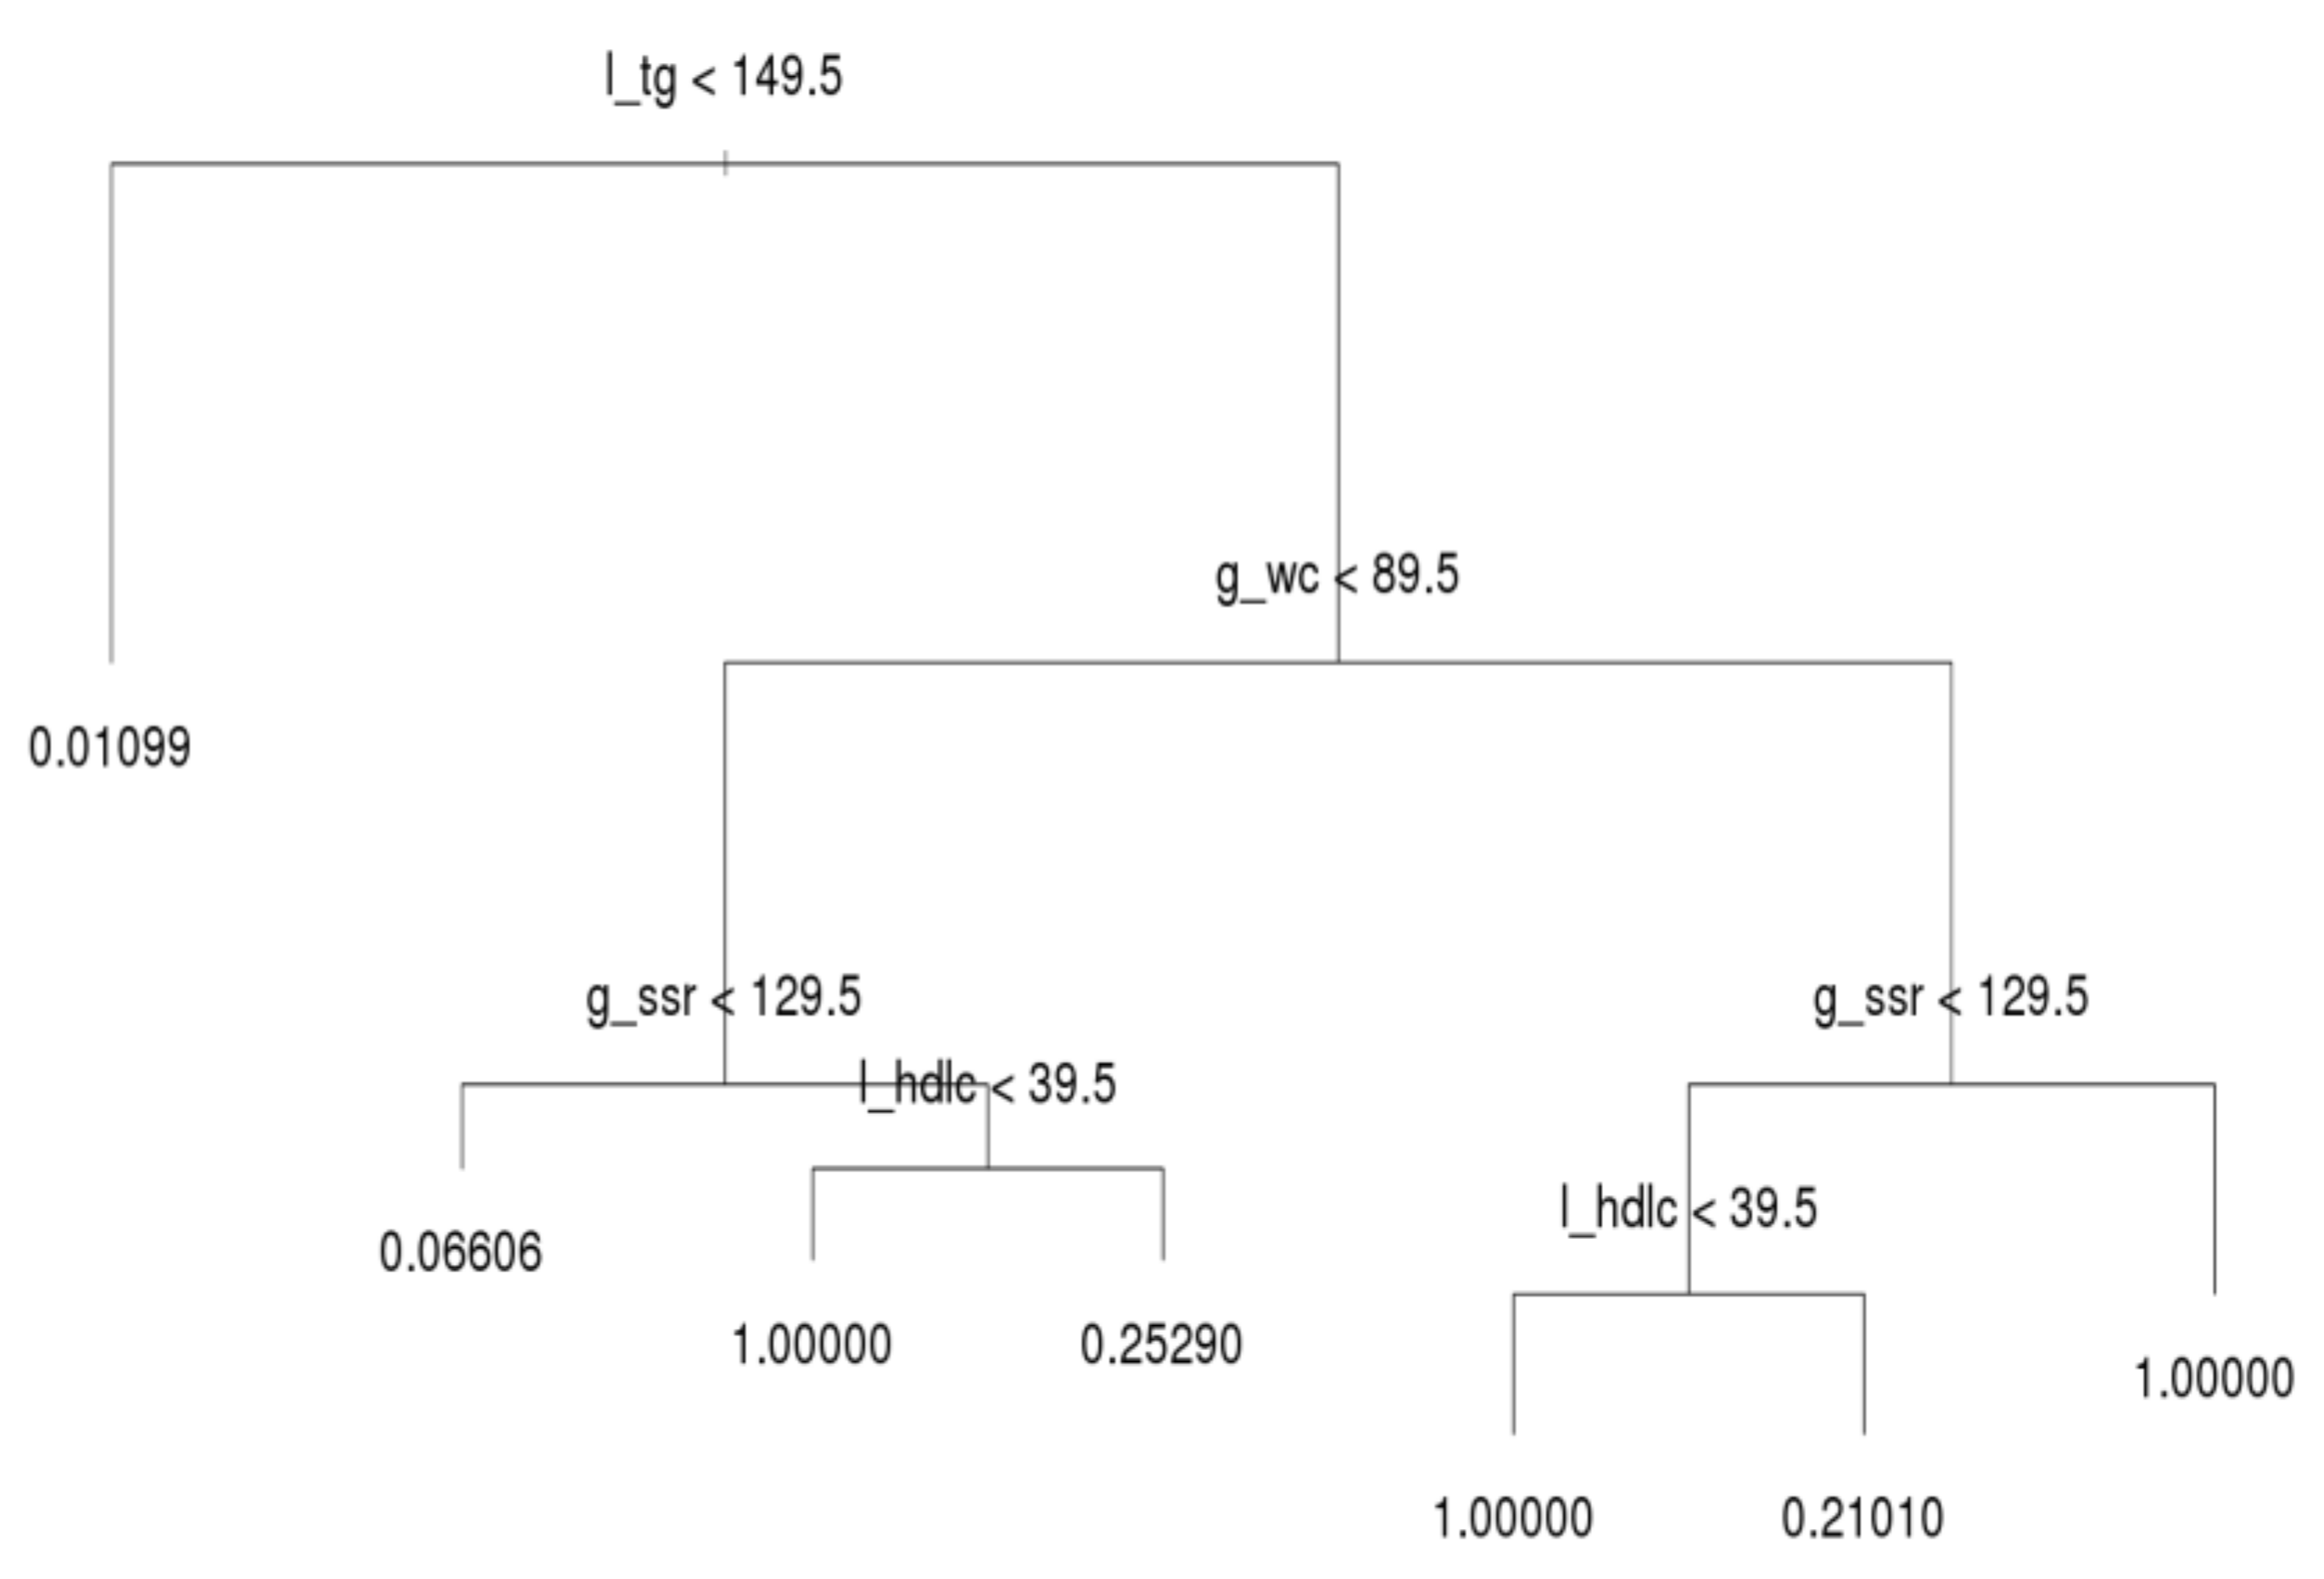
After running the decision tree algorithm, we show the results of the whole dataset in
Figure 3; l_tg, g_wc, g_ssr, and l_hdlc were included in the decision tree, whereas dm_fg was excluded. The implication is that l_tg, g_wc, g_ssr, and l_hdlc are major critical factors based on filtering of people with MetS. Most notably, l_tg is shown on top of the decision tree, and thus this criterion was deemed the most crucial factor for distinguishing MetS symptoms. If a person has a l_tg score lower than 149.5, he or she meets only 1.1% of the criteria for MetS. Hence, to prevent MetS, l_tg should be controlled.
The second and third most crucial factors for distinguishing MetS symptoms were g_wc and g_ssr, respectively. A person with high l_tg but low g_wc (lower than 89.5) has a 6.6% likelihood of having MetS symptoms. In the same subtree, a person with high g_ssr (higher than 129.5) and l_hdlc (higher than 39.5) has a 25.3% likelihood of having MetS symptoms. However, if such a person has low l_hdlc, he or she has MetS. Moreover, if g_wc is abnormal (e.g., higher than 89.5) and l_hdlc is normal, the individual in question has a 21% likelihood of having MetS. When g_ssr and l_hdlc are abnormal, the individual in question has MetS. In general, l_tg is the most crucial index for preventing MetS in all three age groups; g_wc, g_ssr, and l_hdlc are the second, third, and fourth most crucial criteria for determining MetS, respectively; dm_fg is the crucial factor that least influences the decision tree results. This subsection reveals the deciding factors for the whole population.
Section 3.3 explains the differences among the three age groups.
3.3. Close Look at Age Groups
The decision trees for the three age groups are presented in
Figure 4,
Figure 5 and
Figure 6, which shows that l_tg was not always the leading factor at the top of the decision tree. Instead, the factor, g_wc, was more crucial in the younger group than other groups. Hence, younger persons are recommended to control their g_wc in order to prevent MetS.
Regarding the younger group, l_tg was the second most crucial factor. If a younger person has normal g_wc and l_tg, he or she only has a 0.16% likelihood of acquiring MetS. If a person’s g_wc and g_ssr are normal and l_tg is abnormal, the likelihood of acquiring MetS increases from approximately 4.26% to 11.16%. When the other factors on the left-hand side of the tree are abnormal, the individual in question meets the criteria for MetS. On the right-hand side tree in the younger group, l_tg is the second most crucial criterion. However, the third and fourth most crucial criteria differ under l_tg; l_hdlc is the third node over g_ssr.
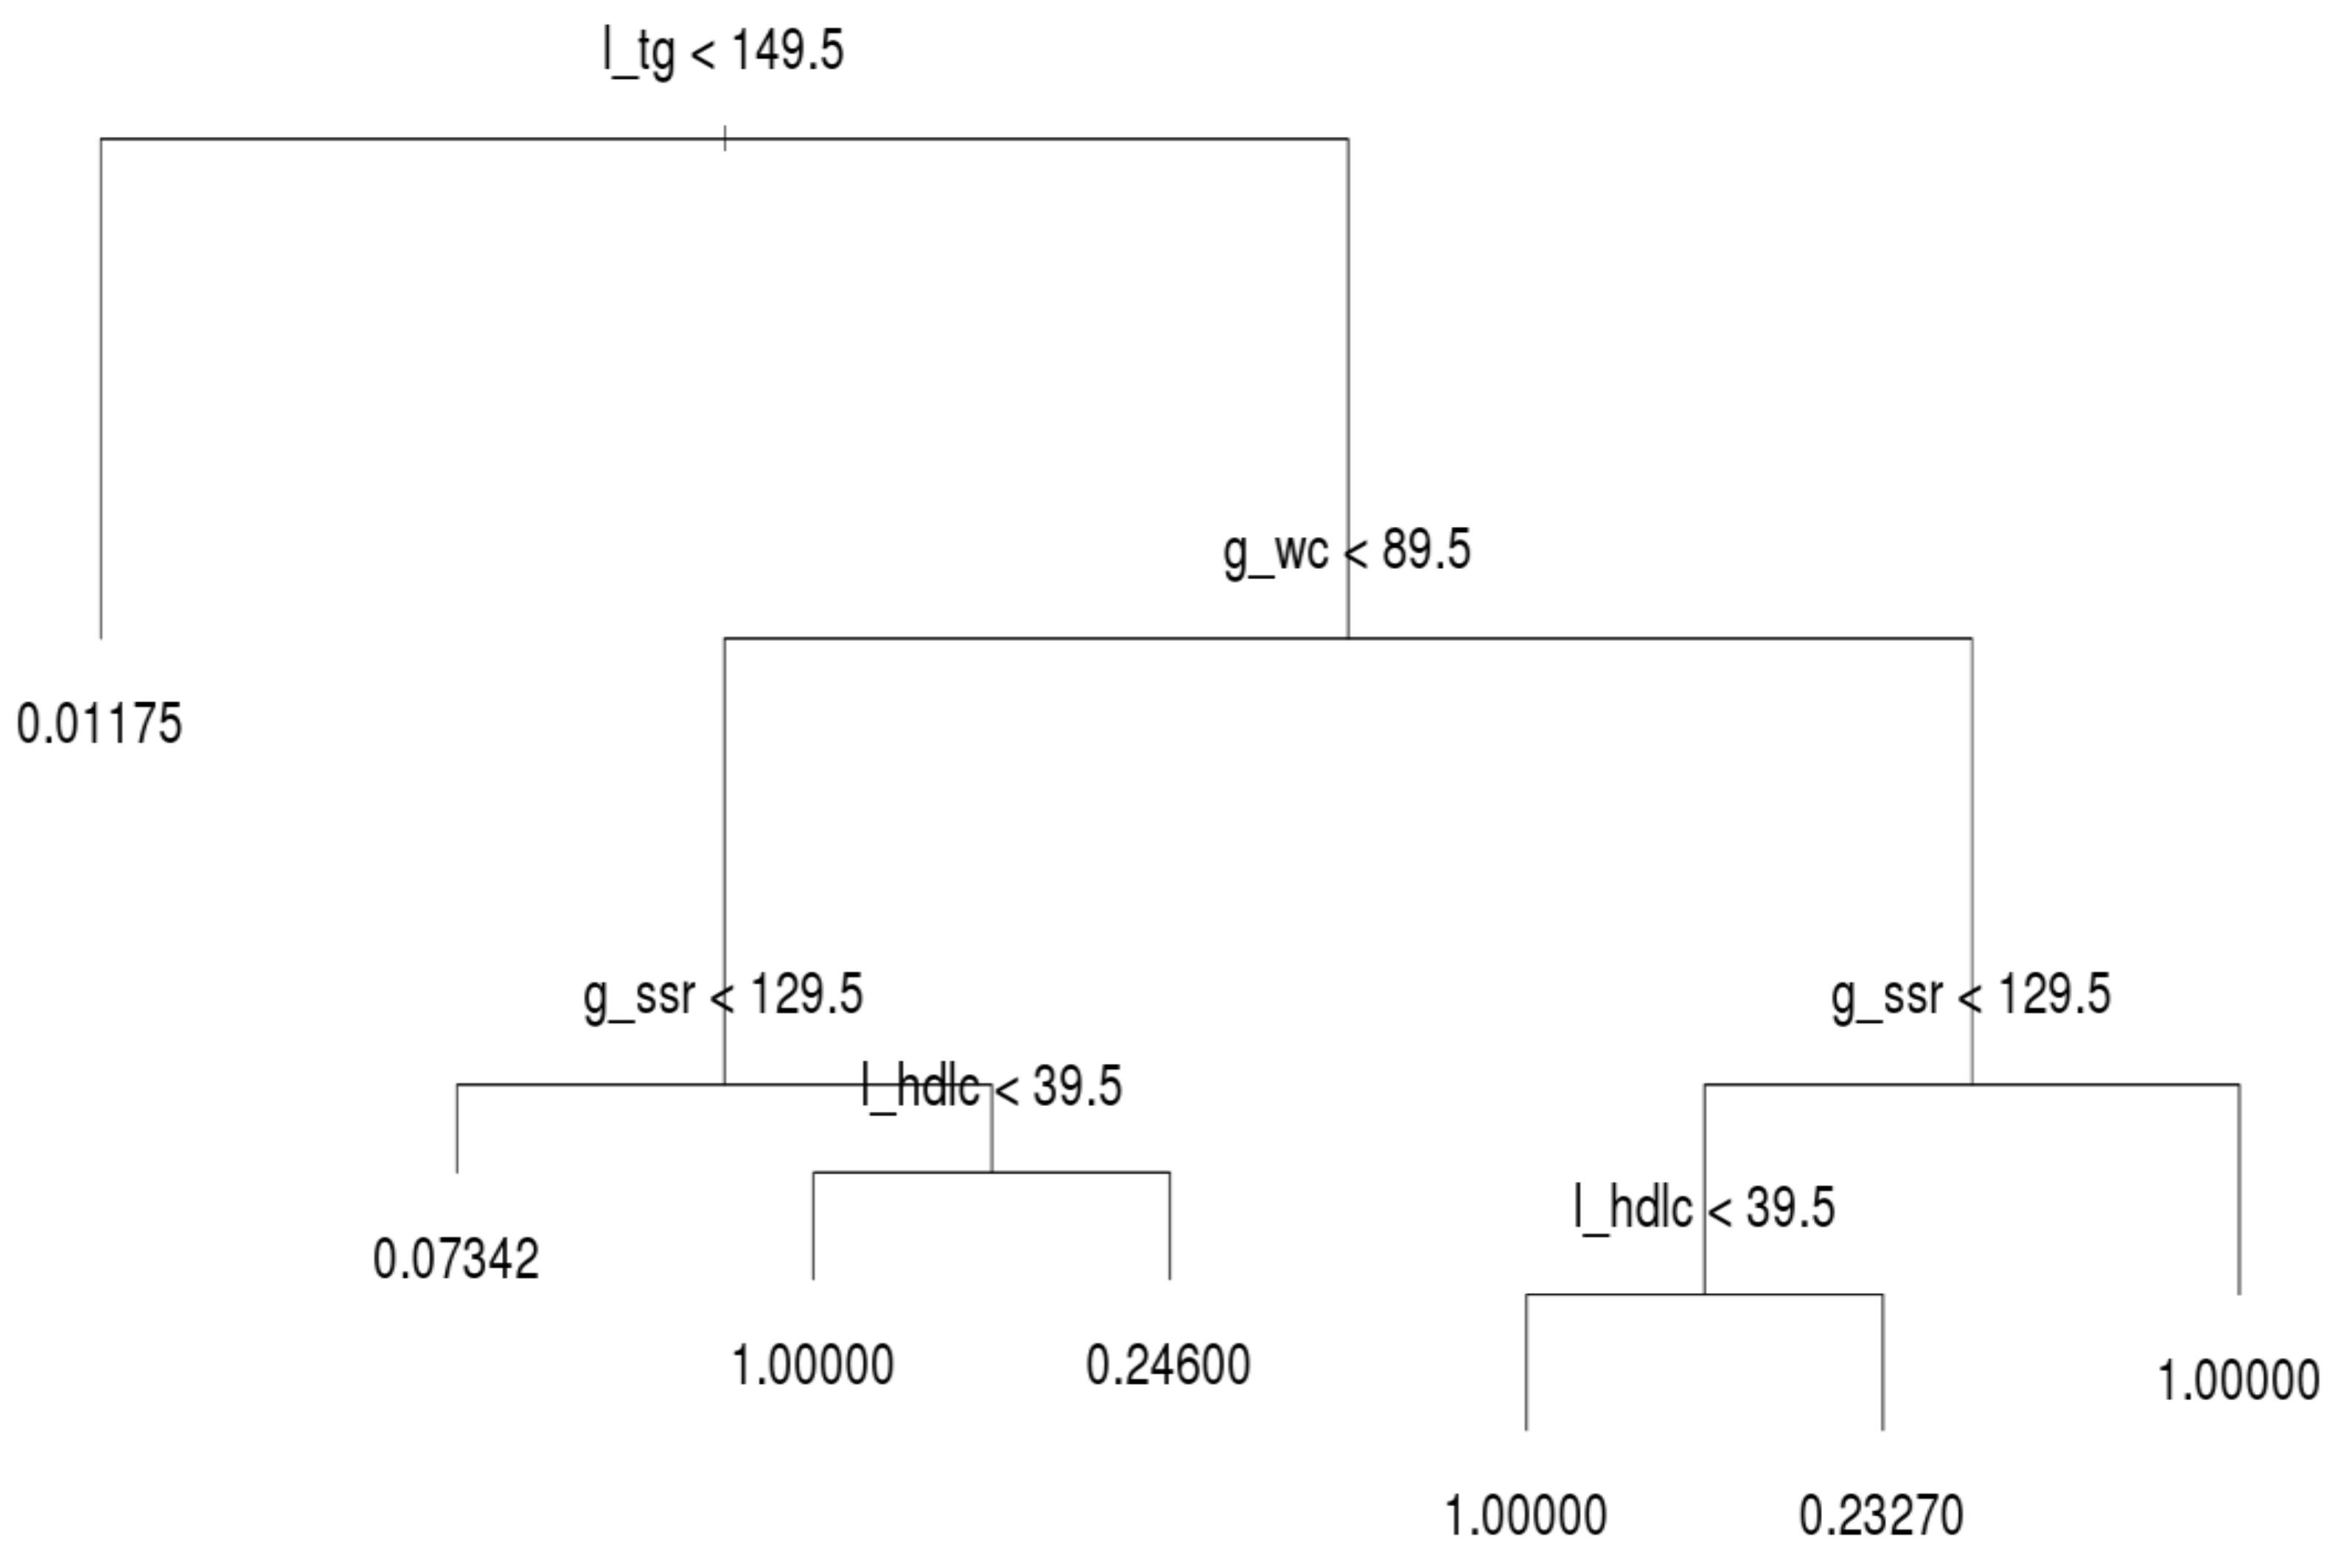
For the middle-aged group, the structure of the decision tree was identical to that of the whole population (
Figure 5). In addition, their MetS values were quite similar. The number of records and rate of MetS were both high in the middle-aged group. The behavior of the decision tree was dominated by the middle-aged group; this is why the tree structure of the middle-age group was identical to that of the whole population.
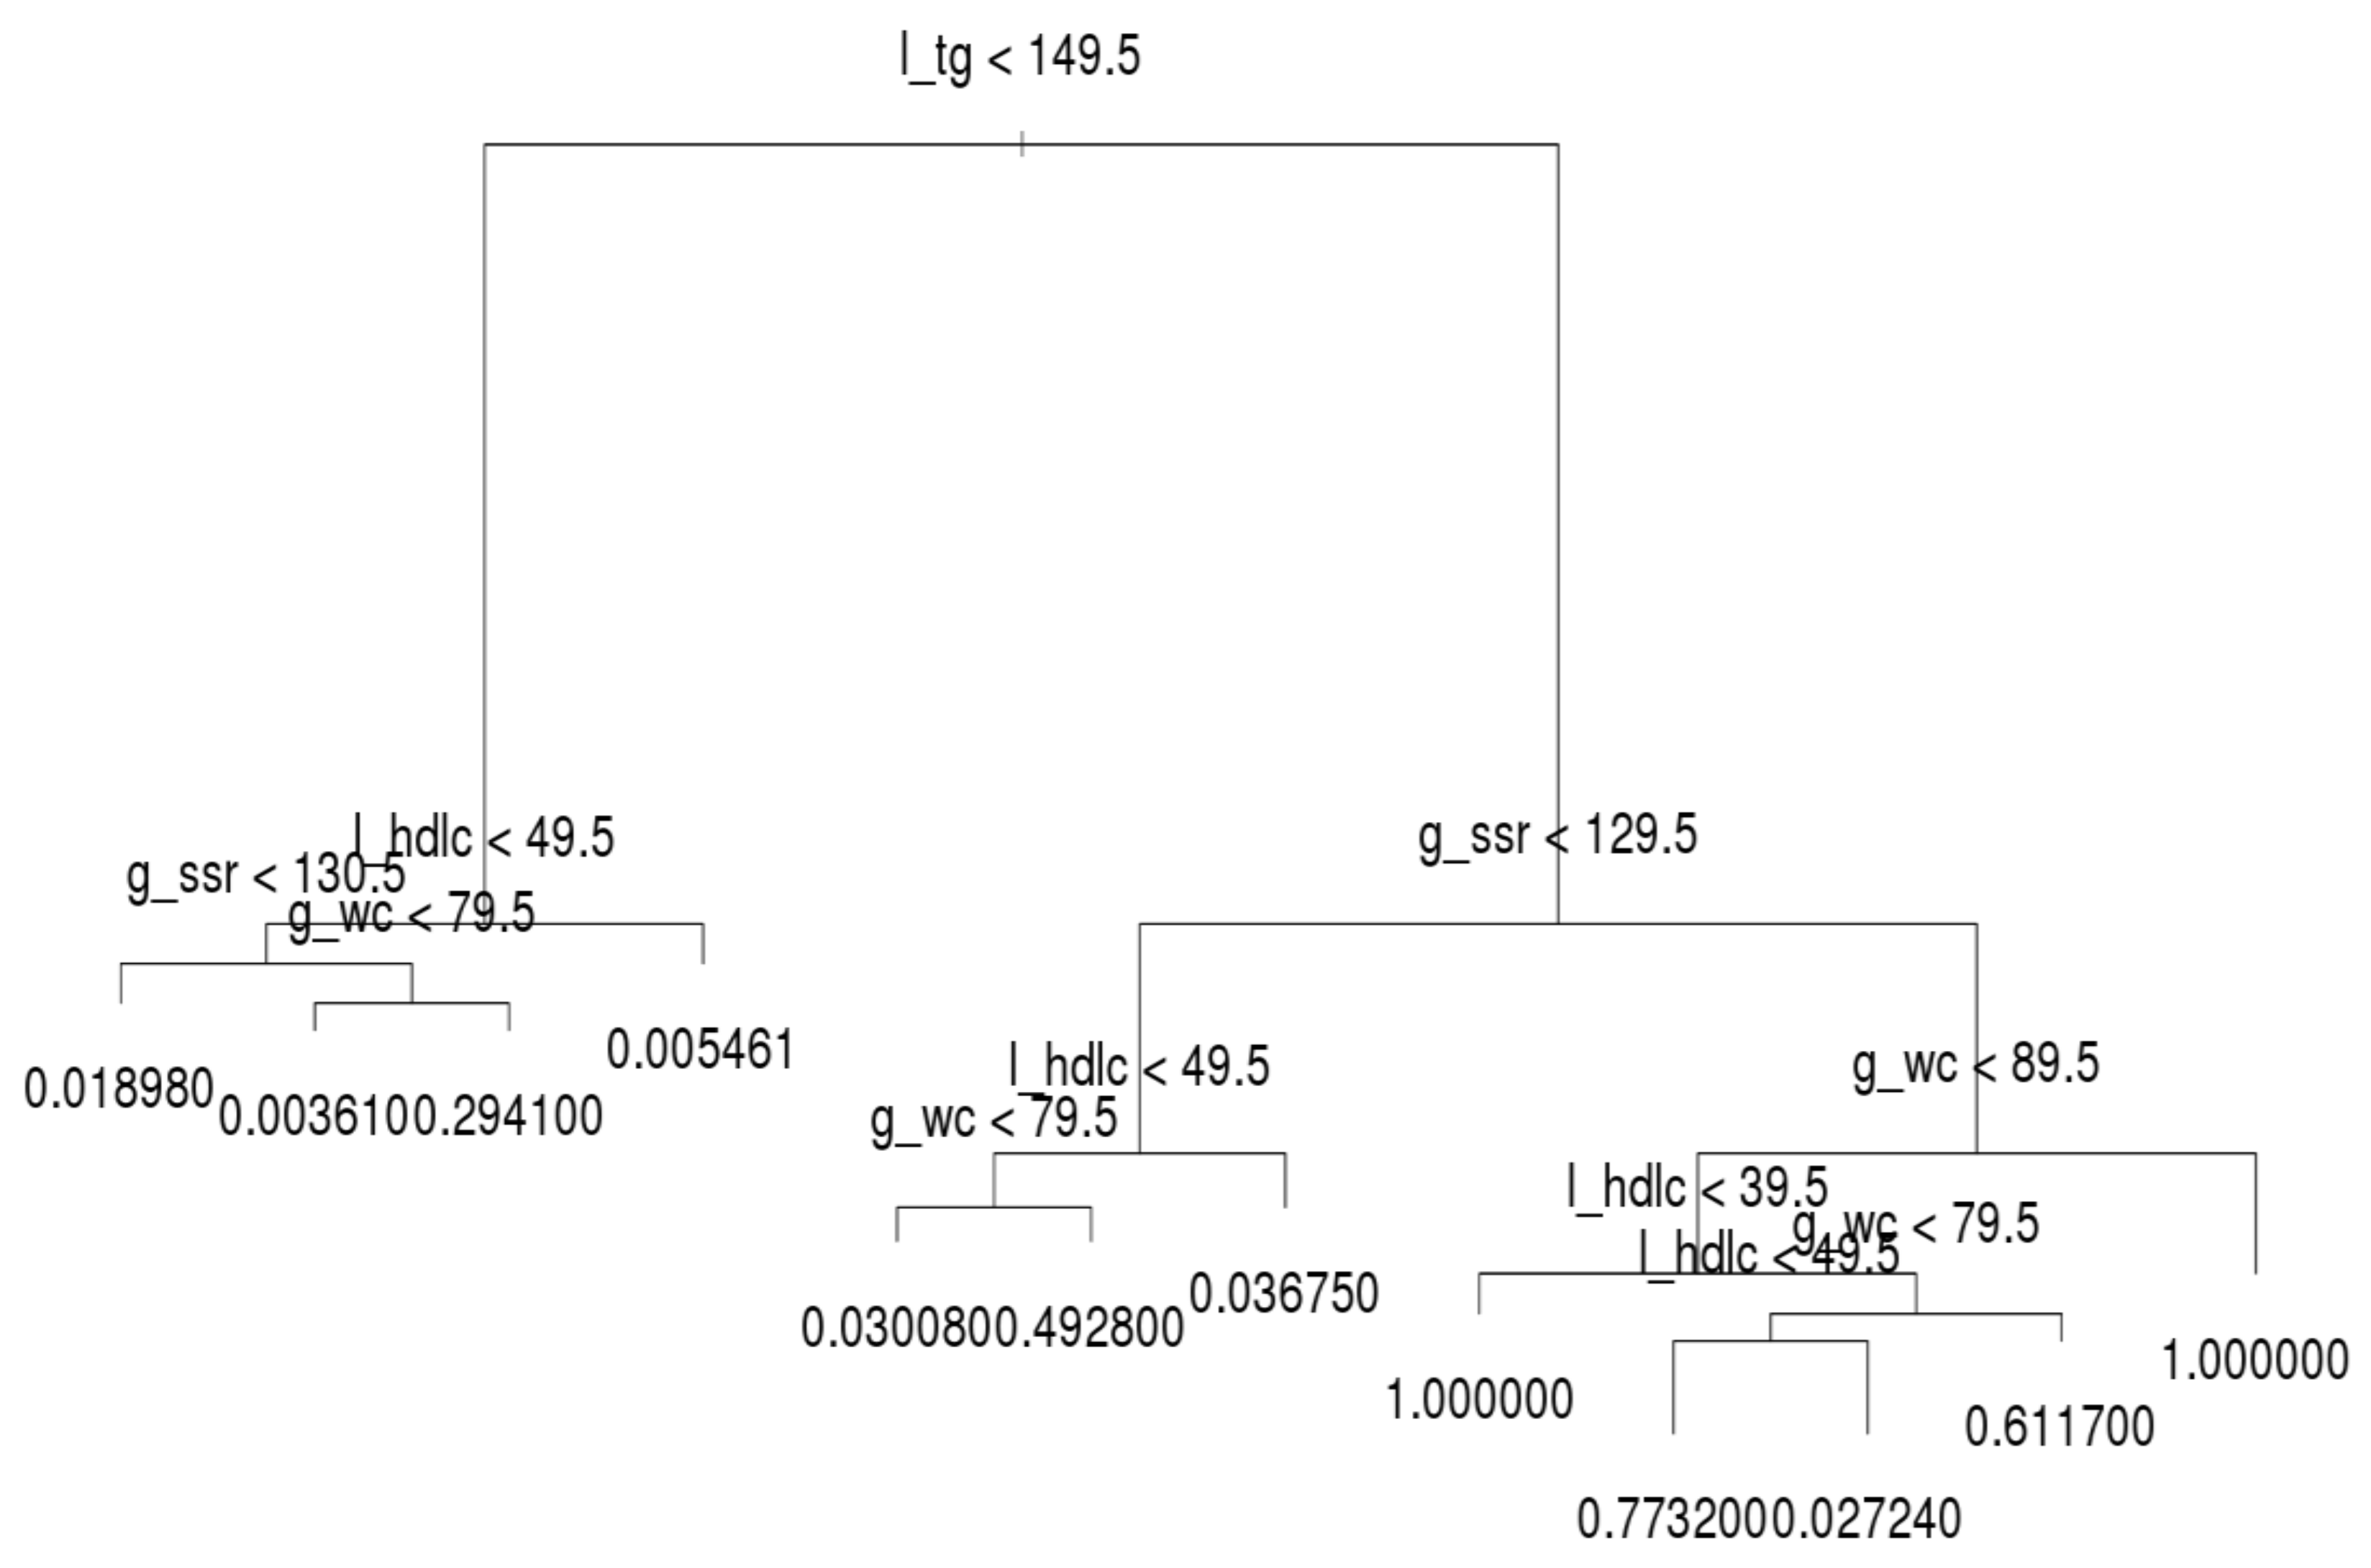
For the older generation, l_tg was the leading node in the decision tree (
Figure 6), similar to the middle-aged group. However, the second to fourth factors were entirely different on the left- and right-hand sides of the trees. Researchers and practitioners are recommended to observe these trees in detail.
4. Discussion
Several studies on MetS have focused on tracking patients with diabetes or cardiovascular disease (CVD), and more recent studies on MetS have focused on healthy or sub-healthy people [
19,
20,
21]. Kuk and Chris [
19] demonstrated that MetS is a heterogeneous entity with age and sex variation in component clusters that may have important implications for interpreting the association between MetS and mortality risk. Hildrum et al. discovered that the prevalence of MetS increased strongly with age according to the ATP III and International Diabetes Federation [
20]. Younger people with MetS in rural Victoria, Australia, may have warranted more aggressive preventive treatment for CVD than that suggested based on the summation of their individual risk factors [
21].
Results of data collection and analysis regarding MetS from the MJPD have been published [
8,
22,
23]. In Taiwan, where data from health examinations were utilized, a 12.5% 5-year cumulative incidence of MetS and increased occurrence of MetS in women with more limited education as they became older were observed [
23]. Liao and Lin [
8] tested and analyzed the potential health effects of various factors by using multiple logistic regression and a generalized estimating equation model. A 10% increase in MetS prevalence was observed over the 9-year period of the study. The mean Framingham CVD score for people with MetS was estimated to be approximately 1.4% (standard deviation (SD) = 1.5%) [
8]. Huang et al. [
22] demonstrated that MetS is a common disorder among Taiwanese adults and is similarly associated with an increase in all-cause and CVD mortality, similar to Western populations. Asians with MetS are at higher risk of death. Our study focused on assessing the MetS indicators in the ATP III and discovered the most crucial factors for preventing MetS. Therefore, our research goals differed to those of the aforementioned three studies.
From the perspective of public health and preventive medicine, most experts or professionals consider that FG, WC, BP, and FPG are the most crucial risk factor indices for MetS [
3,
14]. Variation exists in how different combinations of MetS risk factors are associated with mortality. Kuk and Chris [
19] applied the five criteria of the ATP III to analyze five major indicators of each combination of MetS indices. In older women, elevated glucose (high FPG) or low HDL-C as a MetS component was most strongly associated with mortality risk. Devers et al. (2016) reported that the prevalence of MetS (followed by the ATP III criteria) among people with normal WC was lower than expected [
21].
However, TG was the most significant contributor to MetS in our analysis according to the decision tree classification results. A decision tree algorithm indicates the priority of the influence factors in a row. This finding was similar to that of a previous study, which suggested that TG—the root node—was the most informative factor for MetS identification in Thailand [
6]. Lemieux et al. [
24] noted that hypertriglyceridemic waist is a predictor of metabolic abnormalities. The preceding two studies support our analysis regarding the importance of leading branch indicators. Our study results for the healthy middle-aged and sub-healthy groups indicated that if the first two criteria (TG and WC) are excluded from the decision tree, the risk of MetS is lower. Therefore, high TG and WC are key factors for preventing MetS among middle-aged and elderly people; these factors are often overlooked by health management experts and require further verification. Because we employed a large dataset, our analysis results might be sufficient to comprehensively show the phenomenon of people with MetS.
After our discussions with a cardiologist and a physician specializing in metabolism, we estimated that the TG level varies greatly in in the daily diet of people. Mensink and Katan [
25] published an article on a meta-analysis of 27 trials, and they reported that dietary fatty acids intake resulted in a more stable level of serum HDL than TG. Other studies have also indicated that medium-chain fatty acids or medium-chain TG levels are altered or affected by daily diet [
26,
27,
28]. Asakura et al. [
29] found that the total plasma cholesterol levels did not change in response to a liquid test meal with corn oil, but TG levels increased with a 100% corn oil diet.
TG values seem to be influenced by daily diet. However, because our dataset was provided by the Major Health Screening Center, the individuals therein were advised to fast for 6–8 h before undergoing an annual health examination. TG values drop during this 6–8 h period. A patient’s TG level is controllable before he or she receives an examination; however, some of the people analyzed in this study still had high TG levels. Therefore, TG is a strong prediction index for preventing MetS.
5. Conclusions
MetS is a growing public health concern in the United States and Taiwan because it increases the risks of CVD, type 2 diabetes mellitus, and stroke [
9,
10,
11,
12,
13,
30]. In addition, MetS is highly correlated with overweight status or obesity. When a person does not meet the criteria for MetS, he or she has a low likelihood of developing problems such as CVD and type 2 diabetes mellitus or becoming overweight. Although MetS is a pertinent research topic and has been studied extensively, the explicit importance of the factors defined by the ATP III are unknown. This study investigated the key factors determining MetS.
We applied a decision tree algorithm to identify the importance of the five criteria of the ATP III for identifying MetS symptoms, namely WC, high BP (g_ssr; including SBP and DBP), FG, TG, and HDL-C. The first notable finding was that not all criteria were equally crucial, and FG was not even used in the decision tree.
The second meaningful finding was that TG is the root factor for the whole population. If a person manages their TG level, they have a lower likelihood of developing MetS; the probability of MetS development is only 1.1% instead of 7% of the total average. A person with abnormal TG levels must control their WC first and then control their BP and HDL-C. This guideline can be followed for MetS prevention.
We examined the details of the behavior of the three age groups. The results revealed that the entire tree structure of the middle-aged group was equivalent to that of the whole population because middle-aged people accounted for the highest number of observations and highest number of MetS patients. However, we observed some differences between the younger and older age groups. For example, for a younger person, the root factor was WC and the second most explicit factor was TG. Regarding the tree structure of the older generation, although the root factor was TG, older people must manage their HDL-C or BP as a secondary explicit factor if their TG levels are normal or abnormal, respectively. Therefore, maintaining a low TG level may be a vital factor for MetS prevention in middle-aged and healthy older people. We hope that this finding will help in the prediction and management of patients with MetS; however, this conclusion requires support from further clinical studies or longitudinal cohort studies. The provision of comprehensive and integrated clinical management for patients with MetS or diabetes is vital.
In future research, we intend to target health examination groups with a long-term observation and analyze their TG levels. Compared with other indicators (FG, WC, BP, and FPG), an increase in TG will more likely increase the risk of MetS in secondary, tertiary, and quaternary health examination reports. In addition, we intend to analyze longitudinal cohort studies and the occupations of patients with MetS. Because the dataset in this study comprised more than 70 features, exploring the association between MetS and occupation to determine cost-effective treatment methods for MetS may be appealing.
Author Contributions
M.S.C. and S.H.C. conceived and designed the experiments; S.H.C. performed the experiments; S.H.C. analyzed the data; M.S.C. contributed investigation material; M.S.C. and S.H.C. both wrote the paper.
Funding
This research was funded by Ministry of Science and Technology for supporting this research with ID MOST 107-2221-E-161-002, MOST 107-2221-E-230-007, and MOST 107-2221-E-468-001-MY3.
Acknowledgments
The authors would like to thank Yen-Wen Wu (Cardiologist), Tse-Ya Yu (Metabolism physician) at the Far Eastern Memorial Hospital for support and help.
Conflicts of Interest
The authors declare no conflict of interest.
References
- Kaur, J. A comprehensive review on metabolic syndrome. Cardiol. Res. Pract. 2014, 2014, 943162. [Google Scholar] [CrossRef] [PubMed]
- Ervin, R.B. Prevalence of metabolic syndrome among adults 20 years of age and over, by sex, age, race and ethnicity, and body mass index: United States. Natl. Health Stat. Report. 2009, 13, 1–8. [Google Scholar]
- De Mello Fontanelli, M.; Sales, C.H.; Carioca, A.A.F.; Marchioni, D.M.; Fisberg, R.M. The relationship between carbohydrate quality and the prevalence of metabolic syndrome: Challenges of glycemic index and glycemic load. Eur. J. Nutr. 2018, 57, 1197–1205. [Google Scholar] [CrossRef] [PubMed]
- Hwang, L.-C.; Bai, C.-H.; Chen, C.-J. Prevalence of obesity and metabolic syndrome in Taiwan. J. Formos. Med. Assoc. 2006, 105, 626–635. [Google Scholar] [CrossRef]
- Song, S.J.; Paik, H.Y.; Song, W.O.; Song, Y.J. Metabolic syndrome risk factors are associated with white rice intake in Korean adolescent girls and boys. Br. J. Nutr. 2015, 113, 479–487. [Google Scholar] [CrossRef] [PubMed]
- Worachartcheewan, A.; Nantasenamat, C.; Isarankura-Na-Ayudhya, C.; Pidetcha, P.; Prachayasittikul, V. Identification of metabolic syndrome using decision tree analysis. Diabetes Res. Clin. Pract. 2010, 90, e15–e18. [Google Scholar] [CrossRef] [PubMed]
- Ching, Y.; Chin, Y.; Appukutty, M.; Gan, W.; Ramanchadran, V.; Chan, Y. Prevalence of metabolic syndrome and its associated factors among vegetarians in Malaysia. Int. J. Environ. Res. Public Health 2018, 15, 2031. [Google Scholar] [CrossRef]
- Liao, C.-M.; Lin, C.-M. Life course effects of socioeconomic and lifestyle factors on metabolic syndrome and 10-year risk of cardiovascular disease: A longitudinal study in taiwan adults. Int. J. Environ. Res. Public Health 2018, 15, 2178. [Google Scholar] [CrossRef]
- Hanson, R.L.; Imperatore, G.; Bennett, P.H.; Knowler, W.C. Components of the “metabolic syndrome” and incidence of type 2 diabetes. Diabetes 2002, 51, 3120–3127. [Google Scholar] [CrossRef]
- Isomaa, B.O.; Almgren, P.; Tuomi, T.; Forsén, B.; Lahti, K.; Nissén, M.; Taskinen, M.-R.; Groop, L. Cardiovascular morbidity and mortality associated with the metabolic syndrome. Diabetes care 2001, 24, 683–689. [Google Scholar] [CrossRef]
- McNeill, A.M.; Katz, R.; Girman, C.J.; Rosamond, W.D.; Wagenknecht, L.E.; Barzilay, J.I.; Tracy, R.P.; Savage, P.J.; Jackson, S.A. Metabolic syndrome and cardiovascular disease in older people: The cardiovascular health study. J. Am. Geriatr. Soc. 2006, 54, 1317–1324. [Google Scholar] [CrossRef] [PubMed]
- Zhang, W.-W.; Liu, C.-Y.; Wang, Y.-J.; Xu, Z.-Q.; Chen, Y.; Zhou, H.-D. Metabolic syndrome increases the risk of stroke: A 5-year follow-up study in a Chinese population. J. Neurol. 2009, 256, 1493–1499. [Google Scholar] [CrossRef] [PubMed]
- Wilson, P.W.F.; D’Agostino, R.B.; Parise, H.; Sullivan, L.; Meigs, J.B. Metabolic syndrome as a precursor of cardiovascular disease and type 2 diabetes mellitus. Circulation 2005, 112, 3066–3072. [Google Scholar] [CrossRef] [PubMed]
- Mohammadifard, N.; Mansourian, M.; Sajjadi, F.; Maghroun, M.; Pourmoghaddas, A.; Yazdekhasti, N.; Sarrafzadegan, N. Association of glycaemic index and glycaemic load with metabolic syndrome in an Iranian adult population: Isfahan Healthy Heart Program. Nutr. Diet. 2017, 74, 61–66. [Google Scholar] [CrossRef] [PubMed]
- Chen, M.-S.; Wang, C.-C.; Wang, L.-Y. Applying decision tree to explore risk factors in developing diabetes among employees in high-tech industry. J. Health Manag. 2008, 6, 135–146. [Google Scholar]
- Ushida, Y.; Kato, R.; Niwa, K.; Tanimura, D.; Izawa, H.; Yasui, K.; Takase, T.; Yoshida, Y.; Kawase, M.; Yoshida, T.; et al. Combinational risk factors of metabolic syndrome identified by fuzzy neural network analysis of health-check data. BMC Med. Inform. Decis. Mak. 2012, 12, 80. [Google Scholar] [CrossRef] [PubMed]
- Health Promotion Administration. 2005–2008 Status of Metabolic Syndrome by Ministry of Health and Welfare in Taiwan; Health Promotion Administration: Taipei, Taiwan, 2017. [Google Scholar]
- Ripley, B.D. Pattern Recognition and Neural Networks; Cambridge University Press: Cambridge, UK, 2007. [Google Scholar]
- Kuk, J.L.; Chris, I.A. Age and sex differences the clustering of metabolic syndrome factors: Association with mortality risk. Diabetes Care 2010. [Google Scholar] [CrossRef]
- Hildrum, B.; Mykletun, A.; Hole, T.; Midthjell, K.; Dahl, A.A. Age-specific prevalence of the metabolic syndrome defined by the international diabetes federation and the national cholesterol education program: The Norwegian hunt 2 study. BMC public health 2007, 7, 220. [Google Scholar] [CrossRef]
- Devers, M.C.; Campbell, S.; Simmons, D. Influence of age on the prevalence and components of the metabolic syndrome and the association with cardiovascular disease. BMJ Open Diabetes Res. Care 2016, 4, e000195. [Google Scholar] [CrossRef]
- Huang, K.-C.; Lee, L.-T.; Chen, C.-Y.; Sung, P.-K. All-cause and cardiovascular disease mortality increased with metabolic syndrome in Taiwanese. Obesity 2008, 16, 684–689. [Google Scholar] [CrossRef]
- Yang, X.; Tao, Q.; Sun, F.; Zhan, S. The impact of socioeconomic status on the incidence of metabolic syndrome in a Taiwanese health screening population. Int. J. Public Health 2012, 57, 551–559. [Google Scholar] [CrossRef] [PubMed]
- Lemieux, I.; Poirier, P.; Bergeron, J.; Alméras, N.; Lamarche, B.; Cantin, B.; Dagenais, G.R.; Després, J.-P. Hypertriglyceridemic waist: A useful screening phenotype in preventive cardiology? Can. J. Cardiol. 2007, 23, 23B–31B. [Google Scholar] [CrossRef]
- Mensink, R.P.; Katan, M.B. Effect of dietary fatty acids on serum lipids and lipoproteins. A meta-analysis of 27 trials. Arterioscler. Thromb. Vasc. Biol. 1992, 12, 911–919. [Google Scholar] [CrossRef]
- Angus, D.J.; Hargreaves, M.; Dancey, J.; Febbraio, M.A. Effect of carbohydrate or carbohydrate plus medium-chain triglyceride ingestion on cycling time trial performance. J. Appl. Physiol. 2000, 88, 113–119. [Google Scholar] [CrossRef] [PubMed]
- Bach, A.C.; Babayan, V.K. Medium-chain triglycerides: An update. Am. J. Clin. Nutr. 1982, 36, 950–962. [Google Scholar] [CrossRef] [PubMed]
- Griessen, M.; Ammann, P.; Selz, L.; Bartholdi, P.; Arnaud, M.J.; Bonjour, J.-P.; Blanchard, J. Comparison of the effect of medium-chain and long-chain triacylglycerols on calcium absorption in healthy subjects. Am. J. Clin. Nutr. 1999, 69, 1237–1242. [Google Scholar] [CrossRef] [PubMed]
- Asakura, L.; Lottenberg, A.M.P.; Neves, M.Q.T.S.; Nunes, V.S.; Rocha, J.C.; Passarelli, M.; Nakandakare, E.R.; Quintão, E.C.R. Dietary medium-chain triacylglycerol prevents the postprandial rise of plasma triacylglycerols but induces hypercholesterolemia in primary hypertriglyceridemic subjects. Am. J. Clin. Nutr. 2000, 71, 701–705. [Google Scholar] [CrossRef]
- Bakrania, K.; Edwardson, C.L.; Bodicoat, D.H.; Esliger, D.W.; Gill, J.M.R.; Kazi, A.; Velayudhan, L.; Sinclair, A.J.; Sattar, N.; Biddle, S.J.H.; et al. Associations of mutually exclusive categories of physical activity and sedentary time with markers of cardiometabolic health in English adults: A cross-sectional analysis of the Health Survey for England. BMC Public Health 2016, 16, 25. [Google Scholar] [CrossRef]
© 2018 by the authors. Licensee MDPI, Basel, Switzerland. This article is an open access article distributed under the terms and conditions of the Creative Commons Attribution (CC BY) license (http://creativecommons.org/licenses/by/4.0/).


