The Change of Self-Rated Health According to Working Hours for Two Years by Gender


Abstract
1. Introduction
2. Materials and Methods
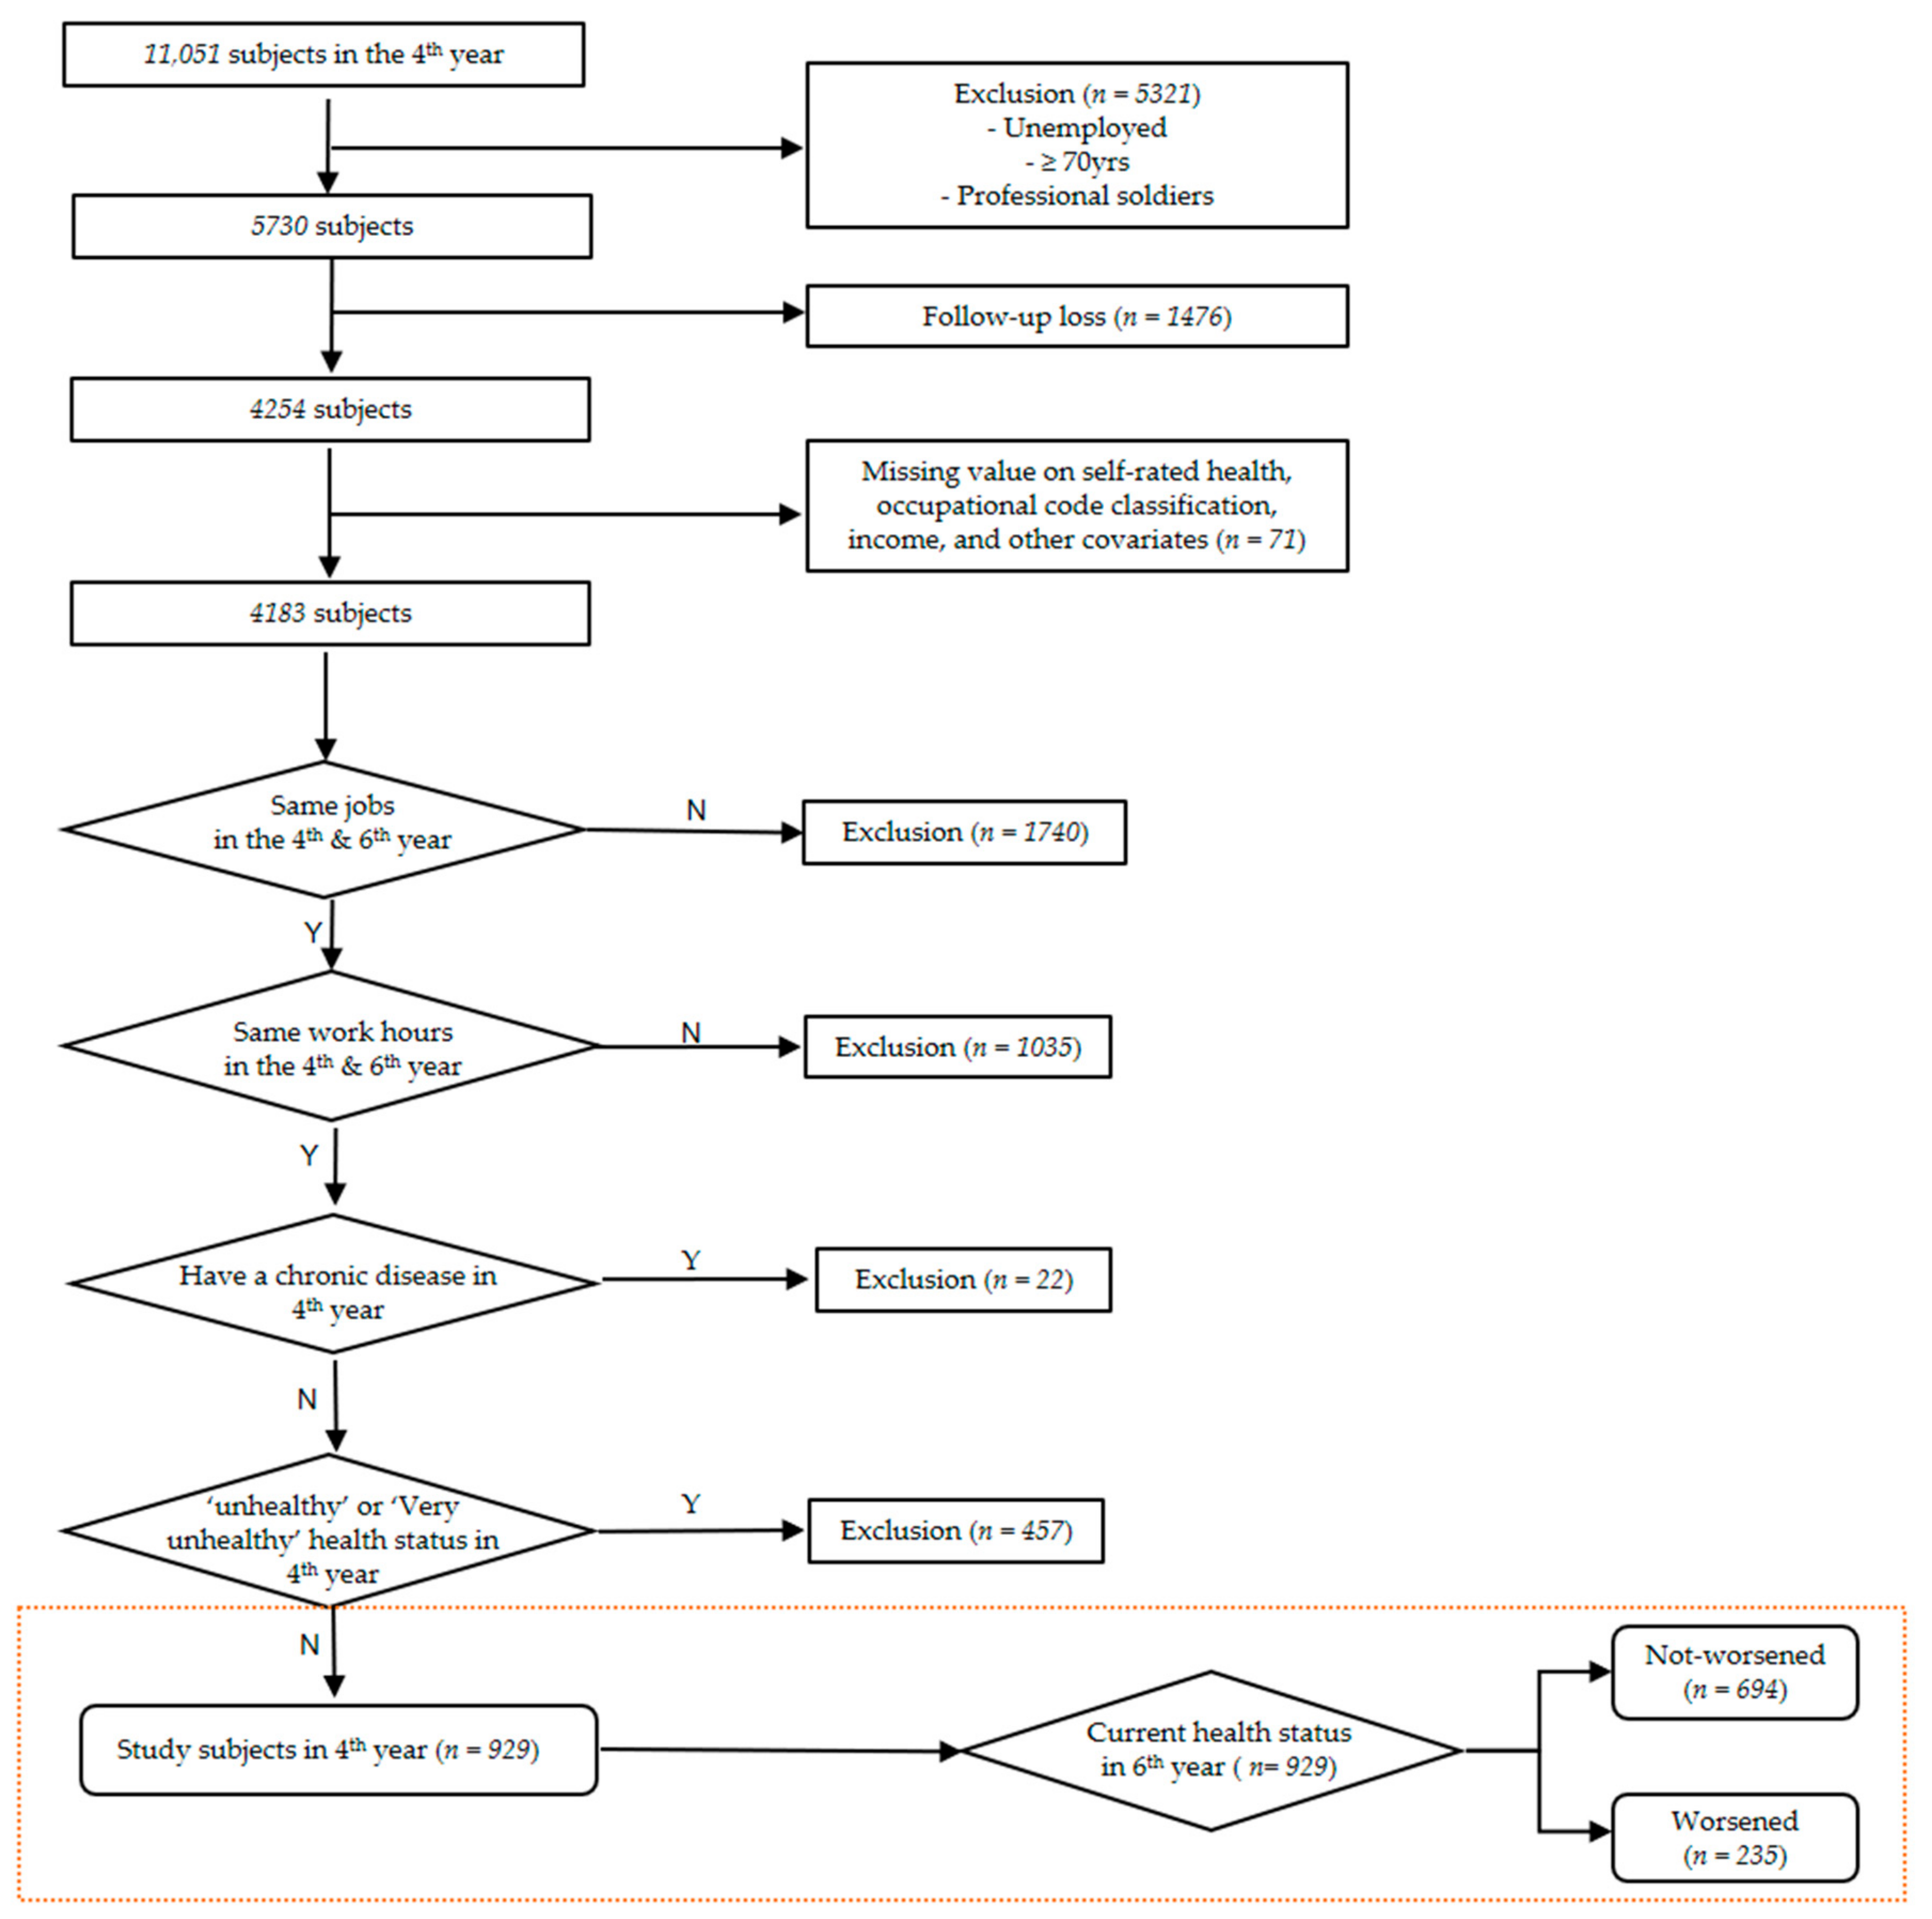
2.1. Study Subjects
2.2. Working Hours
2.3. Self-Rated Health (SRH)
2.4. Socioeconomic Position
2.5. Statistical Analysis
3. Results
4. Discussion
5. Conclusions
Supplementary Materials
Author Contributions
Funding
Conflicts of Interest
References
- OECD. Hours Worked; OECD: Paris, France, 2018. [Google Scholar]
- Jang, T.W.; Kim, H.R.; Lee, H.E.; Myong, J.P.; Koo, J.W.; Ye, B.J.; Won, J.U. Overwork and cerebrocardiovascular disease in Korean adult workers. J. Occup. Health 2015, 57, 51–57. [Google Scholar] [CrossRef] [PubMed]
- Kang, M.Y.; Cho, S.H.; Yoo, M.S.; Kim, T.; Hong, Y.C. Long working hours may increase risk of coronary heart disease. Am. J. Ind. Med. 2014, 57, 1227–1234. [Google Scholar] [CrossRef] [PubMed]
- Lee, D.W.; Hong, Y.C.; Min, K.B.; Kim, T.S.; Kim, M.S.; Kang, M.Y. The effect of long working hours on 10-year risk of coronary heart disease and stroke in the Korean population: The Korea National Health and Nutrition Examination Survey (KNHANES), 2007 to 2013. Ann. Occup. Environ. Med. 2016, 28, 64. [Google Scholar] [CrossRef] [PubMed]
- Kim, W.; Park, E.C.; Lee, T.H.; Kim, T.H. Effect of working hours and precarious employment on depressive symptoms in South Korean employees: A longitudinal study. Occup. Environ. Med. 2016, 73, 816–822. [Google Scholar] [CrossRef] [PubMed]
- Kim, I.; Kim, H.; Lim, S.; Lee, M.; Bahk, J.; June, K.J.; Kim, S.; Chang, W.J. Working hours and depressive symptomatology among full-time employees: Results from the fourth Korean National Health and Nutrition Examination Survey (2007–2009). Scand. J. Work. Environ. Health 2013, 39, 515–520. [Google Scholar] [CrossRef] [PubMed]
- Yoon, J.H.; Jung, P.K.; Roh, J.; Seok, H.; Won, J.U. Relationship between Long Working Hours and Suicidal Thoughts: Nationwide Data from the 4th and 5th Korean National Health and Nutrition Examination Survey. PLoS ONE 2015, 10, e0129142. [Google Scholar] [CrossRef] [PubMed]
- Cho, S.S.; Ki, M.; Kim, K.H.; Ju, Y.S.; Paek, D.; Lee, W. Working hours and self-rated health over 7 years: Gender differences in a Korean longitudinal study. BMC Public Health 2015, 15, 1287. [Google Scholar] [CrossRef] [PubMed]
- Song, J.T.; Lee, G.; Kwon, J.; Park, J.W.; Choi, H.; Lim, S. The Association between Long Working Hours and Self-Rated Health. Ann. Occup. Environ. Med. 2014, 26, 2. [Google Scholar] [CrossRef] [PubMed]
- Kivimaki, M.; Jokela, M.; Nyberg, S.T.; Singh-Manoux, A.; Fransson, E.I.; Alfredsson, L.; Bjorner, J.B.; Borritz, M.; Burr, H.; Casini, A.; et al. Long working hours and risk of coronary heart disease and stroke: A systematic review and meta-analysis of published and unpublished data for 603,838 individuals. Lancet 2015, 386, 1739–1746. [Google Scholar] [CrossRef]
- Virtanen, M.; Ferrie, J.E.; Singh-Manoux, A.; Shipley, M.J.; Vahtera, J.; Marmot, M.G.; Kivimäki, M. Overtime work and incident coronary heart disease: The Whitehall II prospective cohort study. Eur. Heart J. 2010, 31, 1737–1744. [Google Scholar] [CrossRef] [PubMed]
- Virtanen, M.; Heikkila, K.; Jokela, M.; Ferrie, J.E.; Batty, G.D.; Vahtera, J.; Kivimäki, M. Long working hours and coronary heart disease: A systematic review and meta-analysis. Am. J. Epidemiol. 2012, 176, 586–596. [Google Scholar] [CrossRef] [PubMed]
- Van der Hulst, M. Long workhours and health. Scand. J. Work. Environ. Health 2003, 29, 171–188. [Google Scholar] [CrossRef] [PubMed]
- Artazcoz, L.; Cortes, I.; Escriba-Aguir, V.; Cascant, L.; Villegas, R. Understanding the relationship of long working hours with health status and health-related behaviours. J. Epidemiol. Community Health 2009, 63, 521–527. [Google Scholar] [CrossRef] [PubMed]
- Virtanen, M.; Ferrie, J.E.; Singh-Manoux, A.; Shipley, M.J.; Stansfeld, S.A.; Marmot, M.G.; Ahola, K.; Vahtera, J.; Kivimäki, M. Long working hours and symptoms of anxiety and depression: A 5-year follow-up of the Whitehall II study. Psychol. Med. 2011, 41, 2485–2494. [Google Scholar] [CrossRef] [PubMed]
- Bauer, G.F.; Huber, C.A.; Jenny, G.J.; Muller, F.; Hammig, O. Socioeconomic status, working conditions and self-rated health in Switzerland: Explaining the gradient in men and women. Int. J. Public Health 2009, 54, 23–30. [Google Scholar] [CrossRef] [PubMed]
- Conway, S.H.; Cayuela, A.; Delclos, G.L.; Pompeii, L.A.; Ronda, E. Association between long work hours and poor self-reported general health among Latin American immigrant and native workers in the United States and Spain. Am. J. Ind. Med. 2016, 59, 1105–1111. [Google Scholar] [CrossRef] [PubMed]
- Idler, E.L.; Benyamini, Y. Self-rated health and mortality: A review of twenty-seven community studies. J. Health Soc. Behav. 1997, 38, 21–37. [Google Scholar] [CrossRef] [PubMed]
- Jeon, S.H.; Leem, J.H.; Park, S.G.; Heo, Y.S.; Lee, B.J.; Moon, S.H.; Jung, D.Y.; Kim, H.C. Association among Working Hours, Occupational Stress, and Presenteeism among Wage Workers: Results from the Second Korean Working Conditions Survey. Ann. Occup. Environ. Med. 2014, 26, 6. [Google Scholar] [CrossRef] [PubMed]
- Dinh, H.; Strazdins, L.; Welsh, J. Hour-glass ceilings: Work-hour thresholds, gendered health inequities. Soc. Sci. Med. 2017, 176, 42–51. [Google Scholar] [CrossRef] [PubMed]
- Milner, A.; Smith, P.; LaMontagne, A.D. Working hours and mental health in Australia: Evidence from an Australian population-based cohort, 2001–2012. Occup. Environ. Med. 2015, 72, 573–579. [Google Scholar] [CrossRef] [PubMed]
- Khang, Y.H.; Kim, H.R. Socioeconomic Inequality in mortality using 12-year follow-up data from nationally representative surveys in South Korea. Int. J. Equity Health 2016, 15, 51. [Google Scholar] [CrossRef] [PubMed]
- User’s Guide of the Korean Labor and Income Panel Study (KLIPS); Korea Labor Institute: Sejong-si, Korea, 2016.
- Sekine, M.; Chandola, T.; Martikainen, P.; Marmot, M.; Kagamimori, S. Socioeconomic inequalities in physical and mental functioning of British, Finnish, and Japanese civil servants: Role of job demand, control, and work hours. Soc. Sci. Med. 2009, 69, 1417–1425. [Google Scholar] [CrossRef] [PubMed]
- Sekine, M.; Chandola, T.; Martikainen, P.; Marmot, M.; Kagamimori, S. Socioeconomic inequalities in physical and mental functioning of Japanese civil servants: Explanations from work and family characteristics. Soc. Sci. Med. 2006, 63, 430–445. [Google Scholar] [CrossRef] [PubMed]
- Krantz, G.; Berntsson, L.; Lundberg, U. Total workload, work stress and perceived symptoms in Swedish male and female white-collar employees. Eur. J. Public Health 2005, 15, 209–214. [Google Scholar] [CrossRef] [PubMed]
- Jung, S.M. The status and characteristics of women part-time workers. Mon. Rev. Labour 2010, 12, 73–86. [Google Scholar]
- Rugulies, R.; Aust, B.; Burr, H.; Bultmann, U. Job insecurity, chances on the labour market and decline in self-rated health in a representative sample of the Danish workforce. J. Epidemiol. Community Health 2008, 62, 245–250. [Google Scholar] [CrossRef] [PubMed]
- Ferrie, J.E.; Shipley, M.J.; Newman, K.; Stansfeld, S.A.; Marmot, M. Self-reported job insecurity and health in the Whitehall II study: Potential explanations of the relationship. Soc. Sci. Med. 2005, 60, 1593–1602. [Google Scholar] [CrossRef] [PubMed]
- León, M.; Choi, Y.J.; Ahn, J.-S. When flexibility meets familialism: Two tales of gendered labour markets in Spain and South Korea. J. Eur. Soc. Policy 2016, 26, 344–357. [Google Scholar] [CrossRef]
- Lee, J.M. The Labor Market in South Korea, 2000–2016; IZA World of Labor: Bonn, Germany, 2017. [Google Scholar]
- Theorell, T.; Hammarstrom, A.; Gustafsson, P.E.; Magnusson Hanson, L.; Janlert, U.; Westerlund, H. Job strain and depressive symptoms in men and women: A prospective study of the working population in Sweden. J. Epidemiol. Community Health 2014, 68, 78–82. [Google Scholar] [CrossRef] [PubMed]
- Keum, J.H. The Phenomenon and Task of Women Labour Market; Korea Institute Labour: Sejong-si, Korea, 2001. [Google Scholar]
- Dahlgren, A.; Kecklund, G.; Theorell, T.; Åkerstedt, T. Day-to-day variation in saliva cortisol—Relation with sleep, stress and self-rated health. Boil. Psychol. 2009, 82, 149–155. [Google Scholar] [CrossRef] [PubMed]
- Svedberg, P.; Bardage, C.; Sandin, S.; Pedersen, N.L. A prospective study of health, life-style and psychosocial predictors of self-rated health. Eur. J. Epidemiol. 2006, 21, 767–776. [Google Scholar] [CrossRef] [PubMed]
- Thoits, P.A. Stress and health: Major findings and policy implications. J. Health Soc. Behav. 2010, 51 (Suppl. 1), S41–S53. [Google Scholar] [CrossRef] [PubMed]
- Choi, E.S. Health Inequalities among Korean Employees. Saf. Health Work 2017, 8, 371–377. [Google Scholar] [CrossRef] [PubMed]
- Gamperiene, M. Health and Work Environment among Women in Unskilled Occupations; University of Oslo: Oslo, Norway, 2008. [Google Scholar]
- Seok, H.; Choi, S.J.; Yoon, J.H.; Song, G.G.; Won, J.U.; Kim, J.H.; Roh, J.; Jung, J.H. The Association between Osteoarthritis and Occupational Clusters in the Korean Population: A Nationwide Study. PLoS ONE 2017, 12, e0170229. [Google Scholar] [CrossRef] [PubMed]
- Kim, Y.S. The Status of Working Hours and Strategy for Shortening; KLSI Issu Paper; Korea Labour & Society Institute: Seoul, Korea, 2017. [Google Scholar]
- Lee, S.Y. The Research for Workhours, Health, and Productivity; Korea Labour Institute: Sejong, Korea, 2015. [Google Scholar]
- Siegrist, J.; Starke, D.; Chandola, T.; Godin, I.; Marmot, M.; Niedhammer, I.; Peter, R. The measurement of effort–reward imbalance at work: European comparisons. Soc. Sci. Med. 2004, 58, 1483–1499. [Google Scholar] [CrossRef]
- Van Vegchel, N.; De Jonge, J.; Bosma, H.; Schaufeli, W. Reviewing the effort–reward imbalance model: Drawing up the balance of 45 empirical studies. Soc. Sci. Med. 2005, 60, 1117–1131. [Google Scholar] [CrossRef] [PubMed]
- Shin, H.Y.; Han, B.Y. Overwork and Organization: The Effect of Overtime Work on Female Managerial Position in Organizations in Korea; Korea Labor Institute: Sejong, Korea, 2016. [Google Scholar]
- Time Use across the World. Gender Data Portal. OECD. 2016. Available online: http://www.oecd.org/gender/data/balancingpaidworkunpaidworkandleisure.htm (accessed on 11 September 2018).
- Arber, S.; Gilbert, G.N.; Dale, A. Paid employment and women’s health: A benefit or a source of role strain? Sociol. Health Illn. 1985, 7, 375–400. [Google Scholar] [CrossRef]
- Williams, C.L.; Muller, C.; Kilanski, K. Gendered Organizations in the New Economy. Gend. Soc. Off. Publ. Sociol. Women Soc. 2012, 26, 549–573. [Google Scholar] [CrossRef] [PubMed]
- Benyamini, Y.; Blumstein, T.; Lusky, A.; Modan, B. Gender differences in the self-rated health-mortality association: Is it poor self-rated health that predicts mortality or excellent self-rated health that predicts survival? Gerontologist 2003, 43, 396–405. [Google Scholar] [CrossRef] [PubMed]
- Scott, W.K.; Macera, C.A.; Cornman, C.B.; Sharpe, P.A. Functional health status as a predictor of mortality in men and women over 65. J. Clin. Epidemiol. 1997, 50, 291–296. [Google Scholar] [CrossRef]
- Wolinsky, F.D.; Johnson, R.J. Perceived health status and mortality among older men and women. J. Gerontol. 1992, 47, S304–S312. [Google Scholar] [CrossRef] [PubMed]
- Helmer, C.; Barberger-Gateau, P.; Letenneur, L.; Dartigues, J.F. Subjective health and mortality in French elderly women and men. J. Gerontol. Ser. B Psychol. Sci. Soc. Sci. 1999, 54, S84–S92. [Google Scholar] [CrossRef]
- McCallum, J.; Shadbolt, B.; Wang, D. Self-rated health and survival: A 7-year follow-up study of Australian elderly. Am. J. Public Health 1994, 84, 1100–1105. [Google Scholar] [CrossRef] [PubMed]
- Jylha, M.; Guralnik, J.M.; Ferrucci, L.; Jokela, J.; Heikkinen, E. Is self-rated health comparable across cultures and genders? J. Gerontol. Ser. B Psychol. Sci. Soc. Sci. 1998, 53, S144–S152. [Google Scholar] [CrossRef]
- Khang, Y.H.; Kim, H.R. Gender differences in self-rated health and mortality association: Role of pain-inducing musculoskeletal disorders. J. Women’s Health 2010, 19, 109–116. [Google Scholar] [CrossRef] [PubMed]
- Lee, S.Y.; Kim, S.J.; Yoo, K.B.; Lee, S.G.; Park, E.-C. Gender gap in self-rated health in South Korea compared with the United States. Int. J. Clin. Health Psychol. 2016, 16, 11–20. [Google Scholar] [CrossRef]
- Deeg, D.J.; Kriegsman, D.M. Concepts of self-rated health: Specifying the gender difference in mortality risk. Gerontologist 2003, 43, 376–386. [Google Scholar] [CrossRef] [PubMed]


| N (%) | |||||||||||||
|---|---|---|---|---|---|---|---|---|---|---|---|---|---|
| Men | Women | ||||||||||||
| N | <40 | 40–46 | 47–52 | 53–68 | >68 | N | <40 | 40–46 | 47–52 | 53–68 | >68 | ||
| 571 | 25 (4.4) | 154 (27.0) | 117 (20.5) | 184 (32.2) | 91 (15.9) | 358 | 29 (8.1) | 142 (39.7) | 88 (24.6) | 56 (15.6) | 43 (12.0) | ||
| Age | 15~29 | 94 | 2 (2.1) | 24 (25.5) | 22 (23.4) | 33 (35.1) | 13 (13.8) | 141 | 9 (6.4) | 70 (49.7) | 40 (28.4) | 19 (13.5) | 3 (2.1) |
| 30~39 | 197 | 5 (2.5) | 39 (19.8) | 52 (26.4) | 78 (39.6) | 23 (11.7) | 78 | 12 (15.4) | 34 (43.6) | 22 (28.2) | 5 (6.4) | 5 (6.4) | |
| 40~49 | 176 | 5 (2.8) | 61 (34.7) | 27 (15.3) | 54 (30.7) | 29 (16.5) | 100 | 5 (5.0) | 28 (28.0) | 20 (20.0) | 25 (25.0) | 22 (22.0) | |
| 50~59 | 88 | 10 (11.4) | 28 (31.8) | 14 (15.9) | 18 (20.5) | 18 (20.5) | 24 | 1 (4.2) | 7 (29.2) | 3 (12.5) | 6 (25.0) | 7 (29.2) | |
| 60~69 | 16 | 3 (18.8) | 2 (12.5) | 2 (12.5) | 1 (6.3) | 8 (50.0) | 15 | 2 (13.3) | 3 (20.0) | 3 (20.0) | 1 (6.7) | 6 (40.0) | |
| Education level | Less than elementary school | 39 | 7 (18.0) | 4 (10.3) | 7 (18.0) | 10 (25.6) | 11 (28.2) | 52 | 3 (5.8) | 11 (21.2) | 8 (15.4) | 12 (23.1) | 18 (34.6) |
| Middle school | 74 | 8 (10.8) | 8 (10.8) | 8 (10.8) | 34 (46.0) | 16 (21.6) | 44 | 2 (4.6) | 8 (18.2) | 7 (15.9) | 13 (29.6) | 14 (31.8) | |
| High school | 242 | 8 (3.3) | 50 (20.7) | 45 (18.6) | 88 (36.4) | 51 (21.1) | 110 | 7 (6.4) | 41 (37.3) | 35 (31.8) | 19 (17.3) | 8 (7.3) | |
| College | 51 | 0 (0.0) | 12 (23.5) | 14 (27.5) | 19 (37.3) | 6 (11.8) | 58 | 2 (3.5) | 27 (46.6) | 20 (34.5) | 9 (15.5) | 0 (0.0) | |
| University or more | 165 | 2 (1.2) | 80 (48.5) | 43 (26.1) | 33 (20.0) | 7 (4.2) | 94 | 15 (16.0) | 55 (58.5) | 18 (19.2) | 3 (3.2) | 3 (3.2) | |
| Employment status | Permanent worker | 401 | 6 (1.5) | 132 (32.9) | 95 (23.7) | 126 (31.4) | 42 (10.5) | 262 | 12 (4.6) | 130 (49.6) | 70 (26.7) | 39 (14.9) | 11 (4.2) |
| Temporary worker | 50 | 7 (14.0) | 9 (18.0) | 9 (18.0) | 17 (34.0) | 8 (16.0) | 52 | 12 (23.1) | 8 (15.4) | 17 (32.7) | 8 (15.4) | 7 (13.5) | |
| Self-employed | 120 | 12 (10.0) | 13 (10.8) | 13 (10.8) | 41 (34.2) | 41 (34.2) | 44 | 5 (11.4) | 4 (9.1) | 1 (2.3) | 9 (20.5) | 25 (56.8) | |
| Occupation | Managers | 24 | 0 (0.0) | 11 (45.8) | 5 (20.8) | 5 (20.8) | 3 (12.5) | 2 | 0 (0.0) | 2 (100.0) | 0 (0.0) | 0 (0.0) | 0 (0.0) |
| Professionals | 47 | 0 (0.0) | 27 (57.5) | 15 (31.9) | 4 (8.5) | 1 (2.1) | 66 | 5 (7.6) | 39 (59.1) | 17 (25.8) | 4 (6.1) | 1 (1.5) | |
| Technicians | 46 | 2 (4.4) | 20 (43.5) | 10 (21.7) | 10 (21.7) | 4 (8.7) | 25 | 5 (20.0) | 8 (32.0) | 8 (32.0) | 3 (12.0) | 1 (4.0) | |
| Clerical workers | 90 | 0 (0.0) | 31 (34.4) | 25 (27.8) | 31 (34.4) | 3 (3.3) | 97 | 5 (5.2) | 53 (54.6) | 23 (23.7) | 13 (13.4) | 3 (3.1) | |
| Service workers | 21 | 0 (0.0) | 7 (33.3) | 6 (28.6) | 4 (19.1) | 4 (19.1) | 43 | 7 (16.3) | 10 (23.3) | 9 (20.9) | 4 (9.3) | 13 (30.2) | |
| Sales workers | 48 | 5 (10.4) | 4 (8.3) | 9 (18.8) | 19 (39.6) | 11 (22.9) | 39 | 1 (2.6) | 10 (25.6) | 5 (12.8) | 8 (20.5) | 15 (38.5) | |
| Skilled agriculture, forestry, and fishery workers | 10 | 1 (10.0) | 1 (10.0) | 3 (30.0) | 2 (20.0) | 3 (30.0) | 5 | 1 (20.0) | 0 (0.0) | 0 (0.0) | 2 (40.0) | 2 (40.0) | |
| Craft workers | 143 | 11 (7.7) | 27 (18.9) | 20 (14.0) | 50 (35.0) | 35 (24.5) | 25 | 1 (4.0) | 4 (16.0) | 10 (40.0) | 9 (36.0) | 1 (4.0) | |
| Machinery operators | 104 | 3 (2.9) | 20 (19.2) | 17 (16.4) | 44 (42.3) | 20 (19.2) | 37 | 1 (2.7) | 7 (18.9) | 13 (35.1) | 12 (32.4) | 4 (10.8) | |
| Elementary occupations | 38 | 3 (7.9) | 6 (15.8) | 7 (18.4) | 15 (39.5) | 7 (18.4) | 19 | 3 (15.8) | 9 (47.4) | 3 (15.8) | 1 (5.3) | 3 (15.8) | |
| Household income(/month) unit: KRW | ≤687,500 | 137 | 12 (8.8) | 18 (13.1) | 29 (21.2) | 50 (36.5) | 28 (20.4) | 96 | 11 (11.5) | 24 (25.0) | 24 (25.0) | 17 (17.7) | 20 (20.8) |
| 687,500~1,000,000 | 167 | 7 (4.2) | 36 (21.6) | 32 (19.2) | 60 (35.9) | 32 (19.2) | 78 | 3 (3.9) | 22 (28.2) | 23 (29.5) | 16 (20.5) | 14 (18.0) | |
| 1,000,000~1,443,400 | 134 | 6 (4.5) | 48 (35.8) | 23 (17.2) | 36 (26.9) | 21 (15.7) | 86 | 7 (8.1) | 43 (50.0) | 18 (20.9) | 12 (14.0) | 6 (7.0) | |
| >1,443,400 | 133 | 0 (0.0) | 52 (39.1) | 33 (24.8) | 38 (28.6) | 10 (7.5) | 98 | 8 (8.2) | 53 (54.1) | 23 (23.5) | 11 (11.2) | 3 (3.1) | |
| Marital status | Unmarried | 99 | 5 (5.1) | 24 (24.2) | 25 (25.3) | 37 (37.4) | 8 (8.1) | 131 | 10 (7.6) | 66 (50.4) | 35 (26.7) | 16 (12.2) | 4 (3.1) |
| Married | 455 | 18 (4.0) | 127 (27.9) | 89 (19.6) | 143 (31.4) | 78 (17.1) | 199 | 16 (8.0) | 69 (34.7) | 51 (25.6) | 34 (17.1) | 29 (14.6) | |
| Widowed, divorced, and separated | 17 | 2 (11.8) | 3 (17.7) | 3 (17.7) | 4 (23.5) | 5 (29.4) | 28 | 3 (10.7) | 7 (25.0) | 2 (7.1) | 6 (21.4) | 10 (35.7) | |
| N (%) | |||||||
|---|---|---|---|---|---|---|---|
| Men | Women | ||||||
| Total | Not-Worsened | Worsened | Total | Not-Worsened | Worsened | ||
| 571 | 416 (72.8) | 155 (27.2) | 358 | 278 (77.7) | 80 (22.3) | ||
| Age | 15~29 | 94 | 69 (73.4) | 25 (26.6) | 141 | 121 (85.8) | 20 (14.2) |
| 30~39 | 197 | 140 (71.1) | 57 (28.9) | 78 | 60 (76.9) | 18 (23.1) | |
| 40~49 | 176 | 127 (72.2) | 49 (27.8) | 100 | 76 (76.0) | 24 (24.0) | |
| 50~59 | 88 | 66 (75.0) | 22 (25.0) | 24 | 14 (58.3) | 10 (41.7) | |
| 60~69 | 16 | 14 (87.5) | 2 (12.5) | 15 | 7 (46.7) | 8 (53.3) | |
| Educational level | Less than elementary school | 39 | 26 (66.7) | 13 (33.3) | 52 | 27 (51.9) | 25 (48.1) |
| Middle school | 74 | 52 (70.3) | 22 (29.7) | 44 | 36 (81.8) | 8 (18.2) | |
| High school | 242 | 187 (77.3) | 55 (22.7) | 110 | 86 (78.2) | 24 (21.8) | |
| College | 51 | 35 (68.6) | 16 (31.4) | 58 | 48 (82.8) | 10 (17.2) | |
| University or more | 165 | 116 (70.3) | 49 (29.7) | 94 | 81 (86.2) | 13 (13.8) | |
| Employment status | Permanent worker | 401 | 287 (71.6) | 114 (28.4) | 262 | 207 (79.0) | 55 (21.0) |
| Temporary worker | 50 | 34 (68.0) | 16 (32.0) | 52 | 38 (73.1) | 14 (26.9) | |
| Self-employed | 120 | 95 (79.2) | 25 (20.8) | 44 | 33 (75.0) | 11 (25.0) | |
| Occupation | Managers | 24 | 15 (62.5) | 9 (37.5) | 2 | 2 (100.0) | 0 (0.0) |
| Professionals | 47 | 38 (80.9) | 9 (19.2) | 66 | 59 (89.4) | 7 (10.6) | |
| Technicians | 46 | 30 (65.2) | 16 (34.8) | 25 | 19 (76.0) | 6 (24.0) | |
| Clerical workers | 90 | 64 (71.1) | 26 (28.9) | 97 | 83 (85.6) | 14 (14.4) | |
| Service workers | 21 | 15 (71.4) | 6 (28.6) | 43 | 30 (69.8) | 13 (30.2) | |
| Sales workers | 48 | 37 (77.1) | 11 (22.9) | 39 | 28 (71.8) | 11 (28.2) | |
| Skilled agriculture, forestry, and fishery workers | 10 | 8 (80.0) | 2 (20.0) | 5 | 4 (80.0) | 1 (20.0) | |
| Craft workers | 143 | 105 (73.4) | 38 (26.6) | 25 | 14 (56.0) | 11 (44.0) | |
| Machinery operators | 104 | 71 (68.3) | 33 (31.7) | 37 | 28 (75.7) | 9 (24.3) | |
| Elementary occupations | 38 | 33 (86.8) | 5 (13.2) | 19 | 11 (57.9) | 8 (42.1) | |
| Household income(/month) unit: KRW | ≤687,500 | 137 | 102 (74.5) | 35 (25.6) | 96 | 67 (69.8) | 29 (30.2) |
| 687,500~1,000,000 | 167 | 122 (73.1) | 45 (27.0) | 78 | 57 (73.1) | 21 (26.9) | |
| 1,000,000~1,443,400 | 134 | 97 (72.4) | 37 (27.6) | 86 | 68 (79.1) | 18 (20.9) | |
| >1,443,400 | 133 | 95 (71.4) | 38 (28.6) | 98 | 86 (87.8) | 12 (12.2) | |
| Workhours per week | <40 | 25 | 20 (80.0) | 5 (20.0) | 29 | 18 (62.1) | 11 (37.9) |
| 40~46 | 154 | 113 (73.4) | 41 (26.6) | 142 | 120 (84.5) | 22 (15.5) | |
| 47~52 | 117 | 84 (71.8) | 33 (28.2) | 88 | 70 (79.6) | 18 (20.5) | |
| 53~68 | 184 | 131 (71.2) | 53 (28.8) | 56 | 41 (73.2) | 15 (26.8) | |
| >68 | 91 | 68 (74.7) | 23 (25.3) | 43 | 29 (67.4) | 14 (32.6) | |
| Marital status | Unmarried | 99 | 75 (75.8) | 24 (24.2) | 131 | 114 (87.0) | 17 (13.0) |
| Married | 455 | 329 (72.3) | 126 (27.7) | 199 | 149 (74.9) | 50 (25.1) | |
| Widowed, divorced, and separated | 17 | 12 (70.6) | 5 (29.4) | 28 | 15 (53.6) | 13 (46.4) | |
| Total | Men | Women | ||||||||
|---|---|---|---|---|---|---|---|---|---|---|
| N | Case | Crude Model | Model 1 | Model 2 | N | Case | Crude Model | Model 1 | Model 2 | |
| PR (95% CI) | PR (95% CI) | PR (95% CI) | PR (95% CI) | PR (95% CI) | PR (95% CI) | |||||
| 571 | 155 | 358 | 80 | |||||||
| Working hours per week | ||||||||||
| <40 | 25 | 5 | 0.71 (0.70, 0.73) | 0.73 (0.71, 0.75) | 0.89 (0.86, 0.91) | 29 | 11 | 3.68 (3.63, 3.74) | 3.86 (3.79, 3.93) | 5.35 (5.23, 5.47) |
| 40~46 | 154 | 41 | Ref | 142 | 22 | Ref | ||||
| 47~52 | 117 | 33 | 1.14 (1.13, 1.15) | 1.13 (1.12, 1.14) | 1.19 (1.18, 1.21) | 88 | 18 | 1.52 (1.50, 1.54) | 1.19 (1.17, 1.20) | 1.04 (1.02, 1.06) |
| 53~68 | 184 | 53 | 1.22 (1.21, 1.23) | 1.24 (1.23, 1.25) | 1.28 (1.27, 1.30) | 56 | 15 | 1.86 (1.83, 1.88) | 1.62 (1.59, 1.65) | 2.19 (2.15, 2.23) |
| >68 | 91 | 23 | 0.89 (0.88, 0.90) | 0.98 (0.97, 1.00) | 1.14 (1.13, 1.16) | 43 | 14 | 2.13 (2.09, 2.16) | 2.48 (2.43, 2.53) | 2.64 (2.58, 2.70) |
© 2018 by the authors. Licensee MDPI, Basel, Switzerland. This article is an open access article distributed under the terms and conditions of the Creative Commons Attribution (CC BY) license (http://creativecommons.org/licenses/by/4.0/).
Share and Cite
Ryu, J.; Yoon, Y.; Kim, H.; Kang, C.W.; Jung-Choi, K. The Change of Self-Rated Health According to Working Hours for Two Years by Gender. Int. J. Environ. Res. Public Health 2018, 15, 1984. https://doi.org/10.3390/ijerph15091984
Ryu J, Yoon Y, Kim H, Kang CW, Jung-Choi K. The Change of Self-Rated Health According to Working Hours for Two Years by Gender. International Journal of Environmental Research and Public Health. 2018; 15(9):1984. https://doi.org/10.3390/ijerph15091984
Chicago/Turabian StyleRyu, Jia, Yeogyeong Yoon, Hyunjoo Kim, Chung Won Kang, and Kyunghee Jung-Choi. 2018. "The Change of Self-Rated Health According to Working Hours for Two Years by Gender" International Journal of Environmental Research and Public Health 15, no. 9: 1984. https://doi.org/10.3390/ijerph15091984
APA StyleRyu, J., Yoon, Y., Kim, H., Kang, C. W., & Jung-Choi, K. (2018). The Change of Self-Rated Health According to Working Hours for Two Years by Gender. International Journal of Environmental Research and Public Health, 15(9), 1984. https://doi.org/10.3390/ijerph15091984