Transmission of Influenza A in a Student Office Based on Realistic Person-to-Person Contact and Surface Touch Behaviour

Abstract
1. Introduction
2. Materials and Methods
2.1. Parameter Setting
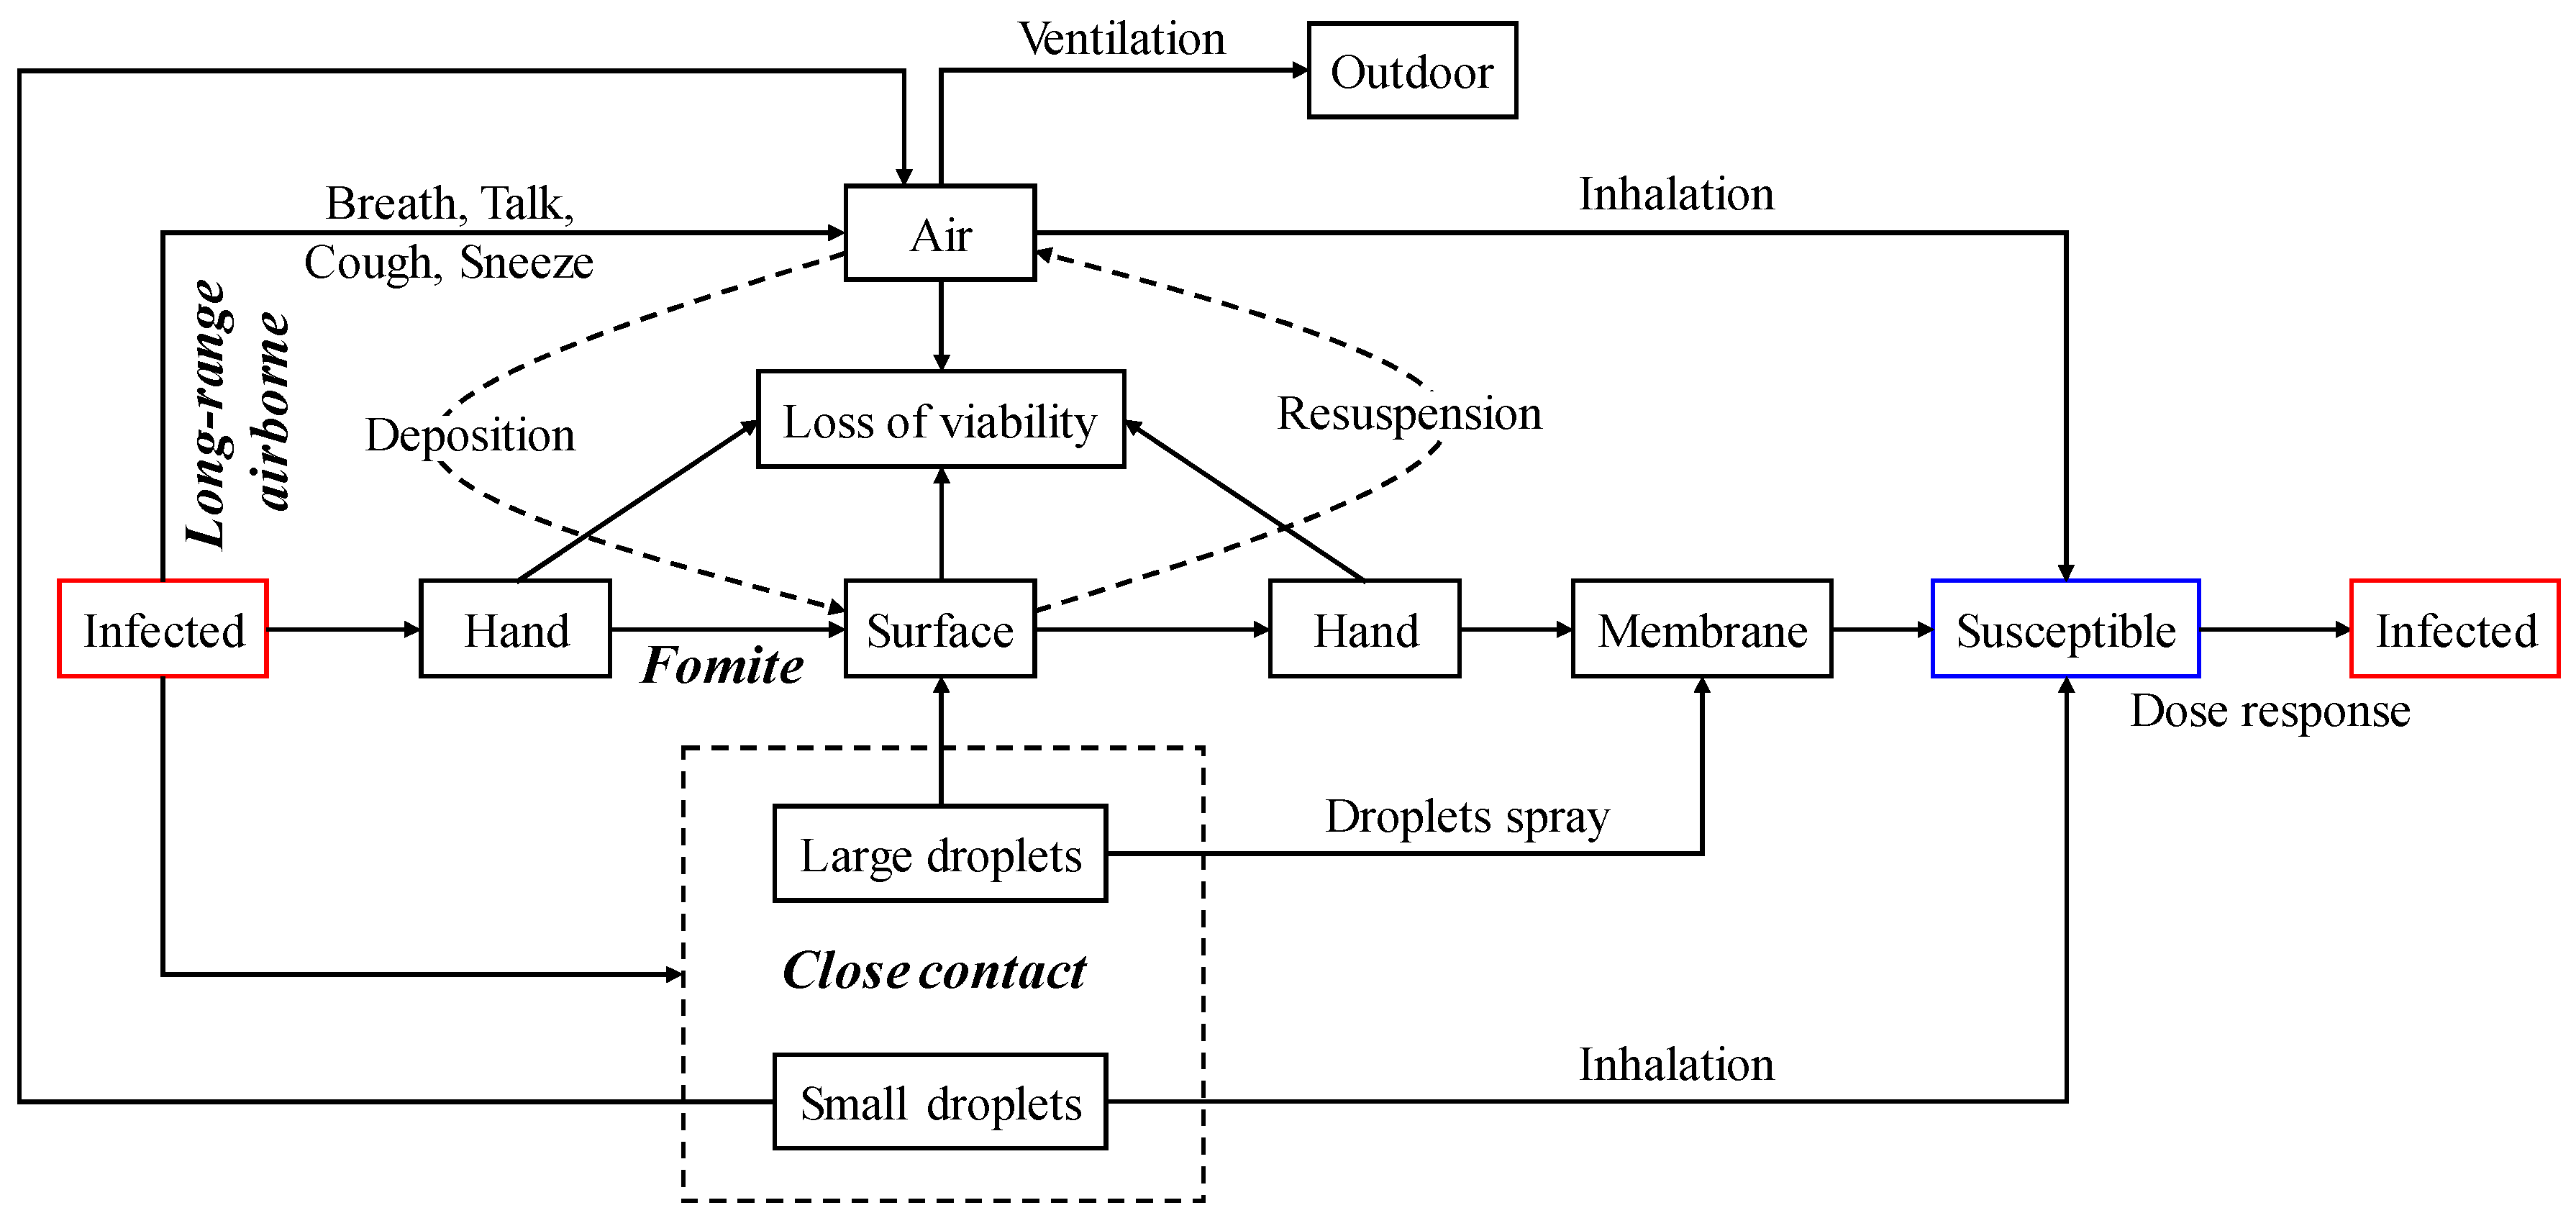
2.2. Long-Range Airborne
2.3. Fomite
2.4. Close Contact
3. Results
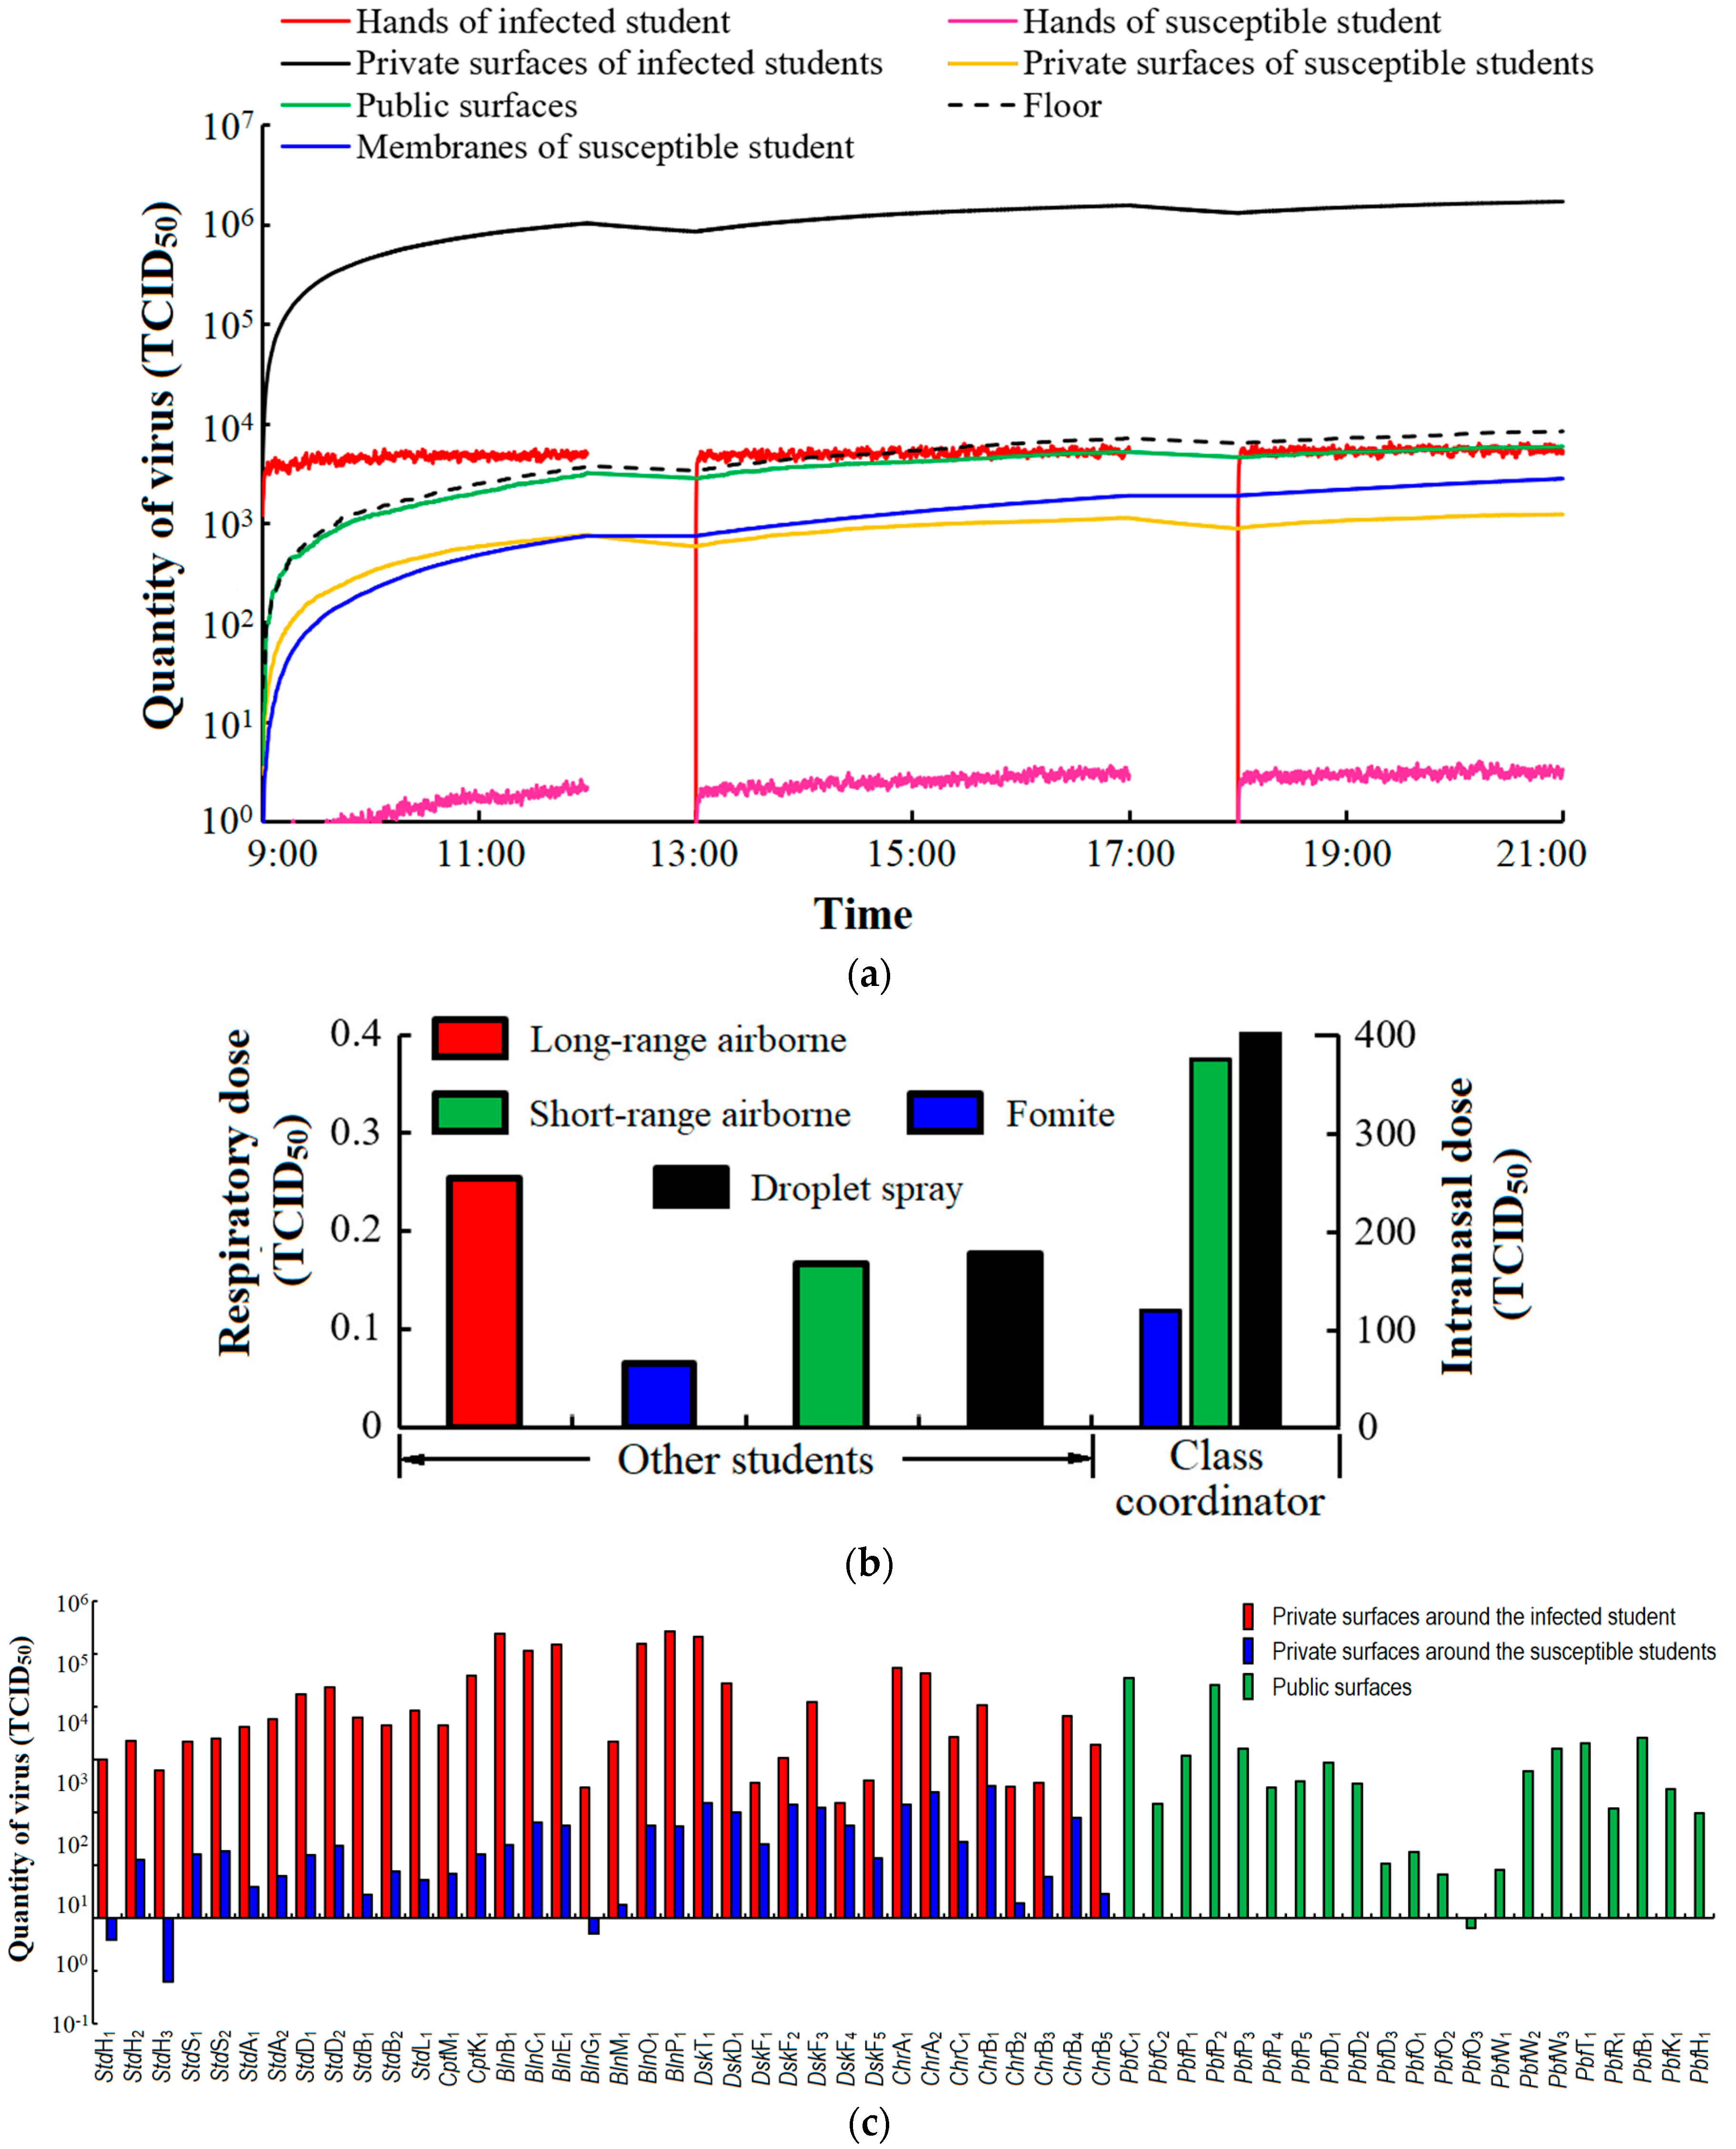
3.1. Spatio-Temporal Virus Distribution
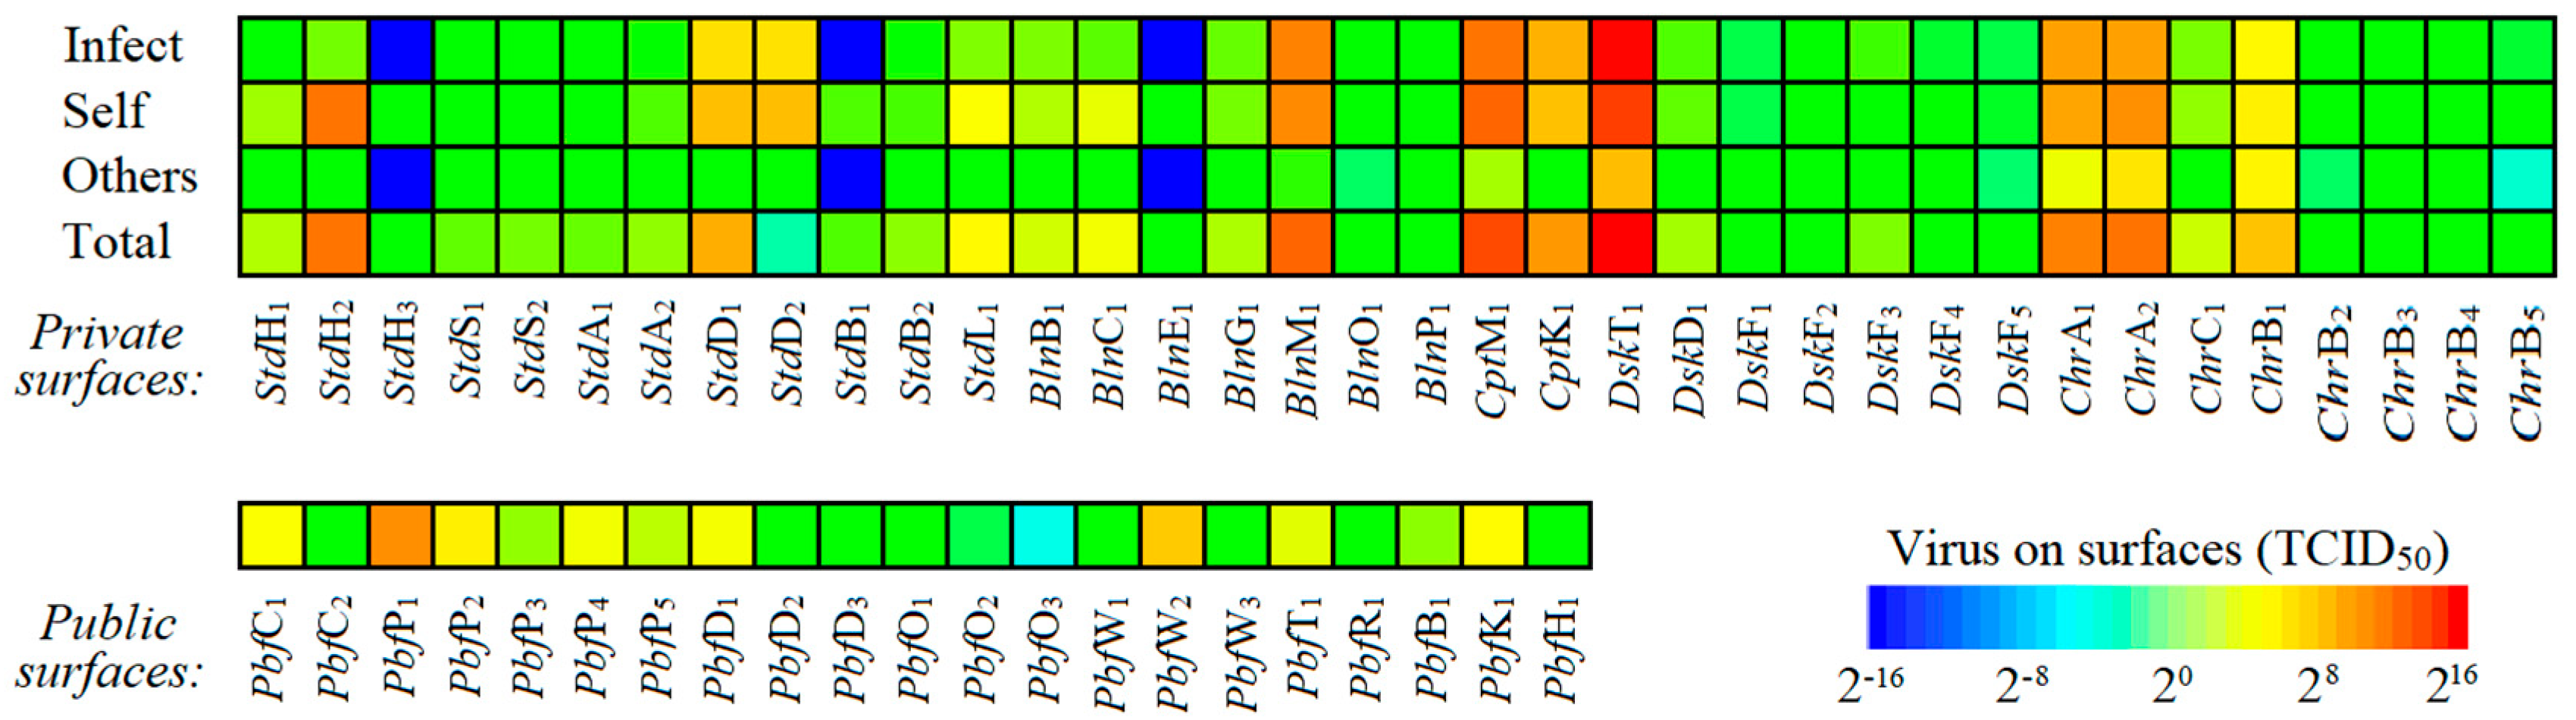
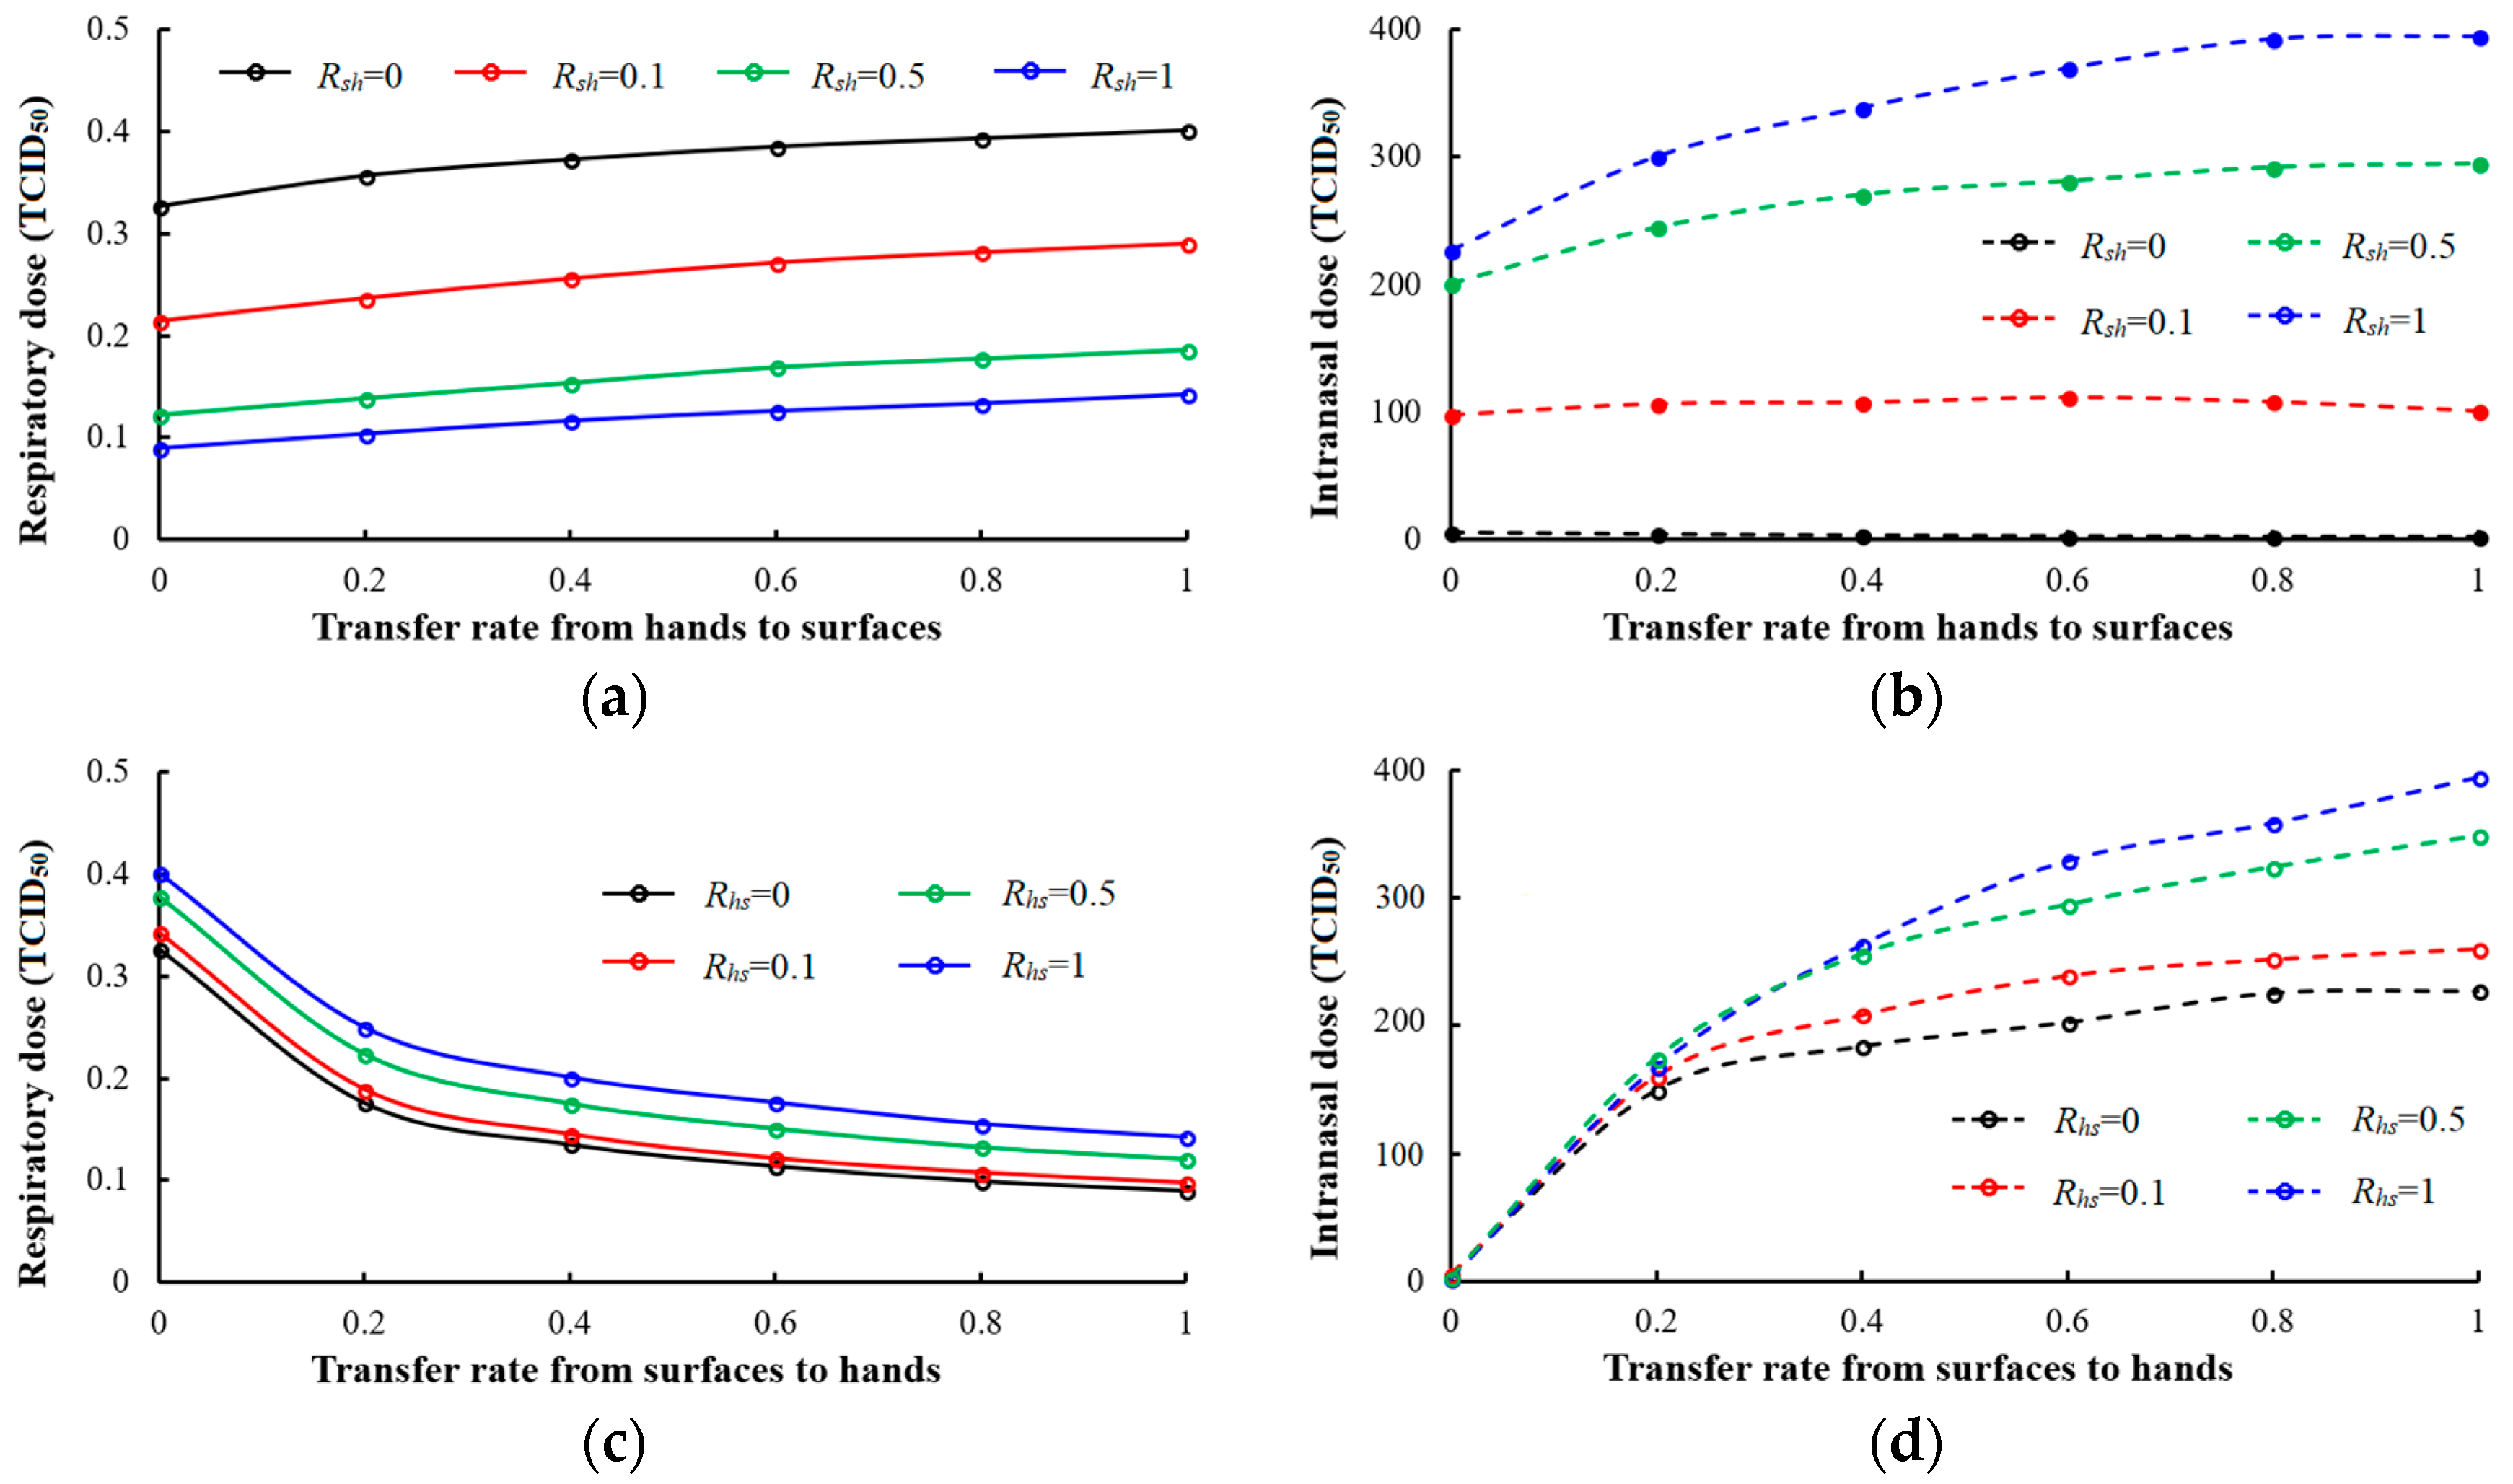
3.2. Infection Spread via the Fomite Route
3.3. Strategies for Influenza A Prevention
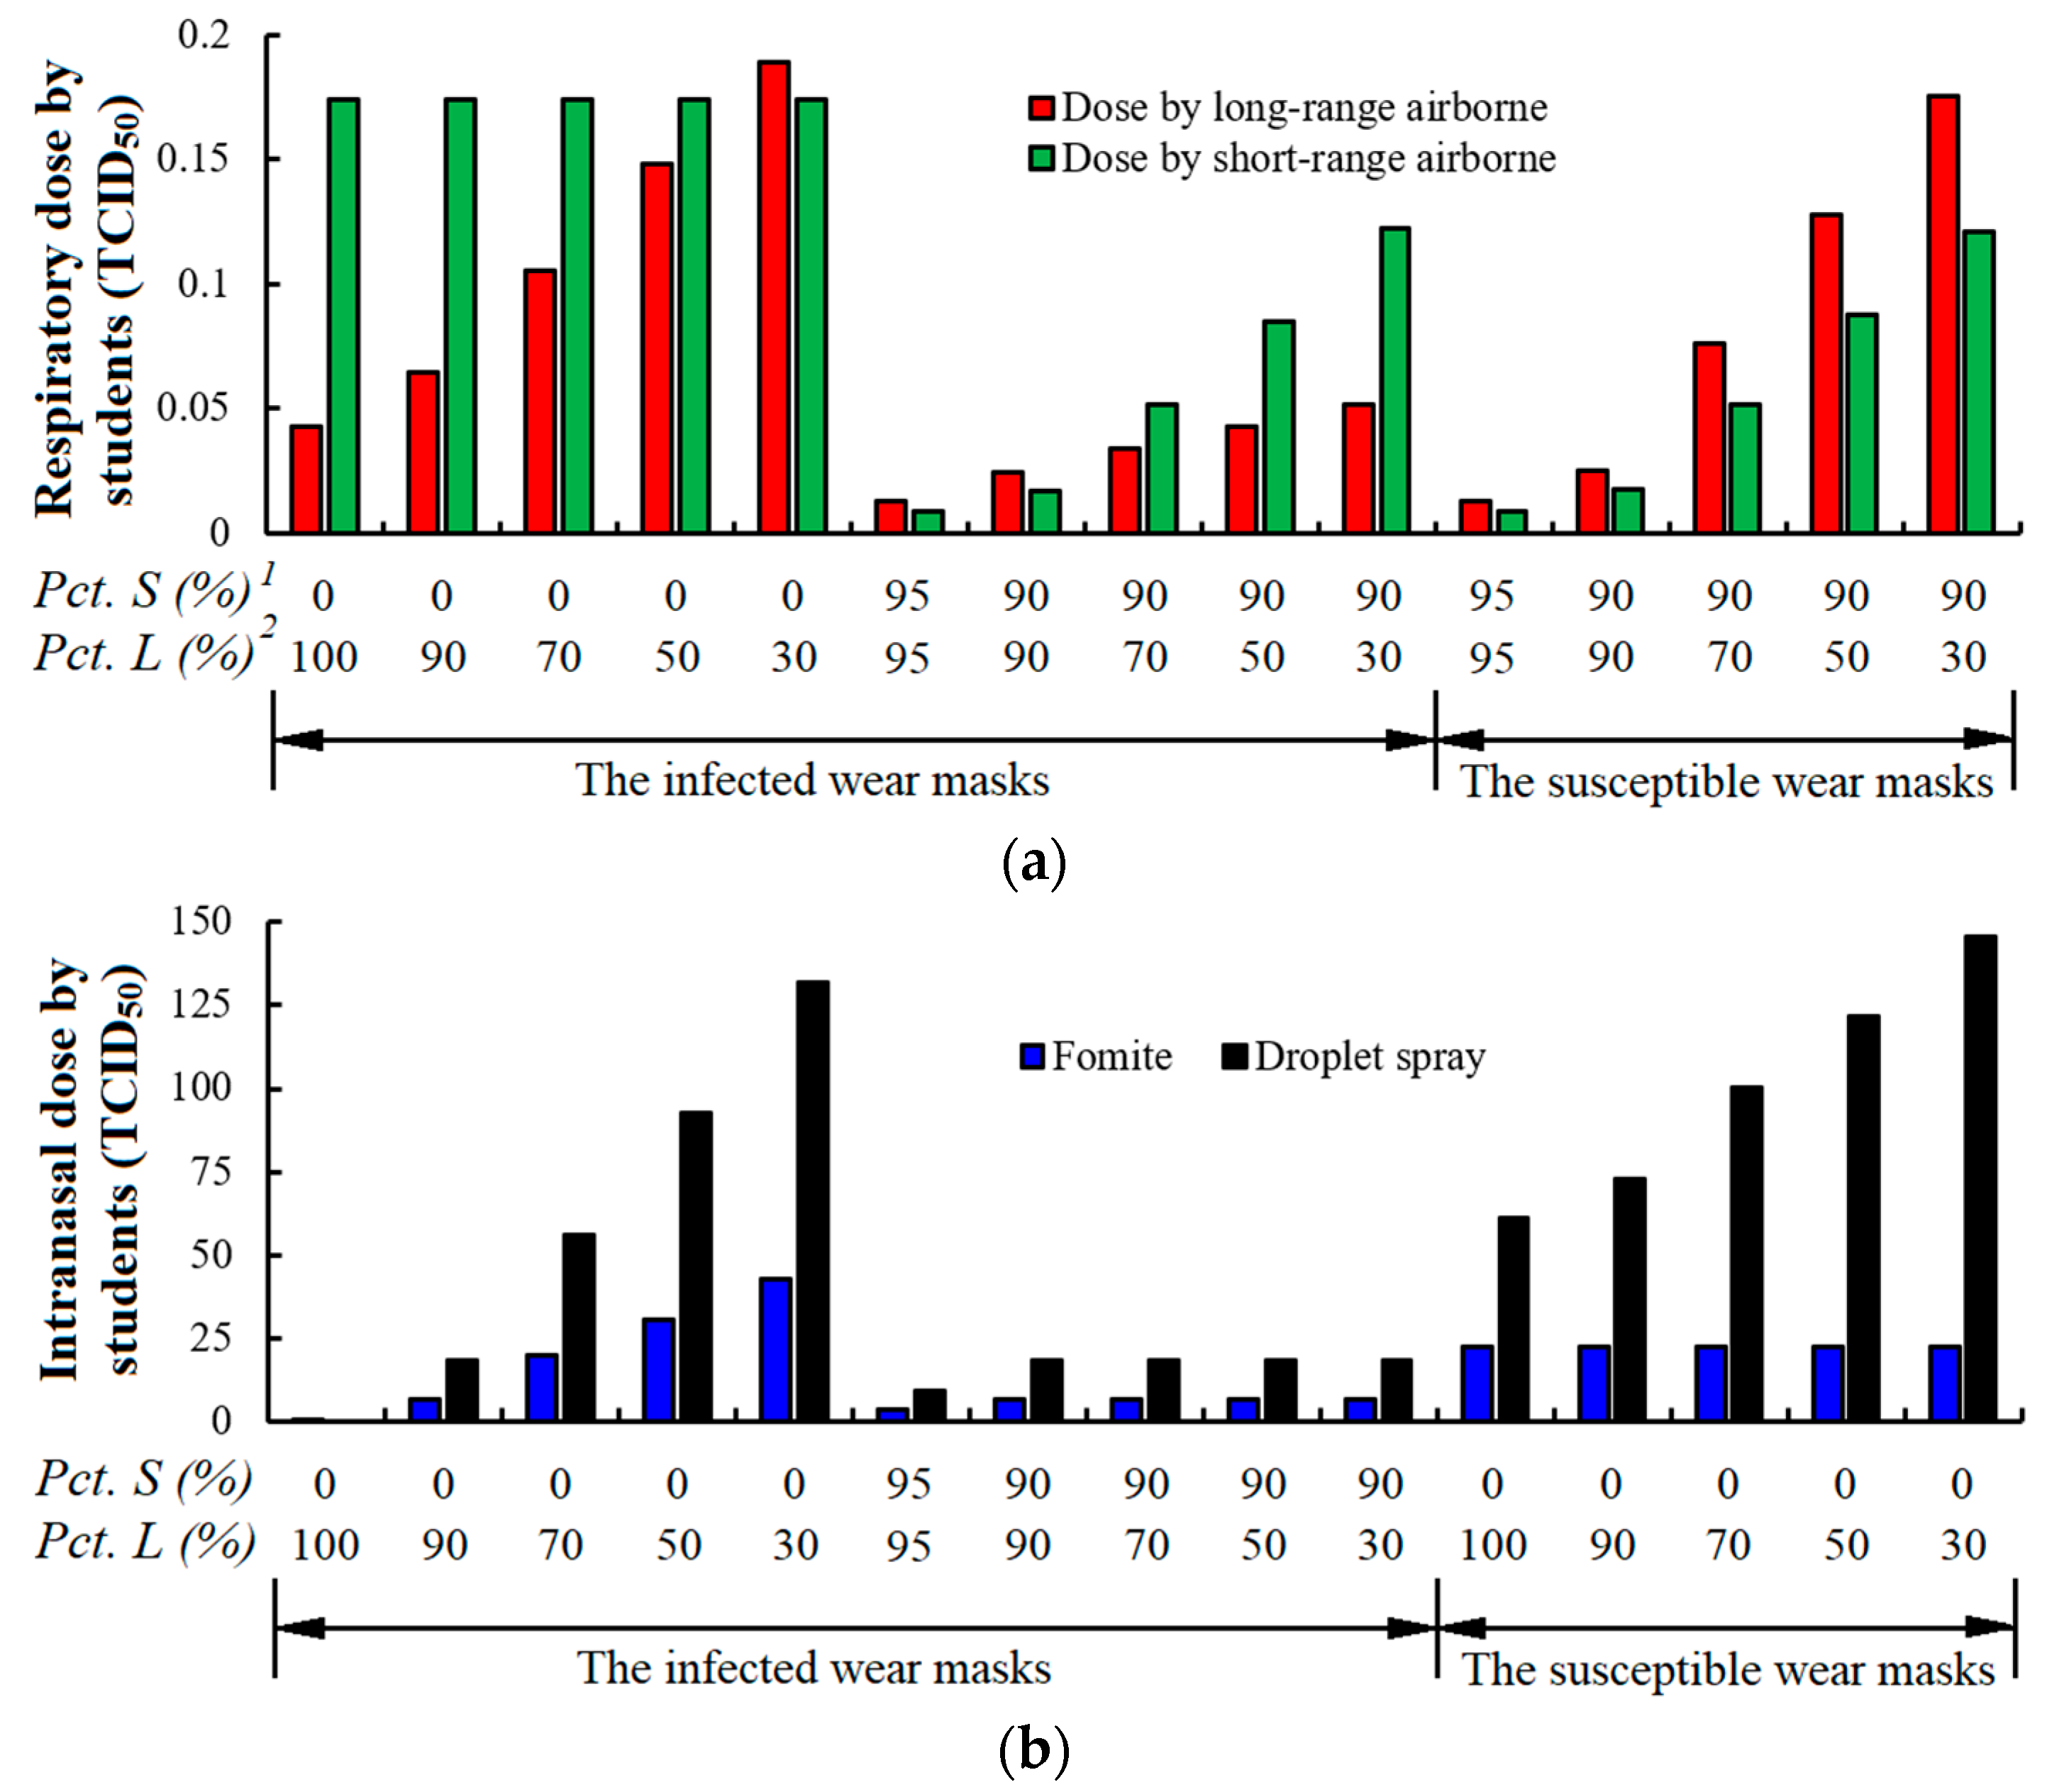
3.3.1. Mask Wearing
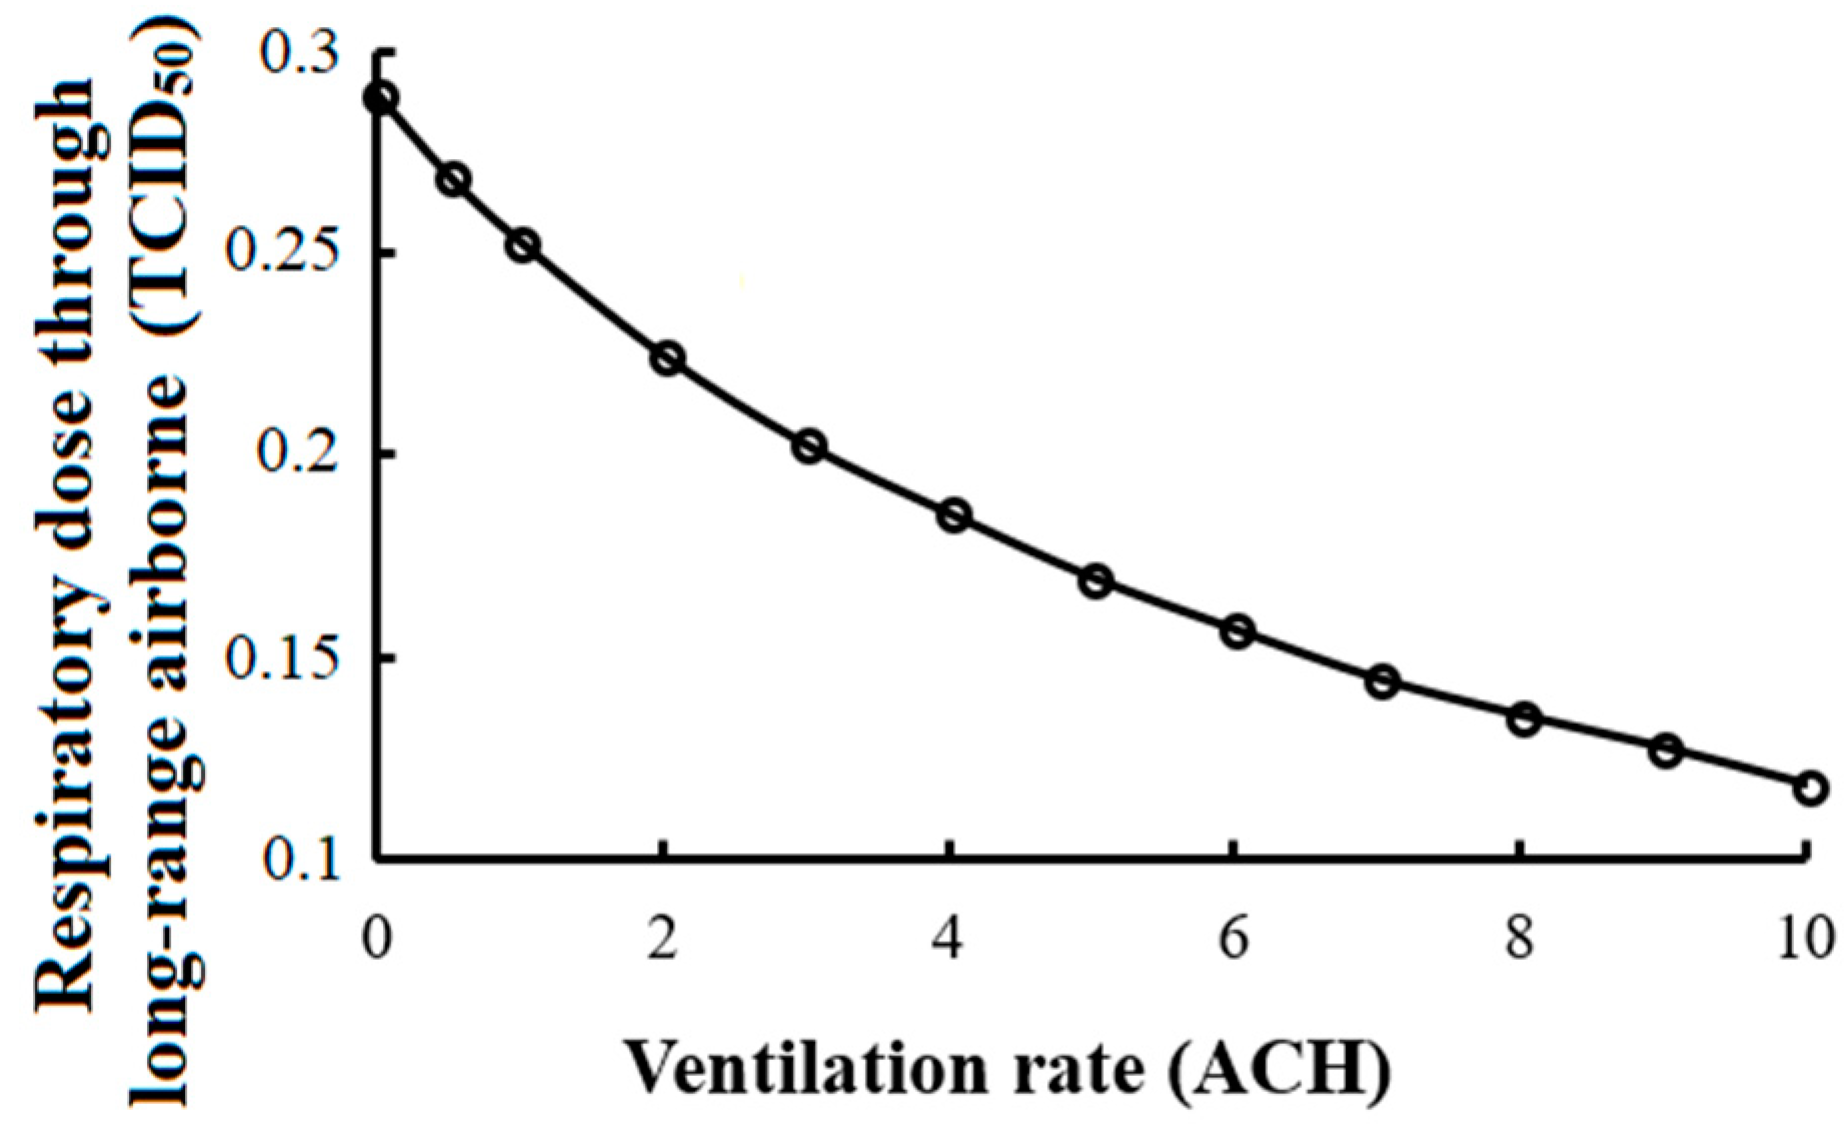
3.3.2. Ventilation
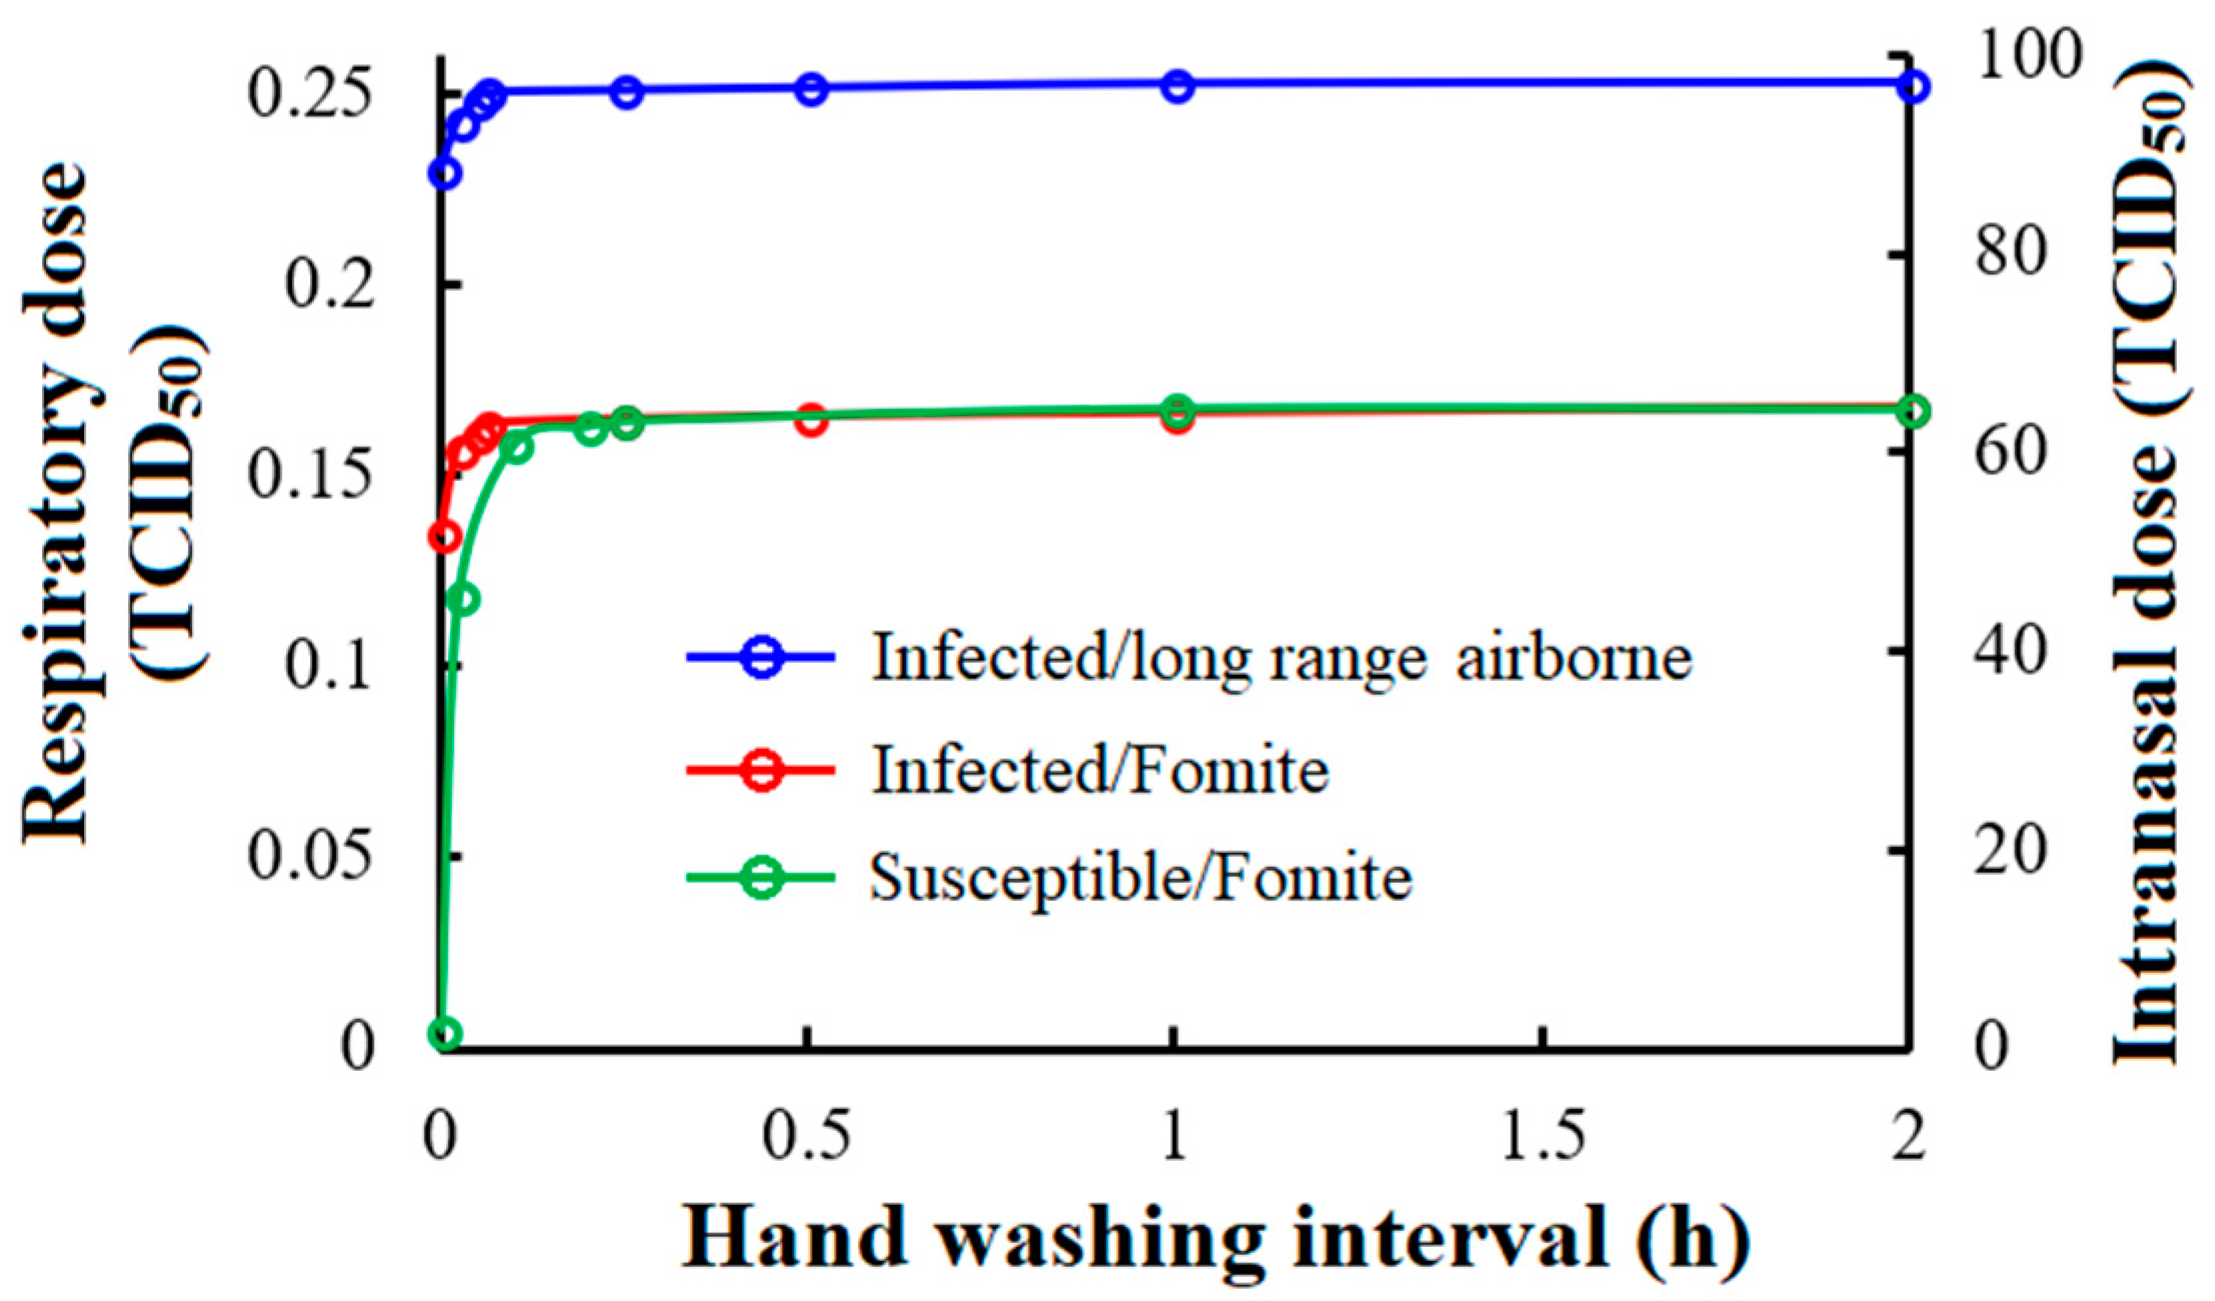
3.3.3. Hand Washing
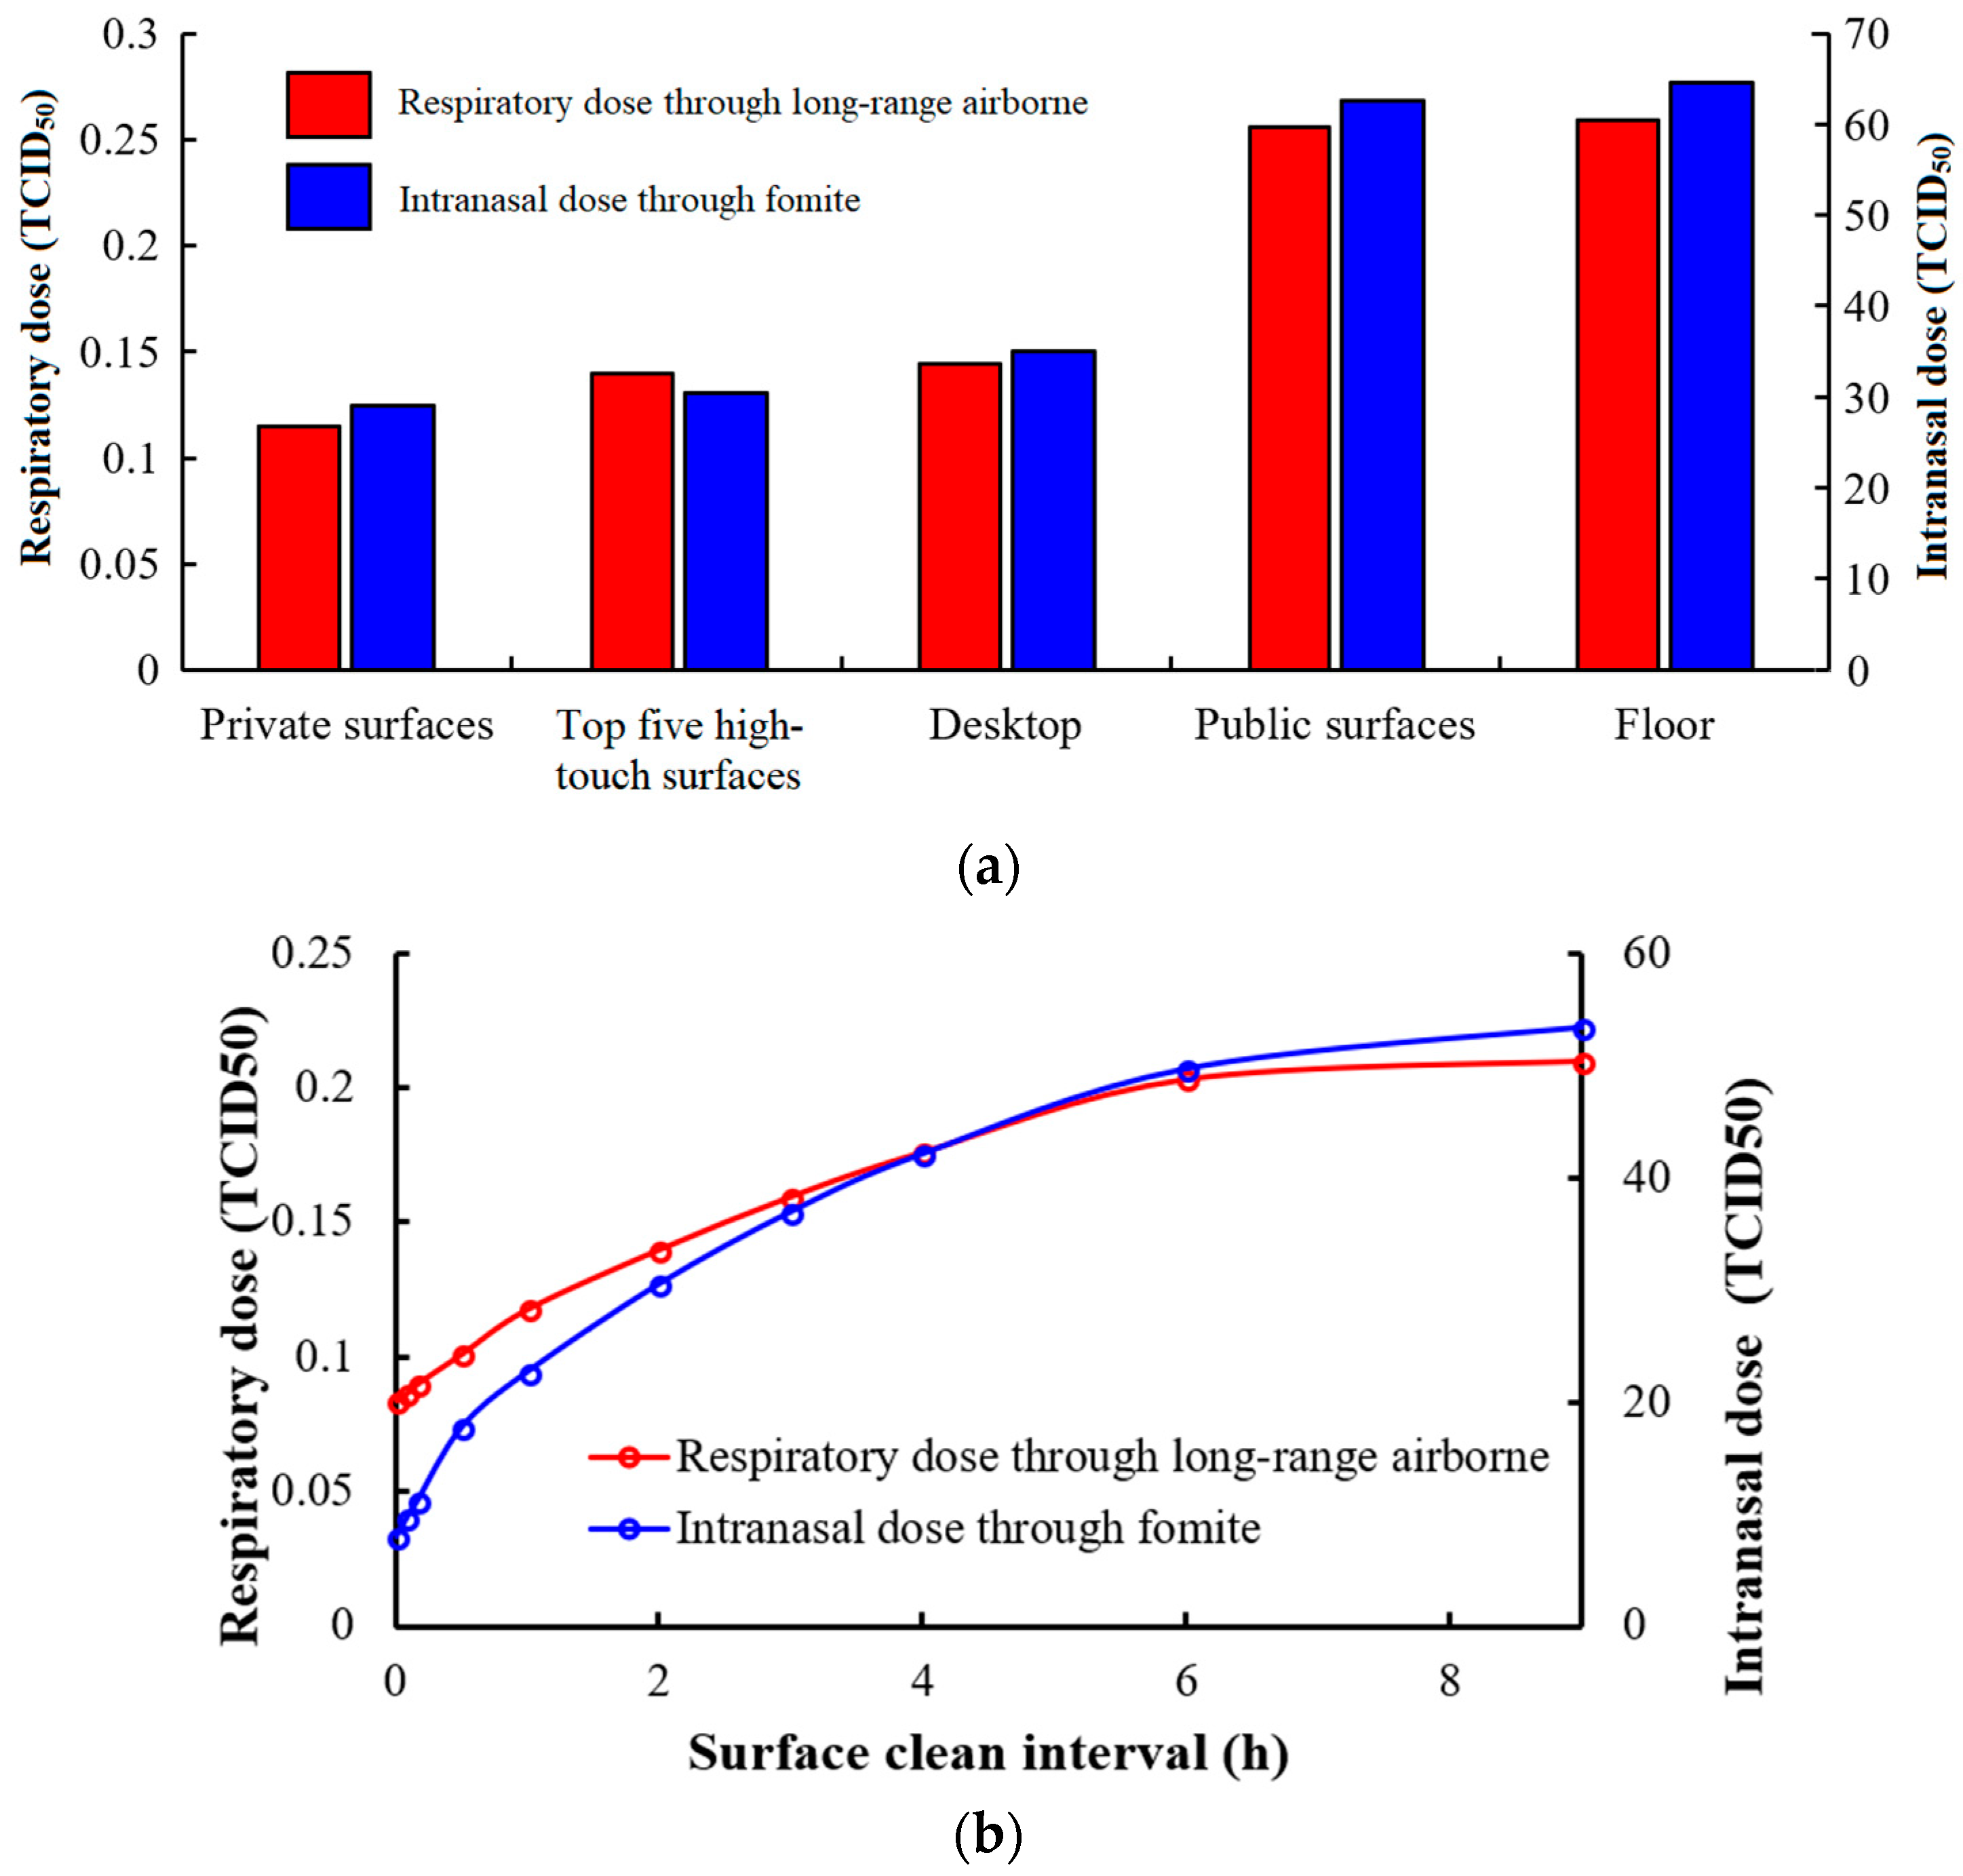
3.3.4. Surface Cleaning
4. Discussion
5. Conclusions
Supplementary Materials
Author Contributions
Funding
Conflicts of Interest
References
- Monto, A.S.; Whitley, R.J. Seasonal and pandemic influenza: A 2007 update on challenges and solutions. Clin. Infect. Dis. 2008, 46, 1024–1031. [Google Scholar] [CrossRef] [PubMed]
- Englund, J.A. Antiviral therapy of influenza. Semin. Pediatr. Infect. Dis. 2002, 13, 120–128. [Google Scholar] [CrossRef] [PubMed]
- Morens, D.M.; Rash, V.M. Lessons from a nursing home outbreak of influenza A. Infect. Control Hosp. Epidemiol. 1995, 16, 275–280. [Google Scholar] [CrossRef] [PubMed]
- Brankston, G.; Gitterman, L.; Hirji, Z.; Lemieux, C.; Gardam, D.M. Transmission of influenza A in human beings. Lancet Infect. Dis. 2007, 7, 257–265. [Google Scholar] [CrossRef]
- Weinstein, R.A.; Bridges, C.B.; Kuehnert, M.J.; Hall, C.B. Transmission of influenza: Implications for control in health care settings. Clin. Infect. Dis. 2003, 37, 1094–1101. [Google Scholar] [CrossRef] [PubMed]
- Tellier, R. Review of aerosol transmission of influenza A virus. Emerg. Infect. Dis. 2006, 12, 1657–1662. [Google Scholar] [CrossRef] [PubMed]
- Lowen, A.C.; Mubareka, S.; Tumpey, T.M.; García-Sastre, A.; Palese, P. The guinea pig as a transmission model for human influenza viruses. Proc. Natl. Acad. Sci. USA 2006, 103, 9988–9992. [Google Scholar] [CrossRef] [PubMed]
- Moser, M.R.; Bender, T.R.; Margolis, H.S.; Noble, G.R.; Kendal, A.P.; Ritter, D.G. An outbreak of influenza aboard a commercial airliner. Am. J. Epidemiol. 1979, 110, 1–6. [Google Scholar] [CrossRef] [PubMed]
- McLean, R.L. General discussion. Am. Rev. Respir. Dis. 1961, 83, 36–38. [Google Scholar]
- Schulman, J.L.; Kilbourne, E.D. Airborne transmission of influenza virus infection in mice. Nature 1962, 195, 1129. [Google Scholar] [CrossRef] [PubMed]
- Hertzberg, V.S.; Weiss, H.; Elon, L.; Si, W.P.; Norris, S.L. the FlyHealthy Research Team. Behaviors, movement, and transmission of droplet-mediated respiratory diseases during transcontinental airline flights. Proc. Natl. Acad. Sci. USA 2018. [Google Scholar] [CrossRef] [PubMed]
- Gilardi, F.; Castelli, G.G.; Vinci, M.R.; Ciofi, D.A.M.; Santilli, V.; Brugaletta, R.; Santoro, A.; Montanaro, R.; Lavorato, L.; Raponi, M.; et al. Seasonal influenza vaccination in health care workers. A pre-post intervention study in an Italian paediatric sospital. Int. J. Environ. Res. Public Health 2018, 15, 841. [Google Scholar] [CrossRef] [PubMed]
- Lei, H.; Li, Y.; Xiao, S.; Lin, C.H.; Norris, S.L.; Wei, D.; Hu, Z.; Ji, S. Routes of transmission of influenza A H1N1, SARS CoV, and norovirus in air cabin: Comparative analyses. Indoor Air 2017, 28, 394–403. [Google Scholar] [CrossRef] [PubMed]
- Chong, K.C.; Goggins, W.; Zee, B.C.Y.; Wang, M.H. Identifying meteorological drivers for the seasonal variations of influenza infections in a subtropical city—Hong Kong. Int. J. Environ. Res. Public Health 2015, 12, 1560–1576. [Google Scholar] [CrossRef] [PubMed]
- Charu, V.; Zeger, S.; Gog, J.; Bjørnstad, O.N.; Kissler, S.; Simonsen, L.; Grenfell, B.T.; Viboud, C. Human mobility and the spatial transmission of influenza in the United States. PLoS Comput. Biol. 2017, 13, e1005382. [Google Scholar] [CrossRef] [PubMed]
- Zhang, N.; Li, Y.G.; Huang, H. Surface touch and its network growth in a graduate student office. Indoor Air, under review.
- Bolashikov, Z.D.; Melikov, A.K. Methods for air cleaning and protection of building occupants from airborne pathogens. Build. Environ. 2009, 44, 1378–1385. [Google Scholar] [CrossRef]
- Nicas, M.; Sun, G. An integrated model of infection risk in a health-care environment. Risk Anal. 2006, 26, 1085–1096. [Google Scholar] [CrossRef] [PubMed]
- Nicas, M.; Nazaroff, W.W.; Hubbard, A. Toward understanding the risk of secondary airborne infection: Emission of respirable pathogens. J. Occup. Environ. Hyg. 2005, 2, 143–154. [Google Scholar] [CrossRef] [PubMed]
- Approaches to Better Understand Human Influenza Transmission (CDC). Available online: https://www.cdc.gov/influenzatransmissionworkshop2010/ (accessed on 1 May 2018).
- Yang, W.; Elankumaran, S.; Marr, L.C. Concentrations and size distributions of airborne influenza A viruses measured indoors at a health centre, a day-care centre and on aeroplanes. J. R. Soc. Interface 2011, 8, 1176. [Google Scholar] [CrossRef] [PubMed]
- Drossinos, Y.; Housiadas, C. Aerosol flows. In Multiphase Flow Handbook; Crowe, C.T., Ed.; CRC Press: Boca Raton, FL, USA, 2006; pp. 6-1–6-58. [Google Scholar]
- Duguid, J.P. The size and the duration of air-carriage of respiratory droplets and droplet-nuclei. Epidemiol. Infect. 1946, 44, 471–479. [Google Scholar] [CrossRef]
- Loudon, R.G.; Roberts, R.M. Relation between the airborne diameters of respiratory droplets and the diameter of the stains left after recovery. Nature 1967, 213, 95–96. [Google Scholar] [CrossRef]
- Hayden, F.G.; Fritz, R.; Lobo, M.C.; Alvord, W.; Strober, W.; Straus, S.E. Local and systemic cytokine responses during experimental human influenza A virus infection. Relation to symptom formation and host defense. J. Clin. Investig. 1998, 101, 643–649. [Google Scholar] [CrossRef] [PubMed]
- Zhu, S.; Kato, S.; Yang, J.H. Study on transport characteristics of saliva droplets produced by coughing in a calm indoor environment. Build. Environ. 2006, 41, 1691–1702. [Google Scholar] [CrossRef]
- Fabian, P.; McDevitt, J.J.; DeHaan, W.H.; Fung, R.O.P.; Cowling, B.J.; Chan, K.H.; Leung, G.M.; Milton, D.K. Influenza virus in human exhaled breath: An observational study. PLoS ONE 2008, 3, e2691. [Google Scholar] [CrossRef] [PubMed]
- Chao, C.Y.H.; Wan, M.P.; Morawska, L.; Johnson, G.R.; Ristovski, Z.D.; Hargreaves, M.; Mengersen, K.; Corbett, S.; Li, Y.; Xie, X.; et al. Characterization of expiration air jets and droplet size distributions immediately at the mouth opening. J. Aerosol Sci. 2009, 40, 122–133. [Google Scholar] [CrossRef]
- Xie, X.; Li, Y.; Sun, H.; Liu, L. Exhaled droplets due to talking and coughing. J. R. Soc. Interface 2009, 6, S703. [Google Scholar] [CrossRef] [PubMed]
- Sinnreich, R.; Kark, J.D.; Friedlander, Y.; Sapoznikov, D.; Luria, M.H. Five minute recordings of heart rate variability for population studies: Repeatability and age–sex characteristics. Heart 1998, 80, 156–162. [Google Scholar] [CrossRef] [PubMed]
- Atkinson, M.P.; Wein, L.M. Quantifying the routes of transmission for pandemic influenza. Bull. Math. Biol. 2008, 70, 820–867. [Google Scholar] [CrossRef] [PubMed]
- Chen, S.C.; Liao, C.M. Probabilistic indoor transmission modeling for influenza (sub) type viruses. J. Infect. 2010, 60, 26–35. [Google Scholar] [CrossRef] [PubMed]
- Knight, V.; Fedson, D.; Baldini, J.; Douglas, R.G.; Couch, R.B. Amantadine therapy of epidemic influenza A2 (Hong Kong). Infect. Immun. 1970, 1, 200–204. [Google Scholar] [PubMed]
- Couch, R.B.; Gerone, P.J.; Cate, T.R.; Griffith, W.R.; Alling, D.W.; Knight, V. Preparation and properties of a small-particle aerosol of coxsackie A21. Proc. Soc. Exp. Biol. Med. 1965, 118, 818–822. [Google Scholar] [CrossRef] [PubMed]
- Douglas, R. Influenza in man. In fluenza Virus and Influenza: Kilbourne; Academic Press, Inc.: New York, NY, USA, 1975; pp. 395–445. [Google Scholar]
- Nicas, M.; Jones, R.M. Relative contributions of four exposure pathways to influenza infection risk. Risk Anal. 2009, 29, 1292–1303. [Google Scholar] [CrossRef] [PubMed]
- Zhang, N.; Huang, H.; Su, B.; Ma, X.; Li, Y. A human behavior integrated hierarchical model of airborne disease transmission in a large city. Build. Environ. 2018, 127, 211–220. [Google Scholar] [CrossRef]
- Chen, S.C.; Chang, C.F.; Liao, C.M. Predictive models of control strategies involved in containing indoor airborne infections. Indoor Air 2006, 16, 469–481. [Google Scholar] [CrossRef] [PubMed]
- Weber, T.P.; Stilianakis, N.I. Inactivation of influenza A viruses in the environment and modes of transmission: A critical review. J. Infect. 2008, 57, 361–373. [Google Scholar] [CrossRef] [PubMed]
- Harper, G.J. Airborne micro-organisms: Survival tests with four viruses. Epidemiol. Infect. 1961, 59, 479–486. [Google Scholar] [CrossRef]
- Blachere, F.M.; Lindsley, W.G.; Pearce, T.A.; Anderson, S.E.; Fisher, M.; Khakoo, R.; Meade, B.J.; Lander, O.; Davis, S.; Thewlis, R.E.; et al. Measurement of airborne influenza virus in a hospital emergency department. Clin. Infect. Dis. 2009, 48, 438. [Google Scholar] [CrossRef] [PubMed]
- Yang, J. Numerical and Experimental Study on Physiological Responses in Hot Environments Based on Human-Clothing-Environment System. Ph.D. Thesis, Tsinghua University, Beijing, China, 2015. (in Chinese). [Google Scholar]
- Wester, R.C.; Maibach, H.I. Regional variation in percutaneous absorption. Drugs Pharm. Sci. 1999, 97, 107–116. [Google Scholar]
- Sattar, S.A.; Jacobsen, H.; Springthorpe, V.S.; Cusack, T.M.; Rubino, R. Chemical disinfection to interrupt transfer of rhinovirus type 14 from environmental surfaces to hands. Appl. Environ. Microbiol. 1993, 59, 1579–1585. [Google Scholar] [PubMed]
- Mackintosh, C.A.; Hoffman, P.N. An extended model for transfer of micro-organisms via the hands: Differences between organisms and the effect of alcohol disinfection. Epidemiol. Infect. 1984, 92, 345–355. [Google Scholar] [CrossRef]
- Mokhtari, A.; Jaykus, L.A. Quantitative exposure model for the transmission of norovirus in retail food preparation. Int. J. Food Microbiol. 2009, 133, 38–47. [Google Scholar] [CrossRef] [PubMed]
- Lopez, G.U.; Gerba, C.P.; Tamimi, A.H.; Kitajima, M.; Maxwell, S.L.; Rose, J.B. Transfer efficiency of bacteria and viruses from porous and nonporous fomites to fingers under different relative humidity conditions. Appl. Environ. Microbiol. 2013, 79, 5728–5734. [Google Scholar] [CrossRef] [PubMed]
- Bean, B.; Moore, B.M.; Sterner, B.; Peterson, L.R.; Gerding, D.N.; Balfour, H.H. Survival of influenza viruses on environmental surfaces. J. Infect. Dis. 1982, 146, 47–51. [Google Scholar] [CrossRef] [PubMed]
- Ansari, S.A.; Sattar, S.A.; Springthorpe, V.S.; Wells, G.A.; Tostowaryk, W. Rotavirus survival on human hands and transfer of infectious virus to animate and nonporous inanimate surfaces. J. Clin. Microbiol. 1988, 26, 1513–1518. [Google Scholar] [PubMed]
- Pancic, F.; Carpentier, D.C.; Came, P.E. Role of infectious secretions in the transmission of rhinovirus. J. Clin. Microbiol. 1980, 12, 567–571. [Google Scholar] [PubMed]
- Hendley, J.O.; Wenzel, R.P.; Gwaltney, J.M., Jr. Transmission of rhinovirus colds by self-inoculation. N. Eng. J. Med. 1973, 288, 1361–1364. [Google Scholar] [CrossRef] [PubMed]
- Rusin, P.; Maxwell, S.; Gerba, C. Comparative surface-to-hand and fingertip-to-mouth transfer efficiency of gram-positive bacteria, gram-negative bacteria, and phage. J. Appl. Microbiol. 2002, 93, 585–592. [Google Scholar] [CrossRef] [PubMed]
- Prussin, A.J.; Marr, L.C. Sources of airborne microorganisms in the built environment. Microbiome 2015, 3, 78. [Google Scholar] [CrossRef] [PubMed]
- Alshitawi, M.S.; Awbi, H.B. Measurement and prediction of the effect of students’ activities on airborne particulate concentration in a classroom. HVAC&R Res. 2011, 17, 446–464. [Google Scholar]
- Ocak, Y.; Kılıçvuran, A.; Eren, A.B.; Sofuoglu, A.; Sofuoglu, S.C. Exposure to particulate matter in a mosque. Atmos. Environ. 2012, 56, 169–176. [Google Scholar] [CrossRef]
- Qian, J.; Ferro, A.R. Resuspension of dust particles in a chamber and associated environmental factors. Aerosol Sci. Technol. 2008, 42, 566–578. [Google Scholar] [CrossRef]
- Fierer, N.; Lauber, C.L.; Zhou, N.; McDonald, D.; Costello, E.K.; Knight, R. Forensic identification using skin bacterial communities. Proc. Natl. Acad. Sci. USA 2010, 107, 6477–6481. [Google Scholar] [CrossRef] [PubMed]
- Meadow, J.F.; Altrichter, A.E.; Green, J.L. Mobile phones carry the personal microbiome of their owners. PeerJ 2014, 2, e447. [Google Scholar] [CrossRef] [PubMed]
- Noti, J.D.; Lindsley, W.G.; Blachere, F.M.; Cao, G.; Kashon, M.L.; Thewlis, R.E.; McMillen, C.M.; King, W.P.; Szalajda, J.V.; Beezhold, D.H. Detection of infectious influenza virus in cough aerosols generated in a simulated patient examination room. Clin. Infect. Dis. 2012, 54, 1569. [Google Scholar] [CrossRef] [PubMed]
- Kramer, A.; Schwebke, I.; Kampf, G. How long do nosocomial pathogens persist on inanimate surfaces? A systematic review. BMC Infect. Dis. 2006, 6, 130. [Google Scholar] [CrossRef] [PubMed]
- Rabie, T.; Curtis, V. Handwashing and risk of respiratory infections: A quantitative systematic review. Trop. Med. Int. Health 2006, 11, 258–267. [Google Scholar] [CrossRef] [PubMed]
- Jafari, N.; Shahsanai, A.; Memarzadeh, M.; Loghmani, A. Prevention of communicable diseases after disaster: A review. J. Res. Med. Sci. 2011, 16, 956–962. [Google Scholar] [PubMed]
- Kouadio, I.K.; Aljunid, S.; Kamigaki, T.; Hammad, K.; Oshitani, H. Infectious diseases following natural disasters: Prevention and control measures. Expert Rev. Anti-Infect. Ther. 2012, 10, 95–104. [Google Scholar] [CrossRef] [PubMed]


| Transmission Route | Definition |
|---|---|
| Aerosol transmission | Virus is transmitted through the air by aerosols within the inspirable size range or smaller; aerosol particles are small enough to be inhaled into the nasopharynx and distally into the trachea and lung. |
| Direct transmission | Virus is transferred by contact from an infected person to another person without a contaminated intermediate object (fomite). |
| Indirect transmission | Virus is transferred by contact with a contaminated intermediate object (fomite). |
| Droplet spray transmission | Virus is transmitted through the air by droplet sprays (such as those produced by coughing or sneezing); a key feature is deposition of droplets by impaction on exposed mucous membranes. |
| Parameter | Symbol | Value | Source |
|---|---|---|---|
| Deposition rate | RD | 0.1 min−1 | Assumed |
| Volume of small particles by breathing | [23,24,25,26,27,28,29] | ||
| Volume of small particles by talking | [23,24,25,26,27,28,29] | ||
| Volume of small particles by coughing | [23,24,25,26,27,28,29] | ||
| Volume of small particles by sneezing | [23,24,25,26,27,28,29] | ||
| Volume of large droplets by breathing | [23,24,25,26,27,28,29] | ||
| Volume of large droplets by talking | [23,24,25,26,27,28,29] | ||
| Volume of large droplets by coughing | [23,24,25,26,27,28,29] | ||
| Volume of large droplets by sneezing | [23,24,25,26,27,28,29] | ||
| Frequency of breath | Fb | 15 min−1 | [30] |
| Frequency of coughing (infected person) | Fc | 22 h−1 | [31] |
| Frequency of sneezing (infected person) | Fs | 5 h−1 | [32] |
| Duration per cough | Dc | 1 s | Assumed |
| Duration per sneeze | Ds | 3 s | Assumed |
| Percentage of time on talking with others | Pt | 10% | Monitored |
| Viral shedding rate | Rs | [19,24,25,31,33] | |
| Virus concentration in exhaled particles | Cv | Calculated based on [19,23,24,25,26,27,28,29,31,33,34] | |
| Ventilation rate in the office | VAC | 1 ACH | [37] |
| Respiratory rate of a person | RR | 0.38 m3/h | [38] |
| Inactivation rate of influenza A 1 | 13.9 day−1 | [40] | |
| Dose-response parameter | [36] |
| Sub-Surf 1 | Surf Type 2 | F 3 (h−1) | Area 4 (cm2) | Hori-Coef 5 | Sub-Surf 1 | Surf Type 2 | F 3 (h−1) | Area 4 (cm2) | Hori-Coef |
|---|---|---|---|---|---|---|---|---|---|
| StdH1 | S | 6.32 | 469 | 0.5 | StdH2 | S | 19.41 | 470 | 0 |
| StdH3 | S | 1.01 | 470 | 0 | StdS1 | P | 0.28 | 504 | 0.5 |
| StdS2 | P | 0.34 | 504 | 0.5 | StdA1 | P | 1.17 | 1293 | 0.5 |
| StdA2 | P | 1.35 | 1293 | 0.5 | StdD1 | S | 3.76 | 183 | 0 |
| StdD2 | S | 3.80 | 183 | 0 | StdB1 | P | 2.86 | 2401 | 0 |
| StdB2 | P | 0.99 | 940 | 0 | StdL1 | P | 12.64 | 6592 | 0 |
| BlnB1 | P | 3.05 | 2600 | 0.5 | BlnC1 | N | 2.88 | 500 | 0 |
| BlnE1 | N | 1.94 | 10 | 0.5 | BlnG1 | N | 2.71 | 10 | 0.5 |
| BlnM1 | N | 15.12 | 200 | 0.5 | BlnO1 | P | 0.65 | 7500 | 0 |
| BlnP1 | P | 0.39 | 2400 | 0.5 | CptM1 | N | 23.61 | 120 | 0.5 |
| CptK1 | N | 28.98 | 700 | 1 | DskT1 | N | 20.19 | 6000 | 1 |
| DskD1 | St | 1.04 | 90 | 0.25 | DskF1 | N | 0.08 | 300 | 1 |
| DskF2 | N | 0.14 | 180 | 1 | DskF3 | N | 0.18 | 180 | 1 |
| DskF4 | N | 0.06 | 400 | 0 | DskF5 | N | 0.06 | 400 | 0 |
| ChrA1 | N | 3.17 | 200 | 1 | ChrA2 | N | 3.00 | 200 | 1 |
| ChrC1 | P | 0.73 | 1200 | 1 | ChrB1 | P | 1.56 | 100 | 1 |
| ChrB2 | P | 0.09 | 1200 | 0 | ChrB3 | P | 0.23 | 1200 | 0 |
| ChrB4 | P | 0.09 | 80 | 0 | ChrB5 | P | 0.05 | 80 | 0 |
| PbfC1 | N | 0.03 | 5 | 0 | PbfC2 | N | 0.01 | 60 | 0 |
| PbfP1 | N | <0.01 | 200 | 1 | PbfP2 | N | 0.28 | 35 | 0 |
| PbfP3 | N | 0.08 | 100 | 0 | PbfP4 | N | 0.51 | 3200 | 0 |
| PbfP5 | N | 0.09 | 660 | 0 | PbfD1 | St | 0.05 | 100 | 0.25 |
| PbfD2 | N | 0.04 | 300 | 0 | PbfD3 | N | 0.01 | 5000 | 0 |
| PbfO1 | St | <0.01 | 100 | 0.25 | PbfO2 | St | 0.01 | 1600 | 0 |
| PbfO3 | N | <0.01 | 6000 | 0 | PbfW1 | N | 0.01 | 12000 | 0 |
| PbfW2 | N | 0.05 | 2750 | 0.2 | PbfW3 | N | 0.31 | 12 | 1 |
| PbfT1 | N | 0.18 | 200 | 0 | PbfR1 | N | 0.04 | 400 | 0 |
| PbfB1 | N | 0.14 | 10 | 0.5 | PbfK1 | N | 0.08 | 4400 | 1 |
| PbfH1 | N | 0.03 | 4260 | 0.4 |
| Donor | Recipient | Transfer Rate | Donor | Recipient | Transfer Rate |
|---|---|---|---|---|---|
| Porous | Hand | 3% [44] | Hand | Porous | 80% [45] |
| Non-porous | Hand | 7% [46] | Hand | Non-porous | 12% [47] |
| Stainless steel | Hand | 7.9% [48] | Hand | Stainless steel | 16.1% [49] |
| Hand | Hand | 25.5% [50] |
© 2018 by the authors. Licensee MDPI, Basel, Switzerland. This article is an open access article distributed under the terms and conditions of the Creative Commons Attribution (CC BY) license (http://creativecommons.org/licenses/by/4.0/).
Share and Cite
Zhang, N.; Li, Y. Transmission of Influenza A in a Student Office Based on Realistic Person-to-Person Contact and Surface Touch Behaviour. Int. J. Environ. Res. Public Health 2018, 15, 1699. https://doi.org/10.3390/ijerph15081699
Zhang N, Li Y. Transmission of Influenza A in a Student Office Based on Realistic Person-to-Person Contact and Surface Touch Behaviour. International Journal of Environmental Research and Public Health. 2018; 15(8):1699. https://doi.org/10.3390/ijerph15081699
Chicago/Turabian StyleZhang, Nan, and Yuguo Li. 2018. "Transmission of Influenza A in a Student Office Based on Realistic Person-to-Person Contact and Surface Touch Behaviour" International Journal of Environmental Research and Public Health 15, no. 8: 1699. https://doi.org/10.3390/ijerph15081699
APA StyleZhang, N., & Li, Y. (2018). Transmission of Influenza A in a Student Office Based on Realistic Person-to-Person Contact and Surface Touch Behaviour. International Journal of Environmental Research and Public Health, 15(8), 1699. https://doi.org/10.3390/ijerph15081699