Article

Geographical Clustering and Environmental Determinants of Schistosomiasis from 2007 to 2012 in Jianghan Plain, China

1
Key Laboratory of Monitoring and Estimate for Environment and Disaster of Hubei Province, Institute of Geodesy and Geophysics, Chinese Academy of Sciences, Wuhan 430077, China
2
College of Earth and Planetary Sciences, University of Chinese Academy of Sciences, Beijing 100049, China
3
Hubei Provincial Center for Disease Control and Prevention, Wuhan 430079, China
*
Author to whom correspondence should be addressed.
Int. J. Environ. Res. Public Health 2018, 15(7), 1481; https://doi.org/10.3390/ijerph15071481
Submission received: 14 June 2018 / Revised: 6 July 2018 / Accepted: 8 July 2018 / Published: 13 July 2018

Abstract

:
This study compared changes in the spatial clustering of schistosomiasis in Jianghan Plain, China by applying Kulldorff’s spatial scan statistic. The Geodetector software was employed to detect the environmental determinants of schistosomiasis annually from 2007 to 2012. The most likely spatial cluster in 2007 covered the north-central part of Jianghan Plain, whereas those observed from 2008 to 2012 were toward the south, with extended coverage in generally the same areas across various periods, and some variation nevertheless in precise locations. Furthermore, the 2007 period was more likely to be clustered than any other period. We found that temperature, land use, and soil type were the most critical factors associated with infection rates in humans. In addition, land use and soil type had the greatest impact on the prevalence of schistosomiasis in 2009, whereas this effect was minimal in 2007. The effect of temperature on schistosomiasis prevalence reached its maximum in 2010, whereas in 2008, this effect was minimal. Differences observed in the effects of those two factors on the spatial distribution of human schistosomiasis were inconsistent, showing statistical significance in some years and a lack thereof in others. Moreover, when two factors operated simultaneously, a trend of enhanced interaction was consistently observed. High-risk areas with strong interactions of affected factors should be targeted for disease control interventions.

1. Introduction

Schistosomiasis, an acute and chronic disease caused by parasitic flatworms referred to as schistosomes, is endemic in about 75 developing countries. It mainly affects people who live in rural agricultural and suburban areas, with significant economic and public health consequences [1,2]. The number of people suffering from schistosomiasis worldwide is approximately 252 million, and it is estimated that 4400–200,000 people die from the disease each year [3]. Within recent years, schistosomiasis has been successfully controlled in many countries. Since China’s national government has actively promoted the elimination of schistosomiasis, control efforts have made considerable progress in recent decades, followed by a considerable reduction in the infection rates. Surveillance and analysis data of schistosomiasis in China for 2015 showed that the total infection rate of the resident population maintained a steady decline. However, owing to the complex objective factors of prevalence and transmission as well as the existence of risk factors associated with repeated and rising epidemics, it is necessary to reinforce the importance of prevention and monitoring strategies regarding schistosomiasis [4,5,6].
The survival, reproduction, and spread of schistosomes within a region are closely related to the conditions that facilitate the survival and reproduction of schistosomiasis pathogens and parasitic hosts [7]. First, the activities of miracidia and cercariae in the life history of schistosomes are directly related to water temperature, wind speed, and sediment content. Second, the growth and reproduction of schistosomes have an important relationship with the intermediate host snails. The spatial distribution of Oncomelania snails is related to various environmental factors, such as surface vegetation, beach groundwater level, beach soil moisture content, soil moisture content, surface relief, climatic conditions, altitude elevation, microenvironmental physicochemical factors, hydraulic factors like water flow speed (which will block floating debris to which snails attach and effectively prevent snails from spreading), physical and chemical conditions of soil, and several other environmental factors [8,9,10,11,12].
The epidemiology of schistosomiasis infection in China shows unique spatial characteristics. Based on the geographical patterns of endemic areas and the complex ecological features of the sole intermediate host snails of schistosomes, the epidemic areas of schistosomiasis in China can be divided into three types: lake and marshland regions, plain regions with networks, and hilly and mountainous regions [13,14]. The lakes and marshes of Hubei Province, a predominantly epidemic region, comprise the main area of interest in the middle and lower reaches of the Yangtze River in southern China. Previous studies have described a relatively severe epidemic in Jianghan Plain, located in the central and southern parts of Hubei Province [4].
Few studies have evaluated changes in the spatial distribution of human schistosomiasis and the impact of and variations in factors that promote the transmission of schistosomiasis in Jianghan Plain. In the present study, we employed spatial and space–time scan statistics to analyze the clusters and number of people infected with schistosomiasis. Furthermore, the Geodetector software was used to assess the environmental risks to human schistosomiasis rates in Jianghan Plain from 2007 to 2012.

2. Materials and Methods
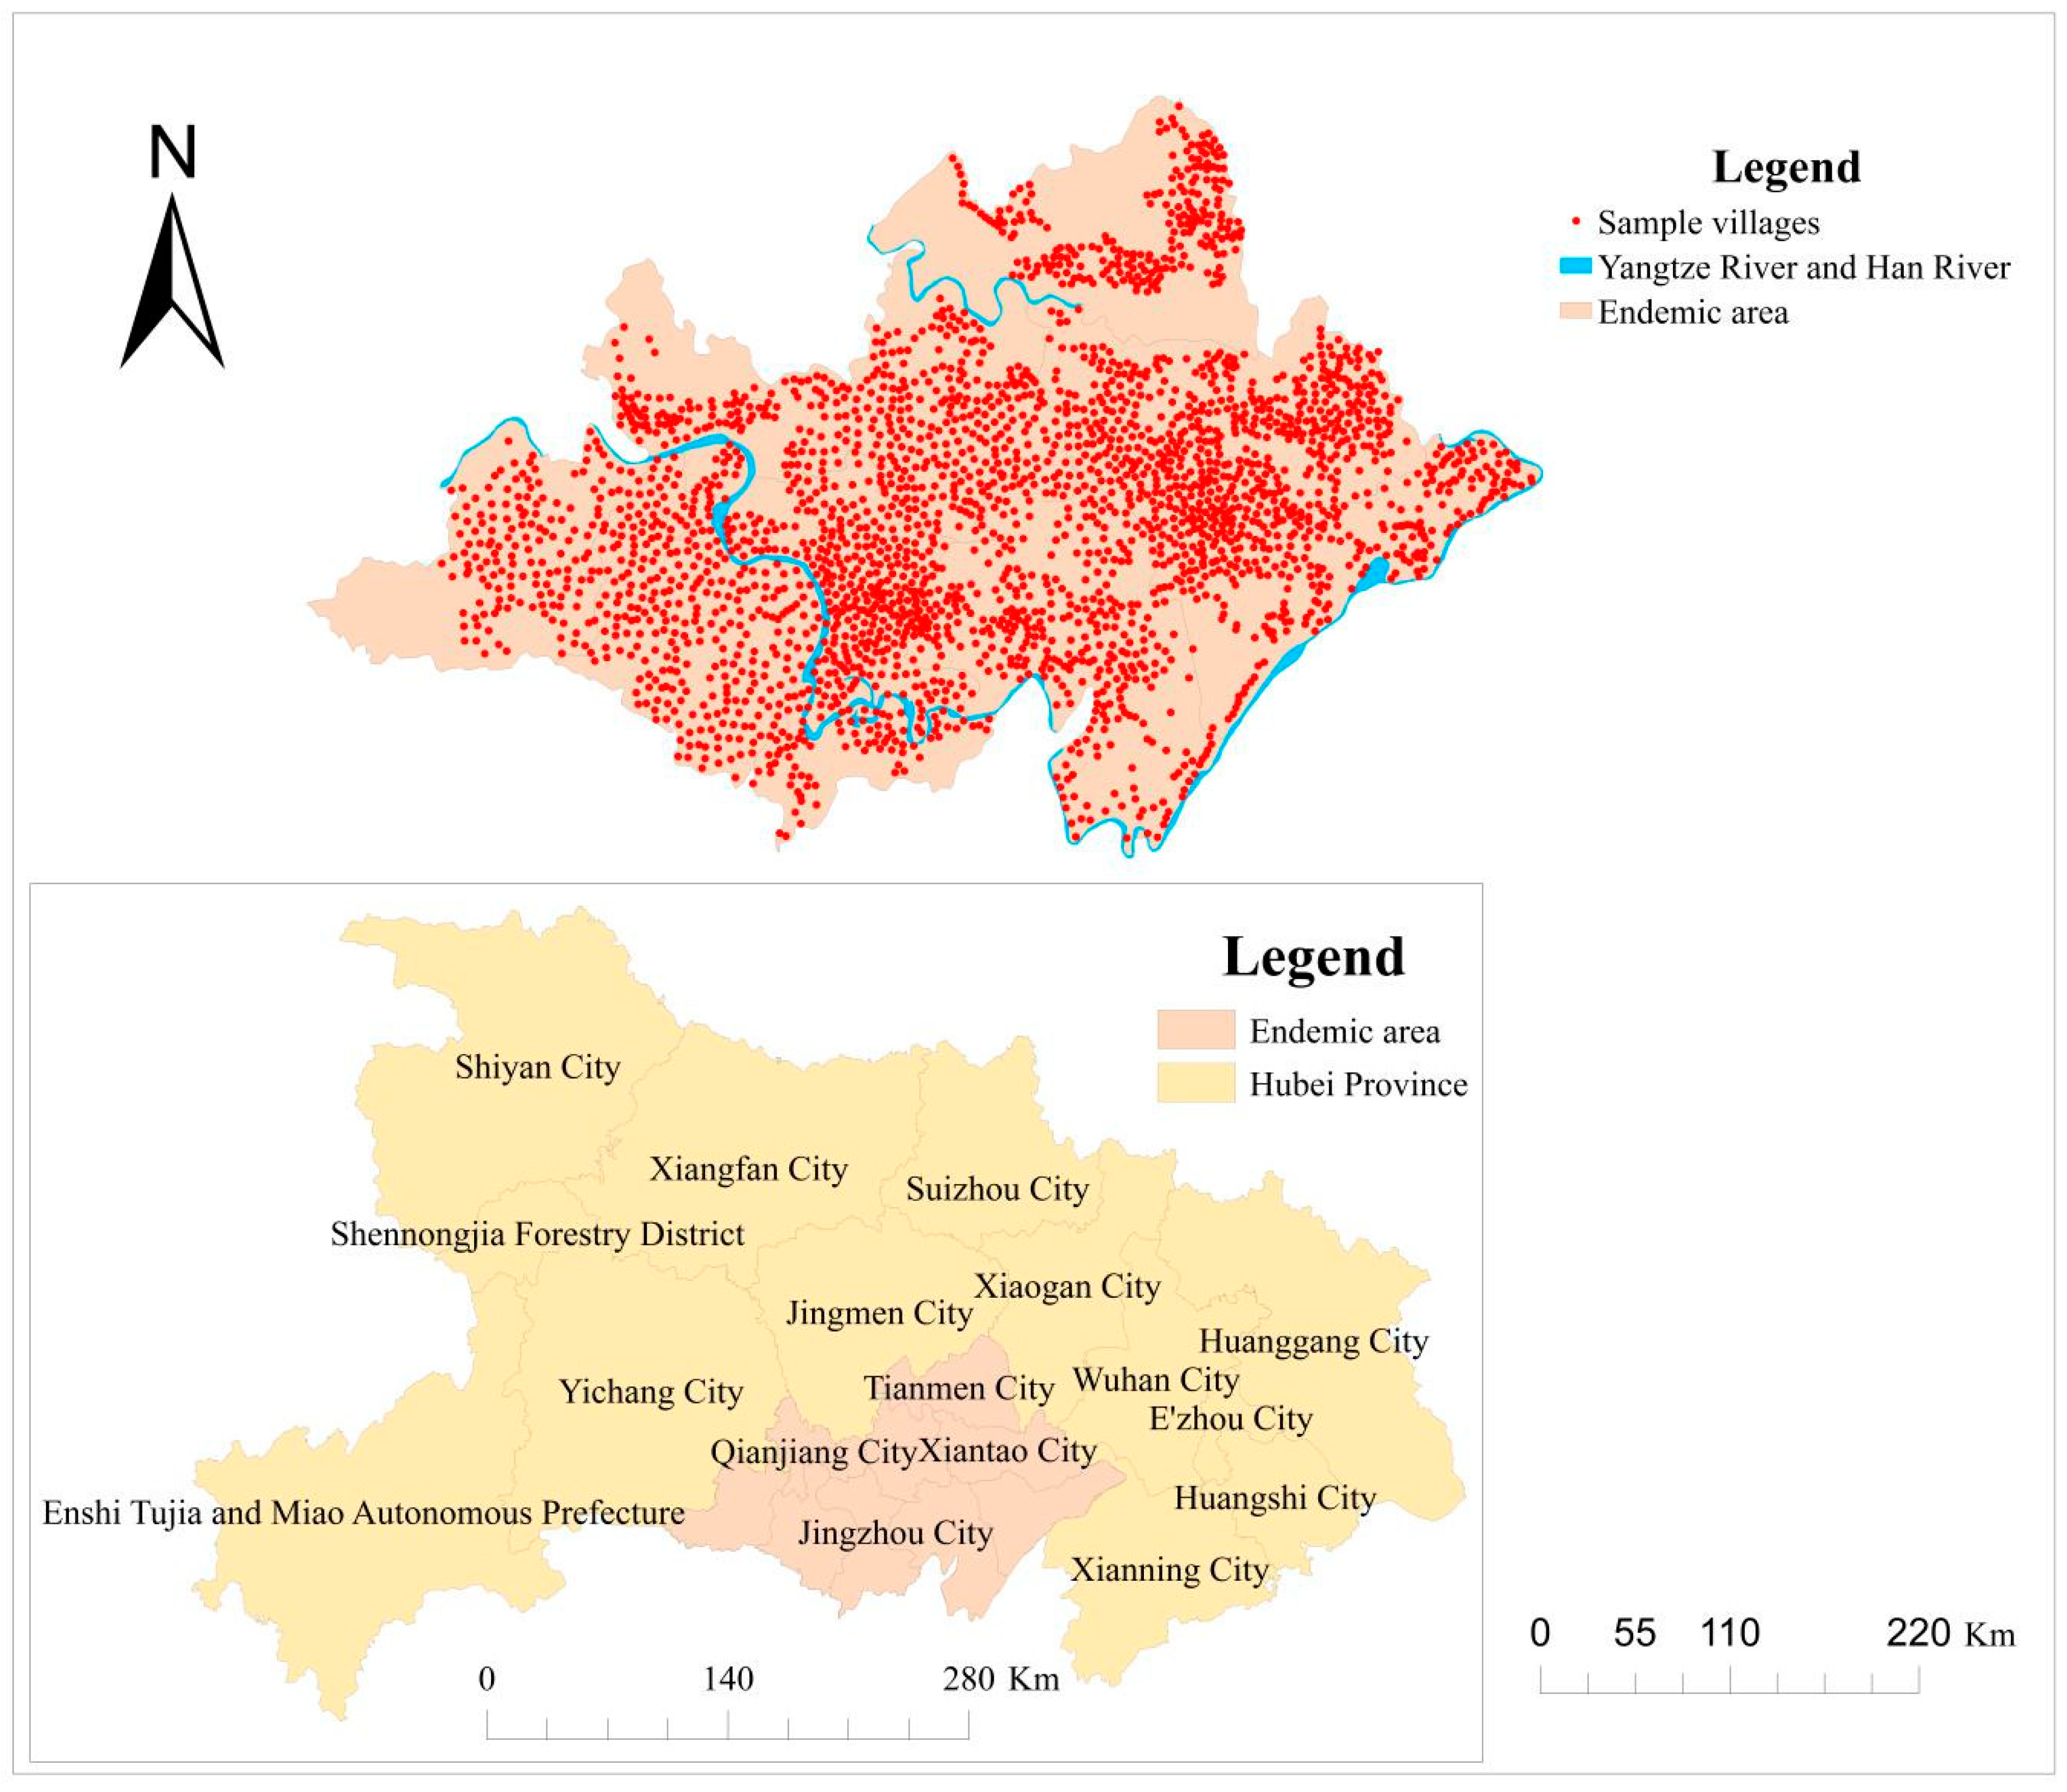
2.1. Study Area

Jianghan Plain, which is located at latitude 29°26′–31°10′ N, longitude 111°45′–114°16′ E, spans roughly 30,000 km2 in the middle and southern parts of Hubei Province. It forms the main part of the middle and lower reaches of the Yangtze River, covering eight counties and municipalities, including Jingzhou District, Shashi District, Jiangling County, Gong’an County, Jianli County, Shishou City, Honghu City, Songzi City, and three provincial directly managed cities: Xiantao City, Qianjiang City, and Tianmen City. Jianghan Plain is situated in the middle subtropical region of China, where the climate is warm and humid. The rain and heat occur during the same period, and a dense river network is present, comprising numerous lakes and vast areas of water. Thus, this area satisfies the breeding and propagation conditions of the unique intermediate snail hosts of schistosomes. Based on the aforementioned factors, the epidemic of schistosomiasis is rather critical within the study area.

2.2. Parasitological Data

Data on schistosomiasis prevalence, including the names, number of infected people, population of endemic villages, and human infection rates from 2007 to 2012, were obtained from the Institute of Schistosomiasis Control, Hubei Provincial Center for Disease Control and Prevention. We collected village-level vector geographic data and completed 10 vector maps for each county (city) by registering, splicing, and encoding each village. The “Join” function in the ArcGIS software was then used to correlate village-level human disease data with the village-level vector geographic map [15,16]. In addition, the central coordinates of each administrative village were calculated to generate the points of the schistosomiasis epidemic villages in Jianghan Plain (Figure 1).

2.3. Environmental Data

Environmental data regarding land use, soil type, soil texture (sand percentage, silt percentage, and clay percentage), and water data in Jianghan Plain was provided by the Data Center for Resources and Environmental Sciences, Chinese Academy of Sciences (RESDC) (http://www.resdc.cn). It should be noted that since the RESDC does not have year-by-year land use data, the land use data of 2010 was used instead. Although it is considered somewhat rough, it can still explain some associated challenges.
In addition, all 8-day global 1-km products for land surface temperature at daytime (LSTD) and at night (LSTN), as well as the monthly global products for the normalized difference vegetation index (NDVI) covering Jianghan Plain for each year, were downloaded from the Level-1 and Atmosphere Archive and Distribution System (https://ladsweb.modaps.eosdis.nasa.gov/sear). We used the natural break method to divide numerical data, such as temperature, NDVI, and soil texture, into five, five, and four categories, respectively. Each category was then encoded for convenience. The MODIS Reprojection Tool (MRT, https://lpdaac.usgs.gov/tools/modis_reprojection_tool) was then used to project, mosaic, and specify a geographic subset. Land use, soil type, soil texture, average LSTD, average LSTN, average TDN (average day and night temperatures), average NDVI, and DER (distances from the endemic villages to the river) of each endemic village were extracted using the ArcGIS software.

2.4. Statistical Analysis

2.4.1. Cluster Analysis

We adopted spatial and space–time scan statistics of the number of infected individuals in each village from 2007 to 2012 to analyze the temporal and spatial clustering of schistosomiasis.
Spatial cluster analysis: Annual spatial cluster analysis applying the discrete Poisson model was performed with the Martin Software for spatial, temporal, and space–time scan statistics (SaTScan software, version v9.6, https://www.satscan.org/). The maximum spatial cluster size was set to 50% of the population at risk, and a circular window shape was used to detect clusters. The minimum number of cases in clusters with high rates was limited to at least 10. In addition, the replication number was set at 999 (default = 999).
Space–time cluster analysis: Space–time analysis was applied to scan for clusters with high risk using the Space–Time Permutation model and the SaTScan software. The maximum spatial cluster size was set to 50% of the population at risk and the window shape was circular. The minimum and maximum temporal cluster sizes were set to 1 year and 50% of the study period, respectively. The minimum number of cases in clusters with high rates was set to 2. In addition, the number of replications was defined as 999.

2.4.2. Detection of Geographical Environment Factors on Schistosomiasis

Geodetector software (http://www.geodetector.org/), developed by Dr. Xu and Prof. Wang, was used to analyze the environmental factors of schistosomiasis. This method is based on spatial variation analysis of the geographical strata of variables used to assess the environmental risks to human health. It consists of four parts: the risk detector indicates where the risk areas are located; the factor detector identifies which factors are responsible for the risk; the ecological detector reveals the relative importance of the factors; and the interaction detector reveals whether the risk factors interact with each other or independently lead to disease [17,18]. Wang and Hu [17] offer a detailed explanation of the principle behind the geographical detector. We used the following three detectors to reveal the characteristics and influencing mechanisms of schistosomiasis in Jianghan Plain from 2007 to 2012.
Factor detection: This detector was used to determine whether a geographical factor stratum was responsible for an observed spatial pattern of schistosomiasis. The main idea was to compare the accumulated dispersion variance of each subregion with the dispersion variance of the entire study region. The smaller the ratio, the stronger the disease contribution of the stratum, which can be measured, as follows [19]:
q = 1 N D 1 V a r D 1 + N D 2 V a r D 2 + N D 3 V a r D 3 N × V a r D
where N and NDi denote the number of units in schistosomiasis layer G and strata Di in the factor layer D, respectively; VarDi denotes the variance in infection rates of human schistosomiasis in each strata; VarD denotes the variance in infection rates of human schistosomiasis over the entire study area A.
If factor D completely controls schistosomiasis, it would be equal to 1; however, if it is completely unrelated to schistosomiasis, it would be equal to 0. Therefore, values would lie within the range [0, 1]. The larger the value, the greater the impact of factor D on schistosomiasis prevalence. This value, therefore, can be used to quantify the association between schistosomiasis prevalence and the risk factors studied.
Interaction detection: Interaction detection was developed to identify whether two health determinants, when considered together, weaken or enhance each other or are independent in the development of the disease. The main idea of this process is to compare the sum of the disease contributions of two individual attributes vs. the contribution of the two attributes when considered together.
Ecological detection: Comparison of the variance calculated from divisions of each subregion based on a particular determinant, with that based on another determinant, was the general idea of this detector. Based on this theory, we compared whether one risk factor is more significant than another in controlling the spatial patterns of schistosomiasis.

3. Results

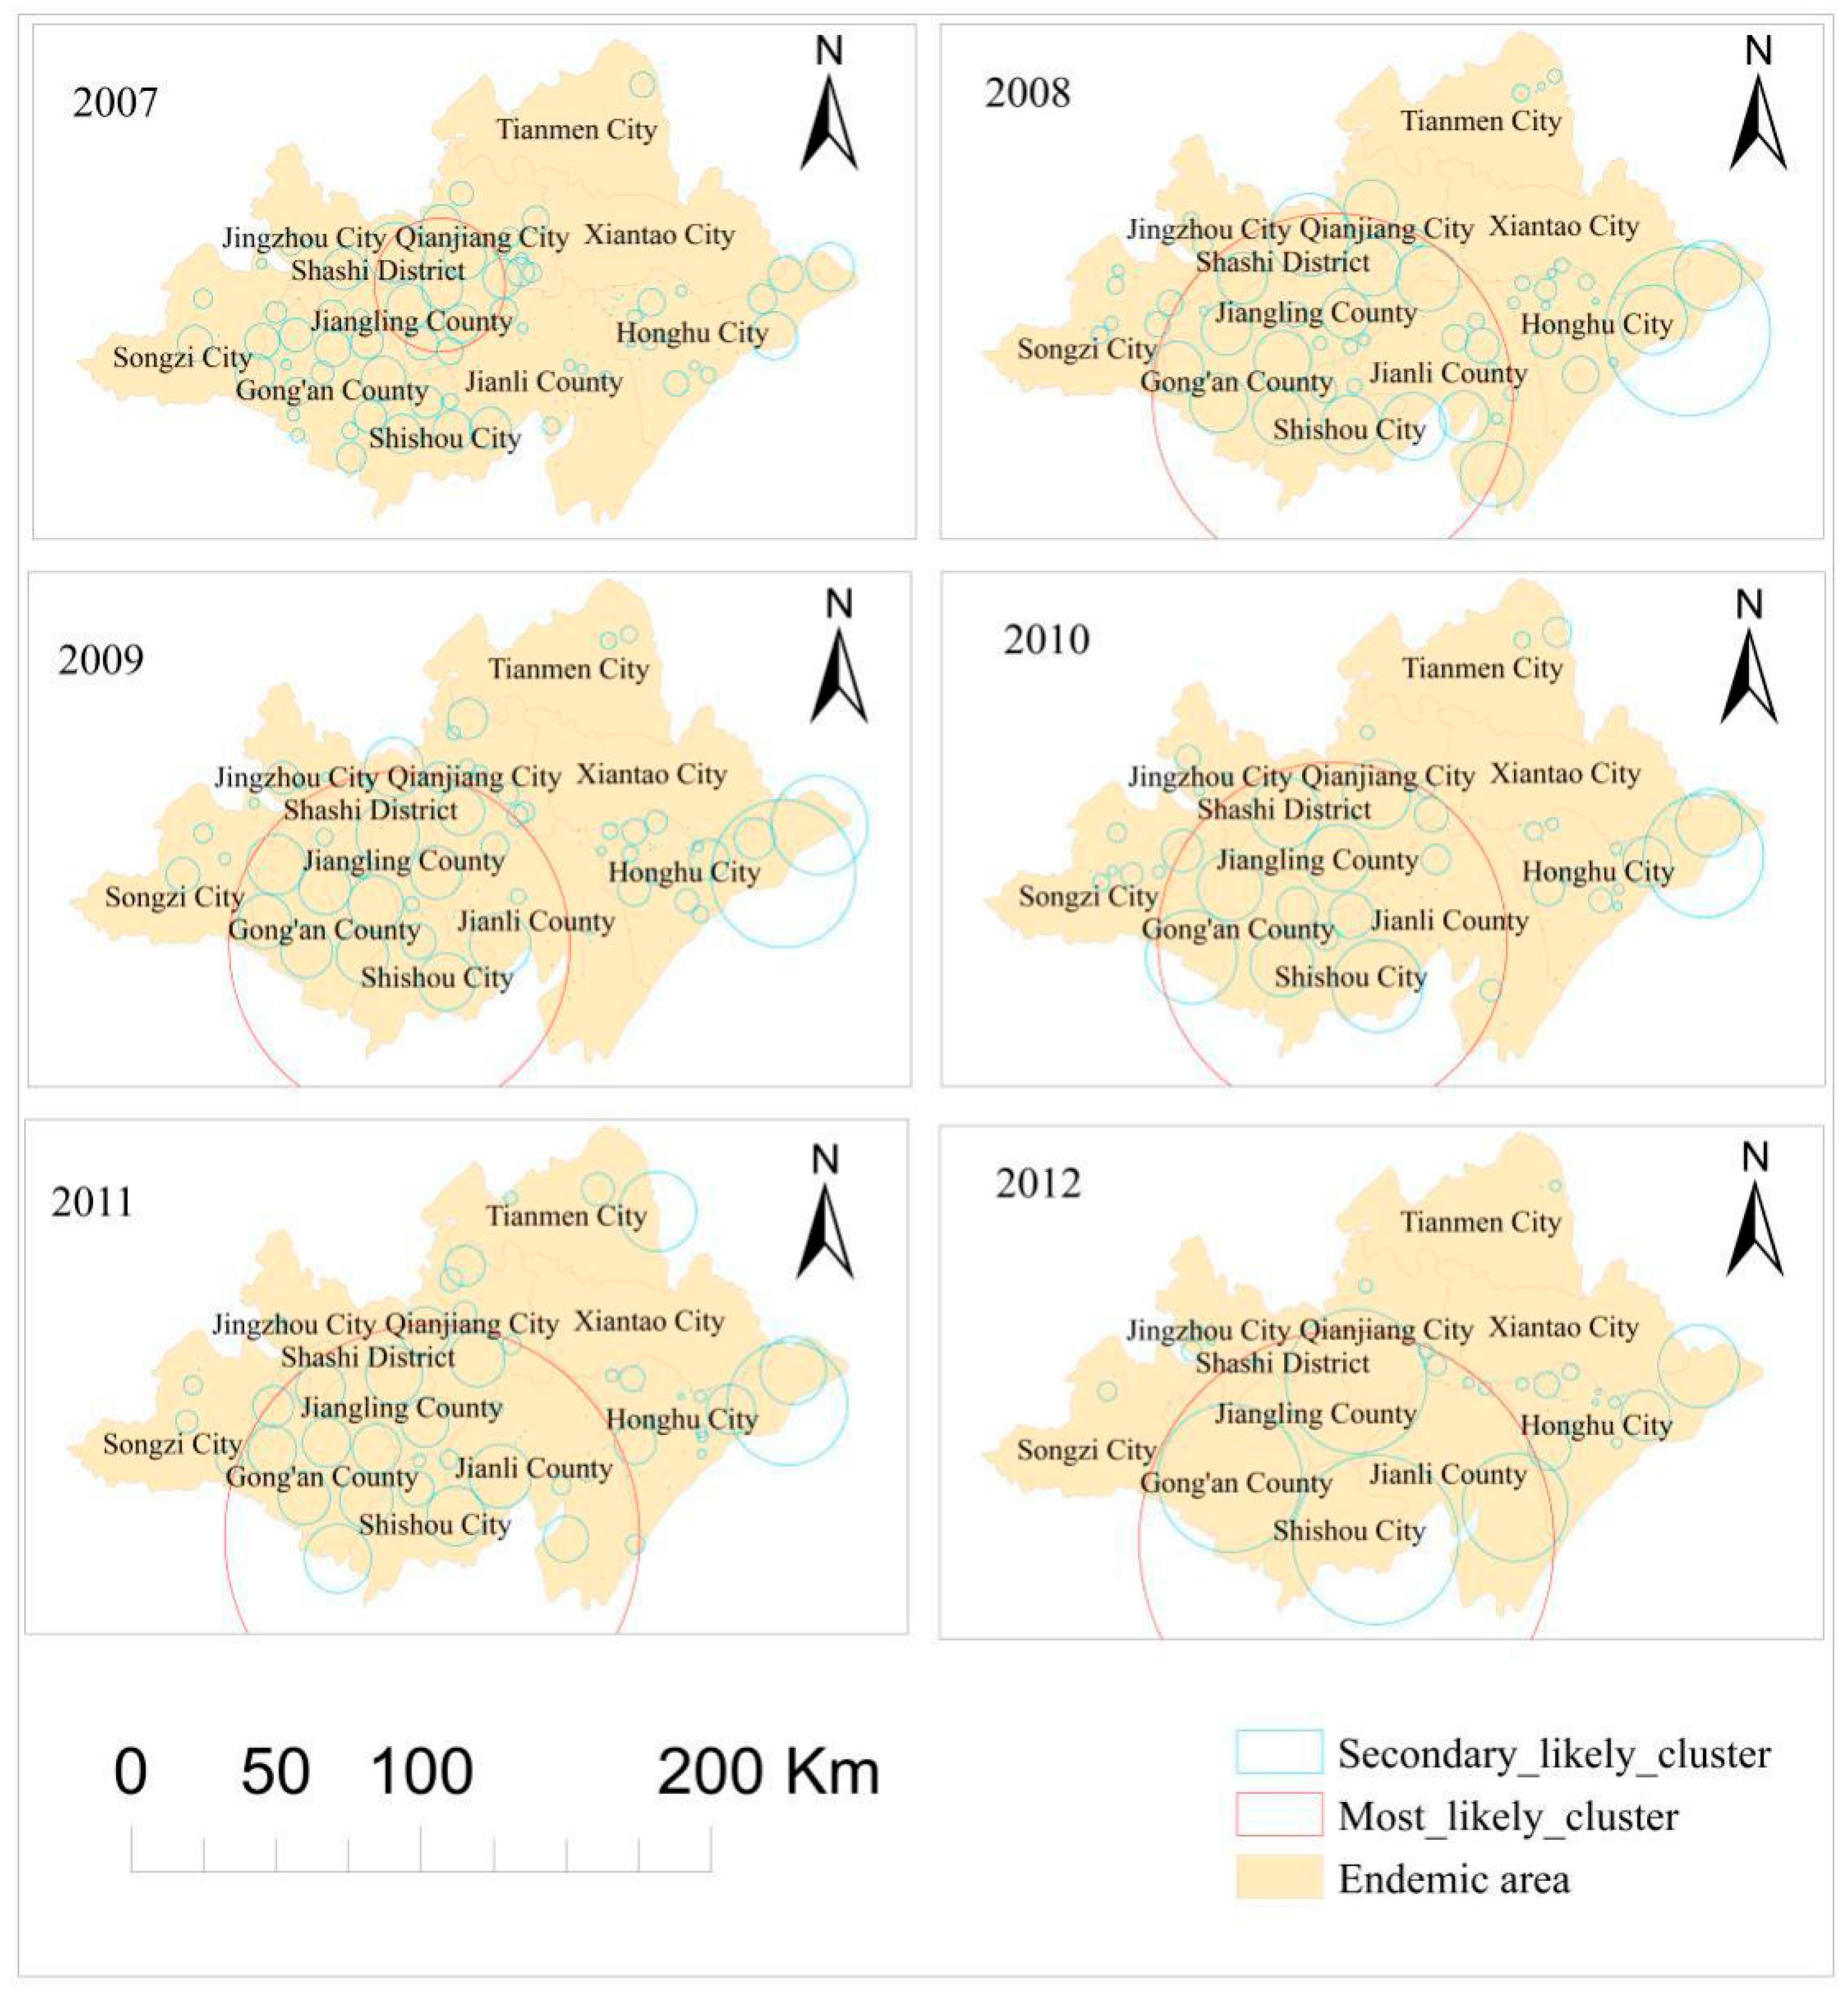
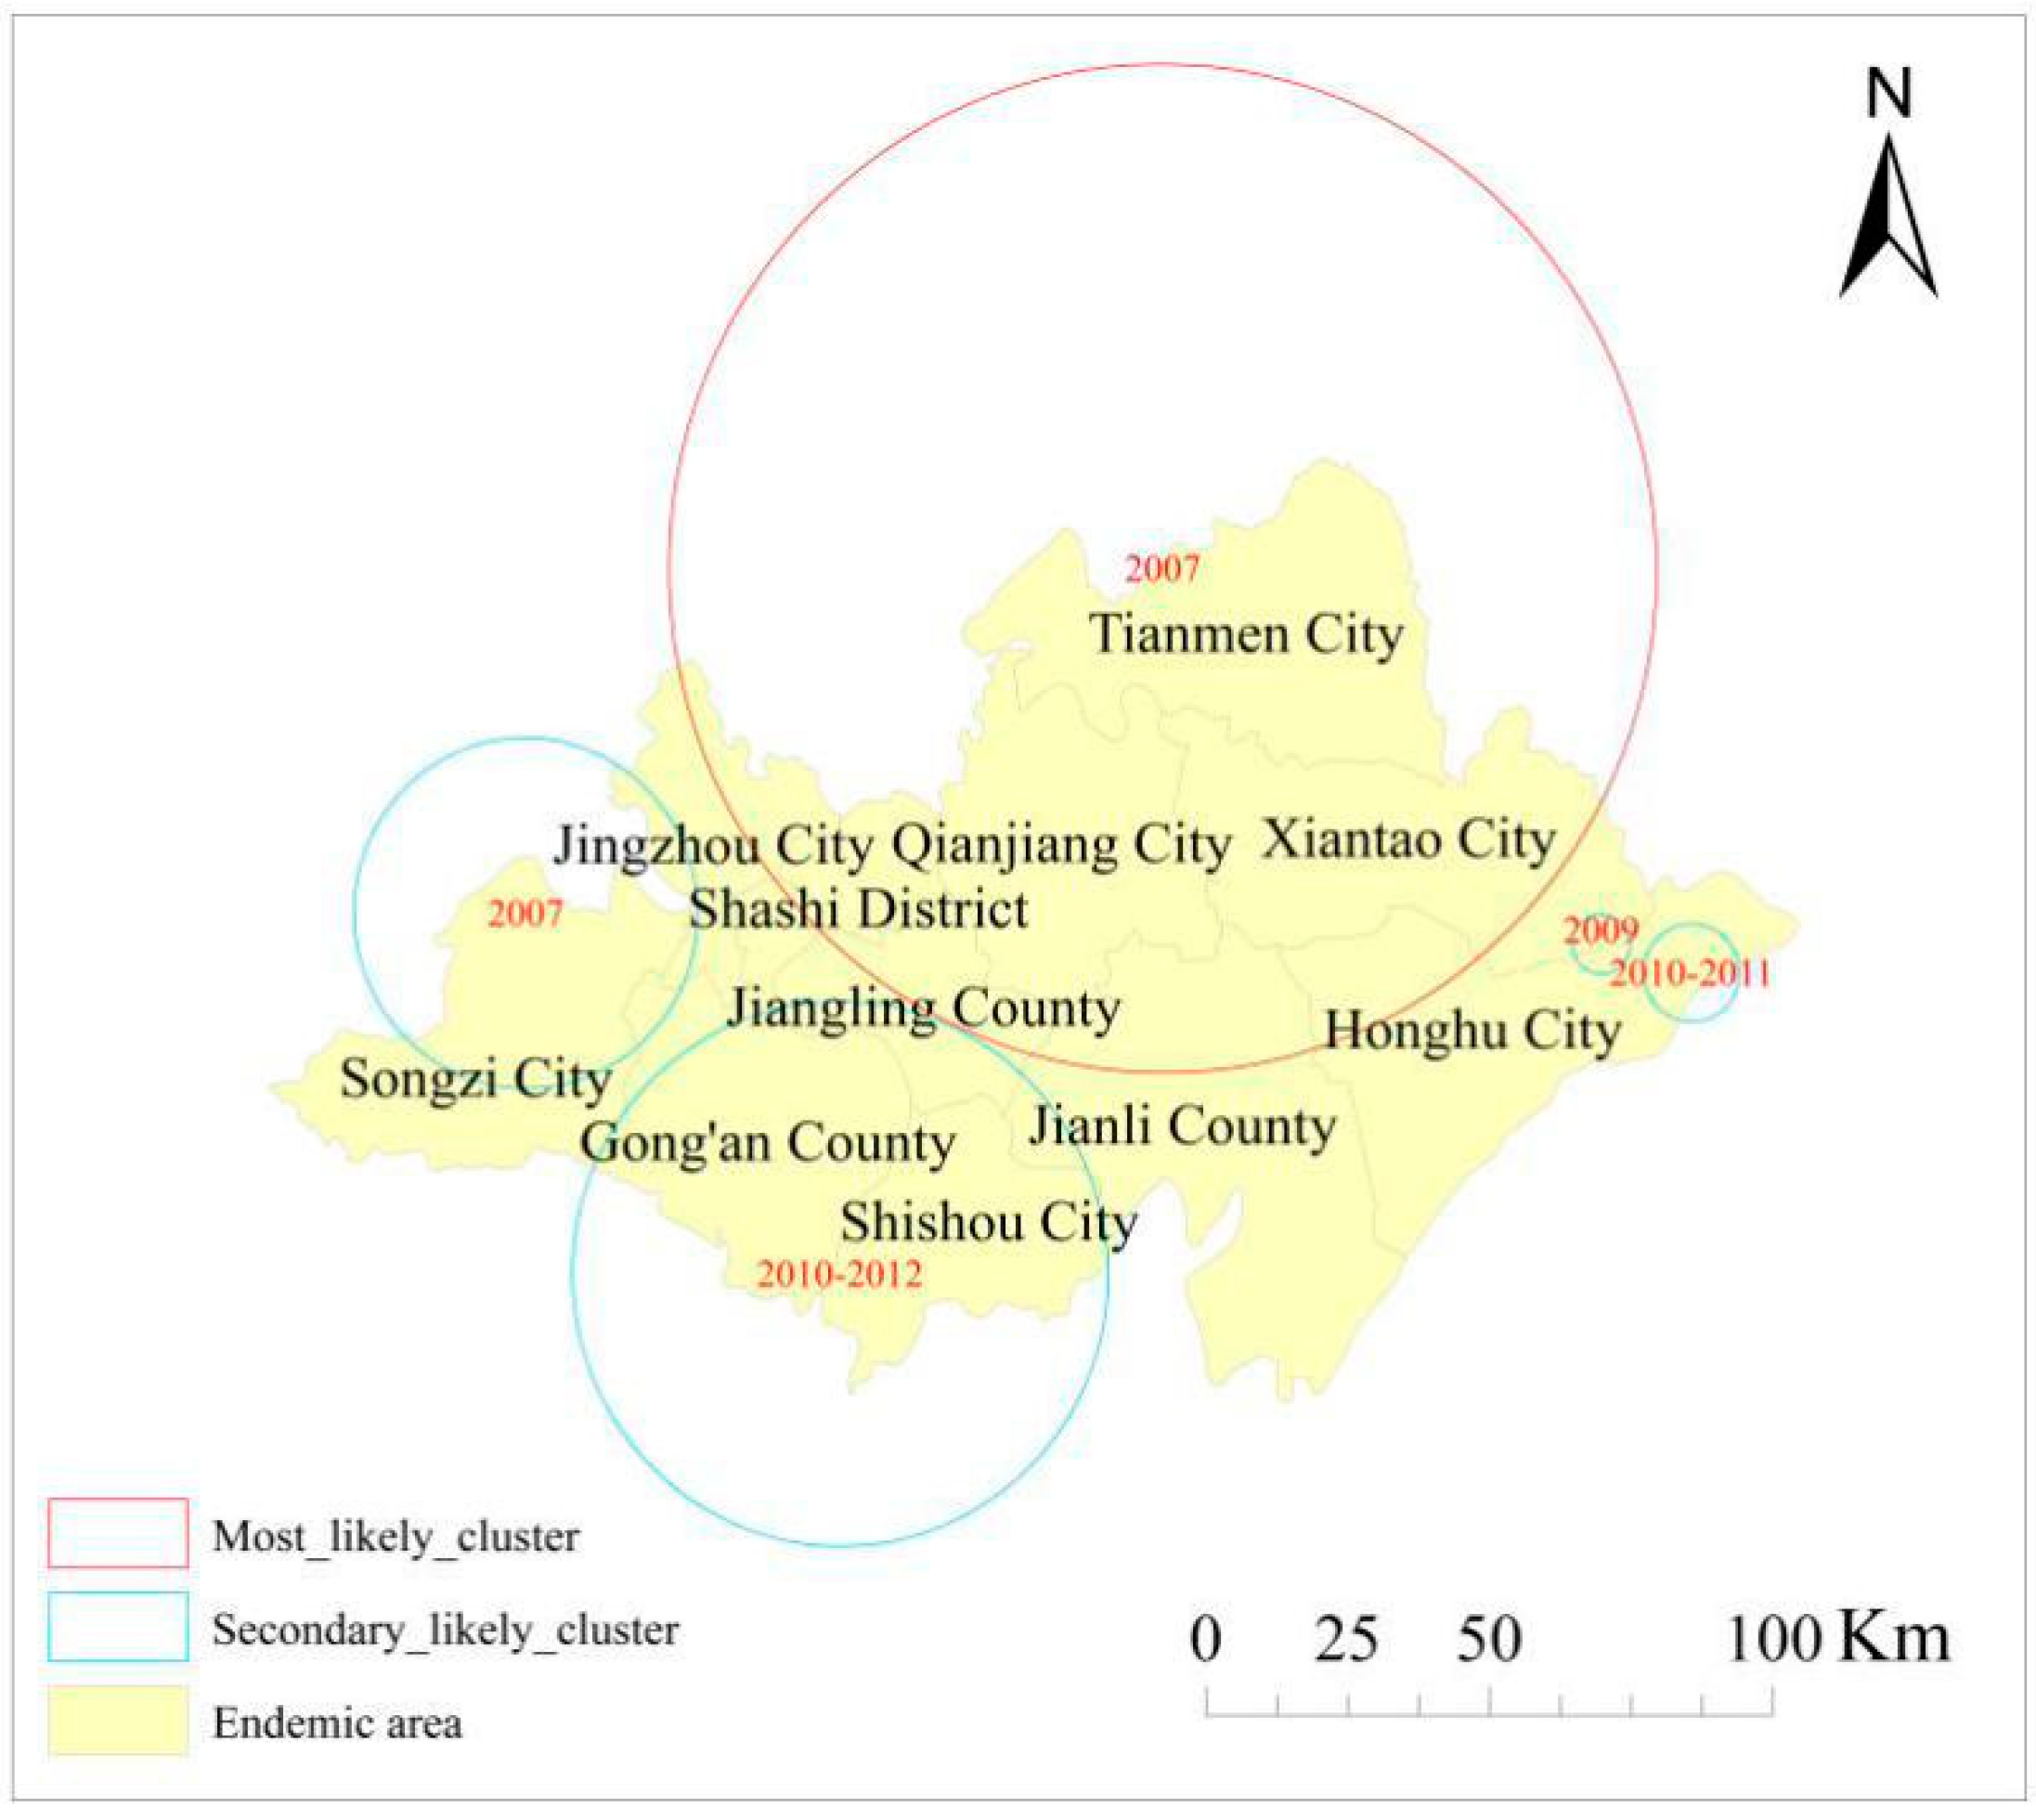
3.1. Spatial Cluster Analysis

The results of spatial cluster analysis are presented in Figure 2. Table 1 indicates several essential spatial characteristics of the number of people affected by schistosomiasis. First, the most likely spatial cluster in 2007 covered the southwestern part of Qianjiang City, the southeastern area of Shashi District, and most areas of Jiangling County. Moreover, spatial coverage of the most likely clusters in 2008, 2009, 2010, 2011, and 2012 were identical and extended to the southwestern region of Qianjiang City and the vast majority of areas of Shashi District, Jiangling County, Jianli County, Shashi District, and Gong’an County. In addition to these most likely clusters, several secondary likely clusters were also identified. Furthermore, as shown in Table 1, the number of clusters declined from 109 in 2007 to 42 in 2012, with fluctuations along the way. In addition, changes observed in the number of endemic villages in the most likely clusters could have been divided into four phases as increasing from 2007 to 2008 and 2009 to 2011, decreasing from 2008 to 2009, and remaining unchanged from 2011 to 2012.
Space–time cluster analysis of human schistosomiasis cases: Retrospective space–time analysis of clusters is presented in Figure 3. Table 2 indicates that five clusters were detected in Jianghan Plain from 2007 to 2012. The log likelihood ratio (LLR) ranged from a maximum of 1404.203 to a minimum 82.678, with a p-value less than 0.001. This suggests the significance of both space and time in these areas. The most likely cluster occurred in 2007 and consisted of 1014 endemic villages distributed among most of the northern Jianghan Plain, covering Tianmen City, Xiantao City, Qianjiang City, and Shashi District, as well as partial areas of Honghu City, Jianli County, Jiangling County, and Jingzhou City (LLR = 1404.203, p < 0.001). In addition, four secondary space–time clustered areas were detected: one in 2007, covering 116 villages in most of the northern parts of Songzi City and a small part of western Jingzhou District and Gong’an County; the second space–time cluster was mainly distributed in a small area in northeast Jiangling County and most parts of Gong’an County, Shishou City, and Jiangling County, covering 500 endemic villages from 2010 to 2012; the third cluster covered 23 endemic villages in the period from 2010 to 2011, covering a small area in northeast Honghu City; and the fourth cluster was located in a tiny area of four villages along the border between Honghu City and Xiantao City in 2009.

3.2. Environmental Factor Analysis

3.2.1. Factor Detector

The results of factor detector analysis (Table 3) revealed that the environmental factors associated with the infection rates of human schistosomiasis from 2007 to 2012 were ranked by their contribution to schistosomiasis. In 2007 and 2012, the most influencing factors were average TDN, average LSTN, and land use. In 2008 and 2009, the top three factors included land use, soil type, and average LSTN. In 2010, the average LSTN, average LSTD, and land use were the essential factors in controlling the infection rates of human schistosomiasis. In 2011, the important factors included the average LSTN, land use, and average TDN.
Based on these analyses from 2007 to 2012, it is evident that among the environmental factors selected in this study, temperature, land use type, and soil type had the greatest impact on schistosomiasis in Jianghan Plain. The other factors under consideration had a relatively weak impact on the prevalence of the disease. The effects of land use and soil types on schistosomiasis increased from 2007 to 2009, decreased from 2009 to 2012, and reached its maximum in 2009. Furthermore, the effect of temperature on schistosomiasis was reduced from 2007 to 2008, increased from 2008 to 2010, decreased from 2010 to 2012, and reached its maximum in 2010.

3.2.2. Ecological Detector

We determined whether the effects of the two factors on the spatial distribution of infection rates of human schistosomiasis were significantly different and conducted tests using the ecological detector. The results are presented in Figure 4, where years not shown indicate that the differences between any two factors were not statistically significant. First, in 2007, the differences between average NDVI and average TDN, DER and average TDN, average LSTD and average TDN, DER and average LSTN, and average LSTD and average LSTN were all significant. Second, in 2008, 2009, and 2011, the differences between any two factors were not statistically significant. Third, in 2010, the differences between average LSTN and any other factors excepting for average TDN showed statistical significance. Apart from those differences, no other significant differences were noted in 2010. In 2012, the differences between the average NDVI and average LSTN, silt percentage and average LSTN, DER and average LSTN, and average LSTD and average LSTN were all significant.
The differences observed in the effects of two factors on the spatial distribution of human schistosomiasis were inconsistent, showing significance in some years and a lack thereof in others.

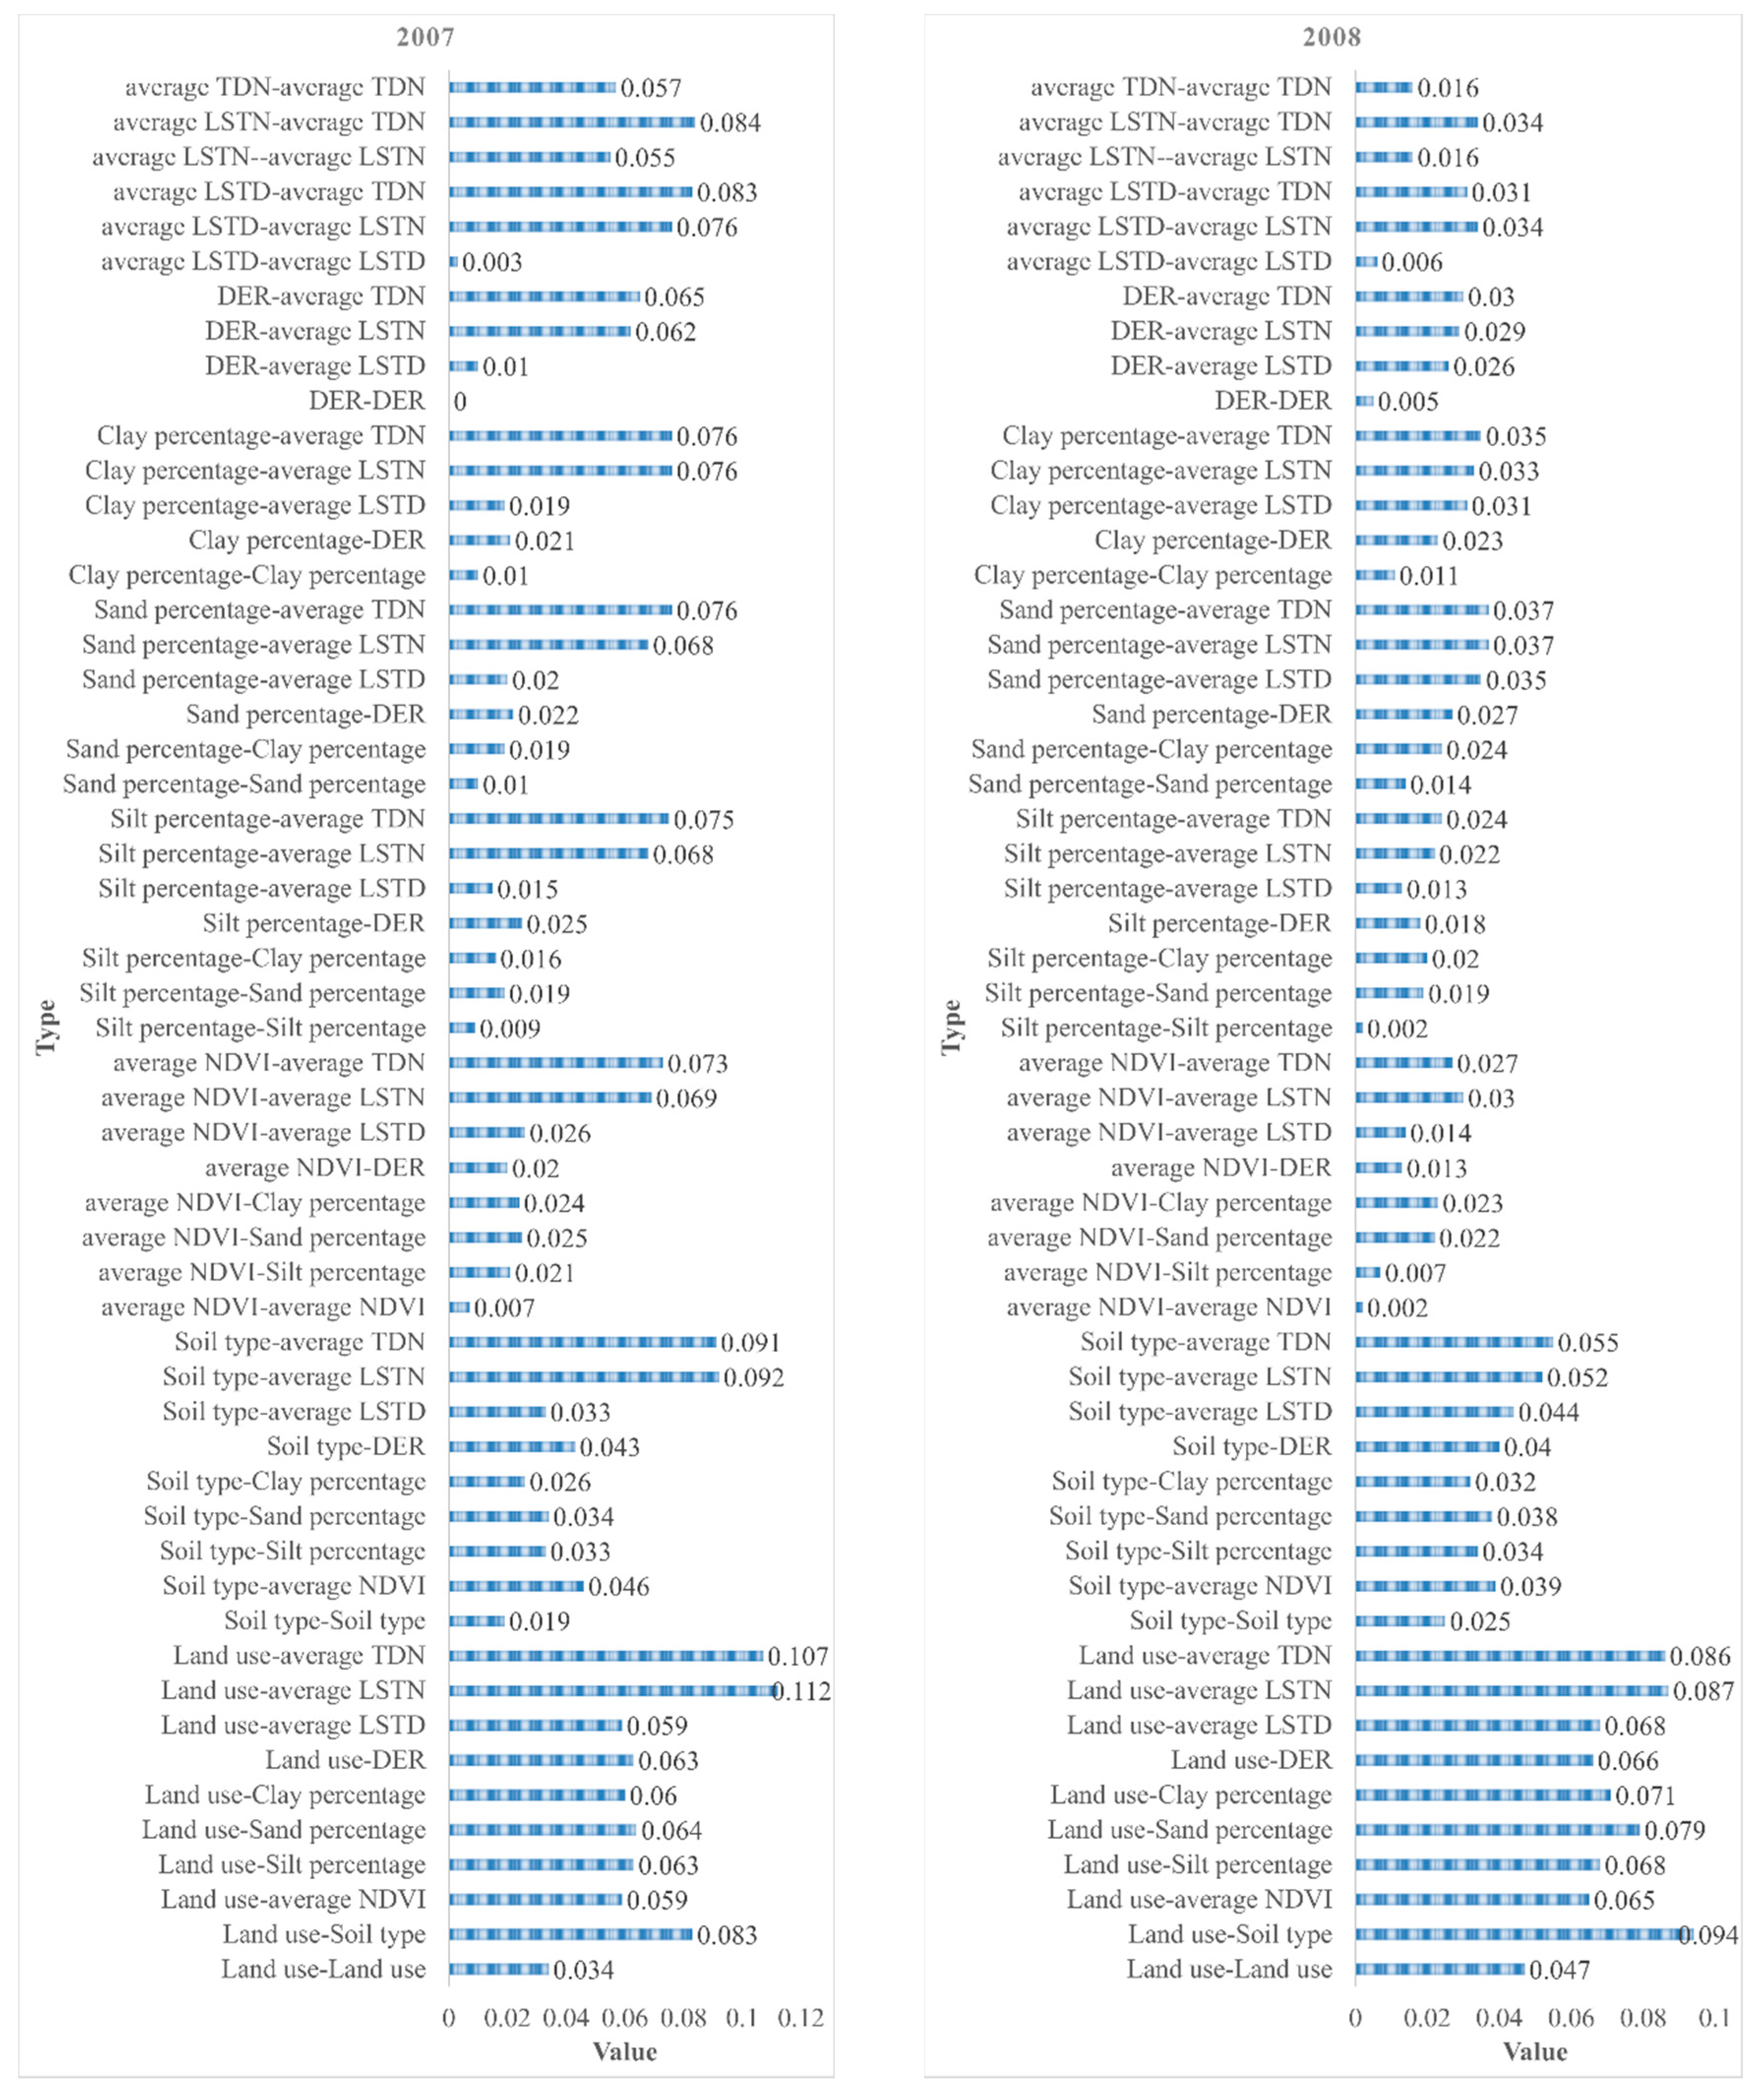
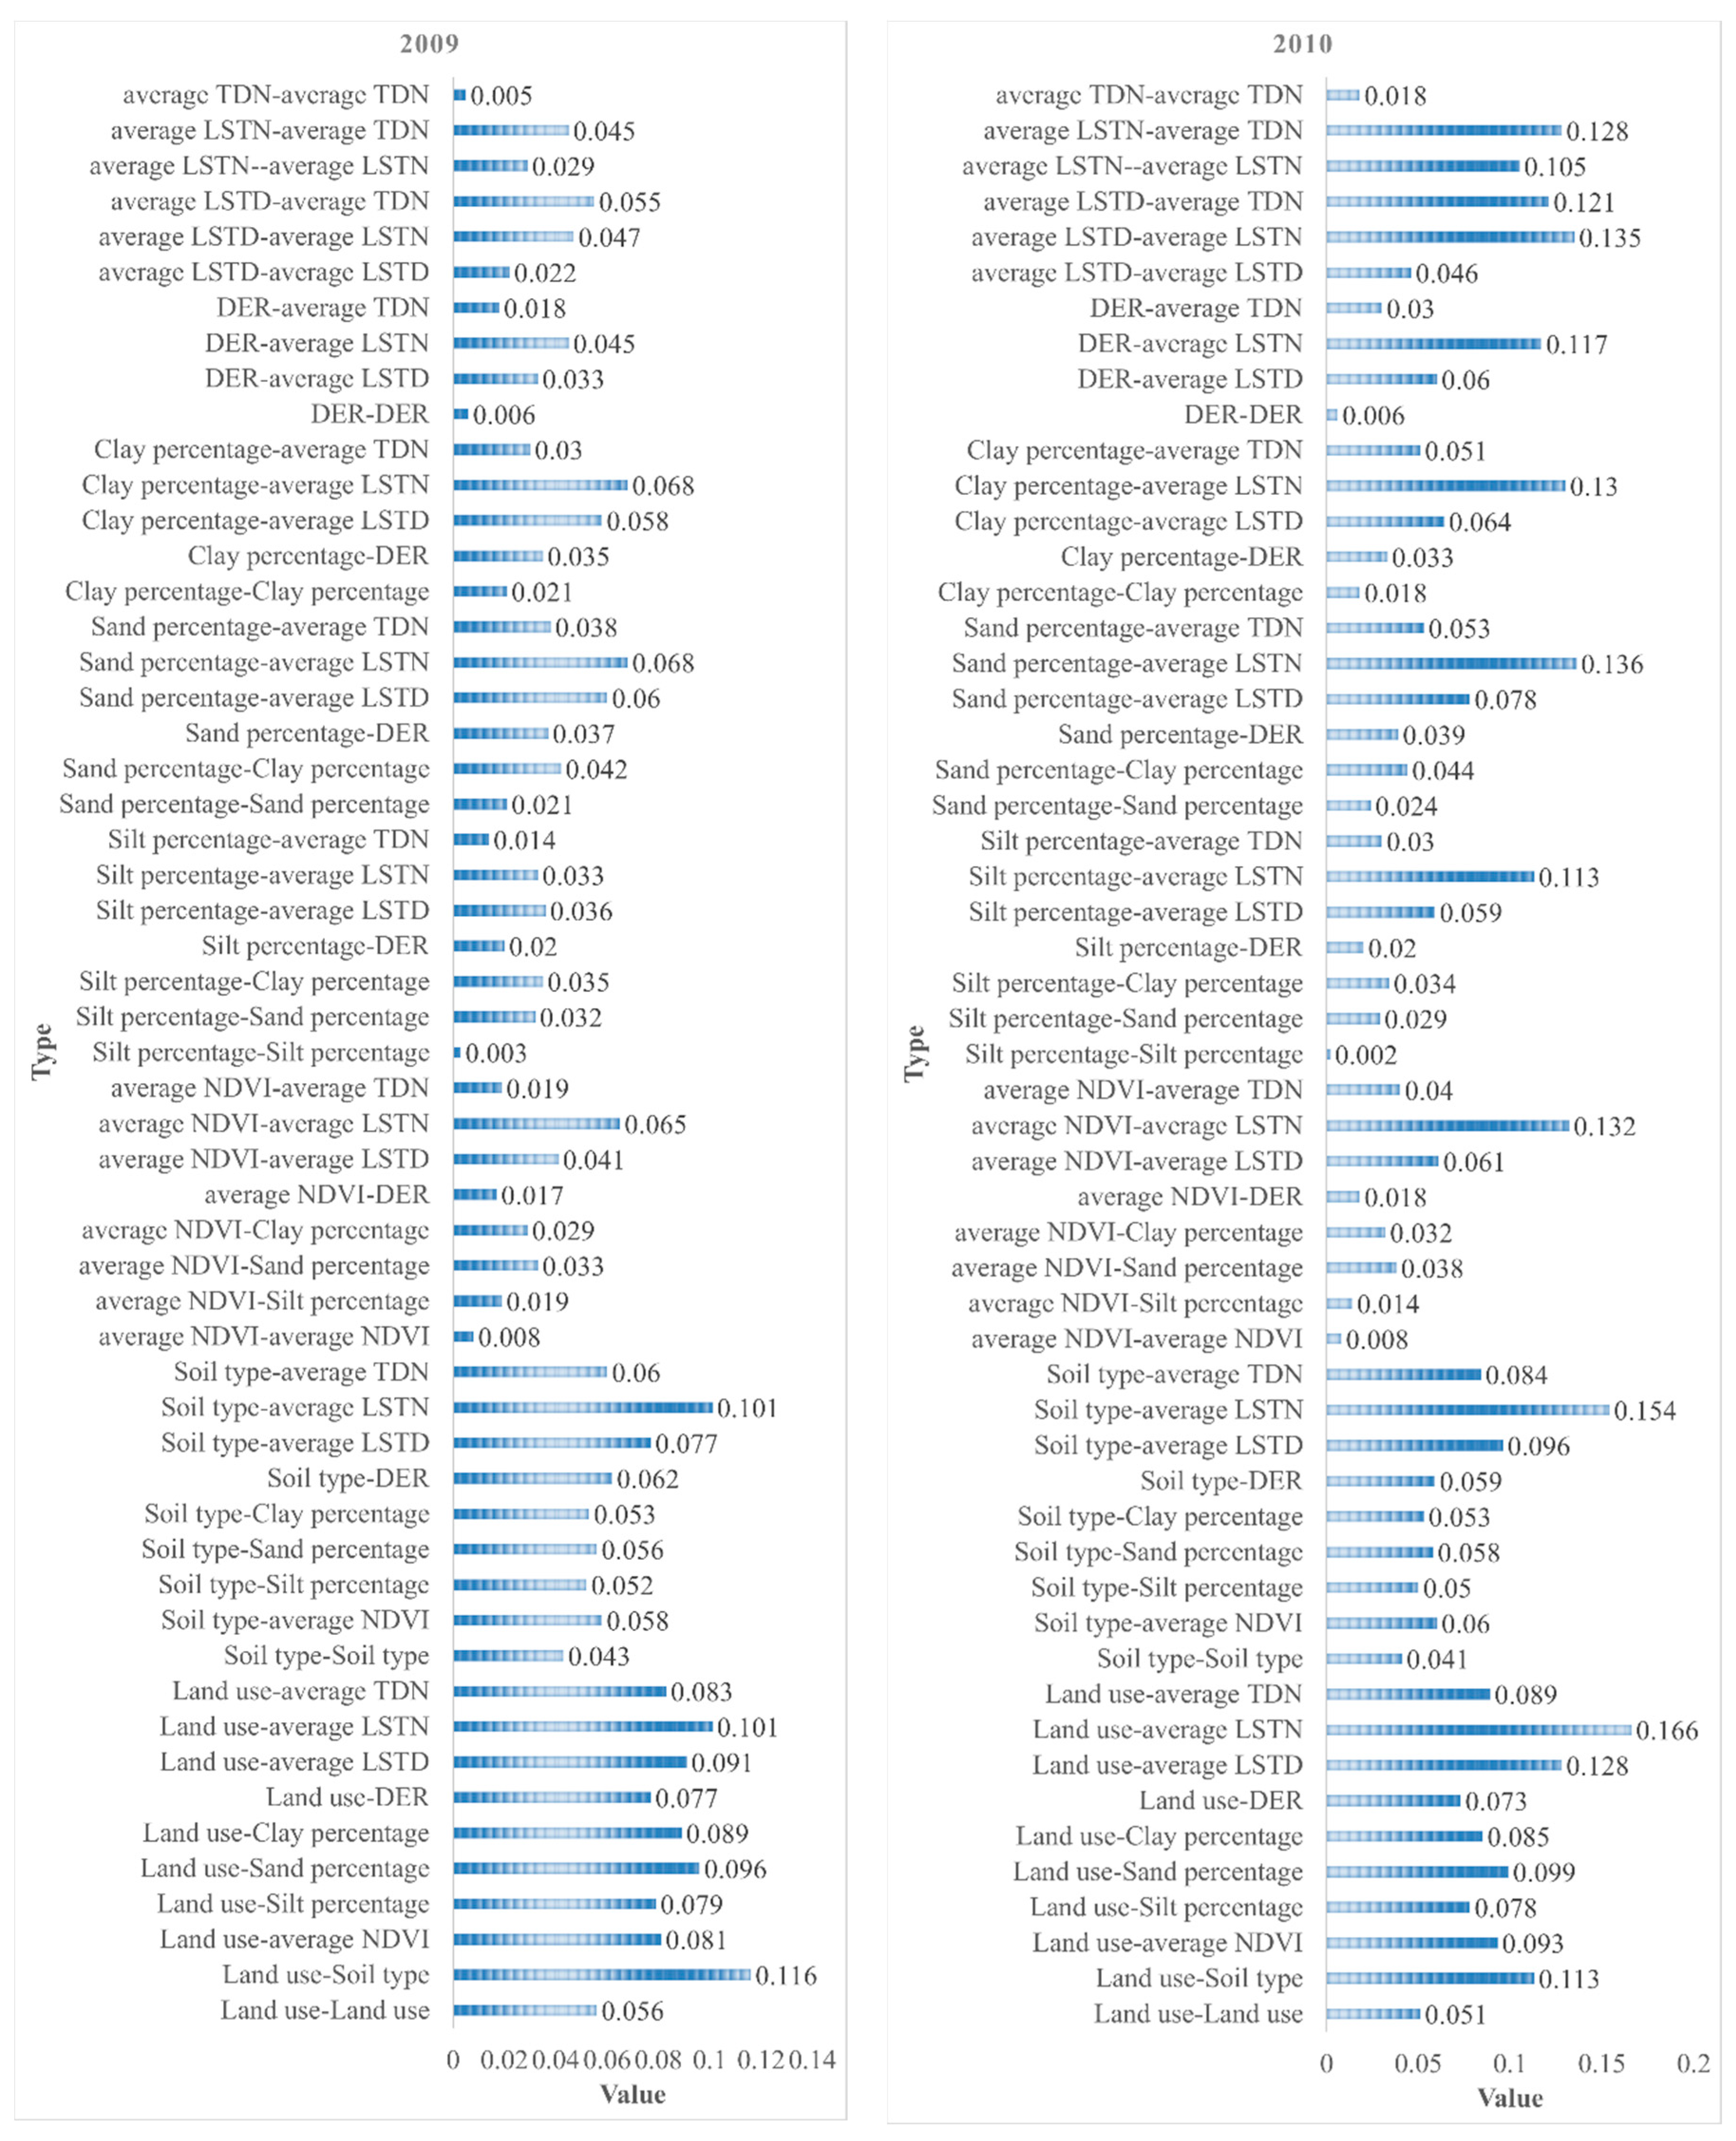
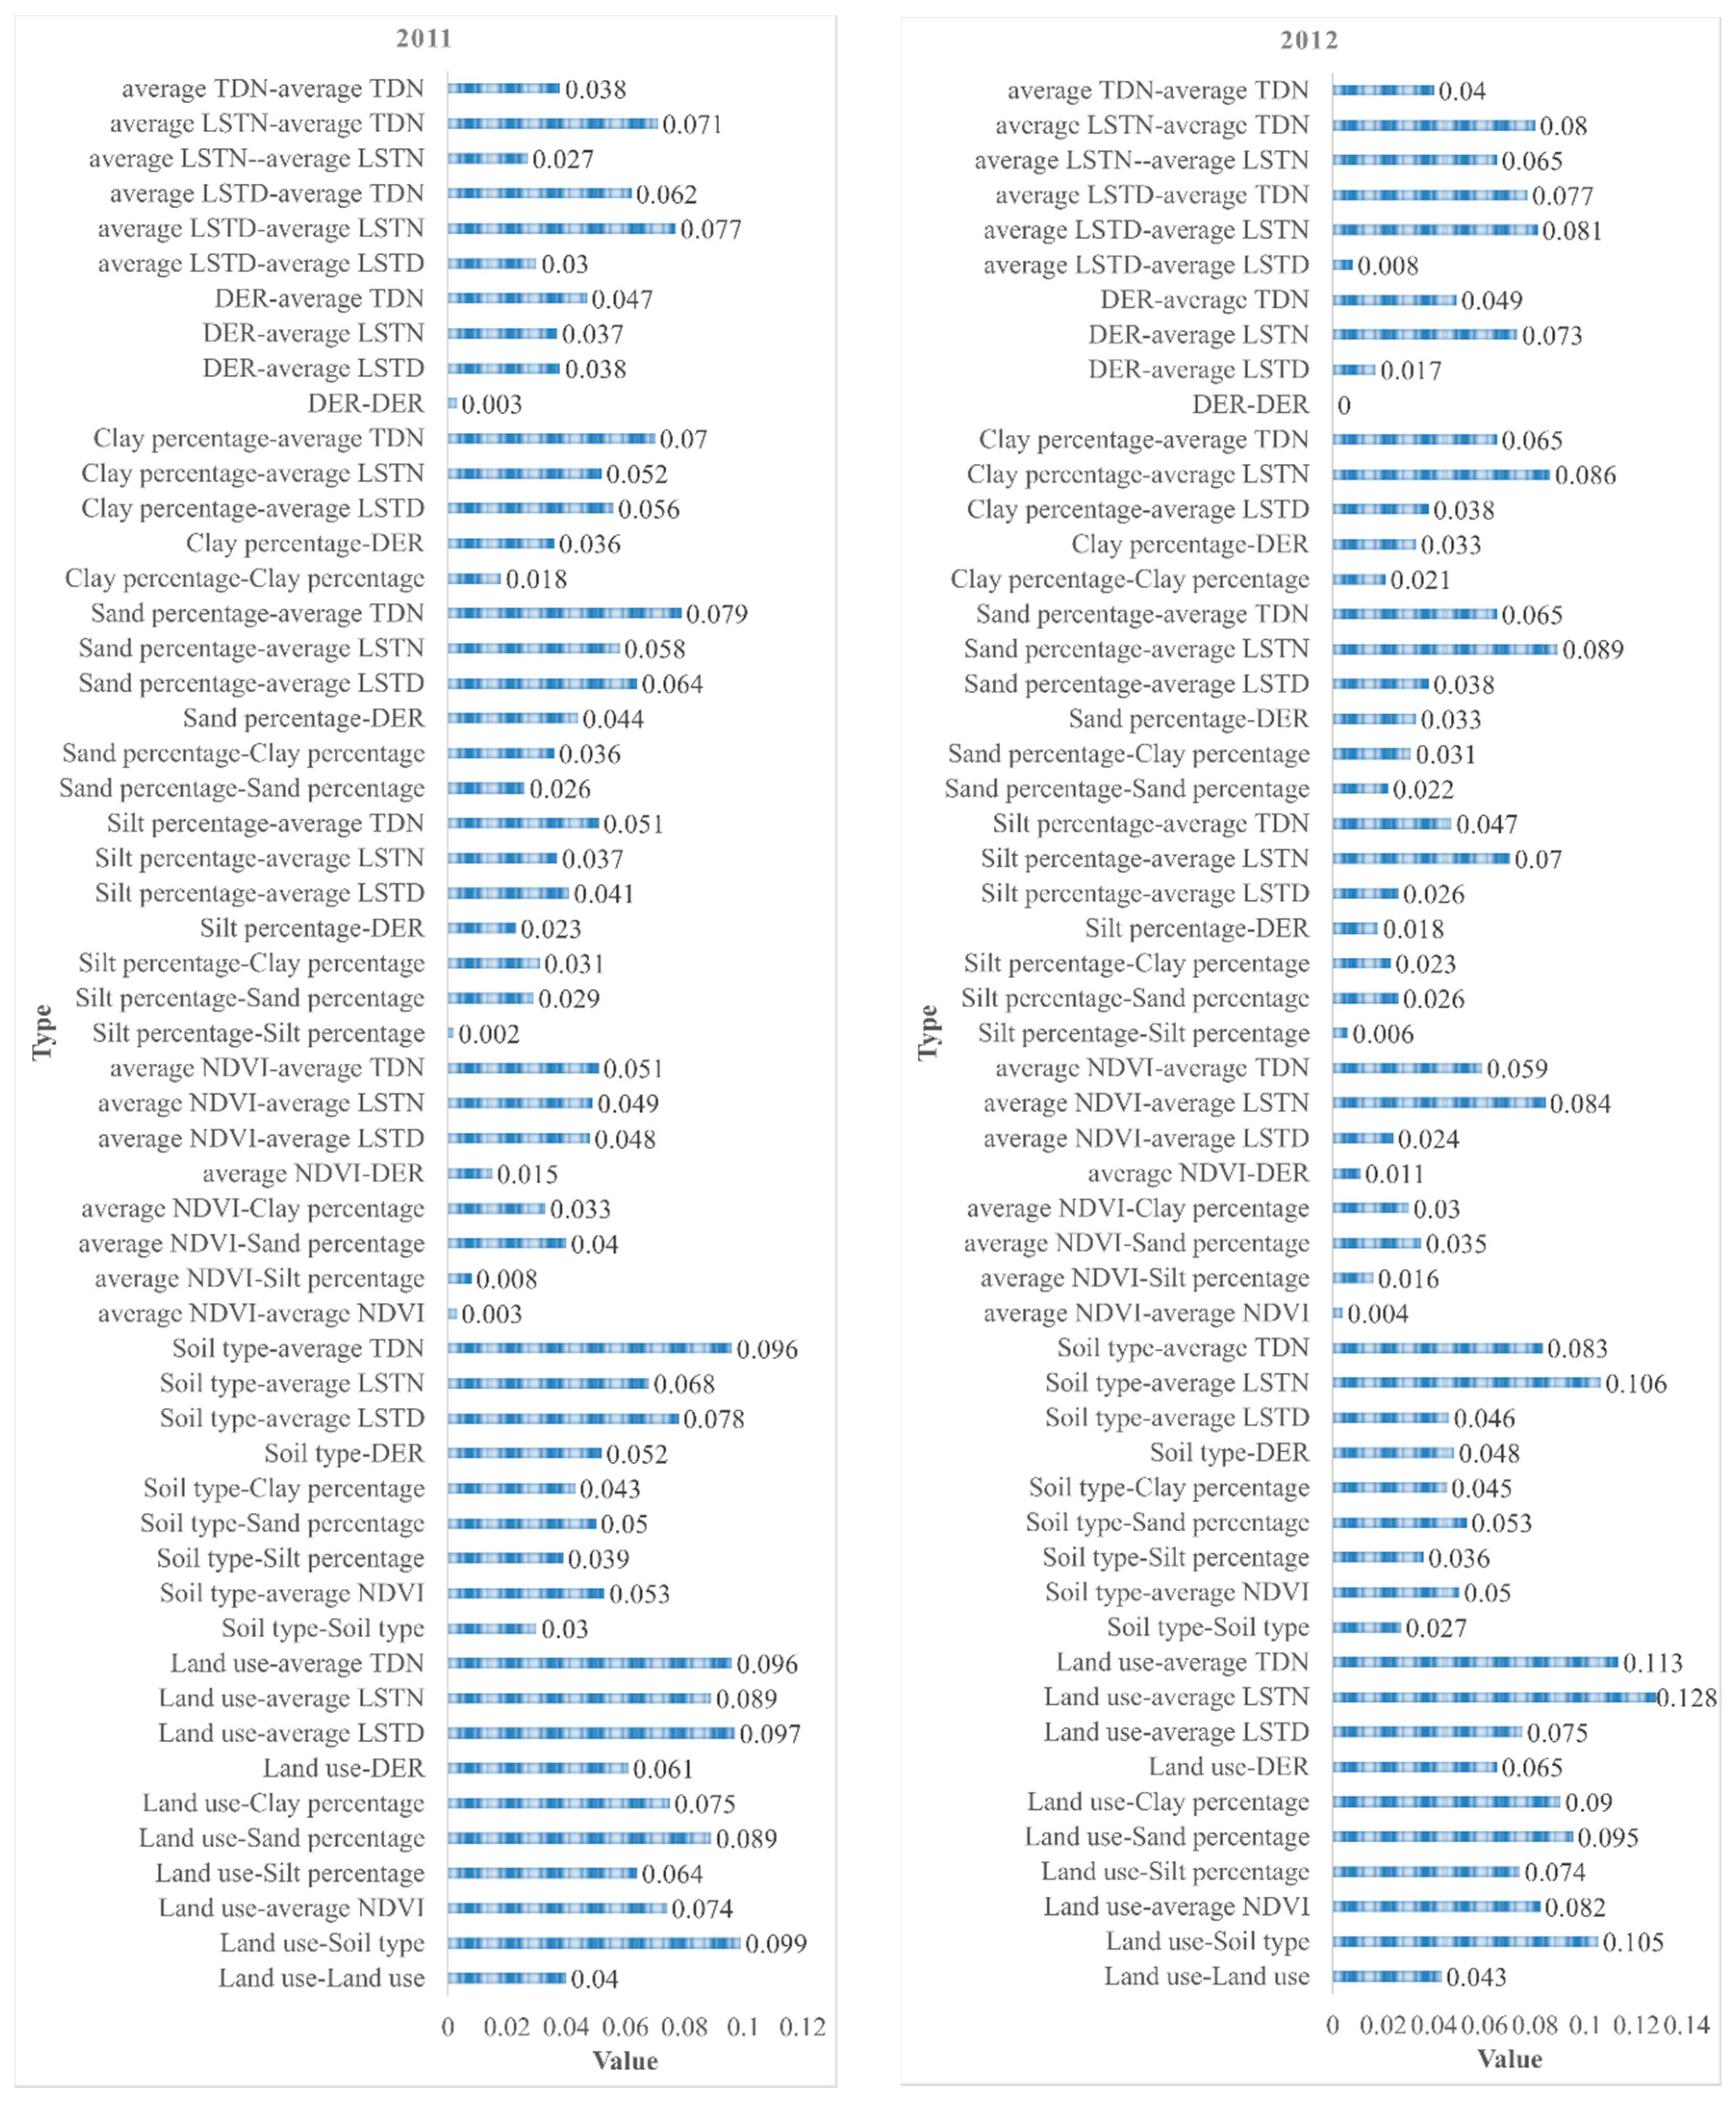
3.2.3. Interaction Detector

Interaction detection was applied to check whether two schistosomiasis determinants work independently or not. The outcomes are presented in Figure 5. We considered land use and soil type in 2007 as an example to interpret the results. These two determinants accounted for 3.4% and 1.9% of schistosomiasis rates, respectively. However, the joint effect of the two factors was 8.3%. Thus, land use and soil type operating together enhance the effects of each other in the control of schistosomiasis. Based on the analysis of Figure 5, we found that whenever any two factors operated together, a trend of enhanced interaction was observed.

4. Discussion

Understanding the spatial distribution of schistosomiasis is of great importance in the control of schistosomiasis [20]. Jianghan Plain is widely known as a susceptible area of schistosomiasis in China, owing to its climate and geographical characteristics [4,7,21,22]. This study presents the application of spatial, temporal, and space–time scan statistics as well as Geodetector analysis of the changing spatiotemporal patterns and environmental factors of schistosomiasis in Jianghan Plain in the middle and southern parts of Hubei Province, China during the period 2007–2012.
Spatial, temporal, and space–time scan statistics (SaTScan statistics) perform well when used for the geographical surveillance of disease to detect spatial or space–time disease clusters and determine statistical significance [23]. These statistics have also been applied in numerous previous studies [15,24,25,26]. Several conclusions can be drawn using this method. First, the purely spatial cluster analysis of large populations of schistosomiasis infections, using the Kulldorff’s spatial scan statistic, showed that the number of clusters and relative risk declined but fluctuated. However, coverage of the most likely clustered areas showed a dynamic and increasing trend. These findings are mainly due to a lower number of infected people within recent years than in the past. In addition, the mobility of the population has shown a significant increase. Furthermore, the prevalence of schistosomiasis was relatively low and scattered, resulting in a wide range of clusters.
Since 2004, schistosomiasis prevention and control in China has included the implementation of a comprehensive strategy based on controlling the source of infection. This has promoted a trend of recovery from the disease and diminished the epidemic of schistosomiasis to a relatively low level [20]. To promote schistosomiasis prevention efforts for the province even further, active exploration of the optimal prevention and control strategies have been outlined to achieve the second phase of the “planning” targets for the control of transmission. The Hubei Provincial People’s Government and the former Ministry of Health and Ministry of Agriculture reached a consensus at the end of 2008 to support schistosomiasis prevention efforts in Hubei Province and agreed to launch a joint schistosomiasis prevention campaign from 2009 to 2013 [27].
Furthermore, space–time cluster analysis indicated the presence of five clusters: two in 2007, two during the periods 2010–2012 and 2010–2011, and one in 2009, respectively. It is worth noting that no cluster was observed for 2008. Since 2006, Hubei Province has implemented prevention and control strategies based on the control of infectious sources and establishment of new rural construction projects in severely endemic areas. The strategies include combining resources from multiple sectors of the society, concentrating on governance of severely affected villages, replacing cattle with machinery, prohibiting beach grazing, water and toilet reform, human and livestock inspection and treatment, examination of snails, and health education, among other measures that have achieved favorable effects [28].
However, certain challenges associated with implementation of the measures to “eliminate farming cattle and replace cattle with machinery” remain. This is because most of the areas affected by the schistosomiasis epidemic are economically challenged rural areas. Owing to the limited availability of local arable land and the fact that the labor force is mainly middle- and old-aged farmers who lack mechanical knowledge, there is some resistance to implementation of the strategy to “replace cattle with machinery” [29]. In addition, climate change, social factors, and other changes simultaneously affect the spread of schistosomiasis. For example, the construction of large-scale water conservancy projects, such as the construction of the Three Gorges project, changed the ecological environment of the reservoir and downstream areas, both of which have a direct impact on the habitat of snails [28,30,31]. Thus, the clusters of schistosomiasis began to reappear.
The transmission of schistosomiasis is a complex process (Figure 6). It is closely associated with the propagation of Schistosoma and is largely related to temperature and the spread of intermediate snail hosts. The spread of snails is the main means of transmission and is related to vegetation coverage, land use patterns, soil quality, humidity, and other environmental conditions [20,32,33]. Factor analysis showed that land use, soil type, and temperature were all essential factors during the 6 years under investigation. Previous studies have shown that land use has a major impact on the distribution of intermediate host snails of schistosomiasis only [34,35,36,37]. In addition, significant differences have been reported in Oncomelania density and incidence among different land use types. The Oncomelania density and live snail occurrence tend to be lowest in forested areas, followed by dry land, and tend to be higher in paddy fields, floodplains, barren slopes, and ditches. Moreover, based on linear regression analysis of the ratio of land use in Jianghan Plain and the average density of village-level snails, Chang et al. [38] found that land use considerably affects snail distribution.
In addition, soil is necessary for the survival of snails and has a considerable influence on the spread of schistosomiasis. Previous studies have shown that soil texture (clay percentage, silt percentage, and sand percentage) can all affect the distribution area and density of snails in Hubei Province [33,39]. In the present study, we found that the soil type was also an important factor that influenced schistosomiasis; however, soil texture was a relatively weak factor, as compared to the other factors. Ambient temperature is another critical ecological factor for snails. It can affect their growth, development, reproduction, and distribution both directly and indirectly. Snails maintain a relatively narrow temperature range that is suitable for their physiological needs, between 20 and 30 °C. Environments that are either too cold or too hot are not conducive to their activity, reproduction, and even life expectancy [33].
It is worth noting that the influence of different factors on schistosomiasis varied with time. We analyzed the most important factors that affected the incidence of schistosomiasis, such as temperature, land use, and soil type. We found that the average LSTD, average LSTN, and the average TDN showed fluctuations in trends from 2007 to 2012. Studies [40] have shown that changes in temperature do not only affect the infection rate of Oncomelania snails, but within a certain range, temperature can also directly affect the growth rate of schistosome worms in Oncomelania. Furthermore, temperature changes could potentially affect mammals with schistosomiasis. When there is a change in temperature and the human infection rate has been affected, the distribution of schistosomes may also vary from year to year depending on the temperature. Thus, variations in the infection rate of each subarea might differ, resulting in different final q-values. Furthermore, the annual effect of temperature on schistosomiasis is not uniform. Although the land use data, soil type data, and soil texture data (silt percentage, sand percentage, and clay percentage) used in the present study were consistent from 2007 to 2012, differences in the magnitude of impact on schistosomiasis in different years were still observed. We believe that this is mainly due to changes in the infection rate, which declined from 2007 to 2012. Even if an impact factor shows no change, once the infection rate changes, the explanatory power of the various factors will also change.
In addition, we found that the distance between the administrative village and the water system had little influence on the infection rate in human schistosomiasis. Population contact with a contaminated water supply in an epidemic area is an important link in the spread of schistosomiasis [40]. Residents’ contact with contaminated water is affected by geographical, social, economic, cultural, and general living habits and tends to be seasonal. Quantitative observation of exposure of the residents to the water supply in endemic areas revealed that the chances of exposure to contaminated water during the busy months of May to July were the greatest. During the summer, various activities such as water bathing, catching fish, etc. are the main means of contact with contaminated water. However, owing to the development of comprehensive prevention and control measures for schistosomiasis, such as health education, altering planting patterns, machine-assisted cattle, and a safer water supply [41], the chances of villagers’ contact with contaminated water has been reduced.
It should be pointed out that this paper identified only the temporal and spatial clustering characteristics of a number of schistosomiasis cases. In addition, it analyzed some environmental factors of infection rates in human schistosomiasis. However, some limitations must be acknowledged. The spatiotemporal spread of schistosomiasis is a complicated, dynamic process (Figure 6) based on the relationship of infectious sources to media and subsequent host propagation [34]. This process is affected by the natural environment, social and human activities, and other factors. Because of the diversity of geographic elements, the Geodetector model is incapable of detecting all indicator factors and might reflect an appropriate type or range of environmental indicator factors that is inconsistent with the actual situation. Moreover, in comparison to quantitative factors, the use of qualitative factors can be subjective, and the values thereby derived are determined by their nature or attributes. Furthermore, arbitrary methods of discretization might not accurately characterize actual associations between risk factors and a health outcome; thus, some prior knowledge would be helpful in discretizing quantitative variables [42].

5. Conclusions

The present study systematically demonstrated the spatiotemporal clustering patterns of schistosomiasis-infected cases. Environmental factors associated with the rates of schistosomiasis infection in humans were detected and analyzed through use of the Geodetector and application of SaTScan statistics. In order to fundamentally eliminate the harm posed by schistosomiasis, prevention and control efforts should be focused on the following areas: the southwestern region of Qianjiang City, the vast majority of areas of the Shashi District, Jiangling County, Jianli County, and Gong’an County. Furthermore, temperature, land use, and soil type are the main factors responsible for schistosomiasis prevalence in Jianghan Plain, and most interactions among the risk factors enhance their singular effects.

Author Contributions

Data curation, X.X.; Formal analysis, Y.N.; Funding acquisition, R.L.; Methodology, Y.N., R.L. and J.Q.; Visualization, D.H. and Y.Q.; Writing—original draft, Y.N.; Writing—review & editing, Y.N., R.L., and J.Q.

Funding

This research was funded by National Nature Science Foundation of China (41571487).

Acknowledgments

This research was supported by National Nature Science Foundation of China (41571487). The authors would also like to thank anonymous reviewers and the editor for their support, insightful critiques, and constructive comments.

Conflicts of Interest

The authors declare no conflict of interest.

References

  1. Colley, D.G.; Bustinduy, A.L.; Secor, W.E.; King, C.H. Human schistosomiasis. Lancet 2014, 383, 2253–2264. [Google Scholar] [CrossRef] [Green Version]
  2. Chitsulo, L.; Engels, D.; Montresor, A.; Savioli, L. The global status of schistosomiasis and its control. Acta Trop. 2000, 77, 41–51. [Google Scholar] [CrossRef] [Green Version]
  3. Thétiot-Laurent, S.A.; Boissier, J.; Robert, A.; Meunier, B. Schistosomiasis Chemotherapy. Angew. Chem. Int. Ed. Engl. 2013, 52, 7936–7956. [Google Scholar] [CrossRef] [PubMed]
  4. Chen, Y.Y.; Liu, J.B.; Jiang, Y.; Li, G.; Shan, X.W.; Zhang, J.; Cai, S.X.; Huang, X.B. Dynamics of spatiotemporal distribution of schistosomiasis in Hubei Province, China. Acta Trop. 2018, 180, 88–96. [Google Scholar] [CrossRef] [PubMed]
  5. Dang, H.; Jin, J.-N.; Xu, J.; Li, S.-Z.; Zhou, X.-N.; Sun, J.-L.; Li, Z.-J.; Lu, S. Surveillance of schistosomiasis in People’s Republic of China in 2015. Chin. J. Schistosomiasis Control 2017, 29, 273–280. (In Chinese) [Google Scholar] [CrossRef]
  6. Zhang, J.-L.; Xu, M.-Z.; Quan, J.-Y.; Dang, H.; Lu, S.; Xu, J.; Li, Z.-S.; Zhou, N.-X. Endemic status of schistosomiasis in People’s Republic of China in 2016. Chin. J. Schistosomiasis Control 2017, 29, 669–677. (In Chinese) [Google Scholar] [CrossRef]
  7. Zhao, A.; Sun, J.; You, S. Application of Geo-informatics to the Study of Schistosomiasis Habitat. Geo Spat. Inf. Sci. 2007, 9, 17–20. (In Chinese) [Google Scholar]
  8. Lv, S.B.; Lin, D.D. Natural environment and schistosomiasis transmission in Poyang Lake region. Chin. J. Schistosomiasis Control 2014, 26, 561–564. (In Chinese) [Google Scholar]
  9. Zhang, X.; Yang, X.; Peng, Z. Relationships between the surviving Oncomelania and beaches environmental factors. Acta Ecol. Sin. 1999, 19, 265–269. [Google Scholar]
  10. Qian, X.; Yang, J.; Chen, L.; Li, L. The study on the microenvironment physical-chemical factor of snail habitat in Anning River Valley. Mod. Prev. Med. 2000, 27, 15–17. (In Chinese) [Google Scholar]
  11. Maszle, D.R.; Whitehead, P.G.; Johnson, R.C.; Spear, R.C. Hydrological studies of schistosomiasis transport in Sichuan Province, China. Sci. Total Environ. 1998, 216, 193–203. [Google Scholar] [CrossRef]
  12. Zhong, J.; Zhang, S.; Liu, Z.; Wu, W.; Wu, S.; Zhou, M.; Hu, L. Studies on relationship of snail distribution with plantation and soil property of marshland in Poyang Lake. Chin. J. Schistosomiasis Control 1995, 4, 206–209. (In Chinese) [Google Scholar]
  13. Minggang, C.; Zheng, F. Schistosomiasis control in China. Parasitol. Int. 1999, 48, 11–19. [Google Scholar] [CrossRef]
  14. Xia, C.; Bergquist, R.; Lynn, H.; Hu, F.; Lin, D.; Hao, Y.; Li, S.; Hu, Y.; Zhang, Z. Village-based spatio-temporal cluster analysis of the schistosomiasis risk in the Poyang Lake Region, China. Parasit. Vectors 2017, 10, 136. [Google Scholar] [CrossRef] [PubMed]
  15. Qiu, J.; Li, R.D.; Huang, D.; Shi, Y.Y.; Xu, X.J.; Wei, F.H.; Wang, H.F. Spatiotemporal heterogeneity in cattle schistosomiasis japonicum infection at village level in Jianghan Plain, China. Resour. Environ. Yangtze Basin 2018, 27, 405–411. (In Chinese) [Google Scholar]
  16. Qiu, J.; Li, R.D.; Xu, X.J. Characteristics analysis of Oncomelania hupensis’s geographical distribution in Hubei Province. Resour. Environ. Yangtze Basin 2012, 21, 100–104. (In Chinese) [Google Scholar]
  17. Wang, J.F.; Li, X.H.; Christakos, G.; Liao, Y.L.; Zhang, T.; Xue, G.; Zheng, X.Y. Geographical detectors-based health risk assessment and its application in the neural tube defects study of the Heshun Region, China. Int. J. Geogr. Inf. Sci. 2010, 24, 107–127. [Google Scholar] [CrossRef]
  18. Wang, J.F.; Hu, Y. Environmental health risk detection with GeogDetector. Environ. Model Softw. 2012, 33, 114–115. [Google Scholar] [CrossRef]
  19. Wang, J.; Xu, C. Geodetector: Principle and prospective. Acta Geogr. Sin. 2017, 72, 116–134. [Google Scholar] [CrossRef]
  20. Zhao, F.; Zhu, R.; Zhang, L.J.; Zhang, Z.J.; Li, Y.P.; He, M.Z.; Zhou, Y.B.; Guo, J.G.; Zhao, G.M.; Jiang, Q.W. Application of saTScan in detection of schistosomiasis clusters in marshland and lake areas. Chin. J. Schistosomiasis Control. 2011, 23, 28–31. (In Chinese) [Google Scholar]
  21. Chen, Y.; Cai, S.; Liu, J.; Xiao, Y.; Li, G.; Shan, X.; Zhang, J. Epidemic and spatial distribution of Schistosomiasis in Hubei province from 2008 to 2012. Chin. J. Epidemiol. 2014, 35, 1366–1370. (In Chinese) [Google Scholar] [CrossRef]
  22. Chen, Y.Y.; Huang, X.B.; Xiao, Y.; Jiang, Y.; Shan, X.W.; Zhang, J.; Cai, S.X.; Liu, J.B. Spatial analysis of Schistosomiasis in Hubei Province, China: A GIS-Based analysis of Schistosomiasis from 2009 to 2013. PLoS ONE 2015, 10, e0118362. [Google Scholar] [CrossRef] [PubMed]
  23. Peng, W.X.; Zhang, Z.J.; Zhuang, J.L.; Zhou, Y.B.; Jiang, Q.W. Potential impact of climate changes on spatial distribution of schistosomiasis in China. Sci. Technol. Rev. 2006, 7, 58–60. (In Chinese) [Google Scholar]
  24. Coleman, M.; Coleman, M.; Mabuza, A.M.; Kok, G.; Coetzee, M.; Durrheim, D.N. Using the SaTScan method to detect local malaria clusters for guiding malaria control programmes. Malar. J. 2009, 8, 68. [Google Scholar] [CrossRef] [PubMed] [Green Version]
  25. Stelling, J.; Yih, W.K.; Galas, M.; Kulldorff, M.; Pichel, M.; Terragno, R.; Tuduri, E.; Espetxe, S.; Binsztein, N.; O’Brien, T.F.; et al. Automated use of WHONET and SaTScan to detect outbreaks of Shigella spp. using antimicrobial resistance phenotypes. Epidemiol. Infect. 2010, 138, 873–883. [Google Scholar] [CrossRef] [PubMed]
  26. Azage, M.; Kumie, A.; Worku, A.; Bagtzoglou, A.C. Childhood Diarrhea Exhibits Spatiotemporal Variation in Northwest Ethiopia: A SaTScan Spatial Statistical Analysis. PLoS ONE 2015, 10, e0144690. [Google Scholar] [CrossRef] [PubMed]
  27. Zheng, H.; Zhang, L.J.; Zhu, R.; Xu, J.; Li, S.Z.; Guo, J.G.; Xiao, N.; Zhou, X.N. Schistosomiasis situation in People’s Republic of China in 2011. Chin. J. Schistosomiasis Control 2012, 24, 621–626. (In Chinese) [Google Scholar]
  28. Zhu, H.; Cai, S.X.; Liu, J.B.; Liao, H.Y.; Gong, X.G.; Xu, X.J.; Zhou, Y.; Tu, Z.; Yang, G.B.; Zhu, H.G.; et al. Assessment report on objectives and tasks of schistosomiasis control in Hubei Province (2012). J. Public Health Prev. Med. 2013, 24, 46–50. (In Chinese) [Google Scholar]
  29. Huang, X.; Zhang, X.; Zhu, H.; Xiao, Y.; Liu, J.; Su, Z.; Chen, Y. Endemic situation of schistosomiasis in Hubei Province, 2008. Chin. J. Schistosomiasis Control 2009, 21, 486–490. (In Chinese) [Google Scholar]
  30. Hong, X.C.; Xu, X.J.; Chen, X.; Li, Y.S.; Yu, C.H.; Yuan, Y.; Chen, Y.Y.; Li, R.D.; Qiu, J.; Liu, Z.C.; et al. Assessing the Effect of an Integrated Control Strategy for Schistosomiasis Japonica Emphasizing Bovines in a Marshland Area of Hubei Province, China: A Cluster Randomized Trial. PLoS Negl. Trop. Dis. 2013, 7, e2122. [Google Scholar] [CrossRef] [PubMed]
  31. McManus, D.P.; Gray, D.J.; Li, Y.; Feng, Z.; Williams, G.M.; Stewart, D.; Rey-Ladino, J.; Ross, A.G. Schistosomiasis in the People’s Republic of China: The era of the Three Gorges Dam. Clin. Microbiol. Rev. 2010, 23, 442–466. [Google Scholar] [CrossRef] [PubMed]
  32. Zhu, H.M.; Xiang, S.; Yang, K.; Wu, X.H.; Zhou, X.N. Three Gorges Dam and Its Impact on the Potential Transmission of Schistosomiasis in Regions along the Yangtze River. Ecohealth 2008, 5, 137–148. [Google Scholar] [CrossRef] [PubMed]
  33. Wang, J.S.; Lu, J.Y.; Wei, G.Y.; Yao, S.M. Impact of environment changes on Oncomelania spread. J. Yangtze River Sci. Res. Inst. 2007, 24, 16–19. (In Chinese) [Google Scholar]
  34. Hu, Y.; Xiong, C.; Zhang, Z.; Luo, C.; Cohen, T.; Gao, J.; Zhang, L.; Jiang, Q. Changing Patterns of Spatial Clustering of Schistosomiasis in Southwest China between 1999–2001 and 2007–2008: Assessing Progress toward Eradication after the World Bank Loan Project. Int. J. Environ. Res. Public Health 2014, 11, 701–712. [Google Scholar] [CrossRef] [PubMed] [Green Version]
  35. Gong, P.; Xu, B.; Liang, S. Remote sensing and geographic information systems in the spatial temporal dynamics modeling of infectious diseases. Sci. China C Life Sci. 2006, 49, 573–582. [Google Scholar] [CrossRef] [PubMed]
  36. Xu, B.; Gong, P.; Biging, G.; Liang, S.; Seto, E.; Spear, R. Snail Density Prediction for Schistosomiasis Control Using Ikonos and ASTER Images. Photogramm. Eng. Remote Sens. 2004, 70, 1285–1294. [Google Scholar] [CrossRef]
  37. Fang, Z.; Huang, L.; Zhang, X.; Sun, Q.; Jiang, J. The relationship between patterns of spatial distribution of Oncomelania and layout of Oncomelania-controlling forest in purple shallow hilly areas of Sichuan. J. Sichuan For. Sci. Technol. 2009, 30, 40–44. (In Chinese) [Google Scholar]
  38. Chang, B.R.; Li, R.D.; Xu, X.J.; Qiu, J.; Yi, F.J.; Luo, K.S. Impact of land use on Oncomelania’s distribution in Jianghan Plain. Resour. Environ. Yangtze Basin 2014, 23, 380–384. (In Chinese) [Google Scholar]
  39. Tong, L.; Xu, X.; Fu, Y.; Wei, F.H. Impact of environmental factors on snail distribution using geographical detector model. Prog. Geogr. 2014, 33, 625–635. (In Chinese) [Google Scholar] [CrossRef]
  40. Zhou, X.; Yang, G.; Sun, L.; Hong, Q.; Yang, K.; Wang, R.; Hua, Z. The potential impact of global warming on the spread of schistosomiasis. Chin. J. Epidemiol. 2002, 2, 8–11. (In Chinese) [Google Scholar]
  41. Xu, Z.; Wang, Y.; He, Z.; Cai, S.; Tu, Z.; Liu, J.; Zhu, H. Assessment on the outcomes of integrated schistosomiasis control measures implemented from 2009 to2013 in Gongan County, Hubei Province. J. Trop. Dis. Parasitol. 2015, 13, 26–29. (In Chinese) [Google Scholar]
  42. Hu, Y.; Xia, C.; Li, S.; Ward, M.P.; Luo, C.; Gao, F.; Wang, Q.; Zhang, S.; Zhang, Z. Assessing environmental factors associated with regional schistosomiasis prevalence in Anhui Province, Peoples’ Republic of China using a geographical detector method. Infect. Dis. Poverty 2017, 6, 87. [Google Scholar] [CrossRef] [PubMed]
Figure 1. Locations of study area and sample villages.
Ijerph 15 01481 g001
Figure 2. Spatial clusters detected by utilizing the discrete Poisson model from 2007 to 2012 in Jianghan Plain.
Ijerph 15 01481 g002
Figure 3. Space–time clusters detected using the Space–Time Permutation model.
Ijerph 15 01481 g003
Figure 4. Statistical significance of q-value between different risk factors. Average NDVI, average normalized different vegetation index; DER, distance from the endemic villages to the river; average LSTD, average land surface temperature at daytime; average LSTN, average land surface temperature at night; average TDN, average day and night temperatures. 1 indicates significant differences between the two risk factors, with 95% confidence.
Ijerph 15 01481 g004
Figure 5. Results of analysis of the interaction detectors. Average NDVI, average normalized different vegetation index; DER, distance from the endemic villages to the river; average LSTD, average land surface temperature at daytime; average LSTN, average land surface temperature at night; average TDN, average day and night temperatures.
Ijerph 15 01481 g005aIjerph 15 01481 g005bIjerph 15 01481 g005c
Figure 6. Disease transmission and life cycle of schistosomiasis.
Ijerph 15 01481 g006
Table 1. Spatial analysis scanning for clusters with large populations of schistosomiasis infections using Kulldorff’s spatial scan statistic.
YearNumber of ClustersMost Likely Cluster
Number of VillagesLatitudeLongitudeRadius (km)LLRRRp-Value
200710925930.201112.57522.76010,609.1162.4480
200874113529.834112.45062.66612,127.6372.1180
20098899629.840112.42459.2898431.5891.9790
201070110629.846112.49460.75410,308.4592.2610
201168114729.697112.53972.1558138.4242.1120
201242114729.697112.53972.1557303.1152.1740
LLR, log likelihood ratio; RR, relative risk.
Table 2. Space–time analysis of clusters with large populations of schistosomiasis infections using Kulldorff’s spatial scan statistic.
ClusterNumber of ClustersNumber of VillagesLatitudeLongitudeRadius (km)TimeLLRp-Value
Most likely cluster1101430.755112.97087.93820071404.2030
Secondary likely clusters211630.290111.74130.5832007439.2650
350029.689112.27447.5962010–2012395.7530
42330.052113.8858.5452010–2011153.5460
5430.110113.7235.146200982.6780
LLR, log likelihood ratio.
Table 3. Results of factor detector analysis.
YearLand Use (%)Soil Type (%)Average NDVI (%)Silt (%)Sand (%)Clay (%)DER (%)Average LSTD (%)Average LSTN (%)Average TDN (%)
20073.371.93 *0.710.951.001.040.08 *0.34 *5.485.71
20084.692.460.25 *0.15 *1.381.080.510.631.611.59
20095.54.260.760.26 *2.152.080.582.152.860.46 *
20105.134.060.810.25 *2.441.840.584.5610.531.81
20114.053.090.34 *0.16 *2.641.810.342.982.663.83
20124.282.670.430.57 *2.192.100.06 *0.766.504.01
Average NDVI, average normalized different vegetation index; DER, distance from the endemic village to the river; average LSTD, average land surface temperature at daytime; average LSTN, average land surface temperature at night; average TDN, average day and night temperature; * denotes p-value > 0.05.

