A Multilevel Analysis of Perceived Noise Pollution, Geographic Contexts and Mental Health in Beijing


Abstract
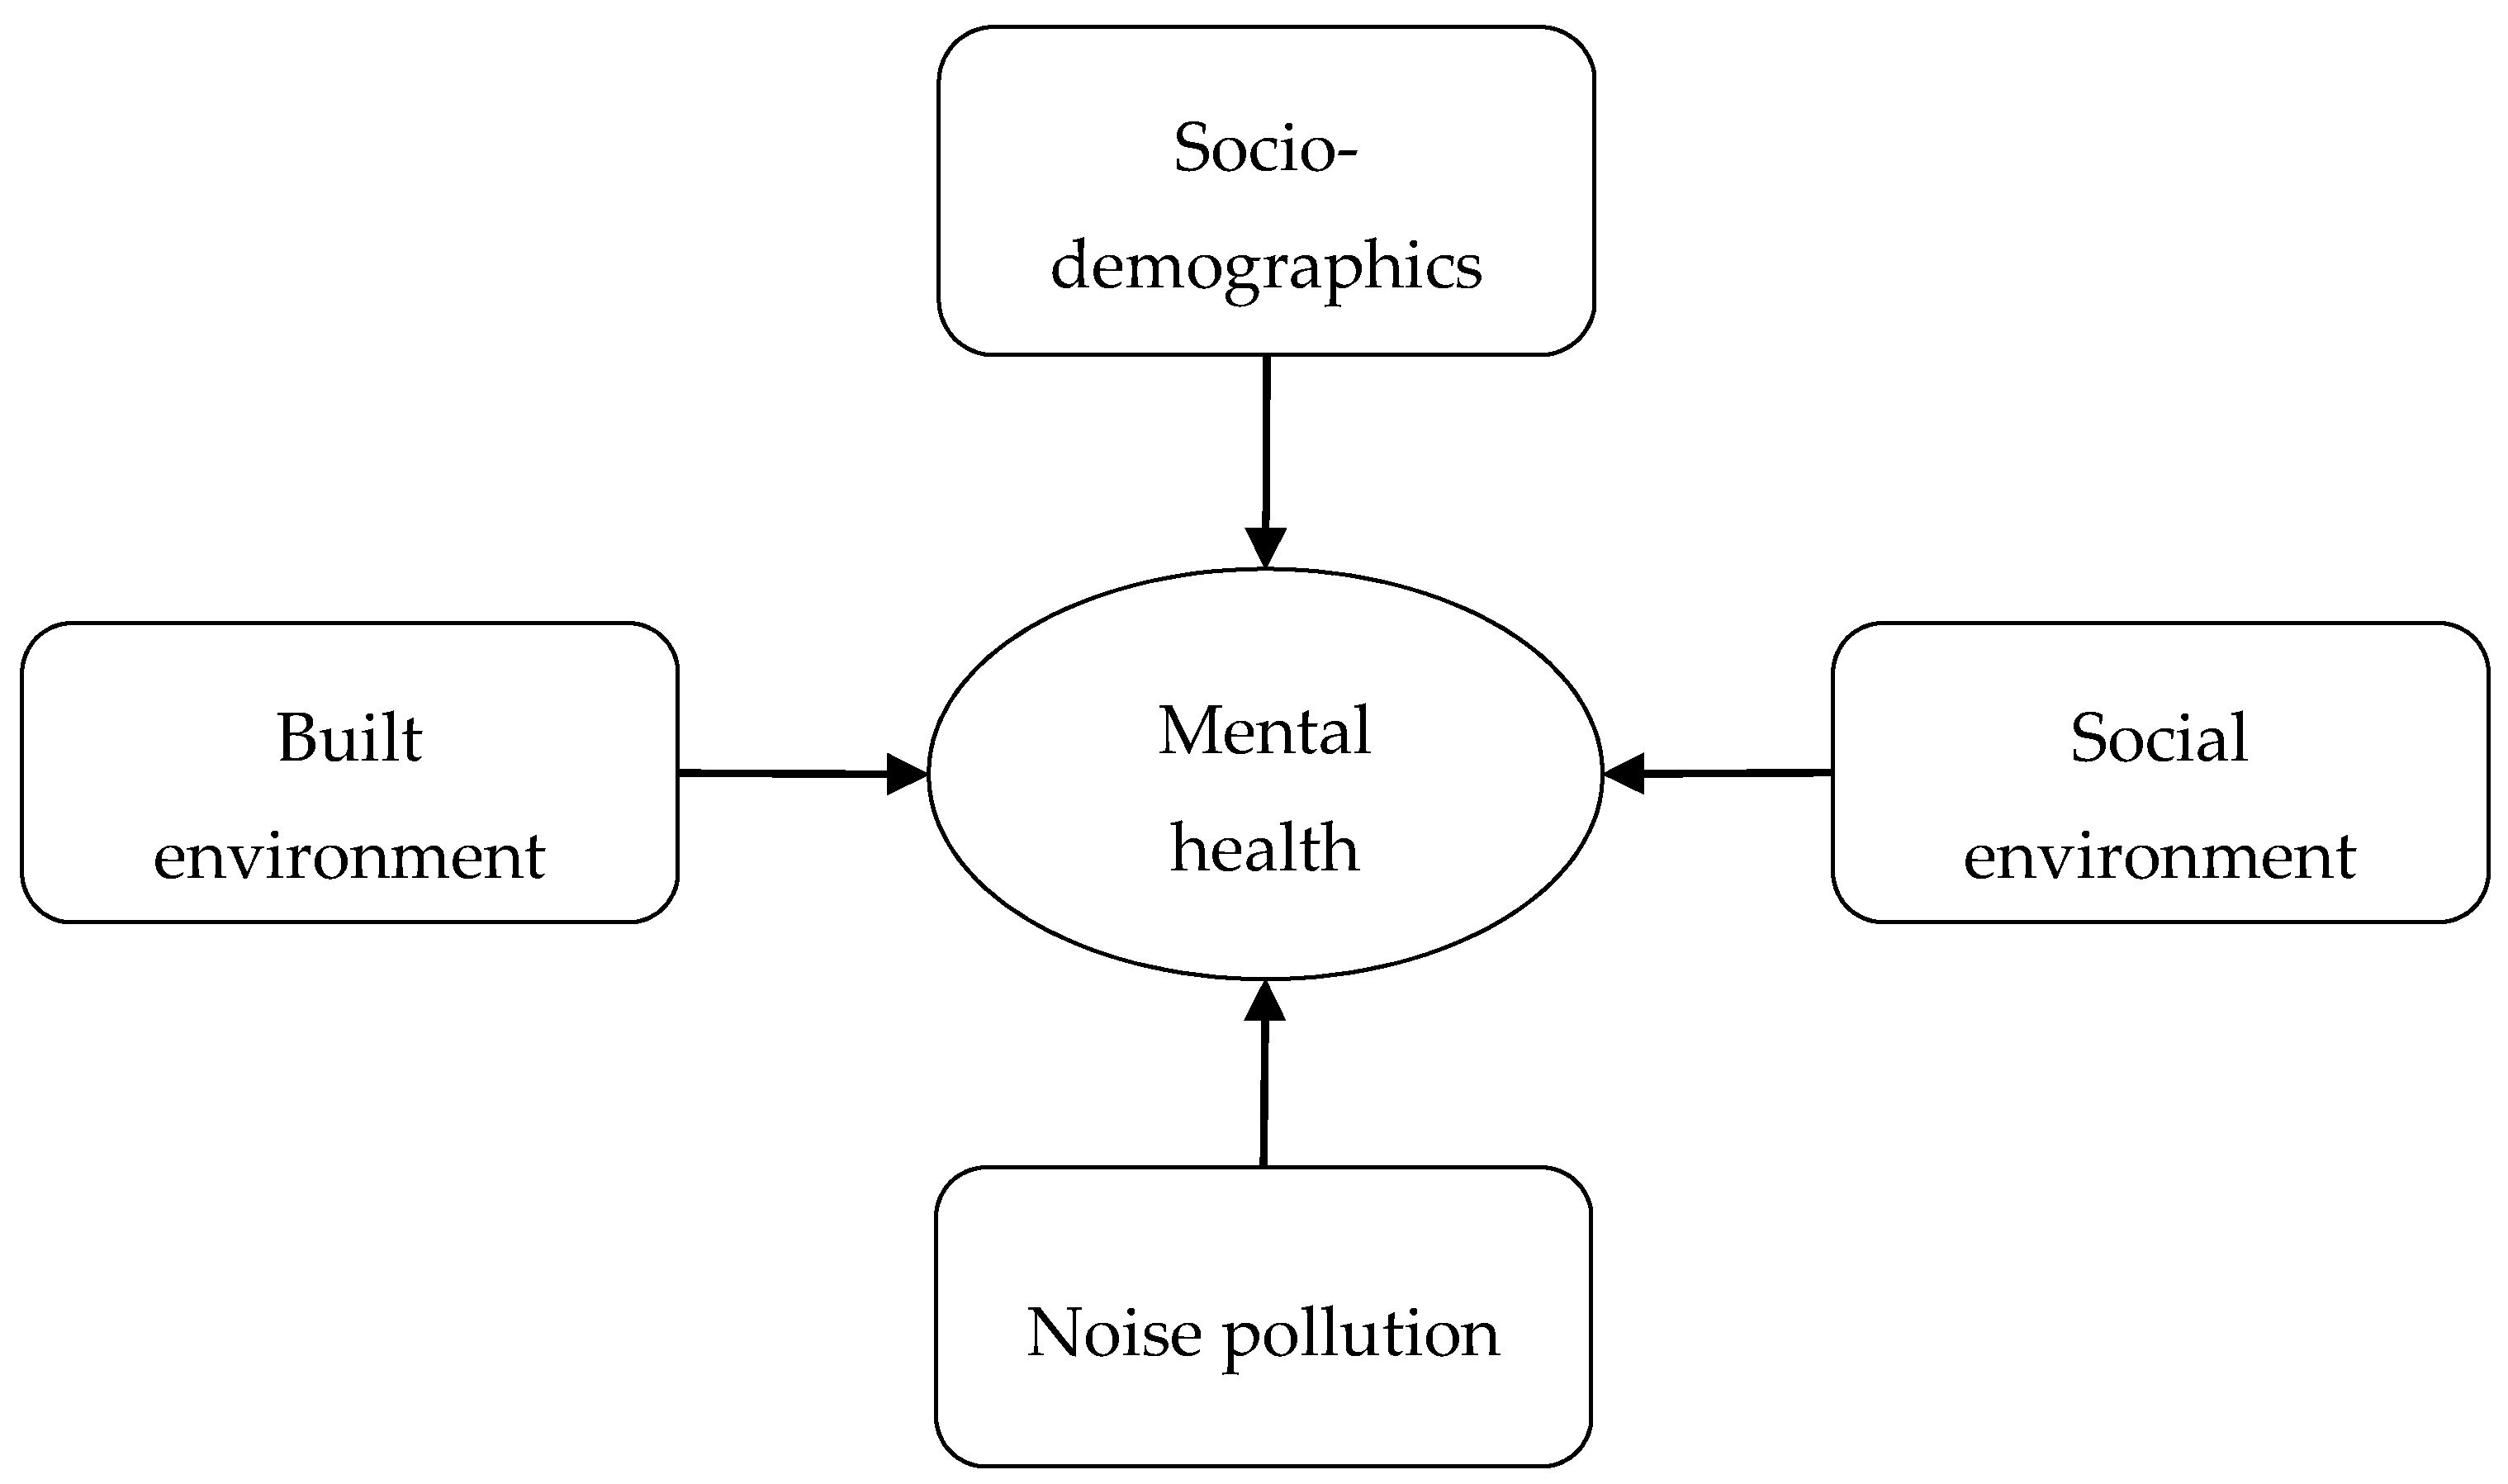
1. Introduction
2. Data and Variables
2.1. Data Sources
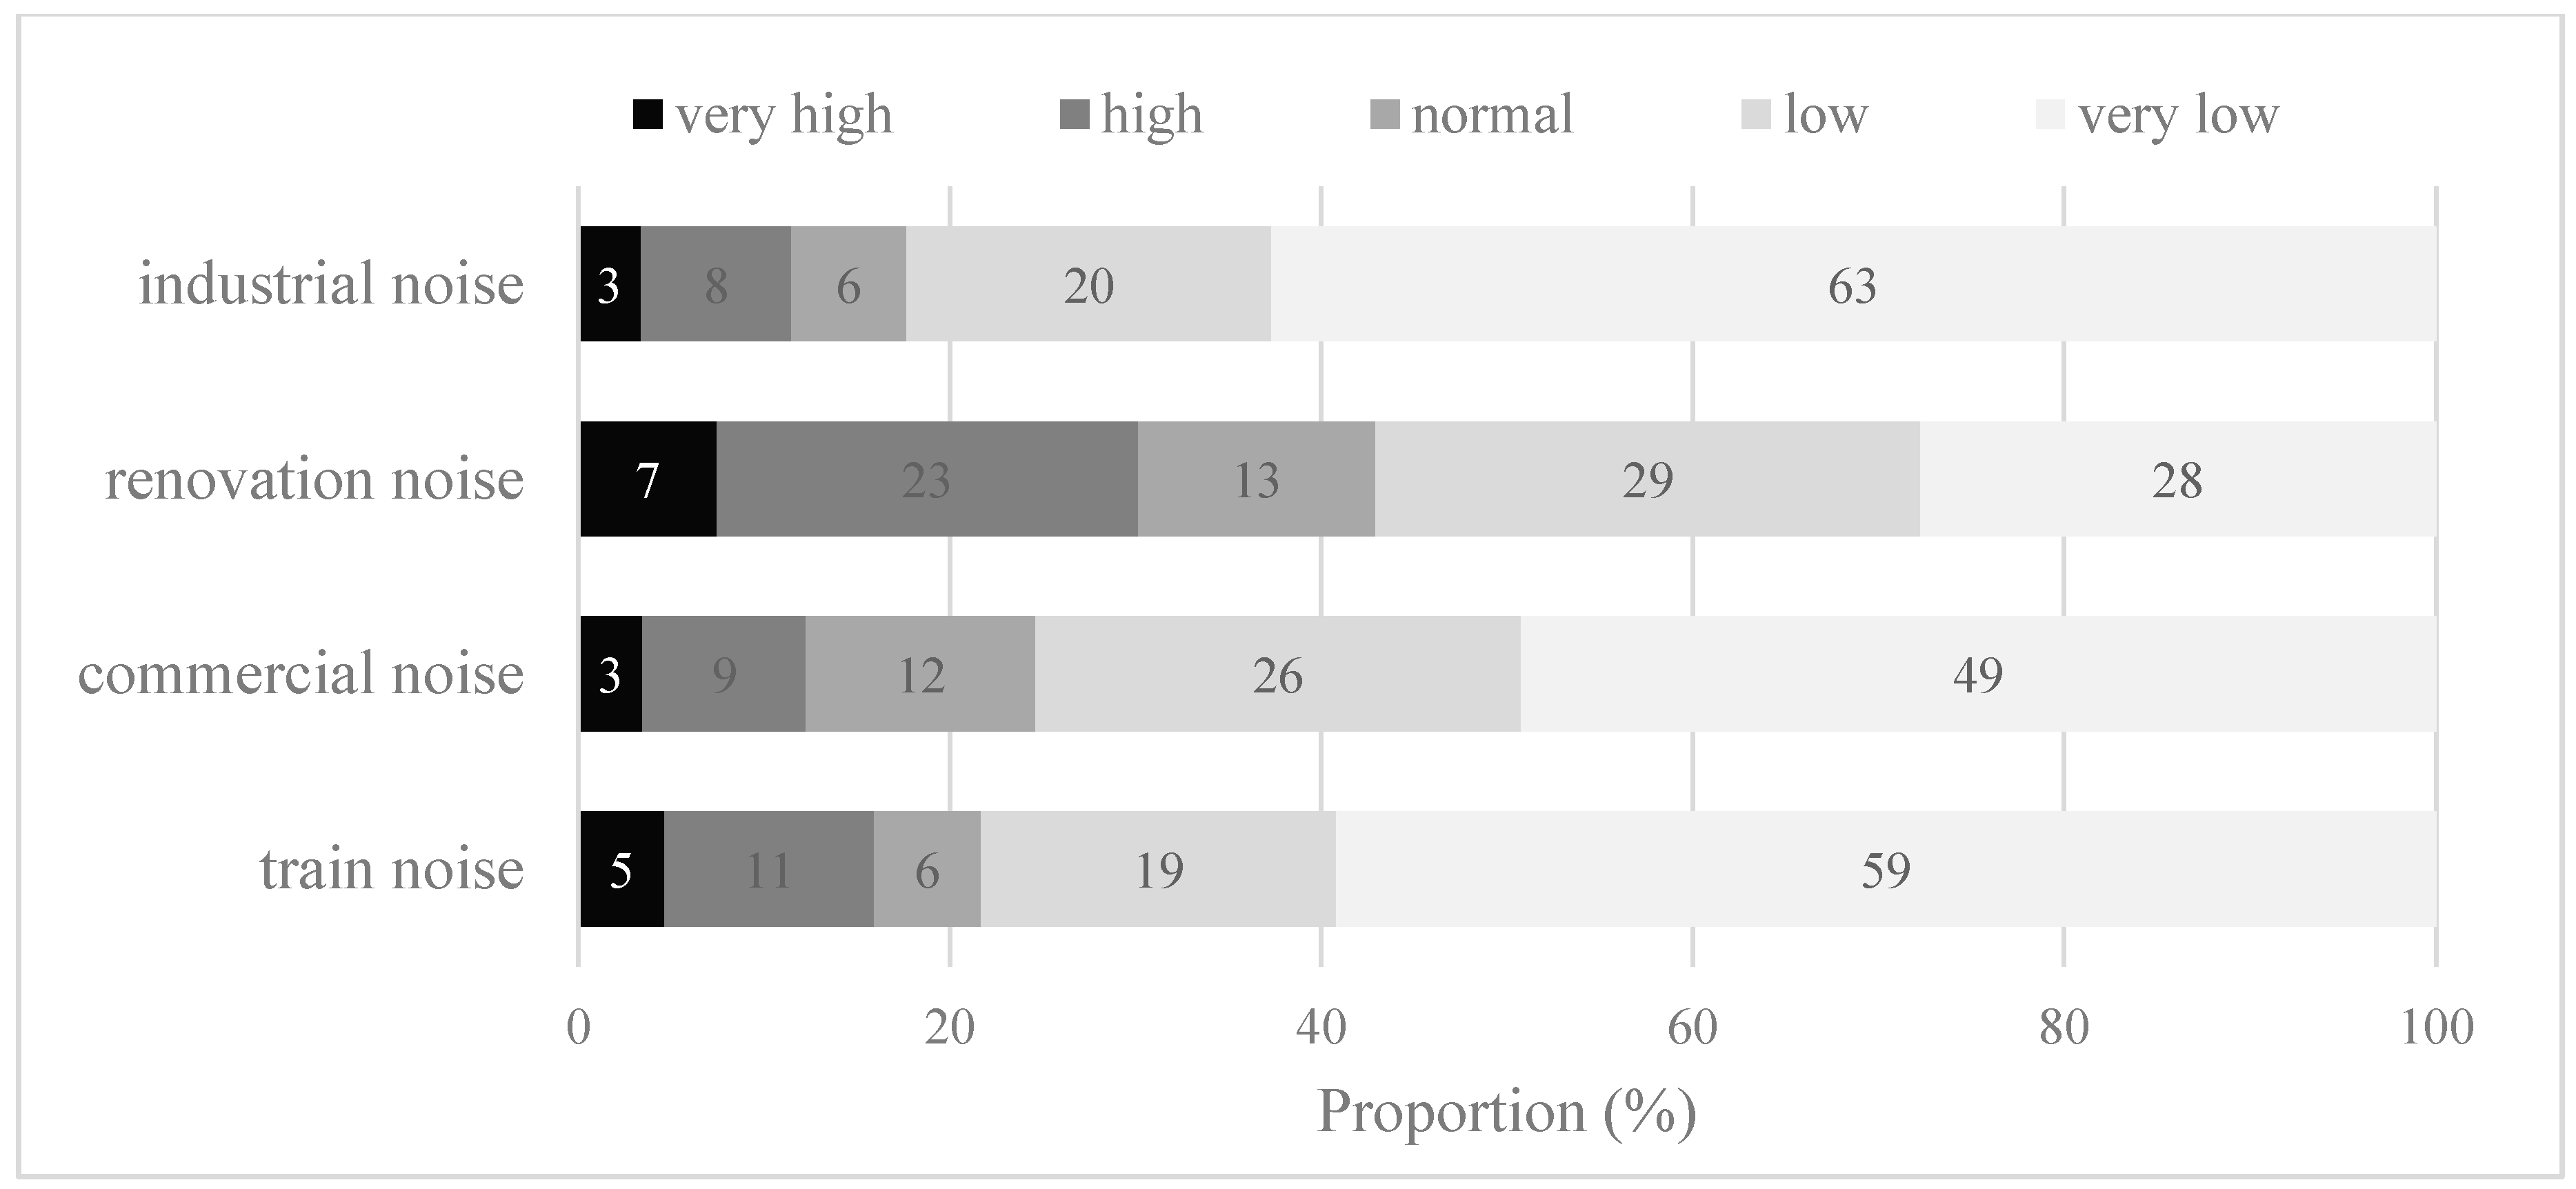
2.2. Measuring Noise Pollution
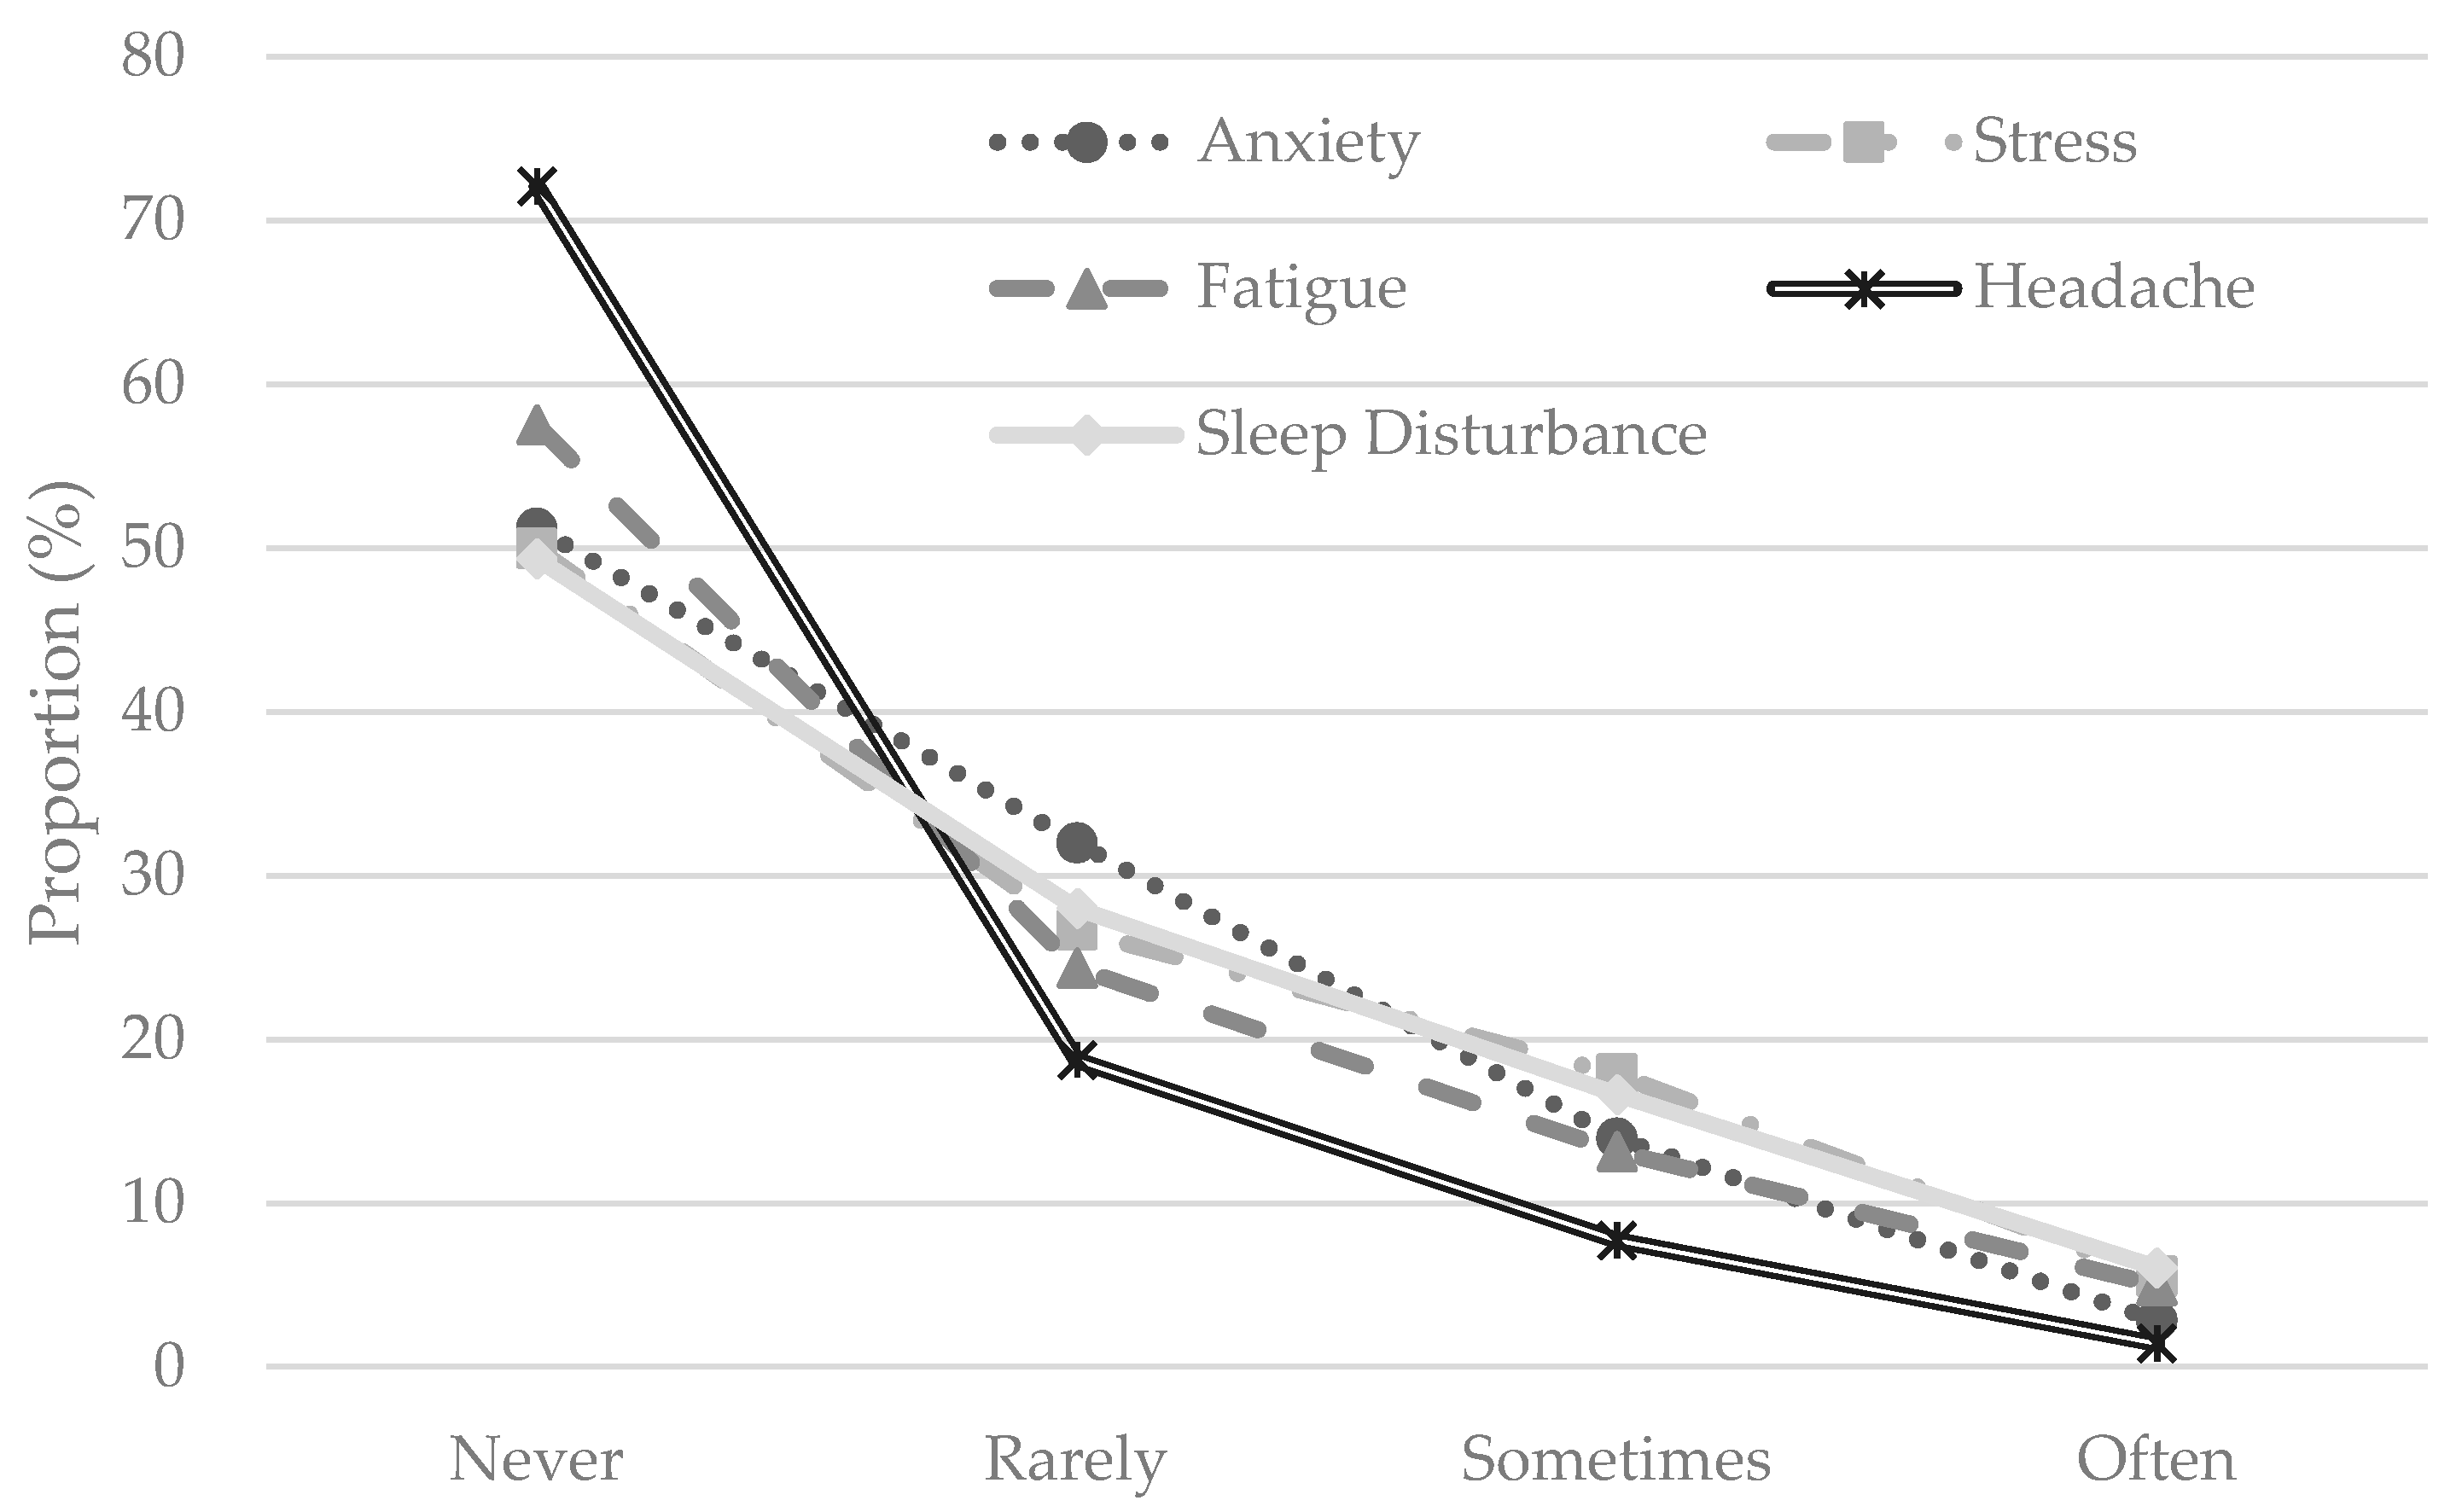
2.3. Measuring the Outcome Variables of Mental Health
2.4. Statistical Model
3. Results
3.1. Mental Disorders and Socio-Demographics
3.2. Mental Disorders and Noise Pollution
3.3. Mental Disorders and Geographic Context
4. Discussion
5. Conclusions
Author Contributions
Funding
Acknowledgments
Statement
Conflicts of Interest
References
- Giles-Corti, B.; Vernez-Moudon, A.; Reis, R.; Turrell, G.; Dannenberg, A.L.; Badland, H.; Foster, S.; Lowe, M.; Sallis, J.F.; Stevenson, M.; et al. City planning and population health: A global challenge. Lancet 2016, 388, 2912–2924. [Google Scholar] [CrossRef]
- Organization, W.H. Burden of disease from environmental noise: Quantification of healthy life years lost in Europe. In Burden of Disease from Environmental Noise: Quantification of Healthy Life Years Lost in Europe; World Health Organization: Geneva, Switzerland, 2011; p. 126. [Google Scholar]
- Pirrera, S.; De Valck, E.; Cluydts, R. Nocturnal road traffic noise: A review on its assessment and consequences on sleep and health. Environ. Int. 2010, 36, 492–498. [Google Scholar] [CrossRef] [PubMed]
- Zheng, D.; Cai, X.; Song, H.; Chen, T. Study on personal noise exposure in China. Appl. Acoust. 1996, 48, 59–70. [Google Scholar] [CrossRef]
- Xiao, J.; Li, X.; Zhang, Z. Daly-based health risk assessment of construction noise in Beijing, China. Int. J. Environ. Res. Public Health 2016, 13, 1045. [Google Scholar] [CrossRef] [PubMed]
- Li, B.; Tao, S.; Dawson, R. Evaluation and analysis of traffic noise from the main urban roads in Beijing. Appl. Acoust. 2002, 63, 1137–1142. [Google Scholar] [CrossRef]
- Li, B.; Tao, S. Influence of expanding ring roads on traffic noise in Beijing city. Appl. Acoust. 2004, 65, 243–249. [Google Scholar] [CrossRef]
- Ministry of Environment Protection of China. 2016 Report on the State of the Environment in China. Available online: http://english.sepa.gov.cn/Resources/Reports/soe/ReportSOE/201709/P020170929573904364594.pdf (accessed on 10 June 2018).
- Guoqing, D.; Xiaoyi, L.; Xiang, S.; Zhengguang, L.; Qili, L. Investigation of the relationship between aircraft noise and community annoyance in China. Noise Health 2012, 14, 52. [Google Scholar] [CrossRef] [PubMed]
- Di, G.; Liu, X.; Lin, Q.; Zheng, Y.; He, L. The relationship between urban combined traffic noise and annoyance: An investigation in Dalian, north of China. Sci. Total Environ. 2012, 432, 189–194. [Google Scholar] [CrossRef] [PubMed]
- Li, H.-J.; Yu, W.-B.; Lu, J.-Q.; Zeng, L.; Li, N.; Zhao, Y.-M. Investigation of road-traffic noise and annoyance in Beijing: A cross-sectional study of 4th ring road. Arch. Environ. Occup. Health 2008, 63, 27–33. [Google Scholar] [CrossRef] [PubMed]
- Basner, M.; Babisch, W.; Davis, A.; Brink, M.; Clark, C.; Janssen, S.; Stansfeld, S. Auditory and non-auditory effects of noise on health. Lancet 2014, 383, 1325–1332. [Google Scholar] [CrossRef]
- Guski, R.; Schreckenberg, D.; Schuemer, R. Who environmental noise guidelines for the European region: A systematic review on environmental noise and annoyance. Int. J. Environ. Res. Public Health 2017, 14, 1539. [Google Scholar] [CrossRef] [PubMed]
- Kempen, E.V.; Casas, M.; Pershagen, G.; Foraster, M. Who environmental noise guidelines for the European region: A systematic review on environmental noise and cardiovascular and metabolic effects: A summary. Int. J. Environ. Res. Public Health 2018, 15, 379. [Google Scholar] [CrossRef] [PubMed]
- Basner, M.; McGuire, S. Who environmental noise guidelines for the European region: A systematic review on environmental noise and effects on sleep. Int. J. Environ. Res. Public Health 2018, 15, 519. [Google Scholar] [CrossRef] [PubMed]
- Śliwińska-Kowalska, M.; Zaborowski, K. Who environmental noise guidelines for the European region: A systematic review on environmental noise and permanent hearing loss and tinnitus. Int. J. Environ. Res. Public Health 2017, 14, 1139. [Google Scholar] [CrossRef] [PubMed]
- Nieuwenhuijsen, M.J.; Ristovska, G.; Dadvand, P. Who environmental noise guidelines for the European region: A systematic review on environmental noise and adverse birth outcomes. Int. J. Environ. Res. Public Health 2017, 14, 1252. [Google Scholar] [CrossRef] [PubMed]
- Clark, C.; Paunovic, K. Who environmental noise guidelines for the European region: A systematic review on environmental noise and cognition. Int. J. Environ. Res. Public Health 2018, 15, 285. [Google Scholar] [CrossRef] [PubMed]
- Davies, H.; Van Kamp, I. Noise and cardiovascular disease: A review of the literature 2008–2011. Noise Health 2012, 14, 287. [Google Scholar] [CrossRef] [PubMed]
- McLean, E.; Tarnopolsky, A. Noise, discomfort and mental health: A review of the socio-medical implications of disturbance by noise. Psychol. Med. 1977, 7, 19–62. [Google Scholar] [CrossRef] [PubMed]
- Stansfeld, S.; Haines, M.; Burr, M.; Berry, B.; Lercher, P. A review of environmental noise and mental health. Noise Health 2000, 2, 1. [Google Scholar] [PubMed]
- Clark, C.; Myron, R.; Stansfeld, S.; Candy, B. A systematic review of the evidence on the effect of the built and physical environment on mental health. J. Public Ment. Health 2007, 6, 14–27. [Google Scholar] [CrossRef]
- Van Kamp, I.; Davies, H. Environmental noise and mental health: Five year review and future directions. In Proceedings of the 9th International Congress on Noise as a Public Health Problem, Mashantucket, CT, USA, 21–25 July 2008. [Google Scholar]
- Gu, L.; Xie, J.; Long, J.; Chen, Q.; Chen, Q.; Pan, R.; Yan, Y.; Wu, G.; Liang, B.; Tan, J. Epidemiology of major depressive disorder in mainland China: A systematic review. PLoS ONE 2013, 8, e65356. [Google Scholar] [CrossRef] [PubMed]
- Organization, W.H. The World Health Report 2001: Mental Health: New Understanding, New Hope; World Health Organization: Geneva, Switzerland, 2001. [Google Scholar]
- Yang, G.; Wang, Y.; Zeng, Y.; Gao, G.F.; Liang, X.; Zhou, M.; Wan, X.; Yu, S.; Jiang, Y.; Naghavi, M. Rapid health transition in China, 1990–2010: Findings from the global burden of disease study 2010. Lancet 2013, 381, 1987–2015. [Google Scholar] [CrossRef]
- Münzel, T.; Gori, T.; Babisch, W.; Basner, M. Cardiovascular effects of environmental noise exposure. Eur. Heart J. 2014, 35, 829–836. [Google Scholar] [CrossRef] [PubMed]
- Beutel, M.E.; Junger, C.; Klein, E.M.; Wild, P.; Lackner, K.; Blettner, M.; Binder, H.; Michal, M.; Wiltink, J.; Brahler, E.; et al. Noise annoyance is associated with depression and anxiety in the general population- the contribution of aircraft noise. PLoS ONE 2016, 11, e0155357. [Google Scholar] [CrossRef] [PubMed]
- Schreckenberg, D.; Meis, M.; Kahl, C.; Peschel, C.; Eikmann, T. Aircraft noise and quality of life around Frankfurt airport. Int. J. Environ. Res. Public Health 2010, 7, 3382–3405. [Google Scholar] [CrossRef] [PubMed]
- Schreckenberg, D.; Griefahn, B.; Meis, M. The associations between noise sensitivity, reported physical and mental health, perceived environmental quality, and noise annoyance. Noise Health 2010, 12, 7. [Google Scholar] [CrossRef] [PubMed]
- Oiamo, T.H.; Luginaah, I.N.; Baxter, J. Cumulative effects of noise and odour annoyances on environmental and health related quality of life. Soc. Sci. Med. 2015, 146, 191–203. [Google Scholar] [CrossRef] [PubMed]
- Sygna, K.; Aasvang, G.M.; Aamodt, G.; Oftedal, B.; Krog, N.H. Road traffic noise, sleep and mental health. Environ. Res. 2014, 131, 17–24. [Google Scholar] [CrossRef] [PubMed]
- Dzhambov, A.; Tilov, B.; Markevych, I.; Dimitrova, D. Residential road traffic noise and general mental health in youth: The role of noise annoyance, neighborhood restorative quality, physical activity, and social cohesion as potential mediators. Environ. Int. 2017, 109, 1–9. [Google Scholar] [CrossRef] [PubMed]
- Lercher, P.; Brink, M.; Rudisser, J.; Van Renterghem, T.; Botteldooren, D.; Baulac, M.; Defrance, J. The effects of railway noise on sleep medication intake: Results from the alpnap-study. Noise Health 2010, 12, 110. [Google Scholar] [CrossRef] [PubMed]
- Sørensen, M.; Hvidberg, M.; Hoffmann, B.; Andersen, Z.J.; Nordsborg, R.B.; Lillelund, K.G.; Jakobsen, J.; Tjønneland, A.; Overvad, K.; Raaschou-Nielsen, O. Exposure to road traffic and railway noise and associations with blood pressure and self-reported hypertension: A cohort study. Environ. Health 2011, 10, 92. [Google Scholar] [CrossRef] [PubMed]
- Bocquier, A.; Cortaredona, S.; Boutin, C.; David, A.; Bigot, A.; Sciortino, V.; Nauleau, S.; Gaudart, J.; Giorgi, R.; Verger, P. Is exposure to night-time traffic noise a risk factor for purchase of anxiolytic–hypnotic medication? A cohort study. Eur. J. Public Health 2013, 24, 298–303. [Google Scholar] [CrossRef] [PubMed]
- Evandt, J.; Oftedal, B.; Krog, N.H.; Skurtveit, S.; Nafstad, P.; Schwarze, P.E.; Skovlund, E.; Houthuijs, D.; Aasvang, G.M. Road traffic noise and registry based use of sleep medication. Environ. Health 2017, 16, 110. [Google Scholar] [CrossRef] [PubMed]
- Yoshida, T.; Osada, Y.; Kawaguchi, T.; Hoshiyama, Y.; Yoshida, K.; Yamamoto, K. Effects of road traffic noise on inhabitants of Tokyo. J. Sound Vib. 1997, 205, 517–522. [Google Scholar] [CrossRef]
- Lercher, P.; Kofler, W. Behavioral and health responses associated with road traffic noise exposure along alpine through-traffic routes. Sci. Total Environ. 1996, 189, 85–89. [Google Scholar] [CrossRef]
- Héritier, H.; Vienneau, D.; Frei, P.; Eze, I.C.; Brink, M.; Probst-Hensch, N.; Röösli, M. The association between road traffic noise exposure, annoyance and health-related quality of life (hrqol). Int. J. Environ. Res. Public Health 2014, 11, 12652–12667. [Google Scholar] [CrossRef] [PubMed]
- Öhrström, E.; Skånberg, A.; Svensson, H.; Gidlöf-Gunnarsson, A. Effects of road traffic noise and the benefit of access to quietness. J. Sound Vib. 2006, 295, 40–59. [Google Scholar] [CrossRef]
- Paunović, K.; Jakovljević, B.; Belojević, G. Predictors of noise annoyance in noisy and quiet urban streets. Sci. Total Environ. 2009, 407, 3707–3711. [Google Scholar] [CrossRef] [PubMed]
- Miedema, H.M.; Vos, H. Associations between self-reported sleep disturbance and environmental noise based on re-analyses of pooled data from 24 studies. Behav. Sleep Med. 2007, 5, 1–20. [Google Scholar] [CrossRef] [PubMed]
- Firdaus, G.; Ahmad, A. Temporal variation in risk factors and prevalence rate of depression in urban population: Does the urban environment play a significant role? Int. J. Ment. Health Promot. 2014, 16, 279–288. [Google Scholar] [CrossRef]
- Firdaus, G. Built environment and health outcomes: Identification of contextual risk factors for mental well-being of older adults. Ageing Int. 2017, 42, 62–77. [Google Scholar] [CrossRef]
- Welch, D.; Shepherd, D.; Dirks, K.N.; McBride, D.; Marsh, S. Road traffic noise and health-related quality of life: A cross-sectional study. Noise Health 2013, 15, 224. [Google Scholar] [CrossRef] [PubMed]
- Brink, M. Parameters of well-being and subjective health and their relationship with residential traffic noise exposure—A representative evaluation in Switzerland. Environ. Int. 2011, 37, 723–733. [Google Scholar] [CrossRef] [PubMed]
- Halonen, J.I.; Lanki, T.; Yli-Tuomi, T.; Turunen, A.W.; Peniti, J.; Kivimäki, M.; Vahtera, J. Associations of traffic noise with self-rated health and psychotropic medication use. Scand. J. Work Environ. Health 2014, 40, 235–243. [Google Scholar] [CrossRef] [PubMed]
- Persson, R.; Björk, J.; Ardö, J.; Albin, M.; Jakobsson, K. Trait anxiety and modeled exposure as determinants of self-reported annoyance to sound, air pollution and other environmental factors in the home. Int. Arch. Occup. Environ. Health 2007, 81, 179–191. [Google Scholar] [CrossRef] [PubMed]
- Roswall, N.; Høgh, V.; Envold-Bidstrup, P.; Raaschou-Nielsen, O.; Ketzel, M.; Overvad, K.; Olsen, A.; Sørensen, M. Residential exposure to traffic noise and health-related quality of life—A population-based study. PLoS ONE 2015, 10, e0120199. [Google Scholar] [CrossRef] [PubMed]
- Stansfeld, S.; Gallacher, J.; Babisch, W.; Shipley, M. Road traffic noise and psychiatric disorder: Prospective findings from the caerphilly study. BMJ 1996, 313, 266–267. [Google Scholar] [CrossRef] [PubMed]
- Lercher, P.; Evans, G.; Meis, M.; Kofler, W. Ambient neighbourhood noise and children’s mental health. Occup. Environ. Med. 2002, 59, 380–386. [Google Scholar] [CrossRef] [PubMed]
- Hjortebjerg, D.; Andersen, A.M.N.; Christensen, J.S.; Ketzel, M.; Raaschou-Nielsen, O.; Sunyer, J.; Julvez, J.; Forns, J.; Sørensen, M. Exposure to road traffic noise and behavioral problems in 7-year-old children: A cohort study. Environ. Health Perspect. 2016, 124, 228. [Google Scholar] [CrossRef] [PubMed]
- Dreger, S.; Meyer, N.; Fromme, H.; Bolte, G. Environmental noise and incident mental health problems: A prospective cohort study among school children in Germany. Environ. Res. 2015, 143, 49–54. [Google Scholar] [CrossRef] [PubMed]
- Clark, C.; Head, J.; Stansfeld, S.A. Longitudinal effects of aircraft noise exposure on children’s health and cognition: A six-year follow-up of the UK ranch cohort. J. Environ. Psychol. 2013, 35, 1–9. [Google Scholar] [CrossRef]
- Weich, S.; Blanchard, M.; Prince, M.; Burton, E.; Erens, B.; Sproston, K. Mental health and the built environment: Cross–sectional survey of individual and contextual risk factors for depression. Br. J. Psychiatry 2002, 180, 428–433. [Google Scholar] [CrossRef] [PubMed]
- Galea, S.; Ahern, J.; Rudenstine, S.; Wallace, Z.; Vlahov, D. Urban built environment and depression: A multilevel analysis. J. Epidemiol. Community Health 2005, 59, 822–827. [Google Scholar] [CrossRef] [PubMed]
- Melis, G.; Gelormino, E.; Marra, G.; Ferracin, E.; Costa, G. The effects of the urban built environment on mental health: A cohort study in a large northern Italian city. Int. J. Environ. Res. Public Health 2015, 12, 14898–14915. [Google Scholar] [CrossRef] [PubMed]
- Evans, G.W. The built environment and mental health. J. Urban Health 2003, 80, 536–555. [Google Scholar] [CrossRef] [PubMed]
- Araya, R.; Dunstan, F.; Playle, R.; Thomas, H.; Palmer, S.; Lewis, G. Perceptions of social capital and the built environment and mental health. Soc. Sci. Med. 2006, 62, 3072–3083. [Google Scholar] [CrossRef] [PubMed]
- Xiao, Y.; Miao, S.; Sarkar, C.; Geng, H.; Lu, Y. Exploring the impacts of housing condition on migrants’ mental health in nanxiang, shanghai: A structural equation modelling approach. Int. J. Environ. Res. Public Health 2018, 15, 225. [Google Scholar] [CrossRef] [PubMed]
- Kamimura, A.; Armenta, B.; Nourian, M.; Assasnik, N.; Nourian, K.; Chernenko, A. Perceived environmental pollution and its impact on health in China, Japan, and South Korea. J. Prev. Med. Public Health 2017, 50, 188. [Google Scholar] [CrossRef] [PubMed]
- Niemann, H.; Bonnefoy, X.; Braubach, M.; Hecht, K.; Maschke, C.; Rodrigues, C.; Robbel, N. Noise-induced annoyance and morbidity results from the pan-European lares study. Noise Health 2006, 8, 63. [Google Scholar] [CrossRef] [PubMed]
- Stansfeld, S.; Clark, C. Mental health effects of noise. Encycl. Environ. Health 2011, 20, 683–689. [Google Scholar]
- Mouratidis, K. Rethinking how built environments influence subjective well-being: A new conceptual framework. J. Urban. 2018, 11, 24–40. [Google Scholar] [CrossRef]
- Ma, J.; Mitchell, G.; Dong, G.; Zhang, W. Inequality in Beijing: A spatial multilevel analysis of perceived environmental hazard and self-rated health. Ann. Am. Assoc. Geogr. 2017, 107, 109–129. [Google Scholar] [CrossRef]
- Ma, J.; Heppenstall, A.; Harland, K.; Mitchell, G. Synthesising carbon emission for mega-cities: A static spatial microsimulation of transport CO2 from urban travel in Beijing. Comput. Environ. Urban Syst. 2014, 45, 78–88. [Google Scholar] [CrossRef]
- Congdon, P. Applied Bayesian Modelling; John Wiley & Sons: Hoboken, NJ, USA, 2014; Volume 595. [Google Scholar]
- Gelman, A.; Carlin, J.B.; Stern, H.S.; Dunson, D.B.; Vehtari, A.; Rubin, D.B. Bayesian Data Analysis; CRC Press: Boca Raton, FL, USA, 2014; Volume 2. [Google Scholar]
- Steele, F. Multilevel models for longitudinal data. J. R. Stat. Soc. Ser. A Stat. Soc. 2008, 171, 5–19. [Google Scholar] [CrossRef]
- Goldstein, H. Multilevel Statistical Models; John Wiley & Sons: Hoboken, NJ, USA, 2011; Volume 922. [Google Scholar]
- Rue, H.; Martino, S.; Lindgren, F.; Simpson, D.; Riebler, A.; Krainski, E. INLA: Functions Which Allow to Perform a Full Bayesian Analysis of Structured Additive Models Using Integrated Nested Laplace Approximation. 2014. Available online: http://www.r-inla.org/ (accessed on 10 June 2018).
- Merlo, J.; Chaix, B.; Ohlsson, H.; Beckman, A.; Johnell, K.; Hjerpe, P.; Råstam, L.; Larsen, K. A brief conceptual tutorial of multilevel analysis in social epidemiology: Using measures of clustering in multilevel logistic regression to investigate contextual phenomena. J. Epidemiol. Community Health 2006, 60, 290–297. [Google Scholar] [CrossRef] [PubMed]
- Zhao, P.; Kwan, M.-P.; Zhou, S. The uncertain geographic context problem in the analysis of the relationships between obesity and the built environment in Guangzhou. Int. J. Environ. Res. Public Health 2018, 15, 308. [Google Scholar] [CrossRef] [PubMed]
- Subramanian, S.V.; Kawachi, I. Income inequality and health: What have we learned so far? Epidemiol. Rev. 2004, 26, 78–91. [Google Scholar] [CrossRef] [PubMed]
- Cesaroni, G.; Badaloni, C.; Romano, V.; Donato, E.; Perucci, C.A.; Forastiere, F. Socioeconomic position and health status of people who live near busy roads: The Rome Longitudinal Study (RoLS). Environ. Health 2010, 9, 41. [Google Scholar] [CrossRef] [PubMed]
- Tonne, C.; Milà, C.; Fecht, D.; Alvarez, M.; Gulliver, J.; Smith, J.; Beevers, S.; Anderson, H.R.; Kelly, F. Socioeconomic and ethnic inequalities in exposure to air and noise pollution in London. Environ. Int. 2018, 115, 170–179. [Google Scholar] [CrossRef] [PubMed]


| Variables | Description | Proportion (%) |
|---|---|---|
| Gender | Female as the base category | 50.0 |
| Age | <30 | 11.5 |
| 30–39 | 26.9 | |
| 40–49 | 18.5 | |
| 50–59 | 20.9 | |
| 60+ | 22.3 | |
| Monthly income (RMB) | <3000 | 7.9 |
| 3000–6000 | 18.8 | |
| 6000–10,000 | 35.7 | |
| 10,000–15,000 | 14.8 | |
| 15,000+ | 22.7 | |
| Education | Primary | 16.9 |
| Secondary | 29.9 | |
| Tertiary | 53.2 | |
| Marital status | Married | 84.6 |
| Residence status | Migrants | 28.2 |
| Housing tenure | Owners | 74.3 |
| Employment | Employed | 61.0 |
| Housing satisfaction | Satisfied or very satisfied with housing | 72.7 |
| Community traffic congestion | Perceived serious or very serious traffic congestion around the community | 74.7 |
| Community attachment | Have feelings of community attachment | 63.4 |
| Surveyed Communities | Distance to the Nearest Point of Interest (m) | |||
|---|---|---|---|---|
| Main Road | Park | Subway Station | Restaurant | |
| Jin Yu Chi (JYC) | 86.8 | 306.2 | 479.9 | 104.9 |
| Xi Yuan Zi (XYZ) | 120.8 | 378.5 | 462.6 | 77.3 |
| Liang Jia Yuan (LJY) | 167.4 | 1546.3 | 367.1 | 169.9 |
| Xiang Lu Ying (XLY) | 189.7 | 1623.0 | 325.7 | 152.7 |
| Sheng Gu Zhuang (SGZ) | 221.4 | 485.4 | 416.6 | 165.2 |
| Ping Le Yuan (PLY) | 374.2 | 86.7 | 708.4 | 93.1 |
| Bai Zi Wan (BZW) | 728.2 | 2185.3 | 936.1 | 7.5 |
| Guan Dong Dian (GDD) | 72.5 | 425.4 | 199.2 | 57.0 |
| Gan Lu Yuan (GLY) | 50.4 | 306.1 | 735.4 | 21.4 |
| Jia Ming Yuan (JMY) | 461.2 | 499.2 | 157.7 | 94.3 |
| Mei He Yuan (MHY) | 83.8 | 303.1 | 259.3 | 168.6 |
| Zhu Fang (ZF) | 257.4 | 665.8 | 819.1 | 18.0 |
| Hua Yuan Lou (HYL) | 441.9 | 769.3 | 1710.4 | 236.4 |
| Xue Fu Shu (XFS) | 63.7 | 605.2 | 951.2 | 146.4 |
| Pu Hui Nan (PHN) | 234.5 | 179.5 | 555.9 | 45.0 |
| Pu Hui Si (PHS) | 317.7 | 296.4 | 596.7 | 52.2 |
| Jing Xi Bin Guan (JXBG) | 86.9 | 614.7 | 499.9 | 98.2 |
| Yun Yun Guo Ji (YYGJ) | 348.1 | 770.9 | 1161.8 | 108.9 |
| Xiao Yue Yuan (XYY) | 796.8 | 1319.3 | 1237.8 | 297.4 |
| Fei Cheng (FC) | 220.0 | 502.1 | 1430.5 | 221.0 |
| Sen Lin Da Di (SLDD) | 151.0 | 1255.4 | 2320.3 | 267.4 |
| Du Shi Fang Yuan (DSFY) | 1918.4 | 1625.1 | 1847.8 | 416.6 |
| Lv Zhou Jia Yuan (LZJY) | 1885.5 | 771.9 | 1781.1 | 49.5 |
| Hong Xing Lou (HXL) | 69.5 | 853.7 | 2766.0 | 29.6 |
| Qing Xin Yuan (QXY) | 163.0 | 529.4 | 1749.7 | 58.9 |
| Run Xing Jia Yuan (RXJY) | 1216.6 | 297.2 | 1790.1 | 291.6 |
| Variables | Anxiety | Stress | Fatigue | Headache | Sleep Disturbance | |||||
|---|---|---|---|---|---|---|---|---|---|---|
| OR | 95% CI | OR | 95% CI | OR | 95% CI | OR | 95% CI | OR | 95% CI | |
| Gender | ||||||||||
| Female | 1.000 | reference | 1.000 | reference | 1.000 | reference | 1.000 | reference | 1.000 | reference |
| Male | 0.919 | 0.706–1.196 | 0.993 | 0.761–1.295 | 0.840 | 0.648–1.090 | 0.888 | 0.667–1.181 | 0.839 | 0.649–1.084 |
| Age | ||||||||||
| <30 | 1.000 | reference | 1.000 | reference | 1.000 | reference | 1.000 | reference | 1.000 | reference |
| 30–39 | 1.208 | 0.715–2.045 | 1.028 | 0.605–1.739 | 1.433 | 0.848–2.443 | 1.303 | 0.704–2.471 | 1.804 | 1.077–3.053 |
| 40–49 | 2.320 | 1.307–4.138 | 1.796 | 1.008–3.203 | 2.512 | 1.424–4.481 | 2.689 | 1.422–5.231 | 2.843 | 1.628–5.019 |
| 50–59 | 1.376 | 0.745–2.546 | 1.069 | 0.577–1.980 | 2.505 | 1.362–4.656 | 2.248 | 1.134–4.558 | 3.585 | 1.964–6.625 |
| 60+ | 1.170 | 0.604–2.266 | 0.806 | 0.413–1.568 | 2.759 | 1.427–5.394 | 3.266 | 1.573–6.951 | 3.127 | 1.631–6.061 |
| Income (RMB) | ||||||||||
| <3000 | 1.069 | 0.632–1.803 | 1.350 | 0.795–2.293 | 0.837 | 0.492–1.410 | 1.557 | 0.908–2.646 | 1.221 | 0.734–2.040 |
| 3000–6000 | 0.836 | 0.573–1.217 | 0.875 | 0.598–1.276 | 0.912 | 0.626–1.322 | 1.391 | 0.935–2.064 | 0.949 | 0.660–1.360 |
| 6000–10,000 | 1.000 | reference | 1.000 | reference | 1.000 | reference | 1.000 | reference | 1.000 | reference |
| 10,000–15,000 | 1.772 | 1.181–2.669 | 1.885 | 1.252–2.853 | 1.469 | 0.986–2.188 | 1.092 | 0.686–1.716 | 1.351 | 0.912–2.004 |
| 15,000+ | 1.456 | 1.011–2.101 | 1.388 | 0.962–2.006 | 1.740 | 1.214–2.499 | 1.332 | 0.889–1.989 | 1.668 | 1.171–2.382 |
| Education | ||||||||||
| Primary | 1.000 | reference | 1.000 | reference | 1.000 | reference | 1.000 | reference | 1.000 | reference |
| Secondary | 0.683 | 0.452–1.030 | 0.506 | 0.331–0.768 | 0.865 | 0.578–1.296 | 0.808 | 0.531–1.231 | 0.746 | 0.500–1.109 |
| Tertiary | 1.051 | 0.669–1.652 | 0.957 | 0.606–1.507 | 0.981 | 0.629–1.533 | 0.870 | 0.544–1.393 | 0.790 | 0.510–1.223 |
| Employment status | ||||||||||
| Unemployed | 1.000 | reference | 1.000 | reference | 1.000 | reference | 1.000 | reference | 1.000 | reference |
| Employed | 1.003 | 0.671–1.497 | 1.724 | 1.157–2.573 | 1.279 | 0.862–1.907 | 1.053 | 0.687–1.620 | 1.028 | 0.696–1.521 |
| Marital status | ||||||||||
| Unmarried | 1.000 | reference | 1.000 | reference | 1.000 | reference | 1.000 | reference | 1.000 | reference |
| Married | 0.778 | 0.499–1.208 | 0.788 | 0.503–1.231 | 0.818 | 0.528–1.266 | 0.915 | 0.569–1.486 | 0.715 | 0.463–1.098 |
| Residence status | ||||||||||
| Migrants | 1.000 | reference | 1.000 | reference | 1.000 | reference | 1.000 | reference | 1.000 | reference |
| Local residents | 0.970 | 0.682–1.378 | 0.819 | 0.574–1.164 | 1.086 | 0.770–1.531 | 0.914 | 0.628–1.331 | 0.733 | 0.519–1.028 |
| Housing tenure | ||||||||||
| Renters | 1.000 | reference | 1.000 | reference | 1.000 | reference | 1.000 | reference | 1.000 | reference |
| Housing owners | 1.454 | 1.011–2.101 | 1.294 | 0.898–1.873 | 1.215 | 0.853–1.740 | 1.249 | 0.848–1.867 | 1.737 | 1.231–2.471 |
| Perceived community traffic congestion | ||||||||||
| Not serious | 1.000 | reference | 1.000 | reference | 1.000 | reference | 1.000 | reference | 1.000 | reference |
| Serious | 0.953 | 0.715–1.269 | 0.818 | 0.612–1.091 | 0.843 | 0.634–1.120 | 0.765 | 0.558–1.046 | 1.038 | 0.790–1.362 |
| Housing satisfaction | ||||||||||
| Unsatisfied | 1.000 | reference | 1.000 | reference | 1.000 | reference | 1.000 | reference | 1.000 | reference |
| Satisfied | 0.947 | 0.687–1.308 | 0.699 | 0.505–0.966 | 0.872 | 0.640–1.190 | 0.778 | 0.563–1.080 | 0.937 | 0.693–1.270 |
| Community attachment | ||||||||||
| No such feelings | 1.000 | reference | 1.000 | reference | 1.000 | reference | 1.000 | reference | 1.000 | reference |
| Have such feelings | 0.736 | 0.549–0.984 | 0.913 | 0.681–1.224 | 0.677 | 0.507–0.901 | 0.872 | 0.638–1.193 | 0.878 | 0.662–1.164 |
| Standardized distance to the main road | 0.780 | 0.605–0.995 | 0.789 | 0.614–1.003 | 0.796 | 0.634–0.989 | 0.828 | 0.666–1.024 | 0.791 | 0.660–0.942 |
| Standardized distance to the nearest park | 1.091 | 0.864–1.382 | 1.117 | 0.887–1.411 | 1.001 | 0.812–1.236 | 1.021 | 0.835–1.254 | 1.049 | 0.889–1.238 |
| Standardized distance to the nearest subway station | 1.123 | 0.881–1.436 | 1.044 | 0.821–1.327 | 1.157 | 0.932–1.441 | 1.069 | 0.866–1.317 | 1.005 | 0.846–1.193 |
| Standardized distance to the nearest restaurant | 0.897 | 0.710–1.126 | 1.010 | 0.805–1.266 | 0.932 | 0.758–1.145 | 1.001 | 0.820–1.226 | 1.012 | 0.859–1.192 |
| Perceived noise pollution | ||||||||||
| Very low road noise | 1.000 | reference | 1.000 | reference | 1.000 | reference | 1.000 | reference | 1.000 | reference |
| Moderate road noise | 0.899 | 0.617–1.311 | 0.886 | 0.605–1.296 | 1.378 | 0.943–2.023 | 1.165 | 0.760–1.801 | 0.970 | 0.674–1.394 |
| High road noise | 0.667 | 0.435–1.021 | 1.045 | 0.683–1.599 | 1.627 | 1.067–2.492 | 1.534 | 0.962–2.467 | 0.771 | 0.513–1.157 |
| Very low train noise | 1.000 | reference | 1.000 | reference | 1.000 | reference | 1.000 | reference | 1.000 | reference |
| Moderate train noise | 1.257 | 0.888–1.781 | 1.193 | 0.839–1.699 | 1.100 | 0.779–1.554 | 1.016 | 0.694–1.482 | 1.034 | 0.737–1.452 |
| High train noise | 2.659 | 1.639–4.354 | 2.272 | 1.390–3.758 | 1.404 | 0.886–2.230 | 1.447 | 0.894–2.347 | 1.854 | 1.178–2.955 |
| Very low commercial noise | 1.000 | reference | 1.000 | reference | 1.000 | reference | 1.000 | reference | 1.000 | reference |
| Moderate commercial noise | 1.793 | 1.296–2.485 | 1.549 | 1.116–2.151 | 1.307 | 0.947–1.805 | 1.513 | 1.060–2.164 | 1.558 | 1.139–2.133 |
| High commercial noise | 0.951 | 0.560–1.607 | 0.943 | 0.548–1.614 | 1.018 | 0.610–1.693 | 1.555 | 0.905–2.655 | 1.330 | 0.797–2.214 |
| Very low renovation noise | 1.000 | reference | 1.000 | reference | 1.000 | reference | 1.000 | reference | 1.000 | reference |
| Moderate renovation noise | 2.572 | 1.805–3.689 | 2.053 | 1.444–2.931 | 1.792 | 1.264–2.552 | 1.301 | 0.884–1.924 | 1.632 | 1.167–2.289 |
| High renovation noise | 2.625 | 1.756–3.951 | 2.263 | 1.517–3.394 | 2.057 | 1.390–3.058 | 1.401 | 0.908–2.166 | 1.494 | 1.023–2.184 |
| Community-level variance | 0.194 | 0.185 | 0.136 | 0.100 | 0.050 | |||||
| Median Odds Ratio (MOR) | 52.0% | 50.5% | 42.0% | 35.1% | 23.7% | |||||
© 2018 by the authors. Licensee MDPI, Basel, Switzerland. This article is an open access article distributed under the terms and conditions of the Creative Commons Attribution (CC BY) license (http://creativecommons.org/licenses/by/4.0/).
Share and Cite
Ma, J.; Li, C.; Kwan, M.-P.; Chai, Y. A Multilevel Analysis of Perceived Noise Pollution, Geographic Contexts and Mental Health in Beijing. Int. J. Environ. Res. Public Health 2018, 15, 1479. https://doi.org/10.3390/ijerph15071479
Ma J, Li C, Kwan M-P, Chai Y. A Multilevel Analysis of Perceived Noise Pollution, Geographic Contexts and Mental Health in Beijing. International Journal of Environmental Research and Public Health. 2018; 15(7):1479. https://doi.org/10.3390/ijerph15071479
Chicago/Turabian StyleMa, Jing, Chunjiang Li, Mei-Po Kwan, and Yanwei Chai. 2018. "A Multilevel Analysis of Perceived Noise Pollution, Geographic Contexts and Mental Health in Beijing" International Journal of Environmental Research and Public Health 15, no. 7: 1479. https://doi.org/10.3390/ijerph15071479
APA StyleMa, J., Li, C., Kwan, M.-P., & Chai, Y. (2018). A Multilevel Analysis of Perceived Noise Pollution, Geographic Contexts and Mental Health in Beijing. International Journal of Environmental Research and Public Health, 15(7), 1479. https://doi.org/10.3390/ijerph15071479