Integrating Qualitative and Quantitative Data in the Development of Outcome Measures: The Case of the Recovering Quality of Life (ReQoL) Measures in Mental Health Populations

 , , , and
Abstract
1. Introduction
2. Methods
2.1. Sources, Methods, and Results of Qualitative Evidence
2.1.1. Qualitative Data from Service Users of Working Age
2.1.2. Qualitative Data from Service Users Aged 16 to 18 Years of Age
2.1.3. Qualitative Data from Clinicians
2.1.4. Translatability Assessment
- Rejection of the following idiomatic items “I had reasons to get out of bed in the morning”, “I found it hard to stand up for myself”, “I felt OK about myself”, “I could not bounce back from my problems”
- Rephrasing of the item “I felt at ease with who I am” to “I felt at ease with myself” because of a semantic issue
- Rejection of items with structural issues “I disliked myself”, “I felt unsure about myself” as it was deemed that they might call for translations using a negative verbal form (such as “I did not like…”, “I did not feel sure…”). (See supplementary Tables S2 and S3 for more details).
2.2. Quantitative Data
2.2.1. Study 1
2.2.2. Study 2
2.3. Combining Qualitative and Quantitative Evidence
2.3.1. Criteria to Summarise Psychometric Evidence
2.3.2. Combining Evidence in Study 1
2.3.3. Combining Evidence in Study 2
- Choose one item per theme to retain the face validity of the measure.
- Decide if a second item is needed in this theme; and if so, choose a second item.
- Retain a mix of negatively and positively worded items in the measure.
2.4. Ethics
3. Results
3.1. Study 1
3.2. Study 2
4. Discussion
5. Conclusions
Supplementary Materials
Author Contributions
Acknowledgments
Conflicts of Interest
Abbreviations
| CFA | Confirmatory Factor Analysis |
| DIF | Differential Item Functioning |
| EFA | Exploratory Factor Analysis |
| GP | General Practice |
| GRM | Graded Response Model |
| IRT | Item Response Theory |
| NHS | National Health Service |
| PROM | Patient Reported Outcome Measure |
| QoL | Quality of Life |
| ReQoL | Recovering Quality of Life |
| TA | Translatability assessment |
References
- McManus, S.; Bebbington, P.; Jenkins, R.; Brugha, T. Mental Health and Wellbeing in England: Adult Psychiatric Morbidity Survey 2014; NHS Digital: Leeds, UK, 2016. [Google Scholar]
- Slade, M.; Longden, E. Empirical evidence about recovery and mental health. BMC Psychiatry 2015, 15, 285. [Google Scholar] [CrossRef] [PubMed]
- Boardman, J.S.M.; Shepherd, G. Assessing recovery: Seeking agreement about the key domains. In Report for the Department of Health; Centre for Mental Health: London, UK, 2013. [Google Scholar]
- Shepherd, G.; Boardman, J.; Rinaldi, M.; Roberts, G. Supporting Recovery in Mental Health Services: Quality and Outcomes; Centre for Mental Health: London, UK, 2014; Available online: https://www.centreformentalhealth.org.uk/recovery-quality-and-outcomes (accessed on 18 February 2018).
- Sklar, M.; Groessl, E.J.; O’Connell, M.; Davidson, L.; Aarons, G.A. Instruments for measuring mental health recovery: A systematic review. Clin. Psychol. Rev. 2013, 33, 1082–1095. [Google Scholar] [CrossRef] [PubMed]
- Leamy, M.; Bird, V.; Le Boutillier, C.; Williams, J.; Slade, M. Conceptual framework for personal recovery in mental health: Systematic review and narrative synthesis. Br. J. Psychiatry 2011, 199, 445–452. [Google Scholar] [CrossRef] [PubMed]
- National Institute for Health and Care Excellence (NICE). Guide to the Methods of Technology Appraisal 2013; NICE: London, UK, 2013. [Google Scholar]
- Brazier, J.; Connell, J.; Papaioannou, D.; Mukuria, C.; Mulhern, B.; Peasgood, T.; Jones, M.L.; Paisley, S.; O’Cathain, A.; Barkham, M. A systematic review, psychometric analysis and qualitative assessment of generic preference-based measures of health in mental health populations and the estimation of mapping functions from widely used specific measures. Health Technol. Assess. 2014. [Google Scholar] [CrossRef] [PubMed]
- Mulhern, B.; Mukuria, C.; Barkham, M.; Knapp, M.; Byford, S.; Soeteman, D.; Brazier, J. Using generic preference-based measures in mental health: Psychometric validity of the EQ-5D and SF-6D. Br. J. Psychiatry 2014, 205, 236–243. [Google Scholar] [CrossRef] [PubMed]
- Papaioannou, D.; Brazier, J.; Parry, G. How valid and responsive are generic health status measures, such as EQ-5D and SF-36, in schizophrenia? A systematic review. Value Health 2011, 14, 907–920. [Google Scholar] [CrossRef] [PubMed]
- Barton, G.R.; Hodgekins, J.; Mugford, M.; Jones, P.B.; Croudace, T.; Fowler, D. Measuring the benefits of treatment for psychosis: Validity and responsiveness of the EQ–5D. Br. J. Psychiatry 2009, 195, 170–177. [Google Scholar] [CrossRef] [PubMed]
- Papaioannou, D.; Brazier, J.; Parry, G. How to measure quality of life for cost-effectiveness analyses of personality disorders: A systematic review. J. Pers. Disord. 2013, 27, 383. [Google Scholar] [CrossRef] [PubMed]
- Brazier, J. Is the EQ–5D fit for purpose in mental health? Br. J. Psychiatry 2010, 197, 348–349. [Google Scholar] [CrossRef] [PubMed]
- Connell, J.; Brazier, J.; O’Cathain, A.; Lloyd-Jones, M.; Paisley, S. Quality of life of people with mental health problems: A synthesis of qualitative research. Health Qual. Life Outcomes 2012, 10, 138. [Google Scholar] [CrossRef] [PubMed]
- Connell, J.; O’Cathain, A.; Brazier, J. Measuring quality of life in mental health: Are we asking the right questions? Soc. Sci. Med. 2014, 120, 12–20. [Google Scholar] [CrossRef] [PubMed]
- Keetharuth, A.D.; Brazier, J.; Connell, J.; Bjorner, J.B.; Carlton, J.; Buck, E.T.; Ricketts, T.; McKendrick, K.; Browne, J.; Croudace, T. Recovering Quality of Life (ReQoL): A new generic self-reported outcome measure for use with people experiencing mental health difficulties. Br. J. Psychiatry 2018, 212, 42–49. [Google Scholar] [CrossRef] [PubMed]
- Streiner, D.L.; Norman, G.R. Selection items. In Health Measurement Scales: A Practical Guide to Their Development and Use; Oxford University Press: Oxford, UK, 2008; Chapter 5. [Google Scholar]
- Hawthorne, G.; Richardson, J.; Osborne, R. The Assessment of Quality of Life (AQoL) instrument: A psychometric measure of health-related quality of life. Qual. Life Res. 1999, 8, 209–224. [Google Scholar] [CrossRef] [PubMed]
- Connell, J.; Carlton, J.; Grundy, A.; Taylor Buck, E.; Keetharuth, A.; Ricketts, T.; Barkham, M.; Rose, D.; Robotham, D.; Rose, D.; et al. The importance of content and face validity in instrument development: Lessons learnt from service users when developing the Recovering Quality of Life (ReQoL) measure. Qual. Life Res. 2018, 27, 1893–1902. [Google Scholar] [CrossRef] [PubMed]
- Acquadro, C.; Patrick, D.L.; Eremenco, S.; Martin, M.L.; Kuliś, D.; Correia, H.; Conway, K. Emerging good practices for Translatability Assessment (TA) of Patient-Reported Outcome (PRO) measures. J. Patient Rep. Outcomes 2018, 2, 8. [Google Scholar] [CrossRef] [PubMed]
- Keetharuth, A.D.; Barkham, M.; Bjorner, J.B.; Browne, J.; Croudace, T.; Brazier, J. Recovering Quality of Life (ReQoL): Assessment of the Factor Structure of a Generic Self-Reported Outcome Measure for Use with People Experiencing Mental Health Difficulties. HEDS Discussion Paper 2018, University of Sheffield. 2018. Available online: https://www.sheffield.ac.uk/scharr/sections/heds/discussion-papers (accessed on 31 March 2018).
- Orlando, M.; Thissen, D. New item fit indices for dichotomous item response theory models. Appl. Psychol. Meas. 2000, 24, 50–64. [Google Scholar] [CrossRef]
- Johnson, R.B.; Onwuegbuzie, A.J. Mixed methods research: A research paradigm whose time has come. Educat. Res. 2004, 33, 14–26. [Google Scholar] [CrossRef]
- Luyt, R. A framework for mixing methods in quantitative measurement development, validation, and revision: A case study. J. Mixed Methods Res. 2012, 6, 294–316. [Google Scholar] [CrossRef]
- Adcock, R. Measurement validity: A shared standard for qualitative and quantitative research. Am. Politcal Sci. Rev. 2001, 95, 529–546. [Google Scholar] [CrossRef]
- Grundy, A.; Barber, R.; Barkham, M.; Brazier, J.; Carlton, J.; Connell, J.; Hanlon, R.; Keetharuth, A.; Robotham, D.; Taylor Buck, E. A Critical Assessment of Service User Involvement in Co-Producing a New Self-Reported Mental Health Outcome Measure of Recovering Quality of Life (ReQoL). HEDS Discussion Paper. 2018. Available online: https://www.sheffield.ac.uk/scharr/sections/heds/discussion-papers (accessed on 31 March 2018).
- Archibald, M.M.; Radil, A.I.; Zhang, X.; Hanson, W.E. Current mixed methods practices in qualitative research: A content analysis of leading journals. Int. J. Qual. Methods 2015, 14, 5–33. [Google Scholar] [CrossRef]
- O’Cathain, A.; Murphy, E.; Nicholl, J. Three techniques for integrating data in mixed methods studies. Br. Med. J. 2010, 341, c4587. [Google Scholar] [CrossRef] [PubMed]
- Onwuegbuzie, A.J.; Dickinson, W.B. Mixed Methods Analysis and Information Visualization: Graphical Display for Effective Communication of Research Results. Qual. Rep. 2008, 13, 204–225. [Google Scholar]


| Analyses | Guidance/Judgement/Rule | Determines Exclusion |
|---|---|---|
| Missing data at item level | If any item has ≥5% missing data, this item should be dropped Lay description: Respondents do not complete an item maybe because they find it difficult, ambiguous, or simply choose not to answer it. | Yes |
| Factor analyses | Identify items with high residual correlations (>0.1) Lay description: Assess whether the items measure the different themes of interest and whether the various themes can be aggregated in one score. | Select one item |
| Item response theory—misfitting items | Identify misfitting items with sum-score based item fit statistic (S-G2) with p values < 0.05 [22] in at least 3 datasets (the sample was randomly distributed in 4 datasets of about 1000 observations in each) Lay description: A mathematical model using all the items is used to explain whether all the items are measuring quality of life (QoL). Items can be identified as misfitting if they are not contributing to measuring QoL. This issue can arise not because of the item but because of the respondents. Therefore, the item can be tested in a different sample before deciding whether to drop it. | No. Acknowledge the misfit but retain item in the item pool. |
| Item response theory—information functions | Ensure that items cover the whole measurement range (i.e., intensity) by choosing items to balance maximization of information over the total range and content validity (including items from all themes). Lay description: Highly discriminating items provide great information but over a small range of QoL and less discriminating items provide less information but over a wider range of QoL. The graph for each item therefore tells us how much information an item is contributing to the scale and also to what portion of the score range (that those with very low or high QoL). | No |
| Differential item functioning (DIF) | Exclude items with DIF (age, ethnicity, gender, mental health condition) Lay description: An item is said to display DIF if people with same QoL respond differently to the item because of other characteristic (e.g., by virtue of being female, or belonging to a particular socio-economic group). The item is picking these characteristics up and therefore not correctly representing the true QoL. | Yes |
| Sensitivity to change | Ensure selected items show change in response over time Lay description: Given that ReQoL would be used routinely over the course of treatment, the items need to be able to register a change in the respondent’s QoL if there is one. | Yes |
| Item | Factor Analyses | Qualitative Evidence | |||
|---|---|---|---|---|---|
| Spearman Correlation within Theme > 0.7 | Adult Service Users | Younger Service Users | Translatability Assessment | Decision | |
| I felt unsure of myself | Not covered | F (30) A(20) M(50) | ✓? | Delete | |
| I tended to blame myself for bad things that have happened | I felt like a failure | F (14) A(8) M(3) | F (80) A(0) M(20) | ✓? | Delete |
| I felt like a failure | I disliked myself | F (15) A(6) M(3) | F (27) A(18) M(55) | ✓ | Retain |
| I felt confident in myself | I am at ease with who I am I valued myself as a person I felt ok about myself | F (23) A(3) M(1) | F (64) A(9) M(27) | ✓ | Retain |
| I felt at ease with who I am | I valued myself as a person I felt ok about myself | F (15) A(6) M(6) | F (45) A(0) M(55) | ✓? | Retain |
| I valued myself as a person | I felt ok about myself | F (21) A(6) M(1) | F (36) A(0) M(64) | ✓ | Retain |
| I disliked myself | F (18) A(6) M(3) | F (45) A(9) M(45) | ✓? | Retain | |
| I felt confused about who I am | F (16) A(4) M(6) | F (18) A(27) M(55) | ✓? (added about who I am as a result of TA) | Delete | |
| I felt ok about myself | F (19) A(4) M(4) | F (0) A(9) M(91) | “ok”—difficult to translate | Delete | |
| Theme | Item Code | Description |
|---|---|---|
| Activity | ACT1 | I found it difficult to get started with everyday tasks |
| ACT2P | I enjoyed what I did * | |
| Belonging and relationships | BEL2 | I felt lonely |
| BEL3P | I felt able to trust others * | |
| Choice, control, and autonomy | CHO4 | I felt unable to cope |
| CHO1P | I could do the things I wanted to do * | |
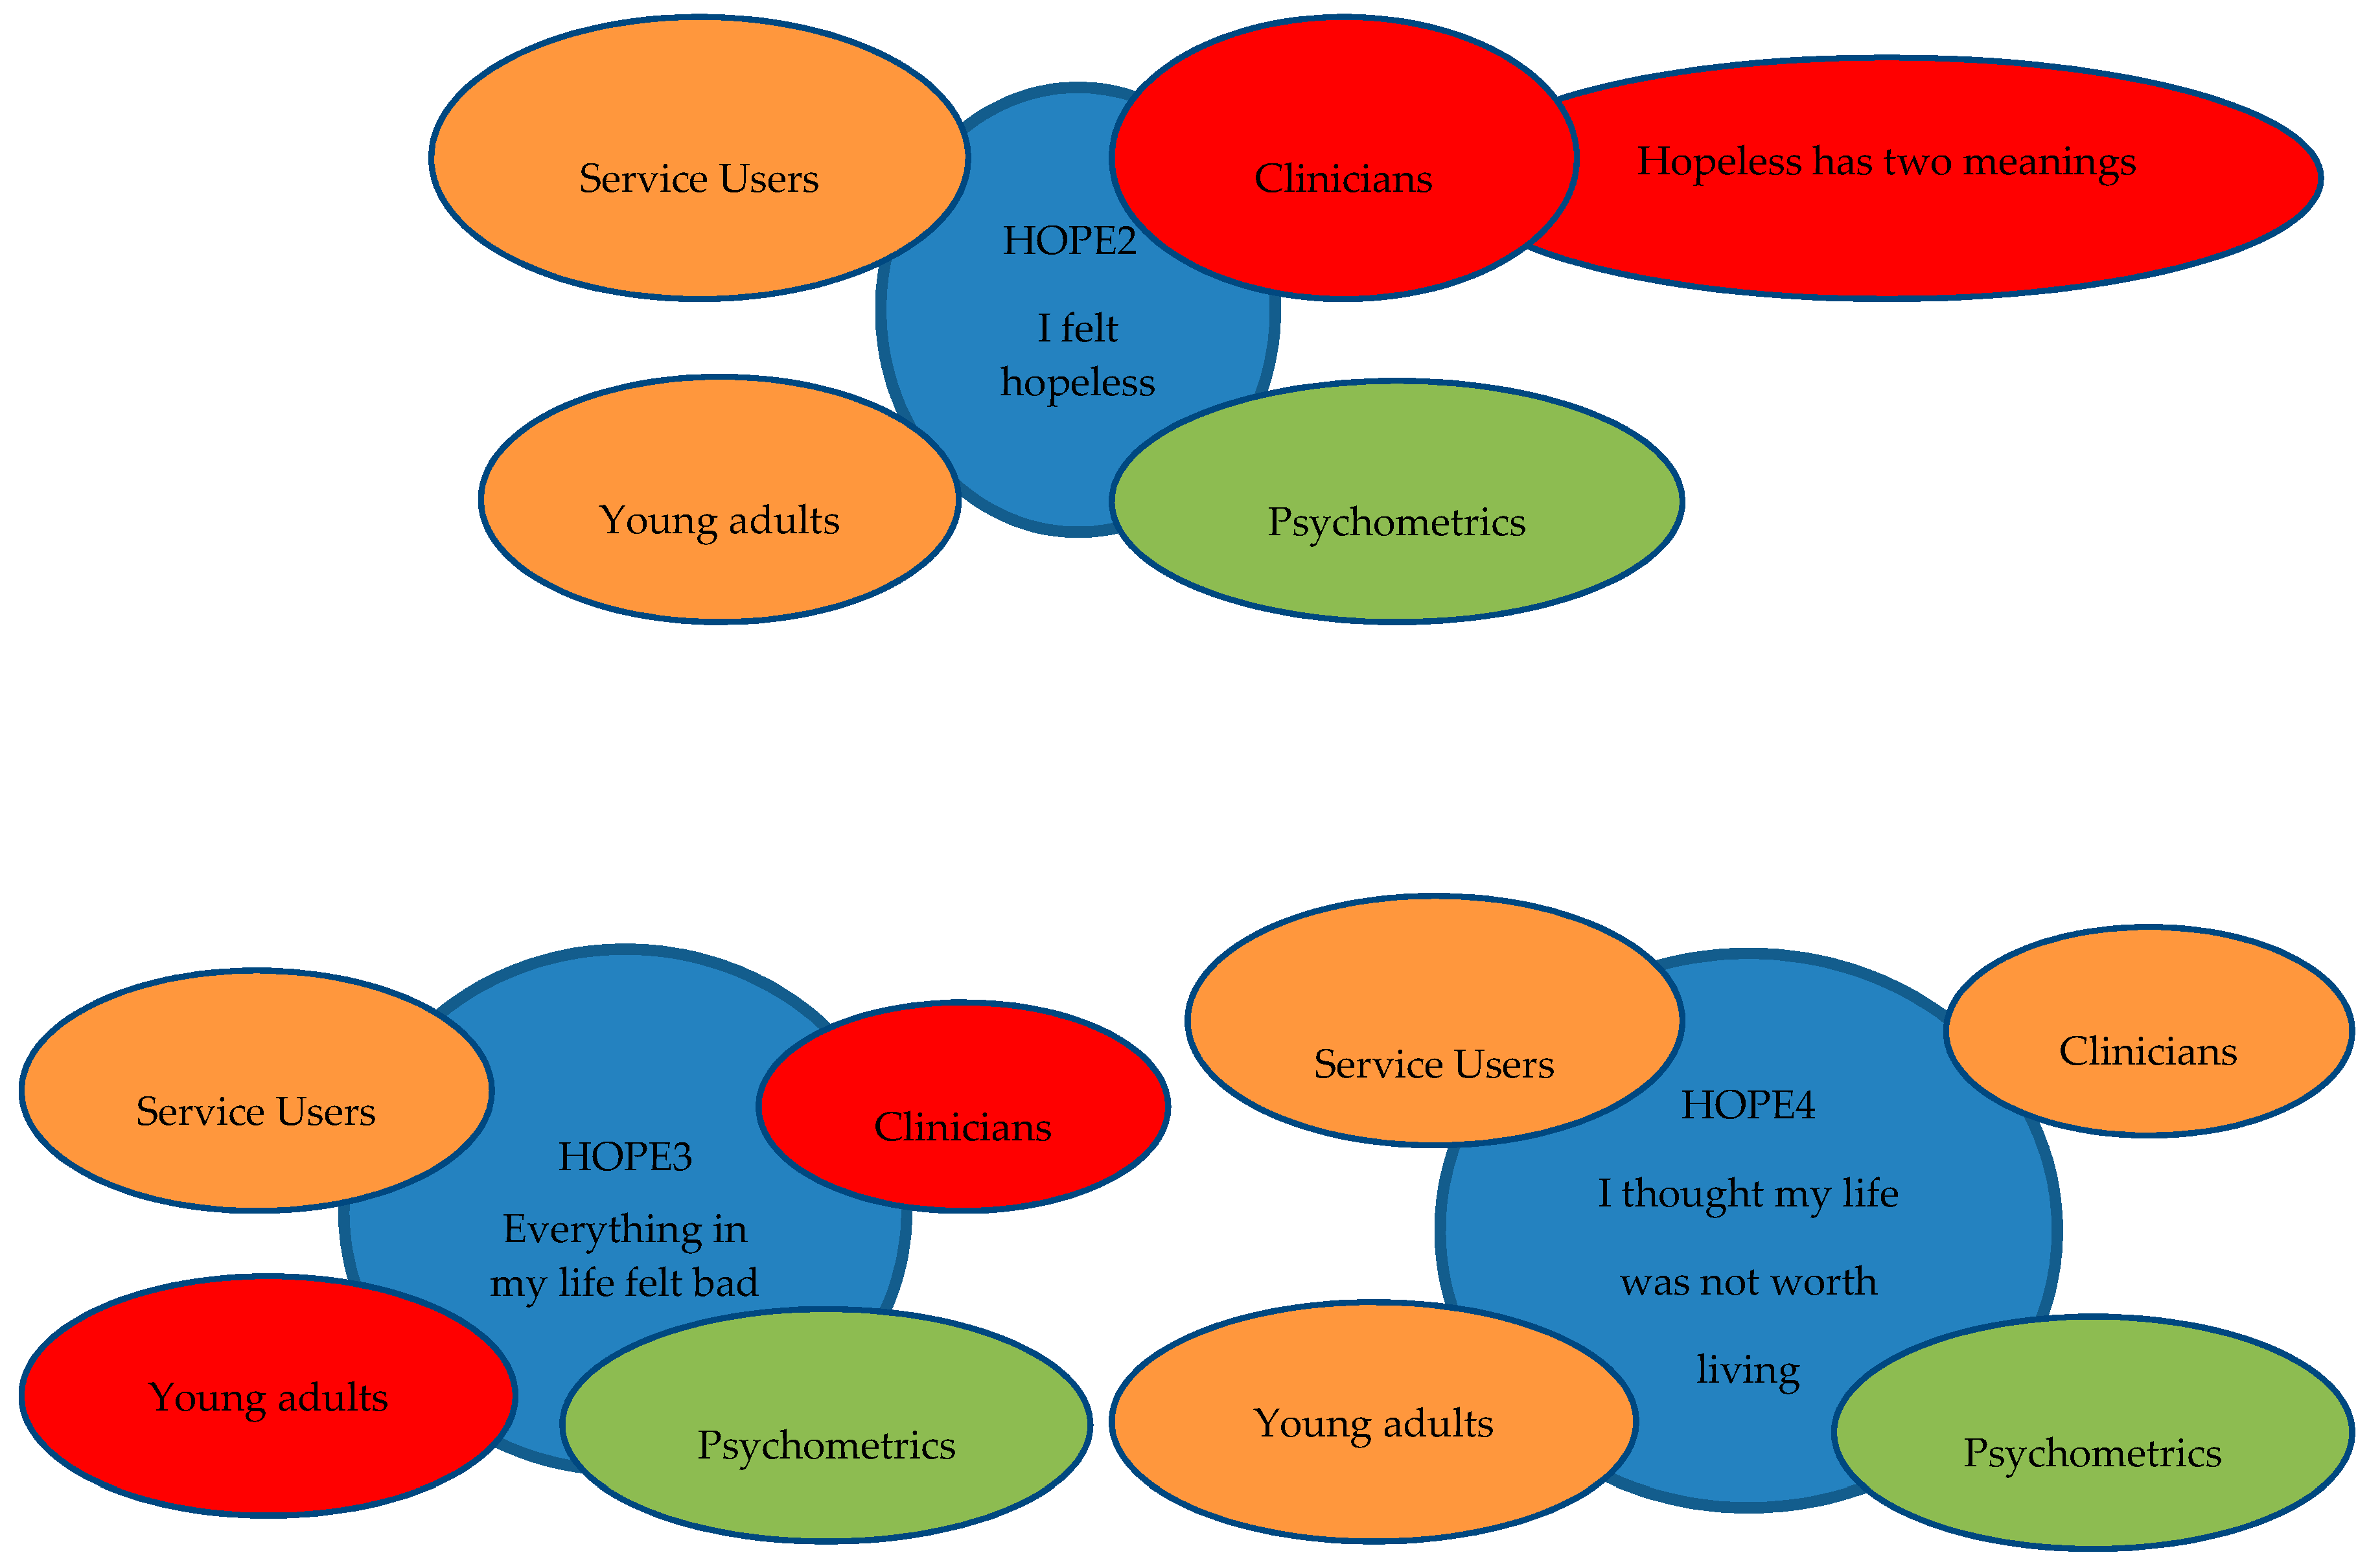
| Hope | HOPE4 | I thought my life was not worth living |
| HOPE1P | I felt hopeful about my future * | |
| Self-perception | SEL2P | I felt confident in myself |
| Wellbeing | WB11 | I felt happy |
© 2018 by the authors. Licensee MDPI, Basel, Switzerland. This article is an open access article distributed under the terms and conditions of the Creative Commons Attribution (CC BY) license (http://creativecommons.org/licenses/by/4.0/).
Share and Cite
Keetharuth, A.D.; Taylor Buck, E.; Acquadro, C.; Conway, K.; Connell, J.; Barkham, M.; Carlton, J.; Ricketts, T.; Barber, R.; Brazier, J. Integrating Qualitative and Quantitative Data in the Development of Outcome Measures: The Case of the Recovering Quality of Life (ReQoL) Measures in Mental Health Populations. Int. J. Environ. Res. Public Health 2018, 15, 1342. https://doi.org/10.3390/ijerph15071342
Keetharuth AD, Taylor Buck E, Acquadro C, Conway K, Connell J, Barkham M, Carlton J, Ricketts T, Barber R, Brazier J. Integrating Qualitative and Quantitative Data in the Development of Outcome Measures: The Case of the Recovering Quality of Life (ReQoL) Measures in Mental Health Populations. International Journal of Environmental Research and Public Health. 2018; 15(7):1342. https://doi.org/10.3390/ijerph15071342
Chicago/Turabian StyleKeetharuth, Anju Devianee, Elizabeth Taylor Buck, Catherine Acquadro, Katrin Conway, Janice Connell, Michael Barkham, Jill Carlton, Thomas Ricketts, Rosemary Barber, and John Brazier. 2018. "Integrating Qualitative and Quantitative Data in the Development of Outcome Measures: The Case of the Recovering Quality of Life (ReQoL) Measures in Mental Health Populations" International Journal of Environmental Research and Public Health 15, no. 7: 1342. https://doi.org/10.3390/ijerph15071342
APA StyleKeetharuth, A. D., Taylor Buck, E., Acquadro, C., Conway, K., Connell, J., Barkham, M., Carlton, J., Ricketts, T., Barber, R., & Brazier, J. (2018). Integrating Qualitative and Quantitative Data in the Development of Outcome Measures: The Case of the Recovering Quality of Life (ReQoL) Measures in Mental Health Populations. International Journal of Environmental Research and Public Health, 15(7), 1342. https://doi.org/10.3390/ijerph15071342