Article

Current and Potential Future Seasonal Trends of Indoor Dwelling Temperature and Likely Health Risks in Rural Southern Africa

by
Thandi Kapwata
1,2,
Michael T. Gebreslasie
3,
Angela Mathee
1,4 and
Caradee Yael Wright
2,5,*
1
Environment and Health Research Unit, South African Medical Research Council, Johannesburg 2028, South Africa
2
Department of Geography, Geoinformatics and Meteorology, University of Pretoria, Pretoria 0028, South Africa
3
School of Agriculture, Earth, and Environmental Sciences, University of KwaZulu-Natal, Durban 3629, South Africa
4
Department of Environmental Health, Faculty of Health Sciences, University of Johannesburg, Johannesburg 2028, South Africa
5
Environment and Health Research Unit, South African Medical Research Council, Pretoria 0084, South Africa
*
Author to whom correspondence should be addressed.
Int. J. Environ. Res. Public Health 2018, 15(5), 952; https://doi.org/10.3390/ijerph15050952
Submission received: 22 March 2018 / Revised: 24 April 2018 / Accepted: 25 April 2018 / Published: 10 May 2018
(This article belongs to the Special Issue Health Impacts of Warming of 1.5 °C and 2 °C)

Abstract

:
Climate change has resulted in rising temperature trends which have been associated with changes in temperature extremes globally. Attendees of Conference of the Parties (COP) 21 agreed to strive to limit the rise in global average temperatures to below 2 °C compared to industrial conditions, the target being 1.5 °C. However, current research suggests that the African region will be subjected to more intense heat extremes over a shorter time period, with projections predicting increases of 4–6 °C for the period 2071–2100, in annual average maximum temperatures for southern Africa. Increased temperatures may exacerbate existing chronic ill health conditions such as cardiovascular disease, respiratory disease, cerebrovascular disease, and diabetes-related conditions. Exposure to extreme temperatures has also been associated with mortality. This study aimed to consider the relationship between temperatures in indoor and outdoor environments in a rural residential setting in a current climate and warmer predicted future climate. Temperature and humidity measurements were collected hourly in 406 homes in summer and spring and at two-hour intervals in 98 homes in winter. Ambient temperature, humidity and windspeed were obtained from the nearest weather station. Regression models were used to identify predictors of indoor apparent temperature (AT) and to estimate future indoor AT using projected ambient temperatures. Ambient temperatures will increase by a mean of 4.6 °C for the period 2088–2099. Warming in winter was projected to be greater than warming in summer and spring. The number of days during which indoor AT will be categorized as potentially harmful will increase in the future. Understanding current and future heat-related health effects is key in developing an effective surveillance system. The observations of this study can be used to inform the development and implementation of policies and practices around heat and health especially in rural areas of South Africa.

1. Introduction

There has been a growing interest in the relationship between temperature in indoor and outdoor settings, especially in the context of climate change and projected increases in extreme temperature events [1]. The exposure of individuals to temperature extremes is affected not only by outdoor temperature, but also by temperature experienced in the indoor environment. Indoor conditions represent an important microenvironment because of the amount of time people spend at home; they provide a suitable representation of temperature exposure experienced by dwelling occupants [2]. The elderly, children, and disabled people are particularly vulnerable to extreme indoor temperatures and may experience heat stress or heatstroke, among other heat-related health outcomes [3,4]. Measures of exposure to heat vary and include maximum, minimum, average temperatures, or apparent temperature (AT), where the latter refers to a ‘real-feel’ metric that includes the influence of relative humidity with temperature [5,6,7].
Climate change has resulted in rising temperature trends which have been associated with changes in temperature extremes globally [8,9,10,11]. World leaders who attended the 21st Conference of the Parties (COP 21) agreed to strive to limit the rise in global average temperatures to below 2 °C compared to industrial era conditions, and to aim for a target of 1.5 °C [12]. However, on average, global average temperatures are projected to exceed these temperature goals, with increases of between 1.4 °C and 5.8 °C expected by the end of the year 2100 [13]. This phenomenon is expected to exacerbate the negative health impacts of heat caused by higher temperatures and increased frequency and severity of heatwaves [14].
Current research suggests that Africa is experiencing longer, hotter, and more frequent heatwaves that are occurring over larger areas, compared to Europe and other continents, for the same time periods [15]. Studies further show that in the future, the African region will be subjected to more intense heat extremes in a shorter time horizon, with projections predicting 20–80 more heat-wave days occurring annually over subtropical southern Africa and increases of 4–6 °C in annual average maximum temperatures for southern Africa during 2088–2099 [16,17,18].
Negative health effects of exposure to raised temperatures during heatwaves and on hot days include cramps, fainting, heat exhaustion, heatstroke, and dehydration [19,20,21]. Increased temperatures may exacerbate existing chronic ill health conditions such as cardiovascular disease, respiratory disease, cerebrovascular disease, and diabetes-related conditions [22,23]. Exposure to extreme temperatures has also been associated with mortality [24,25].
Evidence suggests that people of lower socio-economic status are at an increased risk of adverse heat-related effects [26]. Populations in economically disadvantaged settings are more vulnerable because they lack the resources to cope and adapt to heatwaves [27]. There has been little published research on exposure to elevated temperatures and health impacts in developing countries; existing studies particularly in South Africa are largely confined to occupational settings [28,29,30,31,32,33,34]. Knowledge on the temperature environments in which people live (and work) and possible health impacts associated with high temperature is required to guide development and design of prevention and awareness programs and policy recommendations with the purpose of reducing heat-associated morbidity and mortality. This is of particular importance in rural residential settings where poor communities do not have access to heat warnings and recommended coping mechanisms, access to health care services is usually limited and health facility resources are inadequate [35].
Therefore, this study aimed to consider the relationship between indoor and outdoor environments in rural residential settings in a current climate and warmer predicted future climate. Specific study objectives were to (a) measure and then assess the impact of outdoor temperatures on the indoor residential temperature microclimate in a rural setting in Limpopo province, South Africa; (b) explore seasonal trends in the indoor residential temperature microclimate; and (c) to consider possible health risks associated with indoor temperatures using AT as a measure of exposure. We took this approach to determine both current (measured) and future (predicted) possible indoor and outdoor temperature profiles in rural homes using the representative concentration pathway (RCP) 8.5 scenario of the fifth assessment report (AR5) of the Intergovernmental Panel on Climate Change (IPCC) [36,37]. This scenario predicts increases in the region of 2.6–4.8 °C by the end of the 21st century [38]. In a subsample of the sampled houses, we also assessed the influence of type of roof on indoor temperatures in both current and future temperature scenarios to suggest recommendations for coping mechanisms in relation to rural roofs and a warming climate.

2. Materials and Methods
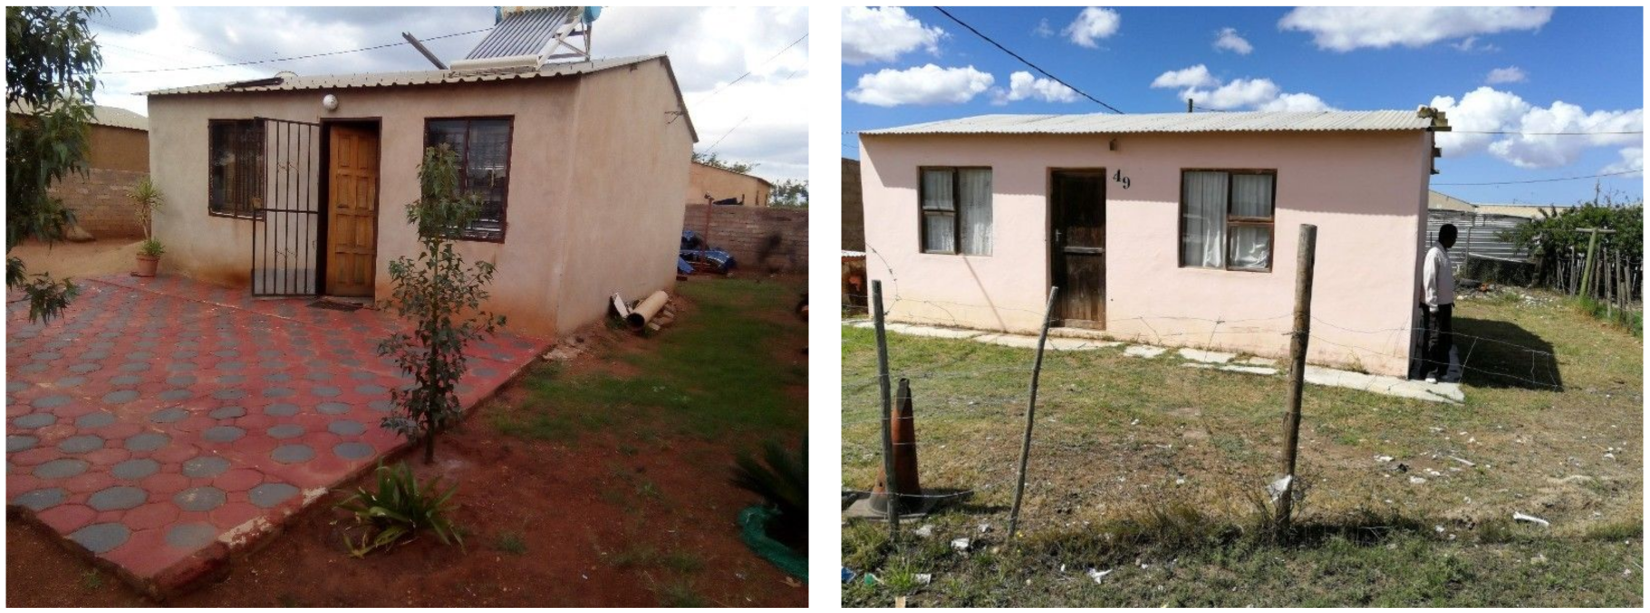
2.1. Study Area

The study area was Limpopo province, South Africa. Limpopo has 74.4% of its households located in rural areas compared to the national average of 27.1% [39]. The province also has the highest level of poverty in the country with 78.9% of the total population of the province living below the national poverty line of ZAR 441 per person per month [40]. ZAR is the international code for the South African currency, the Rand. Studies have identified Limpopo province as being particularly vulnerable to climate change impacts due to its exposure to extreme weather events that include heat extremes [41,42,43,44].
This study was conducted in 406 households in the Greater Giyani local municipality located in Limpopo province. The municipality has a population size of 247,657 consisting of 57,537 households, the majority of which are located in several rural villages [39]. Within this municipality, 406 dwellings were randomly selected from four villages to participate in the study. A cluster sampling method was used. Ethics clearance for the study was granted by the South African Medical Research Council Research Ethics Committee (clearance no. EC005-3/2014, 9 May 2017) and permission was sought from the provincial, local and traditional leadership in the study area.

2.2. Outdoor Weather Data

Hourly measurements for daily ambient temperature, humidity and wind speed data were obtained from the South African Weather Service (SAWS) for the monitoring station located in Giyani, Limpopo province. Data were provided from 1 September 2016 to 30 September 2017 in an Excel format. SAWS has procedures in place for data quality assurance and quality control. These include removing impossible values resulting from human error or instrument malfunction, outliers and duplicated values [45].

2.3. Indoor Temperature and Relative Humidity Data

Temperatures and relative humidity inside the 406 houses were monitored and recorded using LogTag temperature loggers. Three separate sampling campaigns were conducted, one for each season (spring, summer, winter). For the spring and summer campaigns, one logger was placed in a room in each of the selected 406 dwellings. Temperature and relative humidity were recorded at one-hour intervals during spring (5 September 2016 to 30 November 2016) and summer (1 December 2016 to 28 February 2017). The same variables were recorded at 2-h intervals during the winter campaign (7 July 2017 to 31 August 2017) in a sub-sample of 98. Initially, a total of 105 houses were randomly selected however, 7 (6.7%) did participate in the study. The logger was placed in a room frequently used by household occupants and affixed to a wall or high piece of furniture with double-sided tape to minimize tampering and to be as unobtrusive as possible in the home. Temperature was measured in degrees Celsius and relative humidity was measured as a percentage out of 100, data were downloaded from loggers into Microsoft Excel (2016) format. Before analysis, data were checked for inconsistencies and other anomalies and outliers (unrealistic values) were removed, where after data from all households were merged into a single file for further analysis. Temperature measurements were recorded correctly by the logtags. However, 0.13% (1280 out of 99,784 hourly data points) of the relative humidity data was omitted due to values being unrealistic.

2.4. Apparent Temperature

AT is an adjustment to the ambient temperature based on the level of relative humidity and it is deemed a measure of how humans actually perceive or feel temperature. AT is the most frequently used indicator of probable human physical reaction to weather conditions and several studies have used AT to examine the association between health and high temperature [46,47,48,49]. Therefore, hourly AT for each house was calculated using the equations below [50]
AT = Ta + 0.33 × e − 0.70 × ws − 4.00
where
  • Ta = dry bulb temperature (°C)
  • e = water vapour pressure (hPa)
  • ws = wind speed (m/s) at an elevation of 10 m (set to 0 because this was an indoor setting)
e = rh/100 × 6.105 × exp (17.27 × Ta/(237.7 + Ta))
where rh = relative humidity (%).
Currently, no comprehensive relationships between AT or temperature ranges and their effect on human health are available for Africa [46]. Therefore, an international symptom table developed by the United States National Weather Service (USNWS) and the National Oceanic and Atmospheric Administration (NOAA) was used in this study. This table has been used in similar studies on the African context [46]. Calculated indoor ATs were compared to USNWS NOAA heat health effects as shown in Table 1 [51] to estimate potential temperature ranges to which household occupants may be exposed and consider the temperature-associated health risks.

2.5. Household Questionnaire

Following written, informed consent, a pre-structured questionnaire was administered to a respondent from each of the 406 households participating in the summer indoor temperature measurement campaign. A household member of at least 18 years of age provided information on socio-economic and demographic status, specifically number of people in the household (explained as the people who eat a meal together), average monthly household income, number of people receiving various grants, perceived level of comfort in the house during hot weather and use of a fan and/or air conditioner during hot weather. During the wintertime indoor temperature monitoring campaign, a household member from the sub-sample of 98 households was asked about the roof type of their home.

2.6. Data and Statistical Analyses

All statistical analyses were performed in STATA version 14 (StataCorp, College Station, TX, USA) [52]. Data recorded by LogTags were linked to household questionnaire data by a unique household identifier number. AT was calculated for indoor and outdoor environments using Equations (1) and (2) above to evaluate possible health risks. Multiple linear regression was used to assess the association between indoor AT (dependent variable) and ambient outdoor temperature and AT (independent variables) to identify the most important predictor of indoor AT. Thereafter, to determine possible future risks resulting from indoor AT, linear regression was used to predict indoor AT based on predicted outdoor temperature. Predicted outdoor temperature values were obtained by using the projected increases in monthly temperature for South Africa from the Representative Concentration Pathways (RCP 8.5) climate model for the period 2080–2099 [36,37,53,54]. The projected data obtained from the RCP climate model is presented at a 1° × 1° global grid spacing, produced through bi-linear interpolation [55]. Statistical tests were also performed to assess statistical differences in temperatures according to roof type and between indoor and outdoor AT. A 5% level of significance was applied to all regression analysis.

3. Results

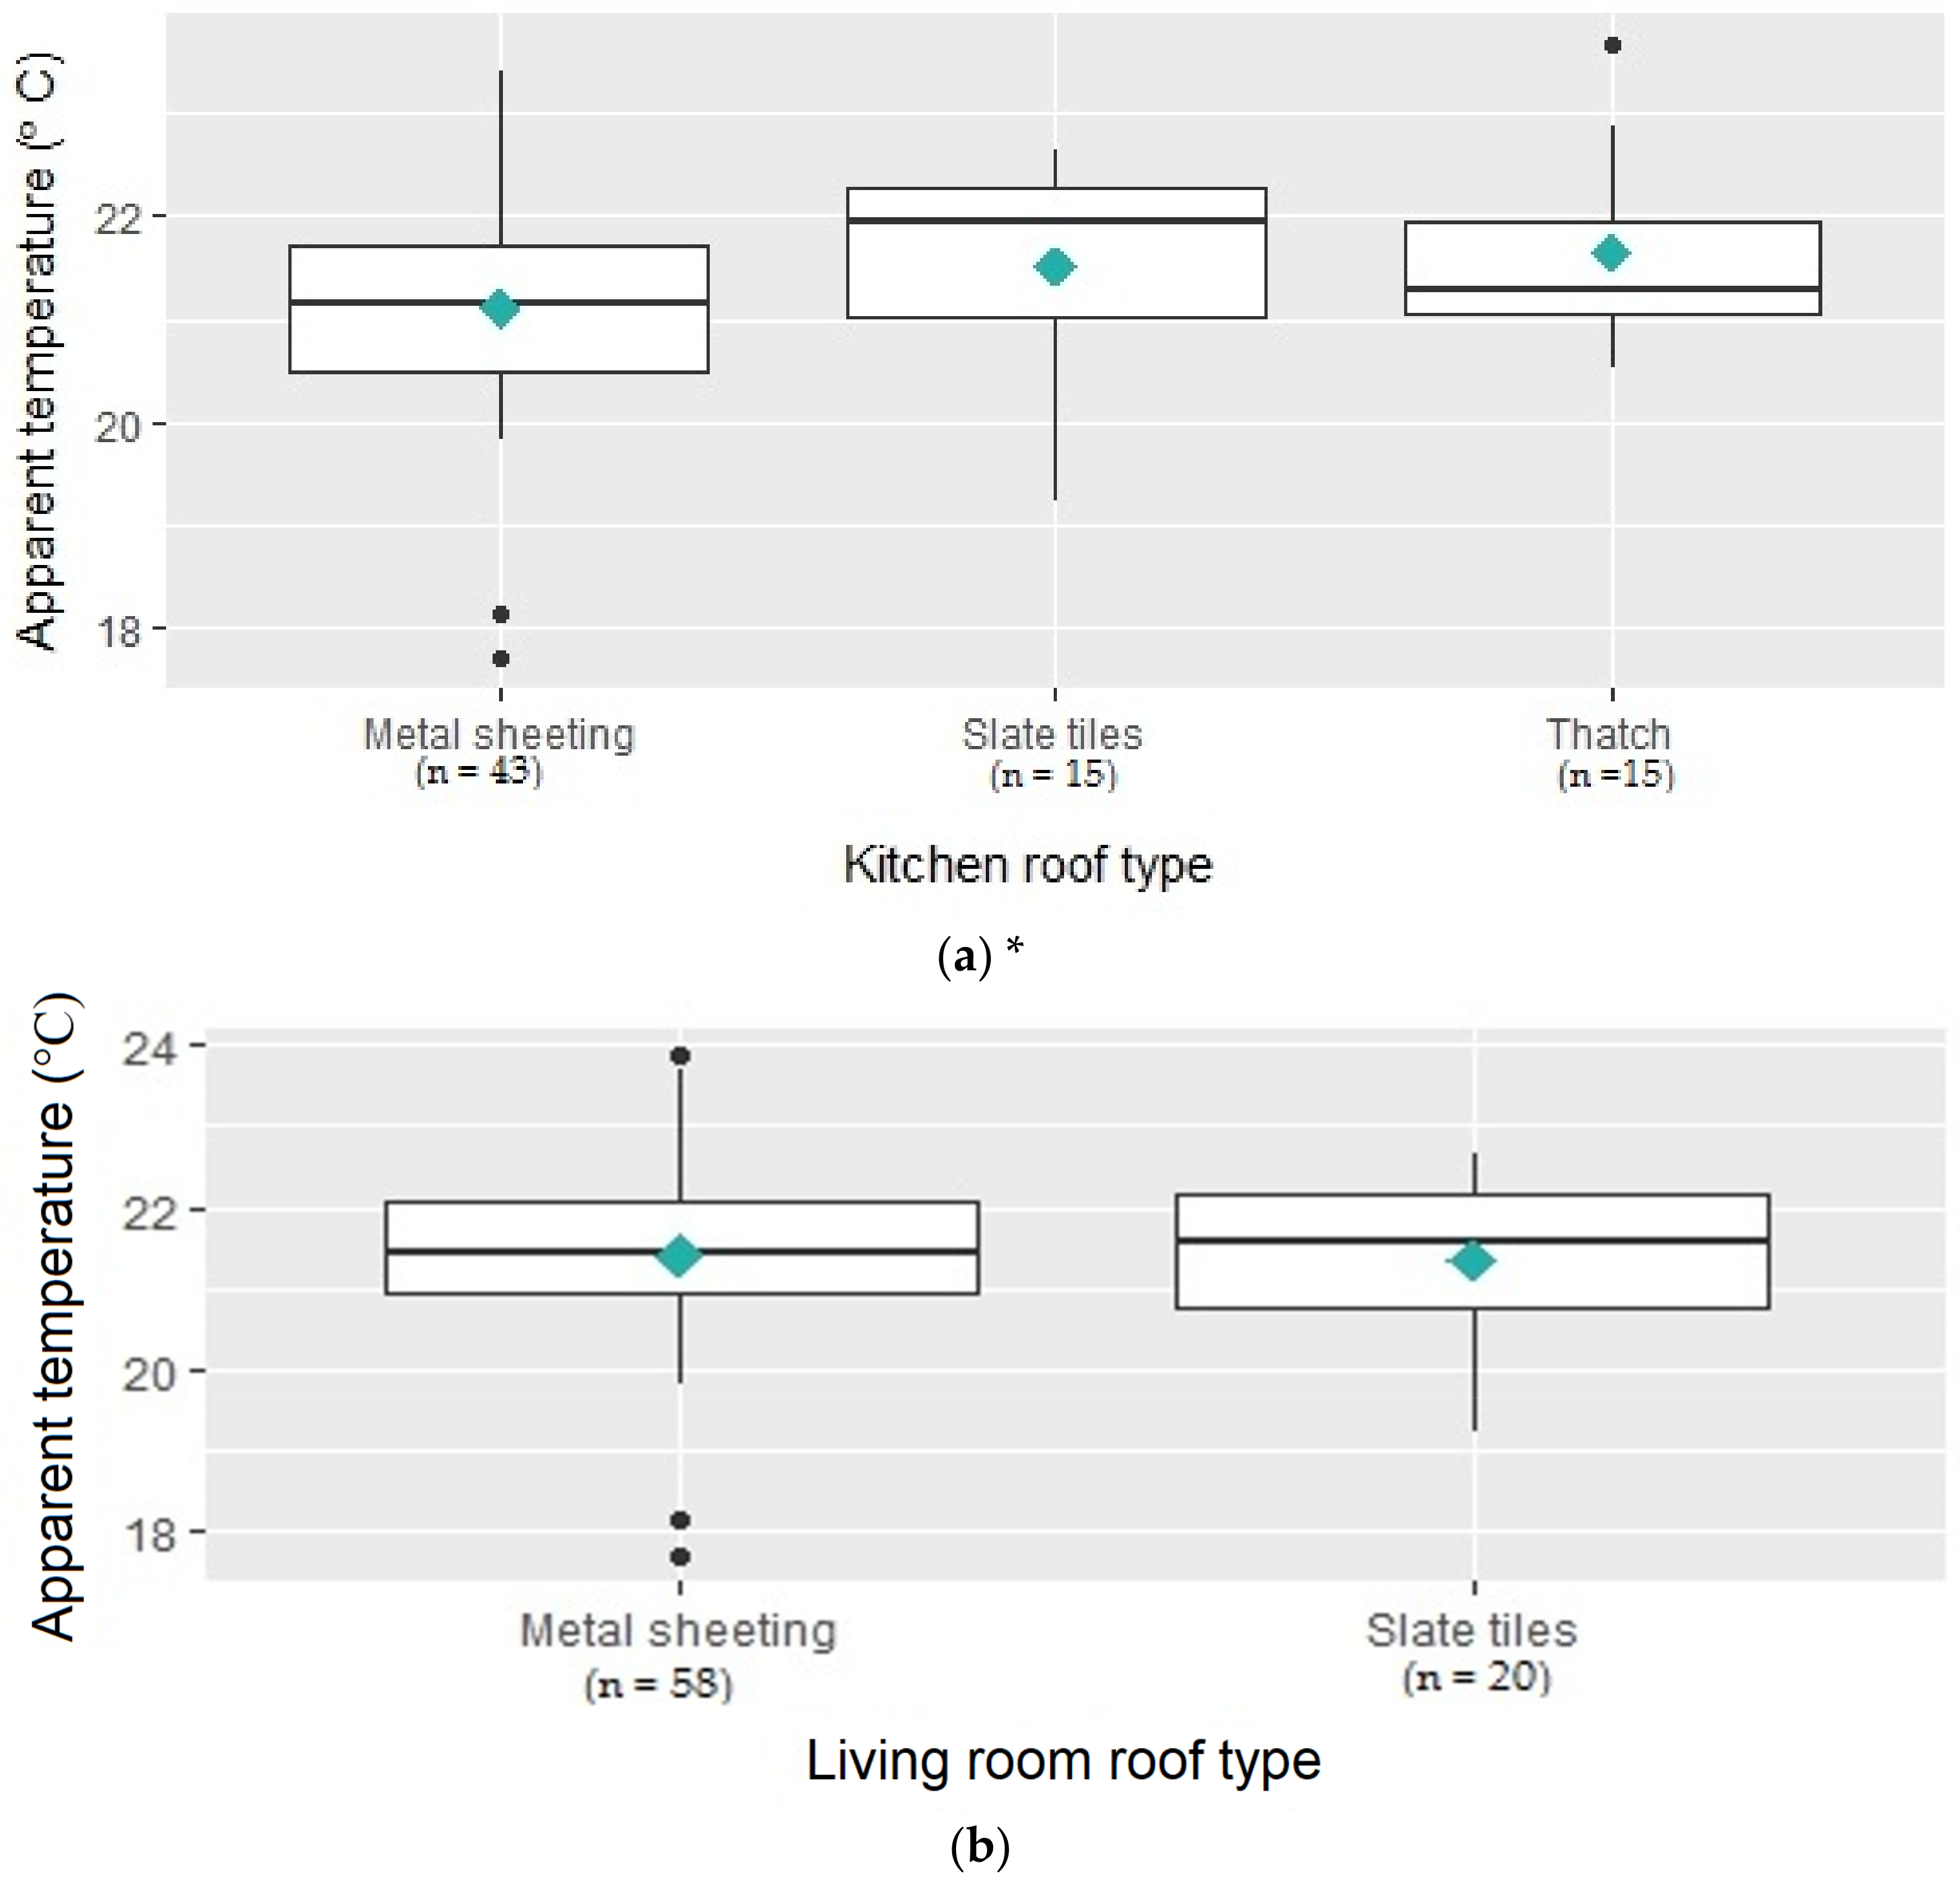
3.1. Household Characteristics

A large percentage of sampled households were below the upper-bound poverty line (i.e., ZAR 1077) as defined by Statistics South Africa in the year 2015 [54] (Table 2). Many households supplemented their income with state-sponsored social grants that support vulnerable groups. These grants were for children under the age of 18 (282 children) and elderly people over the age of 60 years (142 elderly). Most households appear to be single family homes with 87.9% of houses having between one and seven occupants.
Most of the sampled households were formal structures (92.6%) therefore further analysis by housing type was not conducted even though this is likely an important variable that should be considered in future research. Although not asked in the questionnaire, most houses were single story units built with brick and mortar with areas ranging from 36 m2 to 45 m2 (Figure 1).
In the winter subsample of 98 households, where roofing type was captured, the most common roofing type in both the kitchens and the living rooms was metal sheets (43.9% and 59.2% of homes, respectively). Figure 2a shows that mean hourly indoor AT during winter was slightly higher in kitchens with thatched roofs (21.7 °C) compared to other roof types. A one-way ANOVA analysis showed that there was a statistically significant difference between the three roof types (p < 0.001). A Tukey post hoc test revealed that temperatures were statistically significantly higher in kitchens with thatched roofs compared to kitchens with metal sheets (p < 0.001). However, the difference between temperatures in kitchens with thatched roofs and kitchens with slate tiles was not statistically significant (p > 0.10). AT was also higher in living rooms with metal sheet roofing (21.4 °C) compared to slate tiles (Figure 2b). A t-test revealed that that difference was not statistically significant (p > 0.10).

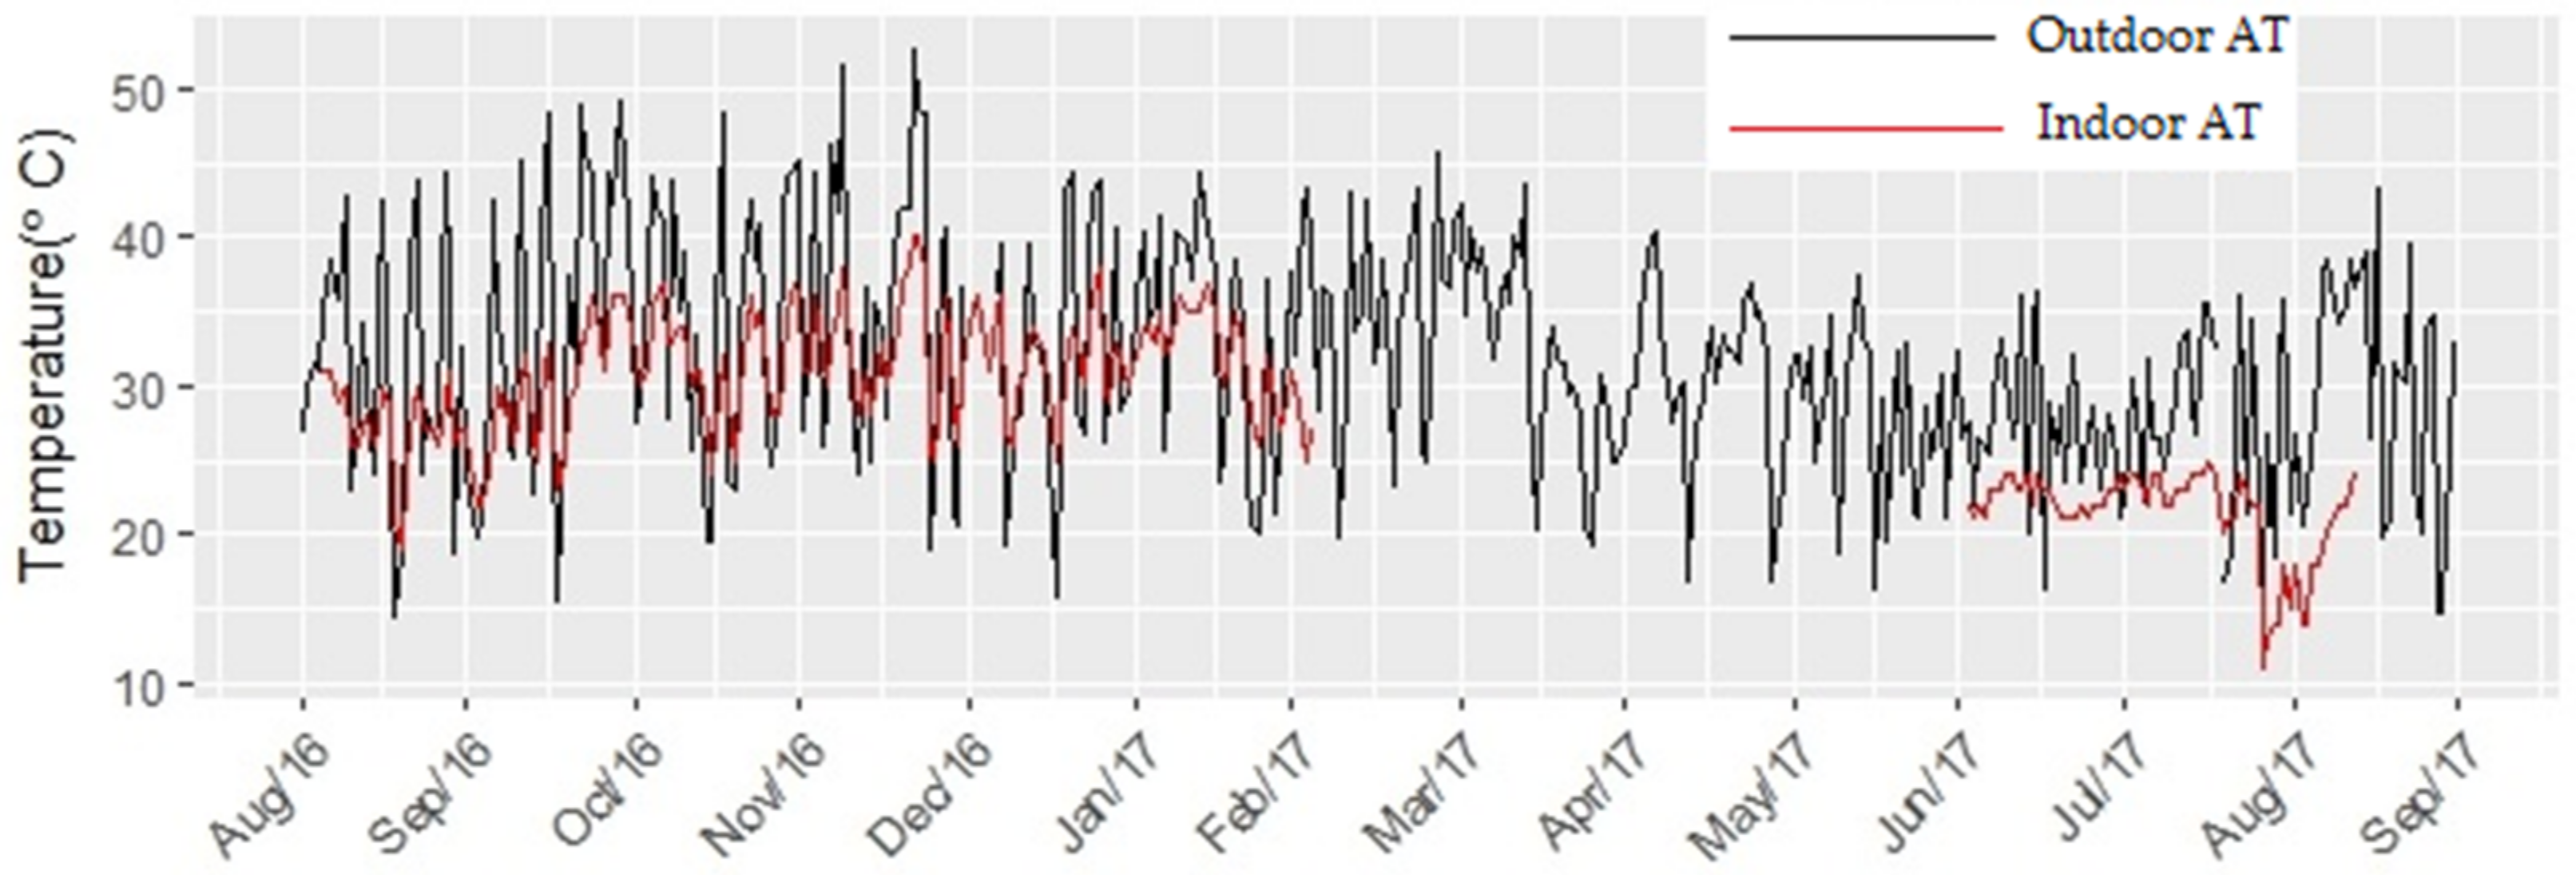
3.2. Current Seasonal Trends in Indoor and Outdoor Temperatures

The seasons are defined according to recommendations by the South African Weather Service [56]. Spring is from 1 September to 30 November; summer is from 1 December to 28/29 February; and winter is from 1 June to 31 August. Table 3 provides a summary of ambient and indoor meteorological conditions recorded during summer, spring, and winter. Mean AT was highest in summer for both outdoor and indoor environments, 33.8 °C and 32.2 °C, respectively. The highest maximum outdoor temperature and highest maximum calculated AT both occurred in summer (41.3 °C and 52.8 °C, respectively). Heat-related illnesses, and in extreme events deaths, have been associated with ambient temperatures above 35 °C [57,58]. Outdoor temperatures exceeded 35 °C for 43 days during the study period (236 days), with most of these days occurring in summer and spring.
Outdoor AT exceeded indoor AT by about 3.6 °C for the duration of the study period (Figure 3). Daily average outdoor AT and indoor AT displayed pronounced seasonal fluctuations; both were higher in summer months (December to February) and spring (September to November) compared to winter (July to August). A two-sample t-test showed that the difference between indoor and outdoor AT was statistically significant (p < 0.001).

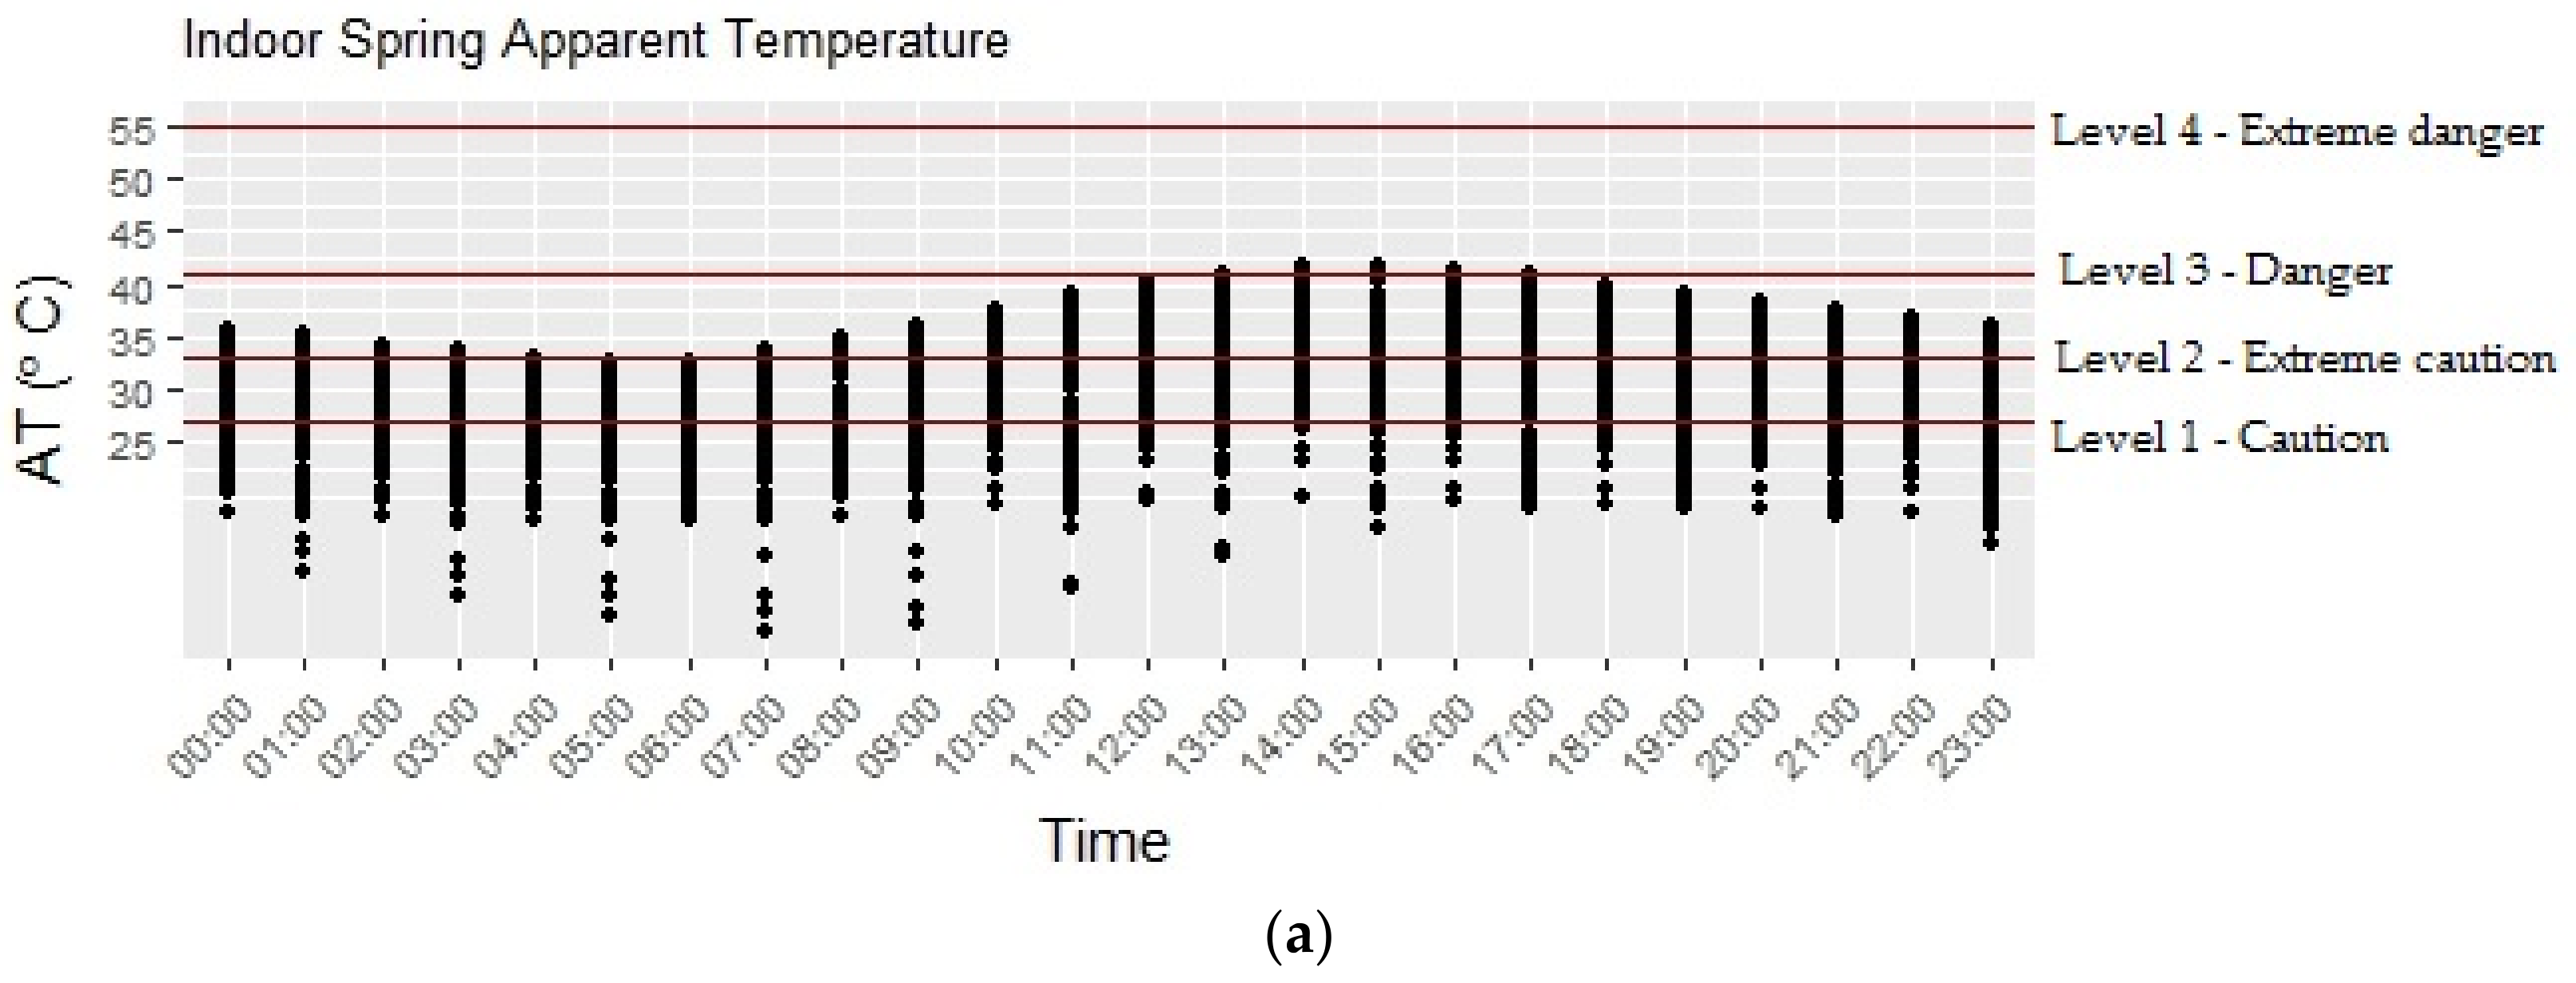
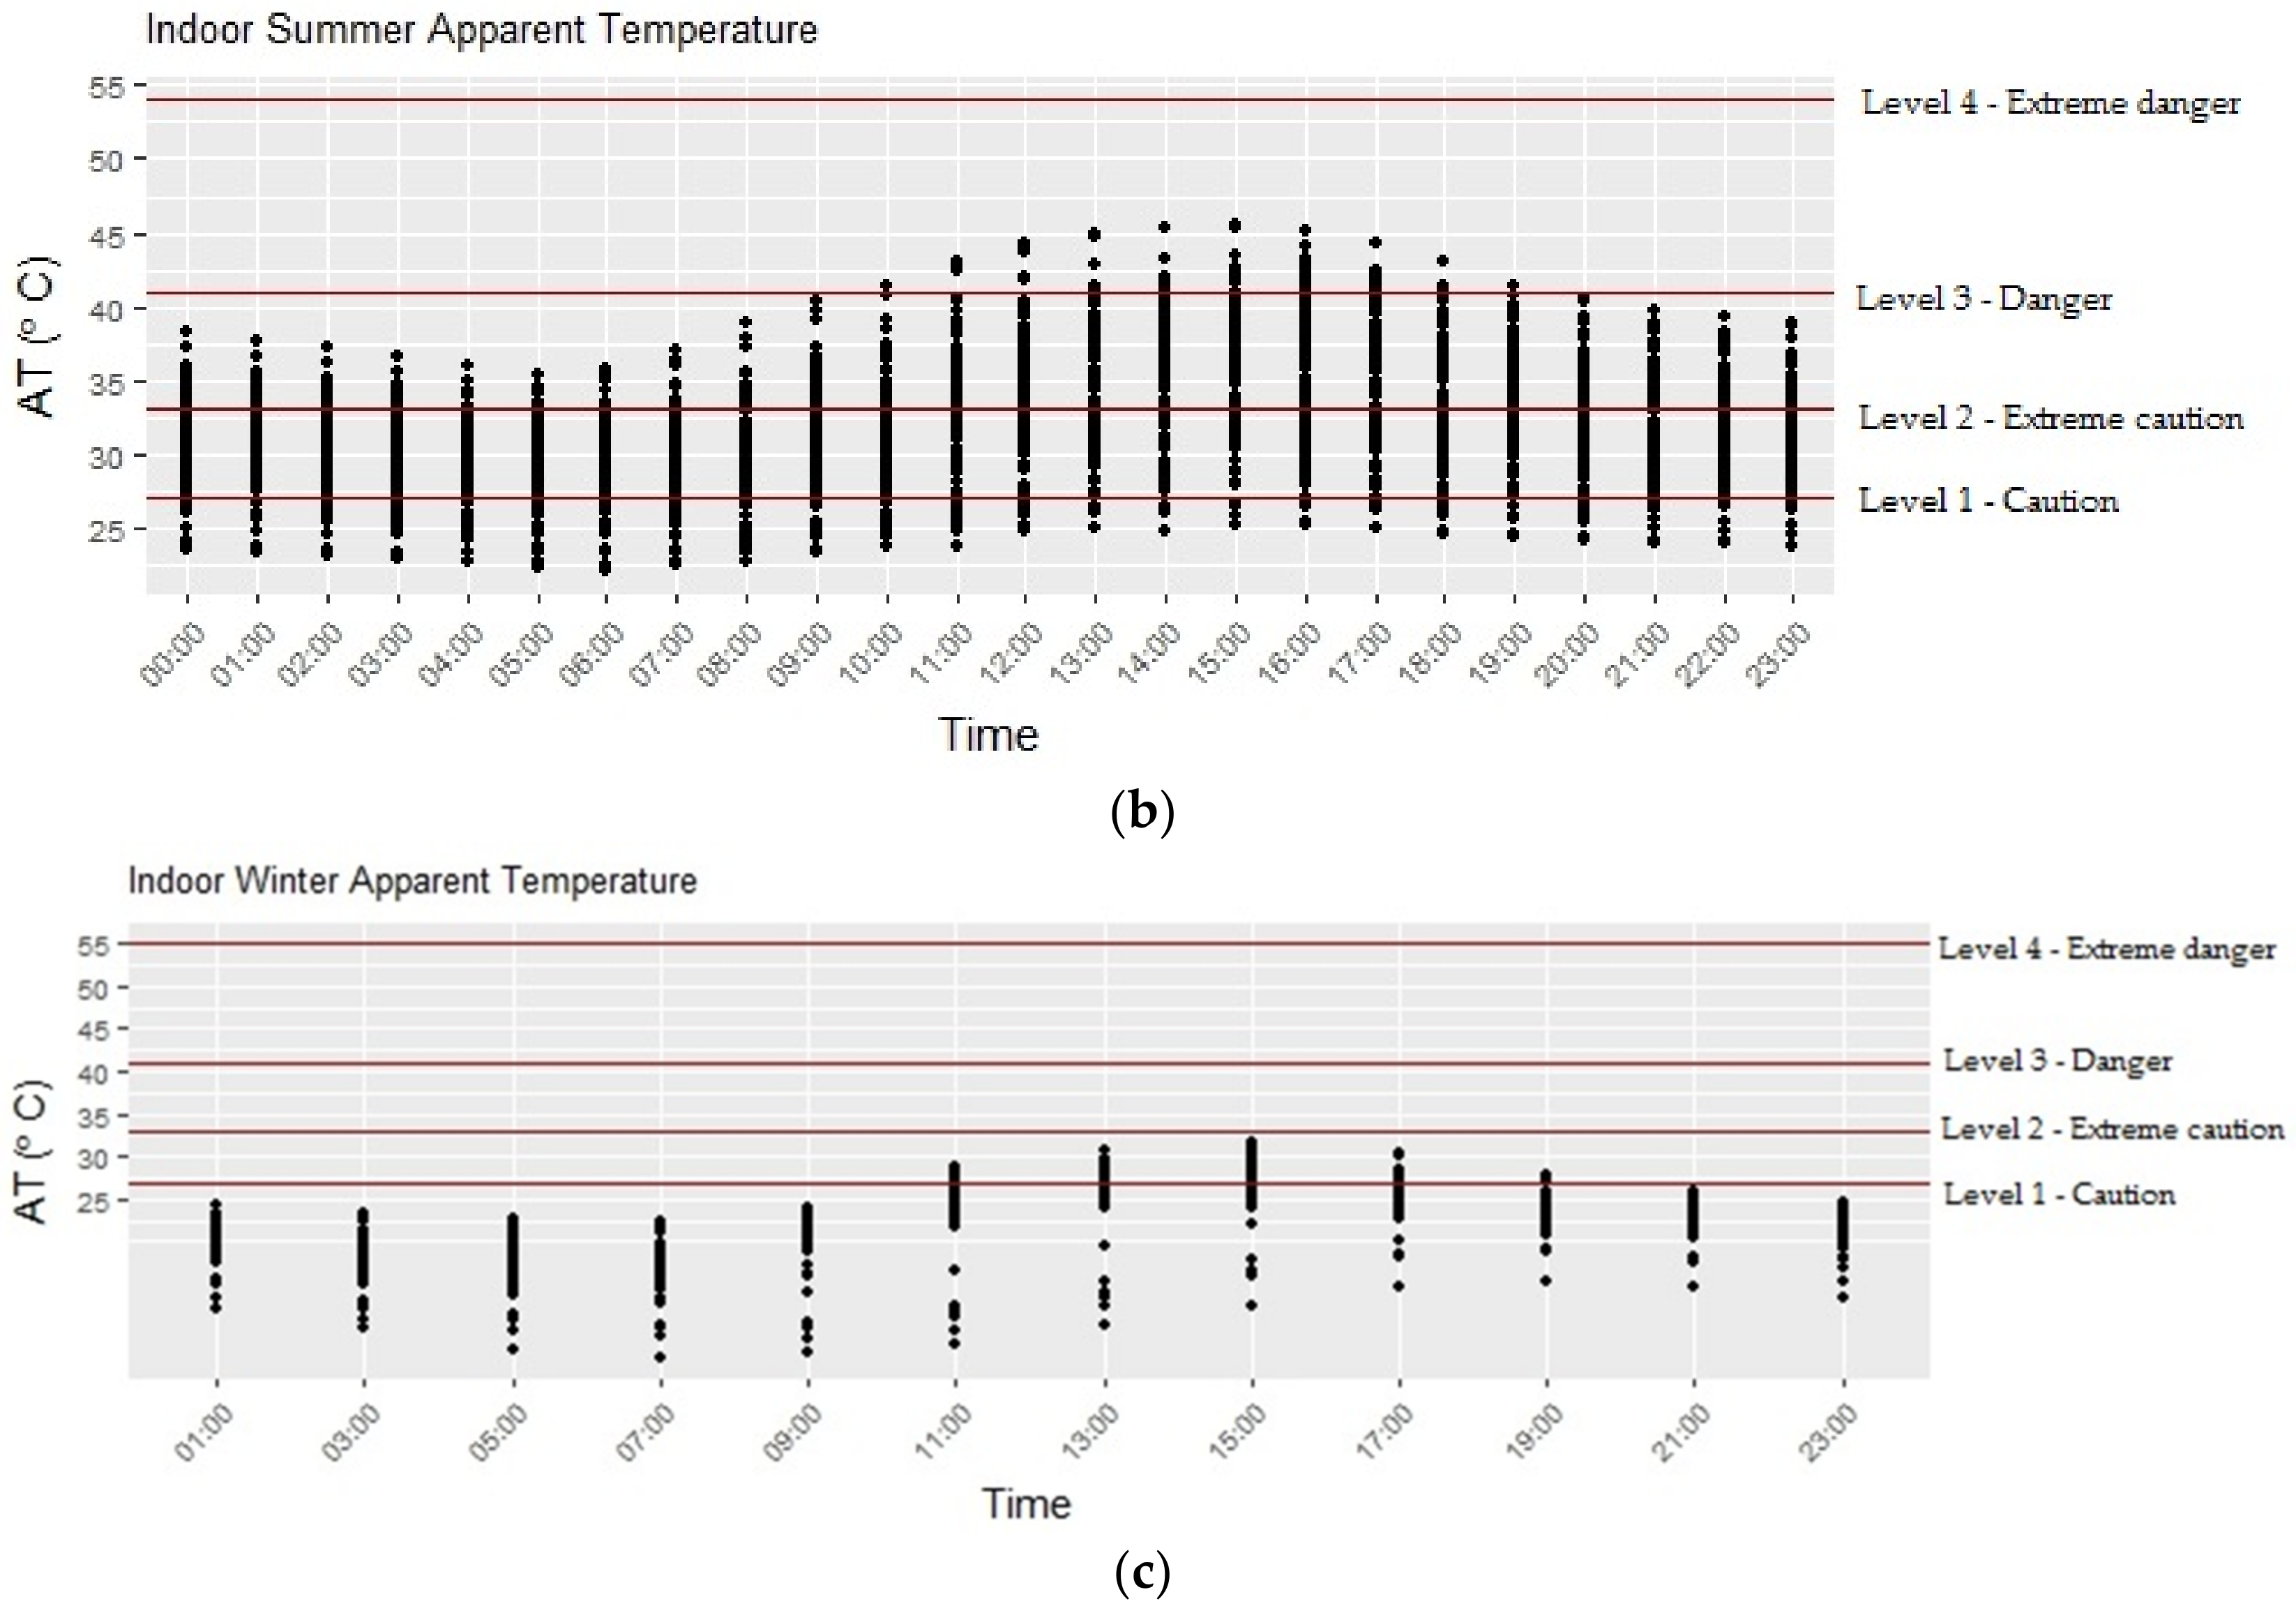
3.3. Current Likely Health Risks Based on AT Calculations of Indoor Temperatures

Daily indoor AT was within each of the symptom bands in Table 1 for several days during the study period; 78 days were within the caution band and 61 days were within the more severe extreme caution band. Figure 4a–c illustrate the diurnal patterns of indoor AT calculated for summer, spring, and winter. Indoor AT gradually increased throughout the day, peaking between 1:00 p.m. and 3:00 p.m. on most days. It then began to decrease after 4:00 p.m. AT in most homes generally appeared to fall within the higher symptom bands (caution and extreme caution) from mid-morning to early afternoon during all seasons. During most hours of the day in summer, indoor AT was classified as caution or extreme caution. AT was also classified as being in the danger symptom band between 11:00 a.m. and 6:00 p.m. in several homes during the summer season. During spring, fewer hours than in summer were within the more severe symptom bands; however, some homes had a few hours within the extreme caution band. In winter, the highest symptom band to which AT rose was the caution symptom band between 11:00 a.m. and 5:00 p.m.

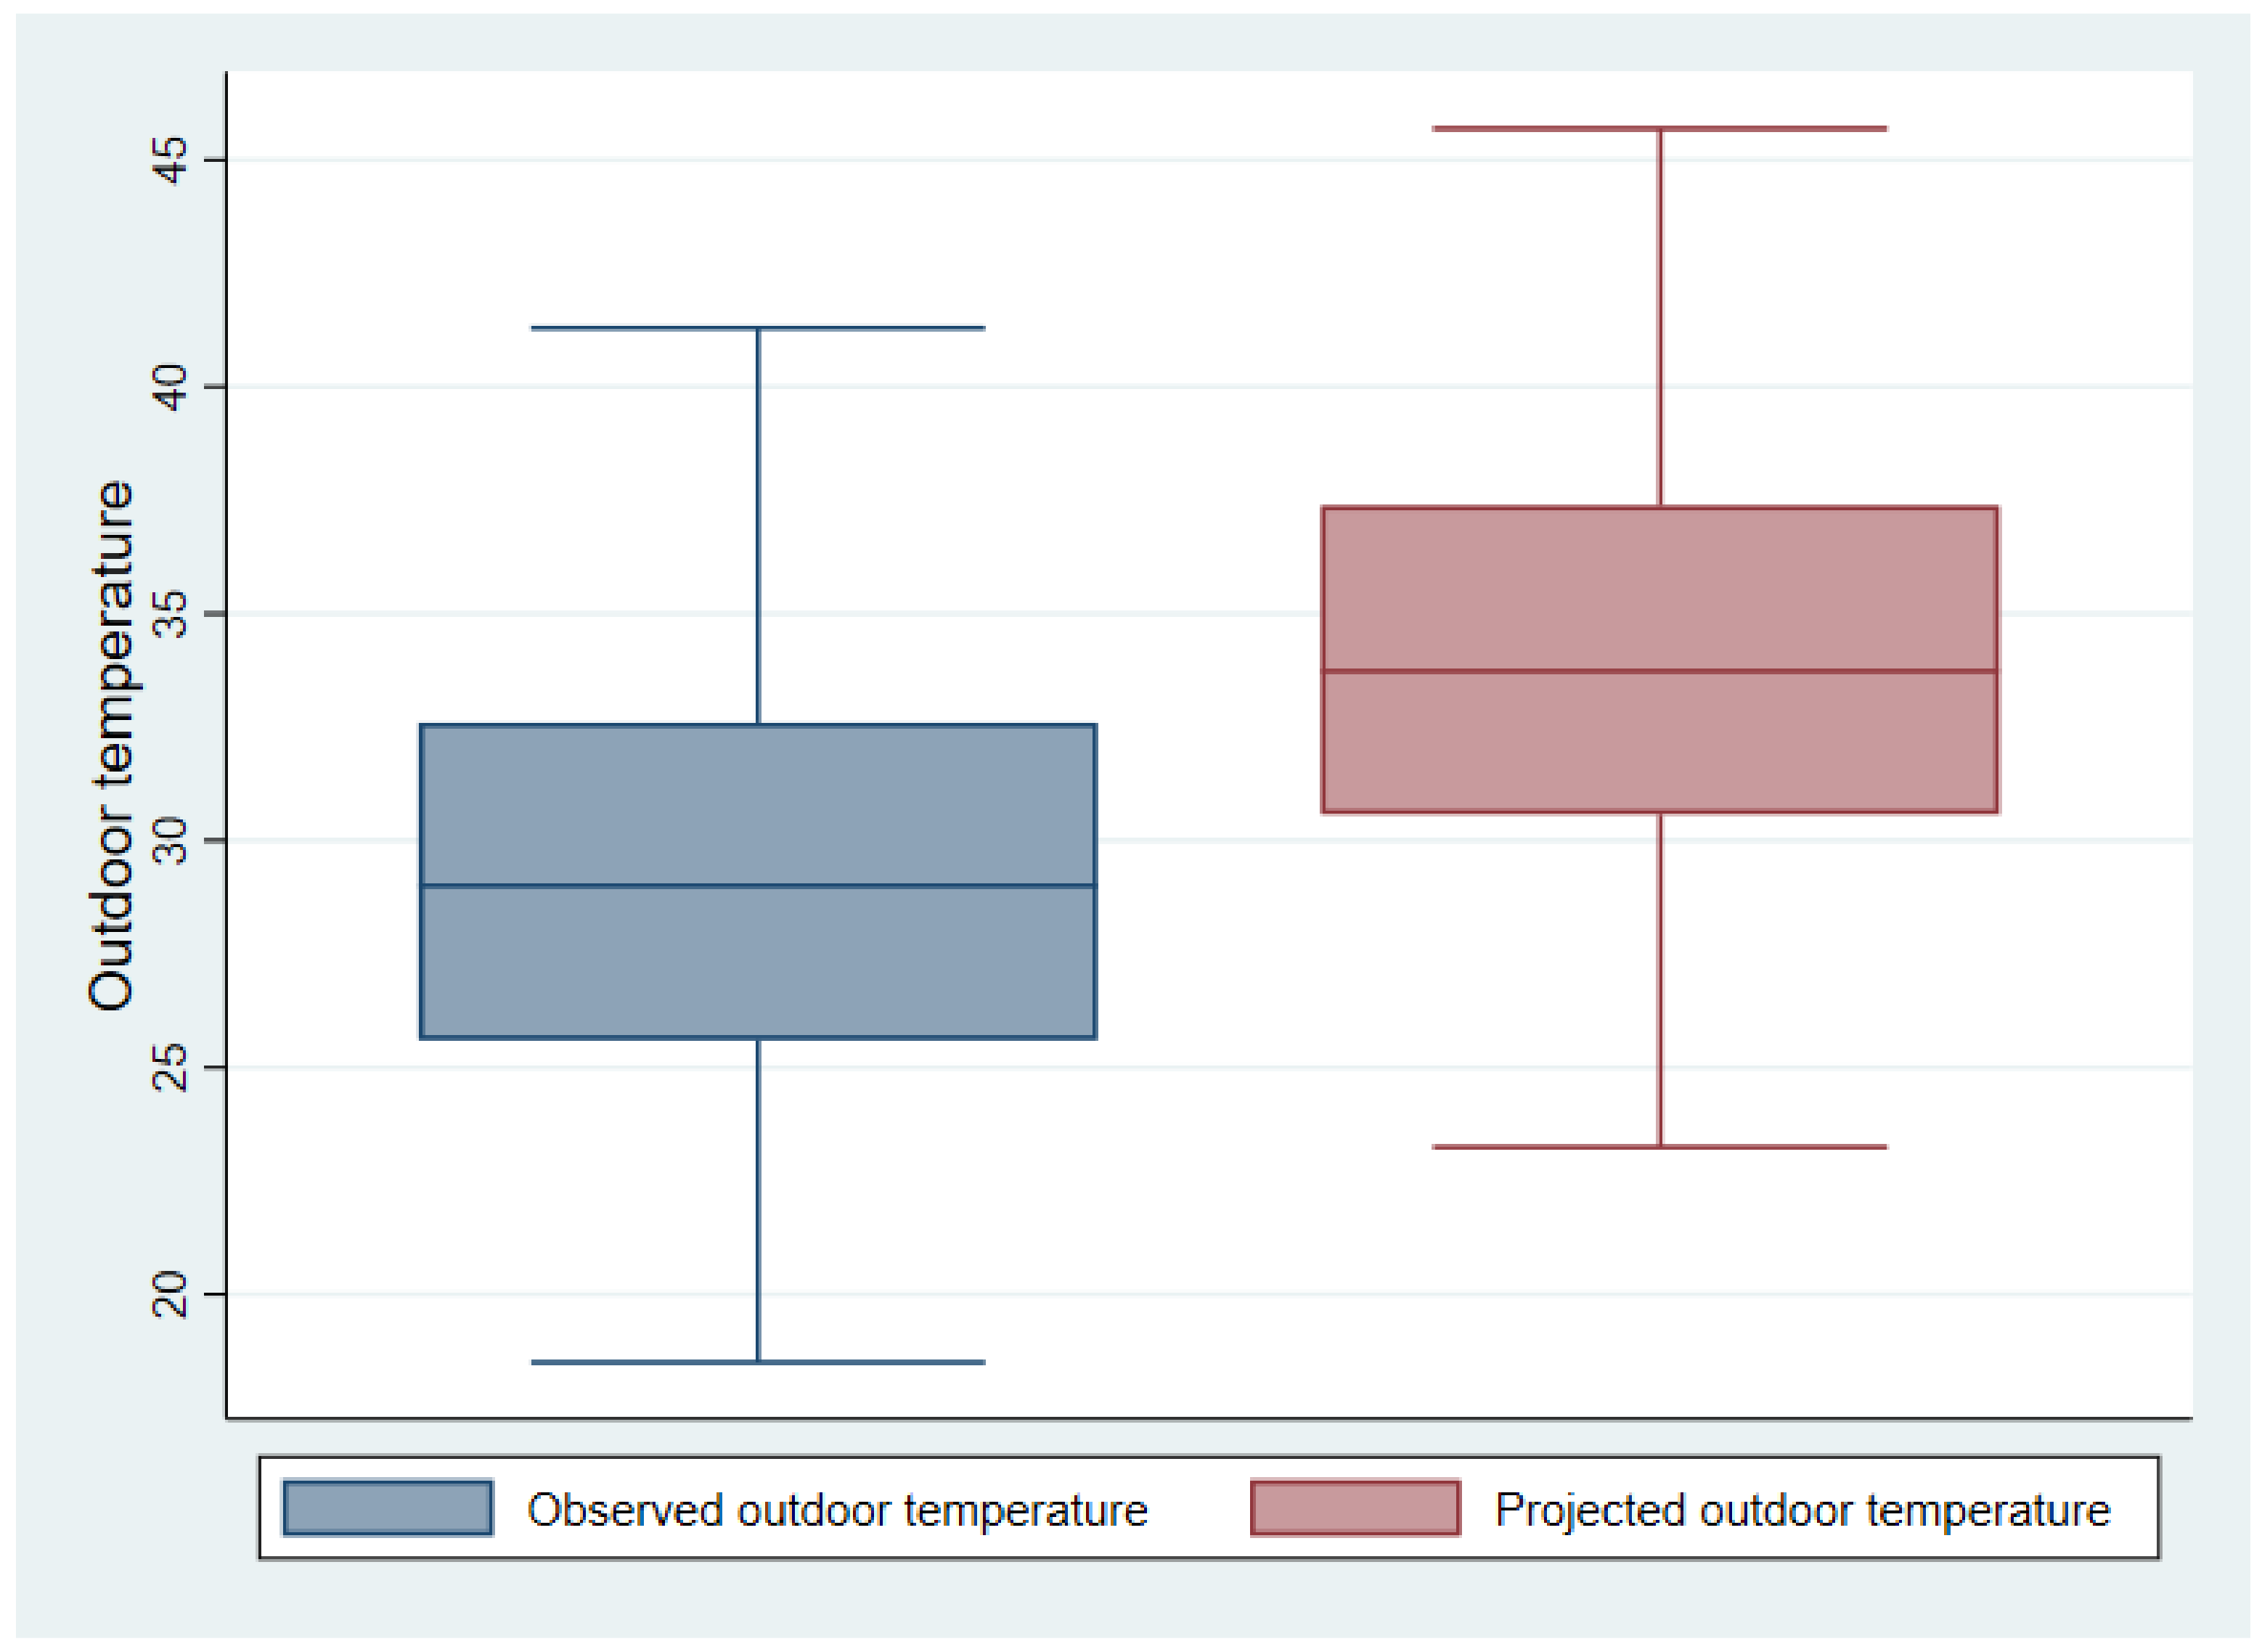
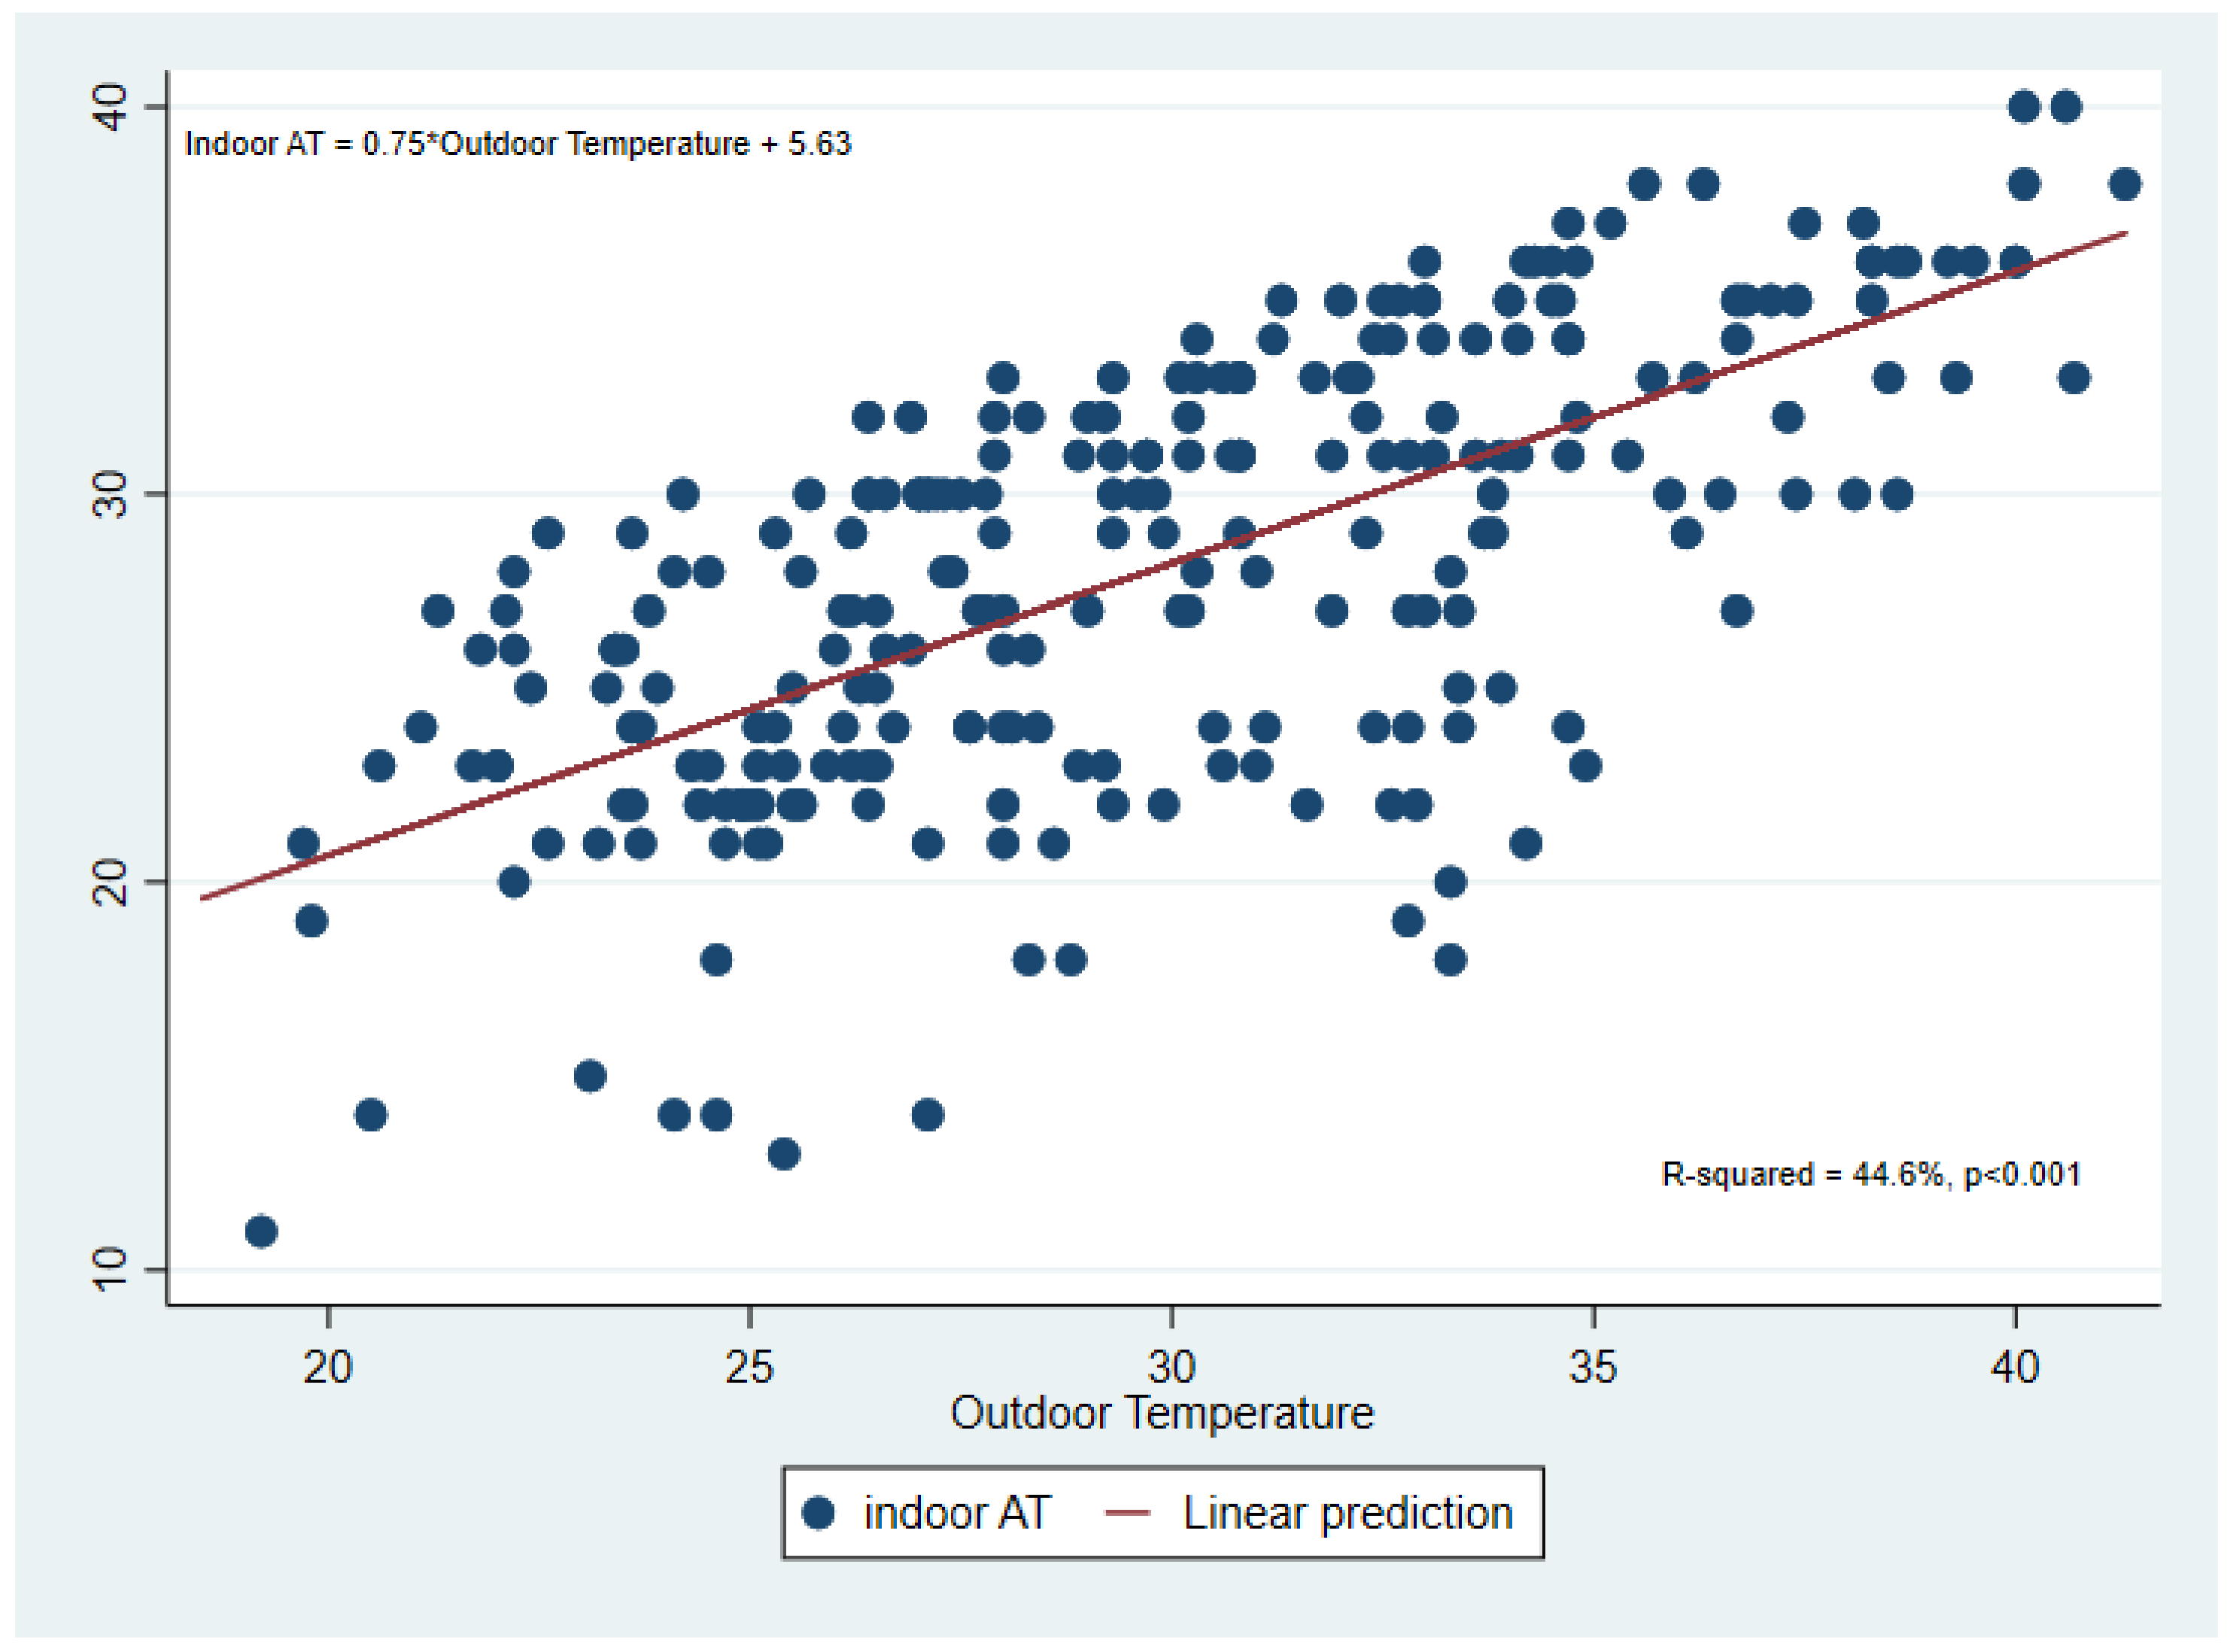
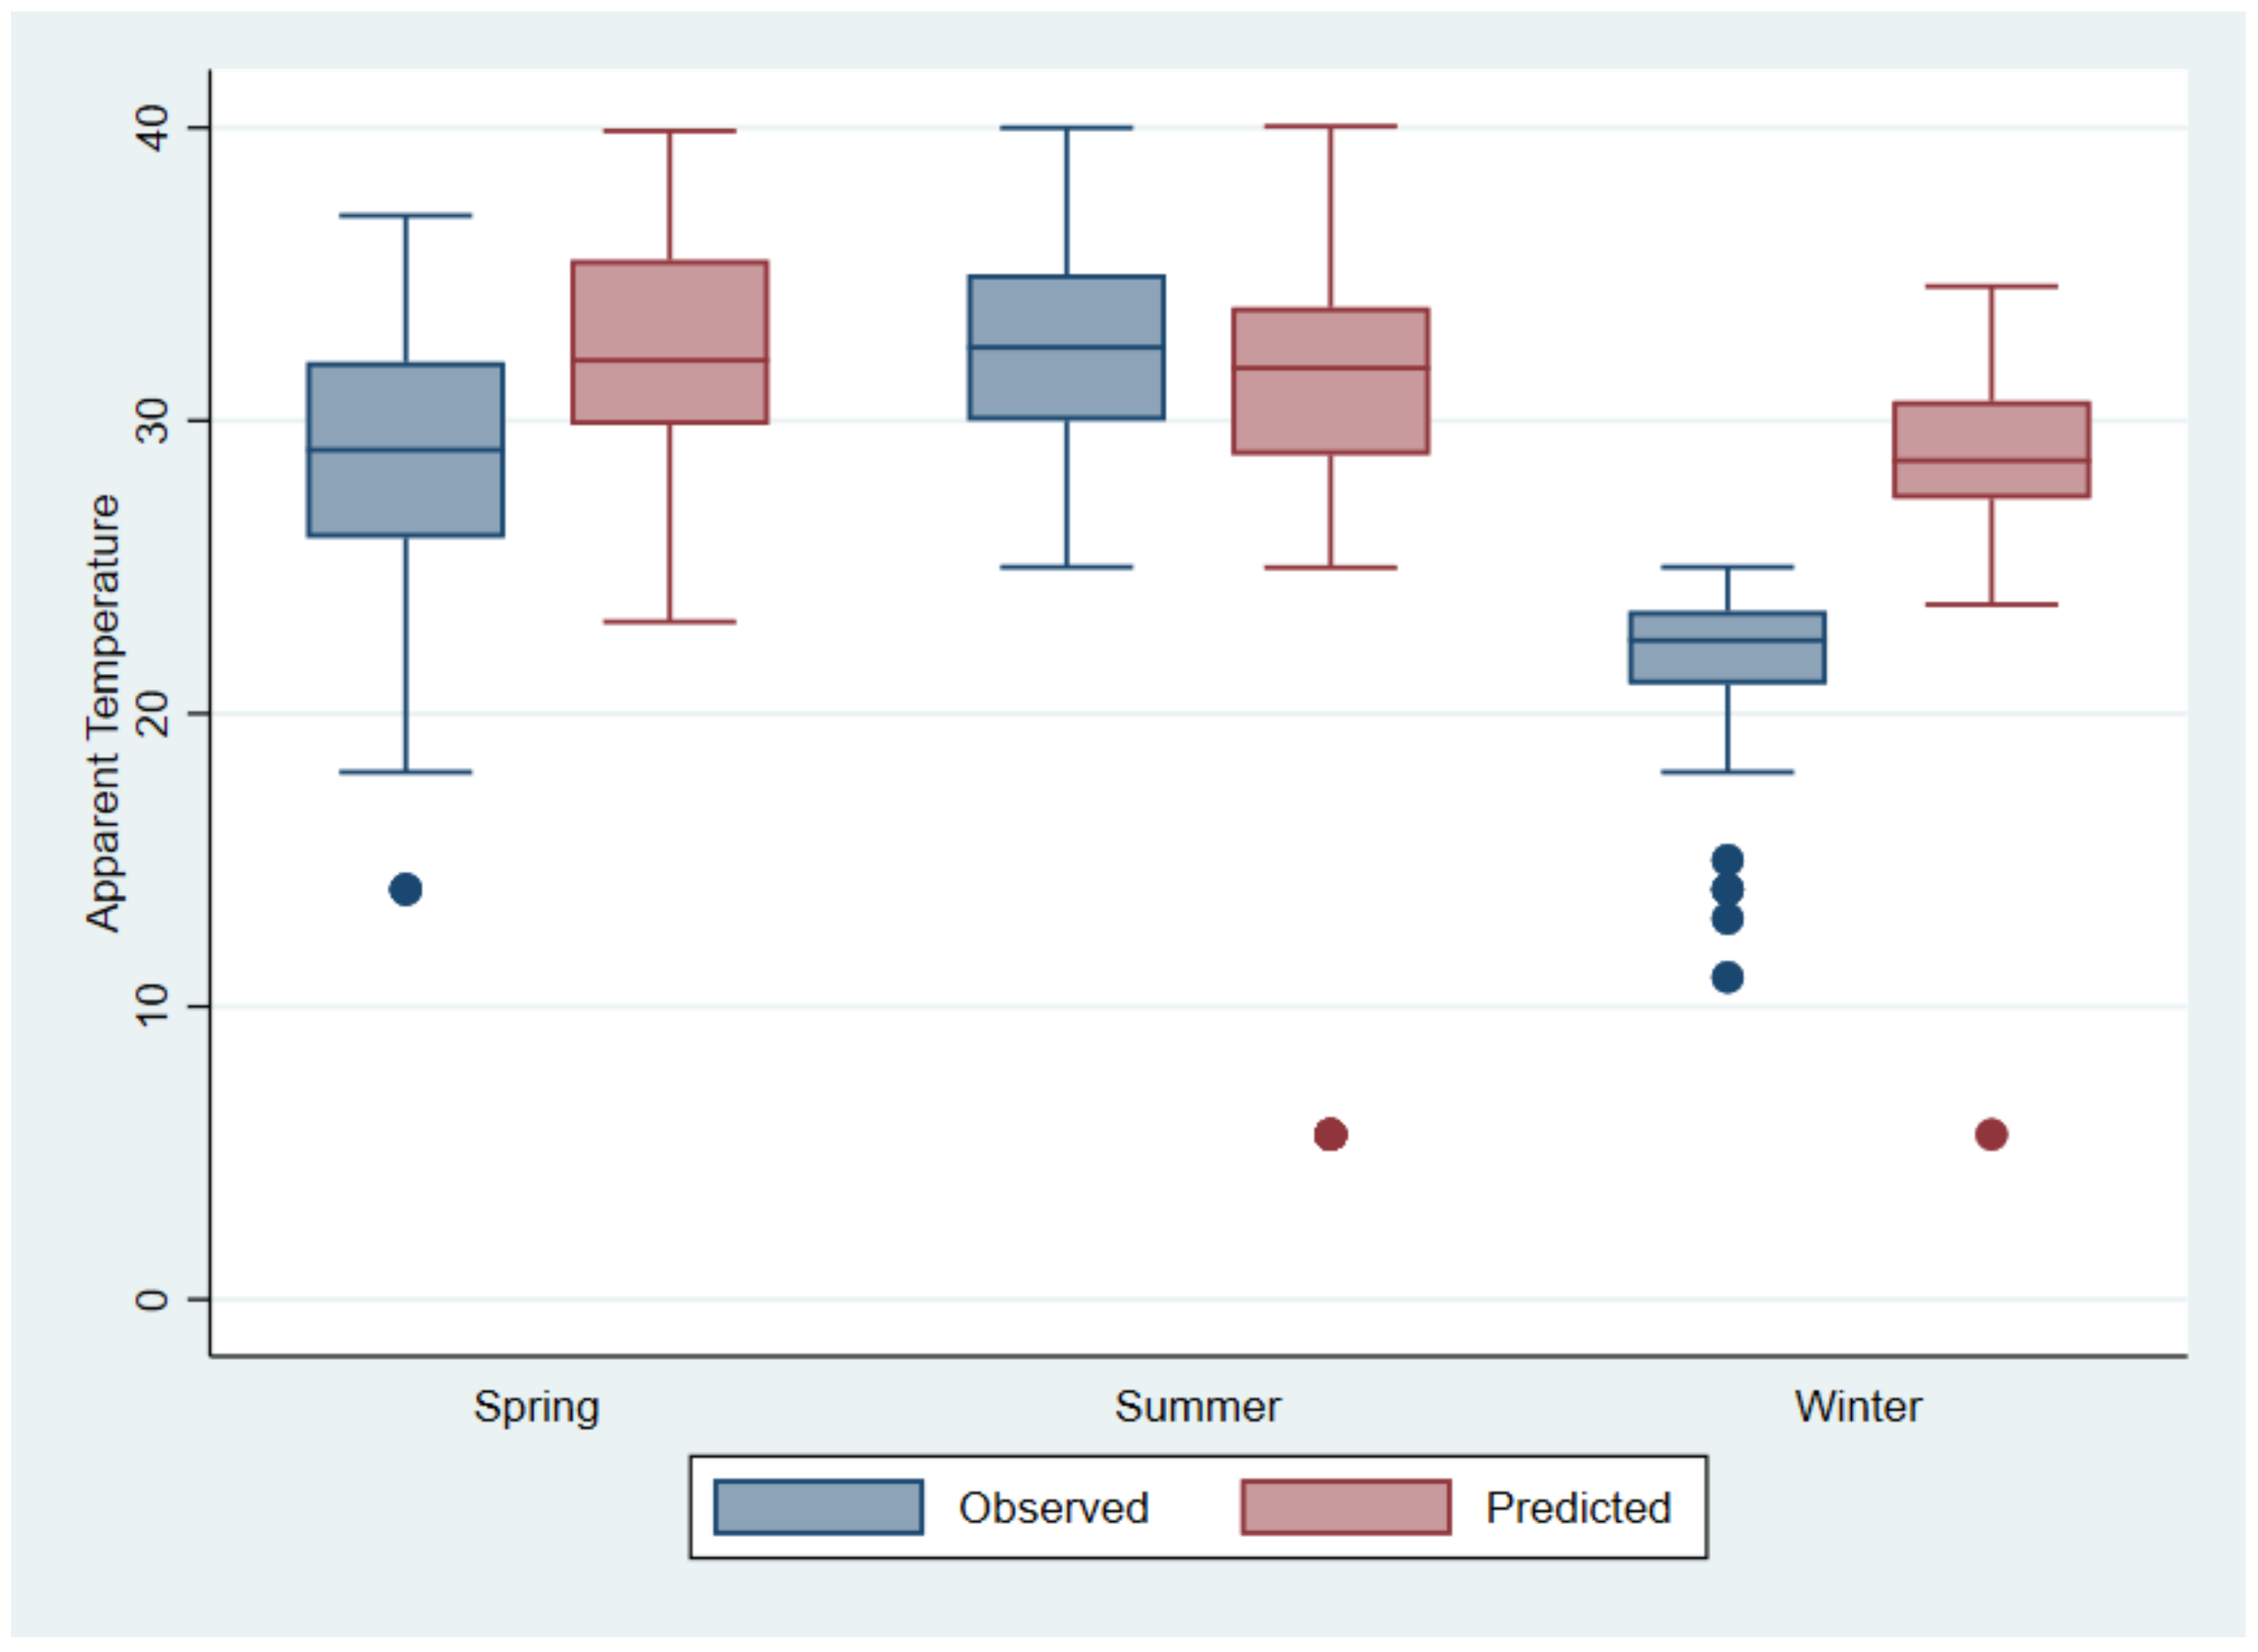
3.4. Potential Future Temperature and Associated Heat-Health Risks

To identify if ambient temperature and AT can be used to predict indoor conditions that dwelling occupants could experience, multiple linear regression was used to analyze the association between indoor AT and ambient temperature and AT. The multiple regression model explained 45.2% of the variance in indoor AT (p < 0.001). Results presented in Table 4 show that outdoor temperature was most statistically significant in explaining indoor AT (β = 0.55, p = 0.001).
Regression analysis was conducted for each season and for all seasons combined. The model that explained the highest percentage of variance in indoor apparent temperature and was statistically significant was the one with the data for all seasons combined therefore this is the model is reported.
RCP 8.5 projected increases in monthly temperature were added to the outdoor temperature recorded during the study period to determine possible future estimates of ambient temperature for the study site. Based on RCP projections for South Africa, average ambient temperature in the study area in Limpopo province was estimated to increase by a mean of 4.6 °C (Figure 5). This is consistent with findings by Engelbrecht et al. (2015) that annual average temperatures in South Africa will increase by 4–6 °C over the time period 2071–2100.
Based on the findings from the multiple regression that outdoor temperature is a significant predictor of indoor AT, linear regression was used to develop a prediction model for estimating future indoor AT from projected outdoor temperature (Figure 6).
Figure 7 compares indoor observed and predicted AT (obtained from linear regression) for each season. It is evident that indoor AT is predicted to increase significantly in spring (average increase of 3.9 °C) and winter (average increase of 7.1 °C) compared to summer (average increase of 2.0 °C). Therefore, people may be at increased risk of adverse health effects due to high AT in homes not only in summer when high temperatures are expected, but also in the previously cooler seasons of spring and winter.
Table 5 shows the number of days for the study period that fall within the four symptom bands using observed and predicted indoor AT. There are more days during which predicted future indoor AT falls within the caution and extreme caution bands compared to the number of days during which observed AT falls within those same bands. There are also fewer days in the future when household occupants are likely to be exposed to (predicted) indoor ATs that do not pose a health risk, therefore suggesting overall increased risk to high AT.

4. Discussion

A large percentage of households in the study area live below the upper bound of the poverty line, with many homes receiving financial assistance from the state in the form of grants for children and the elderly. Epidemiological studies on heat and health indicate that people residing in low-income districts with low socio-economic status are at highest risk of adverse health effects due to high temperatures [26]. A study conducted in Seoul, Korea, by Kim and Joh [59] to assess the effect of an economic factor in the association between mortality and high temperature, found an increase of 1.3–1.7 fold in the mortality rate of the low-income group compared to that of the general population. Similarly, Curriero et al [60] found that the percentage of poverty was the strongest predictor of mortality risk at temperatures higher than minimum mortality temperature in 11 cities across the Eastern United States.
The ability of households to alleviate heat stress depends on the assets they can afford, such as fans and air conditioners. Only 4.2% of homes sampled in the current study used air conditioners in hot weather and only 39.2% used fans. This shows that the majority of homes are likely exposed to high temperatures that could affect the health of occupants due to the lack of resources to adapt to heat. This situation will be exacerbated in the future based on projections of ambient temperature and indoor AT in the study area that show increases in the number of hot days when heat advisory warnings are likely to be issued by the national weather broadcasting service.
The most prevalent perception of indoor conditions during hot weather was that households felt hotter indoors than outdoors (48%). A study on the perceptions of thermal comfort in classrooms in South Africa found that the majority of students reported having at least one perceived heat-related health symptom when indoor temperatures were greater than or equal to 32 °C [61]. Diurnal patterns showed that indoor AT in the sampled homes often exceeded 32 °C in summer and spring, therefore it is possible that occupants could be experiencing perceived heat-related symptoms such as tiredness, low concentration, and breathing difficulties. A limitation of our study was that only one logger was placed in each household to obtain a representation of indoor temperature and AT conditions.
Similar to Smargiassi et al [62] and White-Newsome et al [63], we assessed the capability of outdoor conditions to predict indoor heat exposure in the form of AT. Regression results showed that ambient temperature can be used to predict indoor AT. This will be beneficial in estimating health effects of high temperatures in areas where there are currently no data on indoor conditions because data on ambient temperature is more readily available than indoor data.
Predicted outdoor temperature using monthly projections provided by the RCP climate model (8.5) showed that temperature in the study area located in Limpopo province will exceed the global mean annual surface air temperature (GMAT) increase of 1.5–2 °C. Our results show that for the period 2080–2099, ambient temperatures will increase by a mean of 4.6 °C. Previous studies using the same climate model have found that in Limpopo, temperatures will increase by 4–7 °C for the period 2080–2100 [18,64]. This increase will reach a regime never observed before in the recorded climate of this region. It is therefore evident that although GMAT is relevant for global scale policy recommendations, it is not necessarily a helpful metric in a South African setting for regional planning.
There were several hours of the day in summer during which calculated hourly AT rose to above 40.6 °C, which is the threshold at which the USNWS issues a heat advisory to warn people of the possibility of adverse health effects due to heat if precautions are not taken [51]. The high indoor AT observed during the study are cause for concern because a recent study using AT to assess heat exposure found a notable increase in daily mortality for each 1 °C increase in mean AT during the warm season [65]. Furthermore, warming in winter was projected to be greater than warming in summer and spring. This is similar to observations reported by the South African Weather Service [66].
Predicted indoor AT were grouped according to the number of days that will fall within the four symptom bands from the USNWS heat index. The number of days during which indoor AT will be categorized in the more severe symptom bands (caution and extreme caution) increases significantly. Conversely, the number of days during which average daily indoor AT will not pose a health risk decrease. This is supported by studies that project that there will be fewer cold days in the future [64]. Our results show that household occupants in the study area will be exposed to higher indoor AT that will have greater risk of adverse health impacts including heat cramps, heat exhaustion, and heat stroke.
The high measured and projected outdoor and indoor temperatures emphasize the need for national and provincial comprehensive heat response plans. These plans should include forecasting and monitoring to enable relevant authorities to warn planning agencies and communities timeously of imminent extreme temperature events [67]. They should also include education and awareness programs to inform communities of potential risk factors and high-risk population groups (i.e., being elderly or very young, having pre-existing chronic conditions, using certain medication, having restricted mobility), a description of symptoms of exposure to heat and recommended responses and treatments (e.g., avoid direct sunlight, wear light-weight and light colored clothing, drink water frequently, reduce or avoid strenuous activity outdoors if possible) [68]. Due to the high cost of purchasing and running air-conditioning units, the possibility of establishing emergency cooling shelters should be investigated. Studies have shown that spending only a few hours in an air-conditioned environment reduces heat-related illnesses and death [69].

5. Conclusions

Certain sectors of the population are more vulnerable to heat-related illnesses than others, particularly those with pre-existing health conditions, the elderly, and young children—as well as economically disadvantaged communities. This study aimed to consider the relationship between indoor and outdoor environments in rural residential settings in a current climate and warmer predicted future climate. Household occupants in the study area were exposed to high indoor AT, especially in summer and spring. The potential health risk of exposure to high indoor AT is likely to be exacerbated in future scenarios. The evidence of current and future adverse health effects will indicate priorities for planned adaptive strategies and will strengthen the case for pre-emptive policies. Such observations can be used to inform the development and implementation of policies and practices around heat and health, especially in rural areas of South Africa.

Author Contributions

T.K. analyzed the data and wrote the first draft of the manuscript. All authors contributed to the writing of the manuscript and approved the final version.

Acknowledgments

We thank the local authorities for allowing us to work in the communities and the households for permitting the installation of equipment in their homes. Funding for this project was made possible through the South African Medical Research Council Seed Flagship Grant, as well as funds from National Treasury under its Economic Competitiveness and Support Package. This research was also carried out for the iDEWS (infectious Diseases Early-Warning System) project supported by SATREPS (Science and Technology Research Partnership for Sustainable Development) Program of JICA (JAPAN International Cooperation Agency)/AMED (Japan Agency for Medical Research and Development) in Japan and the ACCESS (Applied Center for Climate and Earth Systems Science) Program of NRF (National Research Foundation) and DST (Department of Science and Technology in South Africa).

Conflicts of Interest

The authors declare no conflict of interest.

References

  1. McGregor, G.R.; Bessemoulin, P.; Ebi, K.L.; Menne, B. (Eds.) Heatwaves and Health: Guidance on Warning-System Development; World Meteorological Organization: Geneva, Switzerland, 2015. [Google Scholar]
  2. Frontczak, M.; Wargocki, P. Literature survey on how different factors influence human comfort in indoor environments. Build. Environ. 2011, 46, 922–937. [Google Scholar] [CrossRef]
  3. Basu, R.; Ostro, B.D. A multicounty analysis identifying the populations vulnerable to mortality associated with high ambient temperature in California. Am. J. Epidemiol. 2008, 168, 632–637. [Google Scholar] [CrossRef] [PubMed]
  4. Kovats, R.S.; Hajat, S. Heat stress and public health: A critical review. Annu. Rev. Public Health 2008, 29, 41–55. [Google Scholar] [CrossRef] [PubMed]
  5. Saez, M.; Sunyer, J.; Castellsague, J.; Murillo, C.; Anto, J.M. Relationship between weather temperature and mortality: A time series analysis approach in Barcelona. Int. J. Epidemiol. 1995, 24, 576–582. [Google Scholar] [CrossRef] [PubMed]
  6. Centers for Disease Control and Prevention. Impact of heat waves on mortality—Rome, Italy, June-August 2003. MMWR Morb. Mortal. Wkly. Rep. 2004, 53, 369–371. [Google Scholar]
  7. Yang, J.; Ou, C.Q.; Ding, Y.; Zhou, Y.X.; Chen, P.Y. Daily temperature and mortality: A study of distributed lag non-linear effect and effect modification in Guangzhou. Environ. Health 2012, 11, 63. [Google Scholar] [CrossRef] [PubMed]
  8. Kruger, A.; Sekele, S. Trends in extreme temperature indices in South Africa: 1962–2009. Int. J. Climatol. 2013, 33, 661–676. [Google Scholar] [CrossRef]
  9. Smith, T.M.; Reynolds, R.W. A global merged land–air–sea surface temperature reconstruction based on historical observations (1880–1997). J. Clim. 2005, 18, 2021–2036. [Google Scholar] [CrossRef]
  10. Lugina, K.; Groisman, P.Y.; Vinnikov, K.Y.; Kocknaeva, V.V.; Speranskaya, N.A. Monthly Surface Air Temperature Time Series Area-Averaged over the 30-Degree Latitudinal Belts of the Globe; Carbon Dioxide Information Analysis Center (CDIAC), Oak Ridge National Laboratory, U.S. Department of Energy: Oak Ridge, TN, USA, 2006.
  11. Caesar, J.; Alexander, L.; Vose, R. Large-scale changes in observed daily maximum and minimum temperatures: Creation and analysis of a new gridded data set. J. Geophys. Res. Atmos. 2006, 111. [Google Scholar] [CrossRef]
  12. UNFCCC. UNFCCC. UNFCCC Conference of the Parties (COP). In Adoption of the Paris Agreement; FCCC/CP/2015/L.9/Rev.1; United Nations Office: Geneva, Switzerland, 2015. [Google Scholar]
  13. Patz, J.A.; Campbell-Lendrum, D.; Holloway, T.; Foley, J.A. Impact of regional climate change on human health. Nature 2005, 438, 310–317. [Google Scholar] [CrossRef] [PubMed]
  14. Vardoulakis, S.; Dear, K.; Hajat, S.; Heaviside, C.; Eggen, B.; McMichael, A.J. Comparative assessment of the effects of climate change on heat-and cold-related mortality in the United Kingdom and Australia. Environ. Health Perspect. 2014, 122, 1285–1292. [Google Scholar] [CrossRef] [PubMed]
  15. Russo, S.; Marchese, A.F.; Sillmann, J.; Immé, G. When will unusual heat waves become normal in a warming Africa? Environ. Res. Lett. 2016, 11, 054016. [Google Scholar] [CrossRef]
  16. Clark, R.T.; Brown, S.J.; Murphy, J.M. Modeling northern hemisphere summer heat extreme changes and their uncertainties using a physics ensemble of climate sensitivity experiments. J. Clim. 2006, 19, 4418–4435. [Google Scholar] [CrossRef]
  17. Fischer, E.M.; Beyerle, U.; Knutti, R. Robust spatially aggregated projections of climate extremes. Nat. Clim. Chang. 2013, 3, 1033. [Google Scholar] [CrossRef]
  18. Engelbrecht, F.; Adegoke, J.; Bopape, M.J.; Naidoo, M.; Garland, R.; Thatcher, M.; McGregor, J.; Katzfey, J.; Werner, M.; Ichoku, C.; et al. Projections of rapidly rising surface temperatures over Africa under low mitigation. Environ. Res. Lett. 2015, 10, 085004. [Google Scholar] [CrossRef]
  19. Blum, L.N.; Bresolin, L.B.; Williams, M.A. Heat-related illness during extreme weather emergencies. JAMA 1998, 279, 1514–1514. [Google Scholar] [PubMed]
  20. Jardine, D.S. Heat illness and heat stroke. Pediatr. Rev. 2007, 28, 249. [Google Scholar] [CrossRef] [PubMed]
  21. Centers for Disease Control and Prevention. Heat-related deaths—Dallas, Wichita, and Cooke counties, Texas, and United States, 1996. MMWR Morb. Mortal. Wkly. Rep. 1997, 46, 528–531. [Google Scholar]
  22. Bai, L.; Li, Q.; Wang, J.; Lavigne, E.; Gasparrini, A.; Copes, R.; Yagouti, A.; Burnett, R.T.; Goldberg, M.S.; Villeneuve, P.J.; et al. Hospitalizations from hypertensive diseases, diabetes, and arrhythmia in relation to low and high temperatures: Population-based study. Sci. Rep. 2016, 6, 30283. [Google Scholar] [CrossRef] [PubMed]
  23. Lin, S.; Luo, M.; Walker, R.J.; Liu, X.; Hwang, S.A.; Chinery, R. Extreme High Temperatures and Hospital Admissions for Respiratory and Cardiovascular Diseases. Epidemiology 2009, 20, 738–746. [Google Scholar] [CrossRef] [PubMed]
  24. Díaz, J.; Linares, C.; Tobías, A. A critical comment on heat wave response plans. Eur. J. Public Health 2006, 16, 600. [Google Scholar] [CrossRef] [PubMed]
  25. Tong, S.; Wang, X.Y.; Barnett, A.G. Assessment of heat-related health impacts in Brisbane, Australia: Comparison of different heatwave definitions. PLoS ONE 2010, 5, e12155. [Google Scholar] [CrossRef] [PubMed] [Green Version]
  26. Basu, R.; Samet, J.M. Relation between elevated ambient temperature and mortality: A review of the epidemiologic evidence. Epidemiol. Rev. 2002, 24, 190–202. [Google Scholar] [CrossRef] [PubMed]
  27. IPCC. Intergovernmental Panel on Climate Change (IPCC)—Working Group II: Impacts, Adaptation and Vulnerability. Available online: http://www.ipcc.ch/ipccreports/tar/wg2/index.php?idp=353 (accessed on 9 October 2017).
  28. Azongo, D.K.; Awine, T.; Wak, G.; Binka, F.N.; Rexford Oduro, A. A time series analysis of weather variables and all-cause mortality in the Kasena-Nankana Districts of Northern Ghana, 1995–2010. Glob. Health Action 2012, 5, 19073. [Google Scholar] [CrossRef] [PubMed]
  29. Diboulo, E.; Sie, A.; Rocklöv, J.; Niamba, L.; Ye, M.; Bagagnan, C.; Sauerborn, R. Weather and mortality: A 10 year retrospective analysis of the Nouna Health and Demographic Surveillance System, Burkina Faso. Glob. Health Action 2012, 5, 19078. [Google Scholar] [CrossRef] [PubMed]
  30. Egondi, T.; Kyobutungi, C.; Kovats, S.; Muindi, K.; Ettarh, R.; Rocklöv, J. Time-series analysis of weather and mortality patterns in Nairobi’s informal settlements. Glob. Health Action 2012, 5, 19065. [Google Scholar] [CrossRef] [PubMed]
  31. McMichael, A.J.; Wilkinson, P.; Kovats, R.S.; Pattenden, S.; Hajat, S.; Armstrong, B.; Vajanapoom, N.; Niciu, E.M.; Mahomed, H.; Kingkeow, C.; et al. International study of temperature, heat and urban mortality: The ‘ISOTHURM’ project. Int. J. Epidemiol. 2008, 37, 1121–1131. [Google Scholar] [CrossRef] [PubMed]
  32. Scovronick, N.; Sera, F.; Acquaotta, F.; Garzena, D.; Fratianni, S.; Wright, C.Y.; Gasparrini, A. The association between ambient temperature and mortality in South Africa: A time-series analysis. Environ. Res. 2018, 161, 229–235. [Google Scholar] [CrossRef] [PubMed]
  33. Mathee, A.; Oba, J.; Rose, A. Climate change impacts on working people (the HOTHAPS initiative): Findings of the South. African pilot study. Glob. Health Action 2010, 3, 5612. [Google Scholar] [CrossRef] [PubMed]
  34. Wright, C.; Coetzee, G.; Ncongwane, K. Seasonal trends in potential sunburn risk among outdoor workers in South. Africa using monitored ambient solar UV radiation levels. Occup. Health S. Afr. 2011, 17, 22–29. [Google Scholar]
  35. McGregor, G.R.; Felling, M.; Wolf, T.; Gosling, S. The social impacts of heat waves. In The Social Impacts of Heat Waves; Environment Agency: Bristol, UK, 2007. [Google Scholar]
  36. Van Vuuren, D.P.; Edmonds, J.; Kainuma, M.; Riahi, K.; Thomson, A.; Hibbard, K.; Hurtt, G.C.; Kram, T.; Krey, V.; Lamarque, J.F.; et al. The representative concentration pathways: An overview. Clim. Chang. 2011, 109, 5. [Google Scholar] [CrossRef]
  37. Moss, R.; Babiker, W.; Brinkman, S.; Calvo, E.; Carter, T.; Edmonds, J.; Elgizouli, I.; Emori, S.; Erda, L.; Hibbard, K.; et al. Towards New Scenarios for the Analysis of Emissions: Climate Change, Impacts and Response Strategies; Intergovernmental Panel on Climate Change Secretariat (IPCC): Geneva, Switzerland, 2008. [Google Scholar]
  38. Symon, C. Climate Change: Actions, Trends and Implications for Business; The IPCC Fifth Assessment Report, Working Group 1; Cambridge University Press: Cambridge, UK, 2013. [Google Scholar]
  39. Stats, S.A. Library Cataloguing-in-Publication (CIP) Data; 2011 Statistical Release; Statistics South Africa Census: Pretoria, South Africa, 2011.
  40. Statstistics South Africa Living Conditions Survey: 2014/2015. Available online: http://www.statssa.gov.za/publications/P0310/P03102014.pdf (accessed on 22 September 2017).
  41. Cook, C.; Reason, C.J.; Hewitson, B.C. Wet and dry spells within particularly wet and dry summers in the South African summer rainfall region. Clim. Res. 2004, 26, 17–31. [Google Scholar] [CrossRef]
  42. Levey, K.M.; Jury, M.R. Composite intraseasonal oscillations of convection over Southern Africa. J. Clim. 1996, 9, 1910–1920. [Google Scholar] [CrossRef]
  43. Tennant, W.J.; Hewitson, B.C. Intra-seasonal rainfall characteristics and their importance to the seasonal prediction problem. Int. J. Climatol. 2002, 22, 1033–1048. [Google Scholar] [CrossRef]
  44. Kruger, A.C.; Shongwe, S. Temperature trends in South Africa: 1960–2003. Int. J. Climatol. 2004, 24, 1929–1945. [Google Scholar] [CrossRef]
  45. Mahlobo, D.; Kruger, A.; Funde, S.; Phakula, S. Climate Services & SAWS. 2013. Available online: http://www.wmo.int/pages/prog/wcp/wcdmp/documents/SouthAfrica.pdf (accessed on 14 March 2018).
  46. Garland, R.M.; Matooane, M.; Engelbrecht, F.A.; Bopape, M.J.M.; Landman, W.A.; Naidoo, M.; Merwe, J.V.D.; Wright, C.Y. Regional projections of extreme apparent temperature days in Africa and the related potential risk to human health. Int. J. Environ. Res. Public Health 2015, 12, 12577–12604. [Google Scholar] [CrossRef] [PubMed]
  47. Harlan, S.L.; Brazel, A.J.; Prashad, L.; Stefanov, W.L.; Larsen, L. Neighborhood microclimates and vulnerability to heat stress. Soc. Sci. Med. 2006, 63, 2847–2863. [Google Scholar] [CrossRef] [PubMed]
  48. Watts, J.D.; Kalkstein, L.S. The development of a warm-weather relative stress index for environmental applications. J. Appl. Meteorol. 2004, 43, 503–513. [Google Scholar] [CrossRef]
  49. Baccini, M.; Biggeri, A.; Accetta, G.; Kosatsky, T.; Katsouyanni, K.; Analitis, A.; Anderson, H.R.; Bisanti, L.; D’ippoliti, D.; Danova, J.; et al. Heat effects on mortality in 15 European cities. Epidemiology 2008, 19, 711–719. [Google Scholar] [CrossRef] [PubMed]
  50. Steadman, R.G. Norms of apparent temperature in Australia. Aust. Meteorol. Mag. 1994, 43, 1–16. [Google Scholar]
  51. NOAA. Available online: http://www.nws.noaa.gov/om/heat/heat_index.shtml (accessed on 12 July 2017).
  52. Stata Corp. Statistical Software: Release 14.0; Stata Corporation: College Station, TX, USA, 2001. [Google Scholar]
  53. The World Bank Climate Change Knowledge Portal for. Development Practitioners and Policy Makers. Available online: http://sdwebx.worldbank.org/climateportal/index.cfm?page=country_future_climate&ThisRegion=Africa&ThisCcode=ZAF (accessed on 16 November 2017).
  54. Riahi, K.; Grübler, A.; Nakicenovic, N. Scenarios of long-term socio-economic and environmental development under climate stabilization. Technol. Forecast. Soc. Chang. 2007, 74, 887–935. [Google Scholar] [CrossRef]
  55. Metadata of the Climate Change Knowledge Portal. Available online: http://sdwebx.worldbank.org/climateportal/doc/Metadata_2017.pdf (accessed on 20 April 2018).
  56. SAWS. Available online: http://www.weathersa.co.za/learning/weather-questions/82-how-are-the-dates-of-the-four-seasons-worked-out (accessed on 12 July 2017).
  57. Nitschke, M.; Tucker, G.R.; Hansen, A.L.; Williams, S.; Zhang, Y.; Bi, P. Impact of two recent extreme heat episodes on morbidity and mortality in Adelaide, South Australia: A case-series analysis. Environ. Health 2011, 10, 42. [Google Scholar] [CrossRef] [PubMed]
  58. Bai, L.; Ding, G.; Gu, S.; Bi, P.; Su, B.; Qin, D.; Xu, G.; Liu, Q. The effects of summer temperature and heat waves on heat-related illness in a coastal city of China, 2011–2013. Environ. Res. 2014, 132, 212–219. [Google Scholar] [CrossRef] [PubMed]
  59. Kim, Y.; Joh, S. A vulnerability study of the low-income elderly in the context of high temperature and mortality in Seoul, Korea. Sci. Total Environ. 2006, 371, 82–88. [Google Scholar] [CrossRef] [PubMed]
  60. Curriero, F.C.; Heiner, K.S.; Samet, J.M.; Zeger, S.L.; Strug, L.; Patz, J.A. Temperature and mortality in 11 cities of the Eastern United States. Am. J. Epidemiol. 2002, 155, 80–87. [Google Scholar] [CrossRef] [PubMed]
  61. Bidassey-Manilal, S.; Wright, C.Y.; Engelbrecht, J.C.; Albers, P.N.; Garland, R.M.; Matooane, M. Students’ perceived heat-health symptoms increased with warmer classroom temperatures. Int. J. Environ. Res. Public Health 2016, 13, 566. [Google Scholar] [CrossRef] [PubMed]
  62. Smargiassi, A.; Fournier, M.; Griot, C.; Baudouin, Y.; Kosatsky, T. Prediction of the indoor temperatures of an urban area with an in-time regression mapping approach. J. Expo. Sci. Environ. Epidemiol. 2008, 18, 282. [Google Scholar] [CrossRef] [PubMed]
  63. White-Newsome, J.L.; Sánchez, B.N.; Jolliet, O.; Zhang, Z.; Parker, E.A.; Dvonch, J.T.; O’Neill, M.S. Climate change and health: Indoor heat exposure in vulnerable populations. Environ. Res. 2012, 112, 20–27. [Google Scholar] [CrossRef] [PubMed]
  64. Long Term Adaptation Scenarios Research Programme (LTAS): Full Technical Report on Climate Trends and Scenarios for South Africa. Available online: https://www.environment.gov.za/sites/default/files/docs/climate_trends_scenarios.pdf (accessed on 18 March 2018).
  65. Almeida, S.P.; Casimiro, E.; Calheiros, J. Effects of apparent temperature on daily mortality in Lisbon and Oporto, Portugal. Environ. Health 2010, 9, 12. [Google Scholar] [CrossRef] [PubMed]
  66. A Snapshot of Projected Maximum and Minimum Temperature Changes: South Africa. Available online: http://www.weathersa.co.za/images/documents/384/155986%20South%20African%20Weather%20Service=Scientific%20Newsletters_Mailer.pdf (accessed on 18 March 2017).
  67. United States Environmental Protection Agency: Adapting to Heat. Available online: https://www.epa.gov/heat-islands/adapting-heat (accessed on 23 April 2018).
  68. Luber, G.; McGeehin, M. Climate change and extreme heat events. Am. J. Prev. Med. 2008, 35, 429–435. [Google Scholar] [CrossRef] [PubMed]
  69. Semenza, J.C.; Rubin, C.H.; Falter, K.H.; Selanikio, J.D.; Flanders, W.D.; Howe, H.L.; Wilhelm, J.L. Heat-related deaths during the July 1995 heat wave in Chicago. N. Engl. J. Med. 1996, 335, 84–90. [Google Scholar] [CrossRef] [PubMed]
Figure 1. Houses in study site of Giyani, Limpopo province, South Africa (Source: Google Images from Gumtree.co.za).
Ijerph 15 00952 g001
Figure 2. Mean hourly indoor AT calculated for 98 homes by roofing type from 7 July 2017 to 31 August 2017 (line: median; interquartile range box: middle 50% of the data; whiskers extending from either end of the box: ranges for the bottom and top 25% of the data values; solid black dots: outliers; diamond dot: mean), * Responses captured as other were excluded from plot (n = 8), N across plots does not add up to 98 due to missing responses. (a) Shows results for kitchen roof type and (b) for living room roof type.
Ijerph 15 00952 g002
Figure 3. Daily hourly outdoor and indoor apparent temperature calculated during spring, summer, and winter in Limpopo Province, South Africa.
Ijerph 15 00952 g003
Figure 4. Average hourly indoor apparent temperature with superimposed symptom bands as described in Table 1 for spring (a), summer (b) and winter (c). Dots represent individual households.
Ijerph 15 00952 g004aIjerph 15 00952 g004b
Figure 5. Observed outdoor temperature during the study period compared to outdoor temperatures projected using RCP 8.5 climate model.
Ijerph 15 00952 g005
Figure 6. Linear regression between calculated indoor AT (using measured indoor temperature) and measured outdoor temperature for the period September 2016 to August 2017.
Ijerph 15 00952 g006
Figure 7. Boxplot of observed indoor AT during the study period compared to predicted AT obtained from linear prediction model using projected outdoor temperature.
Ijerph 15 00952 g007
Table 1. Apparent temperature ranges and associated possible heat health effects according to the USNWS NOAA Heat Index.
LevelApparent Temperature RangeWarningPossible Heat Health Effect
126.7–31.7 °CCautionFatigue, discomfort possible
232.2–40 °CExtreme cautionSunstroke, heat cramps, heat exhaustion possible
340.6–53.9 °CDangerSunstroke, heat cramps, heat exhaustion likely, heat stroke possible
454.5 °C or higherExtreme dangerSunstroke and heat stroke highly likely
Table 2. Responses to questionnaire: socio-demographic and house/household characteristics of sampled homes (n = 406).
Variablesn%
Number of people in household
<519548.03
5–716239.90
8–104511.08
>1040.99
Total406100.00
Number of children <5 years in household
023758.37
112831.53
2399.61
320.49
Total406100.00
Average monthly income of household—excluding grants and pensions
No income12129.66
ZAR ≤ 10009624.02
ZAR1001–ZAR500010024.51
≥ZAR > 5001174.17
Do not know7217.65
Total406100.00
* Number of people receiving the following grants
Old age pension142
Disability15
Child282
Other11
When the weather is warm, how does the house feel indoors?
Cooler than outside10726.35
Same as outside10425.62
Warmer than outside19548.03
Total406100.00
Do you use a fan during hot weather?
Yes15939.16
No24760.84
Total406100.00
Do you use an air conditioner during hot weather?
Yes174.19
No38995.81
Total406100.00
Housing type
Formal house37692.61
Informal dwelling123.00
Traditional dwelling163.90
Backyard dwelling (formal)20.50
Total406100
* Response is total number people per household.
Table 3. Descriptive statistics on outdoor and indoor temperature, apparent temperature (AT), relative humidity (RH), and wind speed.
SeasonSpringSummerWinter
Mean (SD)RangeMean (SD)RangeMean (SD)Range
Outdoor Temperature (°C)30.8 (5.3)18.5–40.730.3 (4.8)21.3–41.326.4 (3.1)19.2–33.4
Outdoor AT (°C)32.5 (8.5)14.4–49.233.8 (8.4)15.7–52.827.5 (5.3)14.0–37.5
Outdoor RH (%)78.4 (10.9)54.0–95.090.9 (6.1)70.0–96.085.3 (6.6)66.0–96.0
Outdoor wind speed (m/s−1)8.7 (2.9)4.3–18.88.2 (3.0)2.9–15.16.7 (2.4)3.2–12.7
Indoor Temperature (°C)27.2 (4.1)16.0–34.928.5 (3.0)22.8–35.622.1 (2.3)13.5–25.8
Indoor AT (°C)28.4 (5.1)14.2–36.732.2 (3.4)24.6–40.021.8 (2.8)11.1–24.5
Indoor RH (%)43.1 (9.1)25.6–66.960.7 (8.8)37.5–75.542.5 (8.4)22.7–60.3
Table 4. Summary statistics from multiple regression using ambient data to find predictor(s) of indoor AT.
VariablesCoefficientSEp Value95% CI
DependentIndependent
Indoor ATOutdoor Temperature0.550.170.0010.23–0.88
Outdoor AT0.120.100.20−0.07–0.33
SE = standard error, CI = confidence interval.
Table 5. Number of days within USNWS NOAA heat index symptom bands during current observed indoor AT conditions and future predicted indoor AT conditions.
US NWS ClassificationApparent Temperature RangeObserved AT (Number of Days)Predicted AT (Number of Days)Possible Heat Health Effect
No risk<26.7 °C9723-
Caution26.7–31.7 °C78107Fatigue, discomfort possible
Extreme caution32.2–40.0 °C61106Sunstroke, heat cramps, heat exhaustion possible
Danger40.6–53.9 °C00Sunstroke, heat cramps, heat exhaustion likely, heat stroke possible
Extreme danger54.5 °C or higher00Sunstroke and heat stroke highly likely

