Impact of Green Space Exposure on Children’s and Adolescents’ Mental Health: A Systematic Review


Abstract
1. Introduction
2. Materials and Methods
2.1. Search Strategy
2.2. Selection Criteria
2.3. Data Collection and Evaluation of Evidence
3. Results
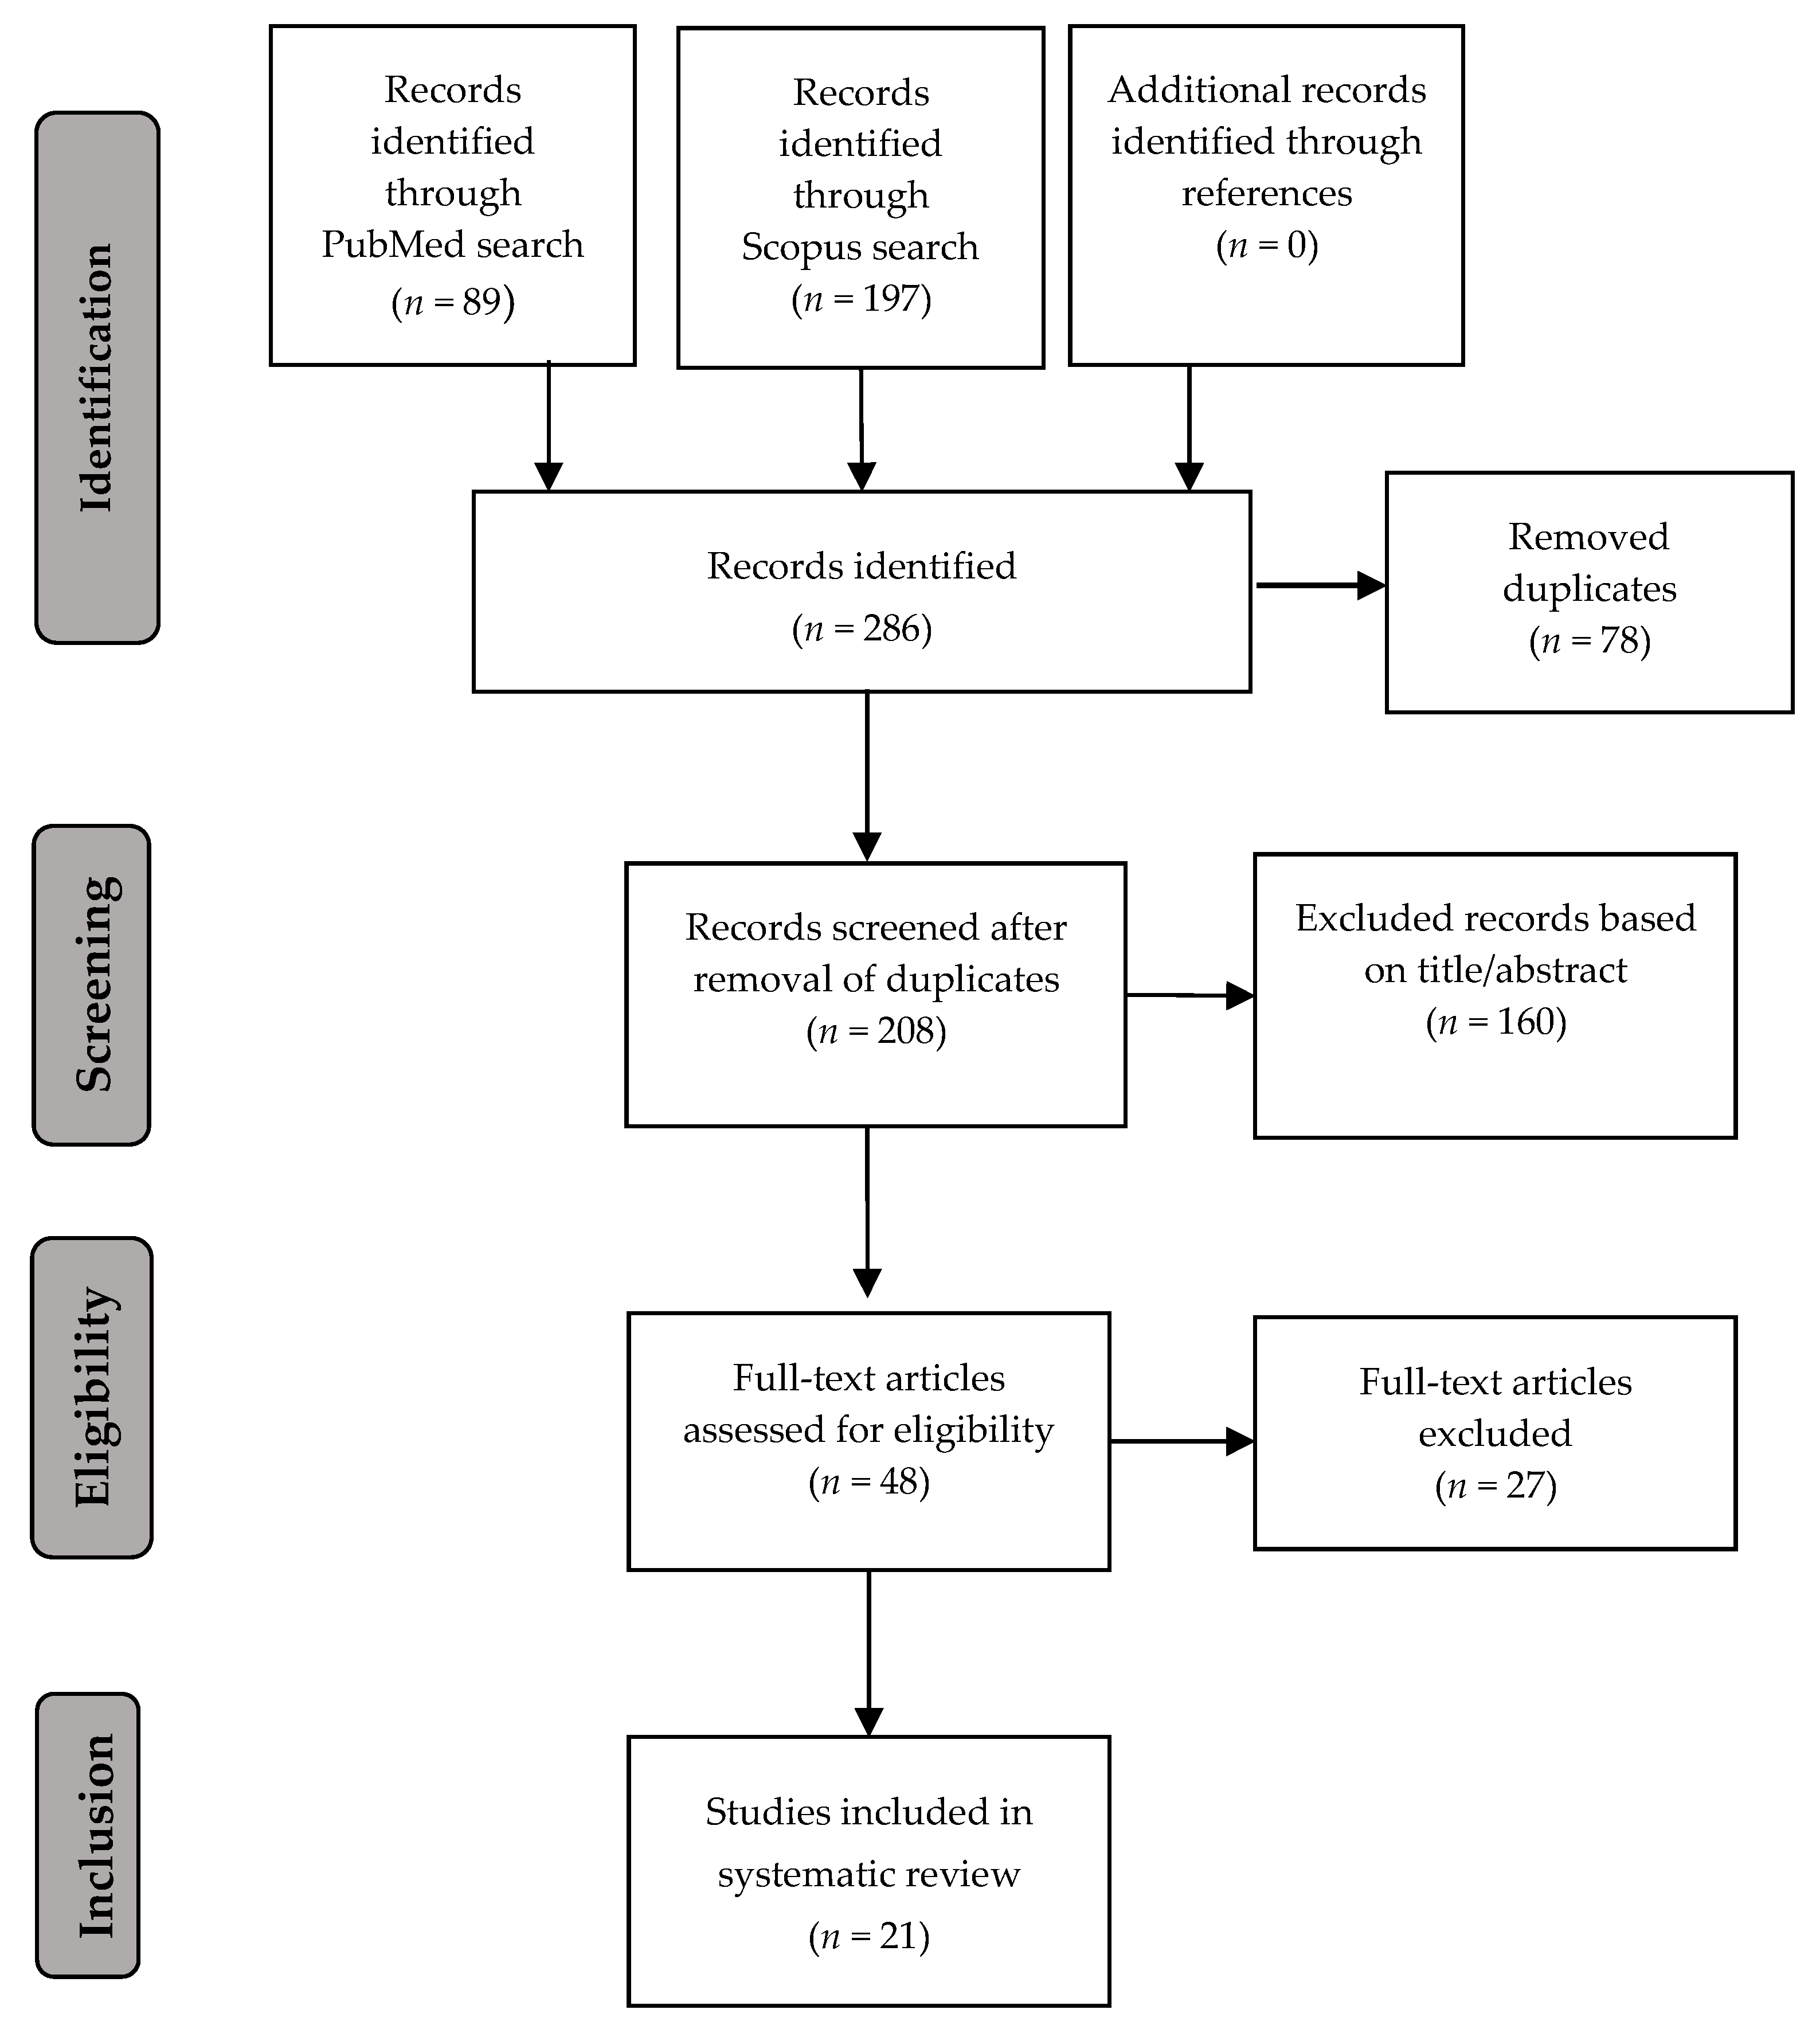
3.1. Literature Search Results
3.2. Study Characteristics and Methods
3.3. Evaluation of Evidence
3.3.1. Emotional and Behavioral Difficulties
3.3.2. Mental Well-Being
3.3.3. Neurocognitive Development
4. Discussion
4.1. Evidence for an Association between Green Space Exposure and Mental Health
4.2. Independency of the Association
4.3. Direction of the Association
4.4. Mediation of the Association
4.5. Variability by Age Group
4.6. Relevance of the Association
4.7. Strengths and Limitations
4.8. Future Research Suggestions
5. Conclusions
Author Contributions
Funding
Conflicts of Interest
References
- Van den Bosch, M.; Ode Sang, Å. Urban Natural Environments as Nature-Based Solutions for Improved Public Health—A Systematic Review of Reviews. Environ. Res. 2017, 158, 373–384. [Google Scholar] [CrossRef] [PubMed]
- Gascon, M.; Triguero-Mas, M.; Martinez, D.; Dadvand, P.; Forns, J.; Plasencia, A.; Nieuwenhuijsen, M.J. Mental Health Benefits of Long-Term Exposure to Residential Green and Blue Spaces: A Systematic Review. Int. J. Environ. Res. Public Health 2015, 12, 4354–4379. [Google Scholar] [CrossRef] [PubMed]
- Dallimer, M.; Tang, Z.; Bibby, P.R.; Brindley, P.; Gaston, K.J.; Davies, Z.G. Temporal Changes in Greenspace in a Highly Urbanized Region. Biol. Lett. 2011, 7, 763–766. [Google Scholar] [CrossRef] [PubMed]
- Byomkesh, T.; Nakagoshi, N.; Dewan, A.M. Urbanization and Green Space Dynamics in Greater Dhaka, Bangladesh. Landsc. Ecol. Eng. 2012, 8, 45–58. [Google Scholar] [CrossRef]
- Kim, K.-H.; Pauleit, S. Landscape Character, Biodiversity and Land Use Planning: The Case of Kwangju City Region, South Korea. Land Use Policy 2007, 24, 264–274. [Google Scholar] [CrossRef]
- Herring, J.W.; Herring, D. Measuring Vegetation (NDVI & EVI); Feature Articles; NASA Earth Observatory: Sacramento, CA, USA, 2000.
- Taylor, L.; Hochuli, D.F. Defining Greenspace: Multiple Uses across Multiple Disciplines. Landsc. Urban Plan. 2017, 158, 25–38. [Google Scholar] [CrossRef]
- United Nations. The Sustainable Development Goals Report; UN DESA: New York City, NY, USA, 2016. [Google Scholar]
- Maas, J.; Verheij, R.A.; de Vries, S.; Spreeuwenberg, P.; Schellevis, F.G.; Groenewegen, P.P. Morbidity Is Related to a Green Living Environment. J. Epidemiol. Community Health 2009, 63, 967–973. [Google Scholar] [CrossRef] [PubMed]
- McCormick, R. Does Access to Green Space Impact the Mental Well-Being of Children: A Systematic Review. J. Pediatr. Nurs. 2017, 37, 3–7. [Google Scholar] [CrossRef] [PubMed]
- Moher, D.; Liberati, A.; Tetzlaff, J.; Altman, D.G. Guidelines and Guidance Preferred Reporting Items for Systematic Reviews and Meta-Analyses: The PRISMA Statement. Ann. Intern. Med. 2009, 151, 264–269. [Google Scholar] [CrossRef] [PubMed]
- Wu, J.; Jackson, L. Inverse Relationship between Urban Green Space and Childhood Autism in California Elementary School Districts. Environ. Int. 2017, 107, 140–146. [Google Scholar] [CrossRef] [PubMed]
- Kabisch, N.; Haase, D.; Annerstedt van den Bosch, M. Adding Natural Areas to Social Indicators of Intra-Urban Health Inequalities among Children: A Case Study from Berlin, Germany. Int. J. Environ. Res. Public Health 2016, 13, 783. [Google Scholar] [CrossRef] [PubMed]
- Ward, J.S.; Duncan, J.S.; Jarden, A.; Stewart, T. The Impact of Children’s Exposure to Greenspace on Physical Activity, Cognitive Development, Emotional Wellbeing, and Ability to Appraise Risk. Health Place 2016, 40, 44–50. [Google Scholar] [CrossRef] [PubMed]
- Aggio, D.; Smith, L.; Fisher, A.; Hamer, M. Mothers’ Perceived Proximity to Green Space Is Associated with TV Viewing Time in Children: The Growing Up in Scotland Study. Prev. Med. 2015, 70, 46–49. [Google Scholar] [CrossRef] [PubMed]
- Zach, A.; Meyer, N.; Hendrowarsito, L.; Kolb, S.; Bolte, G.; Nennstiel-Ratzel, U.; Stilianakis, N.I.; Herr, C. Association of Sociodemographic and Environmental Factors with the Mental Health Status among Preschool Children-Results from a Cross-Sectional Study in Bavaria, Germany. Int. J. Hyg. Environ. Health 2016, 219, 458–467. [Google Scholar] [CrossRef] [PubMed]
- Feng, X.; Astell-Burt, T. The Relationship between Neighbourhood Green Space and Child Mental Wellbeing Depends upon Whom You Ask: Multilevel Evidence from 3083 Children Aged 12–13 Years. Int. J. Environ. Res. Public Health 2017, 14, 235. [Google Scholar] [CrossRef] [PubMed]
- Amoly, E.; Dadvand, P.; Forns, J.; López-Vicente, M.; Basagaña, X.; Julvez, J.; Alvarez-Pedrerol, M.; Nieuwenhuijsen, M.J.; Sunyer, J. Green and Blue Spaces and Behavioral Development in Barcelona Schoolchildren: The BREATHE Project. Environ. Health Perspect. 2015, 122, 1351–1358. [Google Scholar] [CrossRef] [PubMed]
- Balseviciene, B.; Sinkariova, L.; Grazuleviciene, R.; Andrusaityte, S.; Uzdanaviciute, I.; Dedele, A.; Nieuwenhuijsen, M. Impact of Residential Greenness on Preschool Children’s Emotional and Behavioral Problems. Int. J. Environ. Res. Public Health 2014, 11, 6757–6770. [Google Scholar] [CrossRef] [PubMed]
- Bezold, C.P.; Banay, R.F.; Coull, B.A.; Hart, J.E.; James, P.; Kubzansky, L.D.; Missmer, S.A.; Laden, F. The Association Between Natural Environments and Depressive Symptoms in Adolescents Living in the United States. J. Adolesc. Health 2017, 62, 488–495. [Google Scholar] [CrossRef] [PubMed]
- Bezold, C.P.; Banay, R.F.; Coull, B.A.; Hart, J.E.; James, P.; Kubzansky, L.D.; Missmer, S.A.; Laden, F. The Relationship between Surrounding Greenness in Childhood and Adolescence and Depressive Symptoms in Adolescence and Early Adulthood. Ann. Epidemiol. 2018, 28, 213–219. [Google Scholar] [CrossRef] [PubMed]
- Dadvand, P.; Nieuwenhuijsen, M.J.; Esnaola, M.; Forns, J.; Basagana, X.; Alvarez-Pedrerol, M.; Rivas, I.; Lopez-Vicente, M.; De Castro Pascual, M.; Su, J.; et al. Green Spaces and Cognitive Development in Primary Schoolchildren. Proc. Natl. Acad. Sci. USA 2015, 112, 7937–7942. [Google Scholar] [CrossRef] [PubMed]
- Dadvand, P.; Tischer, C.; Estarlich, M.; Llop, S.; Dalmau-Bueno, A.; Lopez-Vicente, M.; Valentin, A.; de Keijzer, C.; Fernandez-Somoano, A.; Lertxundi, N.; et al. Lifelong Residential Exposure to Green Space and Attention: A Population-Based Prospective Study. Environ. Health Perspect. 2017, 125, 97016. [Google Scholar] [CrossRef] [PubMed]
- Dzhambov, A.; Hartig, T.; Markevych, I.; Tilov, B.; Dimitrova, D. Urban Residential Greenspace and Mental Health in Youth: Different Approaches to Testing Multiple Pathways Yield Different Conclusions. Environ. Res. 2018, 160, 47–59. [Google Scholar] [CrossRef] [PubMed]
- Feng, X.; Astell-Burt, T. Residential Green Space Quantity and Quality and Child Well-Being: A Longitudinal Study. Am. J. Prev. Med. 2017, 53, 616–624. [Google Scholar] [CrossRef] [PubMed]
- Flouri, E.; Midouhas, E.; Joshi, H. The Role of Urban Neighbourhood Green Space in Children’s Emotional and Behavioural Resilience. J. Environ. Psychol. 2014, 40, 179–186. [Google Scholar] [CrossRef]
- Huynh, Q.; Craig, W.; Janssen, I.; Pickett, W. Exposure to Public Natural Space as a Protective Factor for Emotional Well-Being among Young People in Canada. BMC Public Health 2013, 13, 407. [Google Scholar] [CrossRef] [PubMed]
- Kim, J.-H.; Lee, C.; Sohn, W. Urban Natural Environments, Obesity, and Health-Related Quality of Life among Hispanic Children Living in Inner-City Neighborhoods. Int. J. Environ. Res. Public Health 2016, 13, 121. [Google Scholar] [CrossRef] [PubMed]
- Markevych, I.; Tiesler, C.M.T.; Fuertes, E.; Romanos, M.; Dadvand, P.; Nieuwenhuijsen, M.J.; Berdel, D.; Koletzko, S.; Heinrich, J. Access to Urban Green Spaces and Behavioural Problems in Children: Results from the GINIplus and LISAplus Studies. Environ. Int. 2014, 71, 29–35. [Google Scholar] [CrossRef] [PubMed]
- Richardson, E.A.; Pearce, J.; Shortt, N.K.; Mitchell, R. The Role of Public and Private Natural Space in Children’s Social, Emotional and Behavioural Development in Scotland: A Longitudinal Study. Environ. Res. 2017, 158, 729–736. [Google Scholar] [CrossRef] [PubMed]
- Saw, L.E.; Lim, F.K.S.; Carrasco, L.R. The Relationship between Natural Park Usage and Happiness Does Not Hold in a Tropical City-State. PLoS ONE 2015, 10, e0133781. [Google Scholar] [CrossRef] [PubMed]
- Younan, D.; Tuvblad, C.; Li, L.; Wu, J.; Lurmann, F.; Franklin, M.; Berhane, K.; McConnell, R.; Wu, A.H.; Baker, L.A.; et al. Environmental Determinants of Aggression in Adolescents: Role of Urban Neighborhood Greenspace. J. Am. Acad. Child Adolesc. Psychiatry 2016, 55, 591–601. [Google Scholar] [CrossRef] [PubMed]
- Flores-Pajot, M.-C.; Ofner, M.; Do, M.T.; Lavigne, E.; Villeneuve, P.J. Childhood Autism Spectrum Disorders and Exposure to Nitrogen Dioxide, and Particulate Matter Air Pollution: A Review and Meta-Analysis. Environ. Res. 2016, 151, 763–776. [Google Scholar] [CrossRef] [PubMed]
- Sentís, A.; Sunyer, J.; Dalmau-Bueno, A.; Andiarena, A.; Ballester, F.; Cirach, M.; Estarlich, M.; Fernández-Somoano, A.; Ibarluzea, J.; Íñiguez, C.; et al. Prenatal and Postnatal Exposure to NO2 and Child Attentional Function at 4–5 Years of Age. Environ. Int. 2017, 106, 170–177. [Google Scholar] [CrossRef] [PubMed]
- Sram, R.J.; Veleminsky, M.; Veleminsky, M.; Stejskalová, J. The Impact of Air Pollution to Central Nervous System in Children and Adults. Neuro Endocrinol. Lett. 2017, 38, 389–396. [Google Scholar] [PubMed]
- Vert, C.; Sánchez-Benavides, G.; Martínez, D.; Gotsens, X.; Gramunt, N.; Cirach, M.; Molinuevo, J.L.; Sunyer, J.; Nieuwenhuijsen, M.J.; Crous-Bou, M.; et al. Effect of Long-Term Exposure to Air Pollution on Anxiety and Depression in Adults: A Cross-Sectional Study. Int. J. Hyg. Environ. Health 2017, 220, 1074–1080. [Google Scholar] [CrossRef] [PubMed]
- Forns, J.; Dadvand, P.; Foraster, M.; Alvarez-Pedrerol, M.; Rivas, I.; López-Vicente, M.; Suades-Gonzalez, E.; Garcia-Esteban, R.; Esnaola, M.; Cirach, M.; et al. Traffic-Related Air Pollution, Noise at School, and Behavioral Problems in Barcelona Schoolchildren: A Cross-Sectional Study. Environ. Health Perspect. 2016, 124, 529–535. [Google Scholar] [CrossRef] [PubMed]
- United Nations. World Urbanization Prospects: The 2018 Revision. Available online: https://population.un.org/wup/Publications/Files/WUP2018-KeyFacts.pdf (accessed on 19 November 2018).
- Scott, J.T.; Kilmer, R.P.; Wang, C.; Cook, J.R.; Haber, M.G. Natural Environments Near Schools: Potential Benefits for Socio-Emotional and Behavioral Development in Early Childhood. Am. J. Community Psychol. 2018. [Google Scholar] [CrossRef] [PubMed]
- Van Dijk-Wesselius, J.E.; Maas, J.; Hovinga, D.; van Vugt, M.; van den Berg, A.E. The Impact of Greening Schoolyards on the Appreciation, and Physical, Cognitive and Social-Emotional Well-Being of Schoolchildren: A Prospective Intervention Study. Landsc. Urban Plan. 2018, 180, 15–26. [Google Scholar] [CrossRef]
- Richards, H.J.; Kafami, D.M. Impact of Horticultural Therapy on Vulnerability and Resistance to Substance Abuse Among Incarcerated Offenders. J. Offender Rehabil. 1999, 29, 183–193. [Google Scholar] [CrossRef]
- Mak, K.-K.; Lai, C.-M.; Watanabe, H.; Kim, D.-I.; Bahar, N.; Ramos, M.; Young, K.S.; Ho, R.C.M.; Aum, N.-R.; Cheng, C. Epidemiology of Internet Behaviors and Addiction Among Adolescents in Six Asian Countries. Cyberpsychol. Behav. Soc. Netw. 2014, 17, 720–728. [Google Scholar] [CrossRef] [PubMed]
- Van Aart, C.J.C.; Michels, N.; Sioen, I.; De Decker, A.; Bijnens, E.M.; Janssen, B.G.; De Henauw, S.; Nawrot, T.S. Residential Landscape as a Predictor of Psychosocial Stress in the Life Course from Childhood to Adolescence. Environ. Int. 2018, 120, 456–463. [Google Scholar] [CrossRef] [PubMed]
- Ng, K.; Sia, A.; Ng, M.; Tan, C.; Chan, H.; Tan, C.; Rawtaer, I.; Feng, L.; Mahendran, R.; Larbi, A.; et al. Effects of Horticultural Therapy on Asian Older Adults: A Randomized Controlled Trial. Int. J. Environ. Res. Public Health 2018, 15, 1705. [Google Scholar] [CrossRef] [PubMed]
- Yu, J.; Ang, K.K.; Ho, S.H.; Sia, A.; Ho, R. Prefrontal Cortical Activation While Viewing Urban and Garden Scenes: A Pilot FNIRS Study. In Proceedings of the 2017 39th Annual International Conference of the IEEE Engineering in Medicine and Biology Society (EMBC), Seogwipo, Korea, 11–15 July 2017; Volume 2017, pp. 2546–2549. [Google Scholar]


| Author, Year, Country | Study Design | N, Age | Exposure Data Source | Exposure Area | Exposure Concept (Scale) | Outcome Instrument | Confounders Adjusted for in Model | Significant Results in Adjusted Model |
|---|---|---|---|---|---|---|---|---|
| Aggio et al., 2015, Scotland [15] | cross-sectional | 3586 5–6 years | questionnaire | residence | walking time to nearest GS | SDQ | no adjusted model in publication | (Not adjusted) more than 20 min walking time to GS associated with higher scores on TDS. |
| Amoly et al., 2014, Spain [18] | cross-sectional | 2111 7–10 years | NDVI, questionnaire | residence, school | average greenness (100 m, 250 m, 500 m); GS playing time; proximity to major GS | SDQ, DSM IV/ADHD | gender, school level, ethnicity, SES, parental marital status, nSES preterm birth, breastfeeding, environmental tobacco smoke, gestational maternal smoking, responding person | Average greenness inversely associated with TDS, H/I & DSM IV-ADHD score; green space playing time inversely associated with TDS, emotional and peer problems; proximity to major GS not associated with outcome parameters. |
| Balseviciene, 2014, Lithuania [19] | cross-sectional | 1468 4–6 years | NDVI, land cover map | residence | average greenness (300 m); distance to city park | SDQ | age, gender, parenting stress, SES | Distance to city park positively associated with TDS, H/I, peer and conduct problems in low SES subgroup; no associations with average greenness. |
| Bezold et al., 2017, USA [20] | cross-sectional | 9385 12–18 years | NDVI | residence | average greenness (250 m, 1250 m) | McKnight Risk Factor Survey | age, gender, ethnicity, grade level, SES, maternal history of depression, nSES, PM2.5 | IQR increase in average greenness associated with 11% lower odds of high depressive symptoms. |
| Bezold et al., 2018, USA [21] | longitudinal | 11,346 9–25 years | NDVI | residence | cumulative average greenness (1000 m) | Mc Knight Risk Factor Survey; CES-D | age, gender, ethnicity, SES, maternal history of depression, population density, nSES, PM2.5 | IQR increase in cumulative residential greenness associated with 6% lower incidence of high depressive symptoms; stronger associations for under-18 year olds and in more densely populated areas. |
| Dadvand et al., 2015, Spain [22] | longitudinal | 2593 7–10 years | NDVI | residence, school, commuting | average greenness (250 m residence, 50 m commuting route, 50 m school) | Compu-terized n-back, ANT | age, gender, SES, nSES, air pollution | Average greenness positively associated with 12 m development of two-back, three-back and ANT results. |
| Dadvand et al., 2017, Spain [23] | longitudinal | 1875 4–7 years | NDVI, VCF | residence | cumulative average greenness (100 m, 300 m, 500 m), tree canopy cover | computerized K-CPT, ANT | age, gender, preterm birth, maternal cognitive performance, gestational smoking, environmental tobacco exposure, SES, nSES | Cumulative average greenness inversely associated with K-CPT omission errors and HRT-SE at 4–5 years, and with ANT HRT-SE at 7 years. |
| Dzhambov et al., 2018, Bulgaria [24] | cross-sectional | 399 15–25 years | NDVI, SAVI, TCI, GIS, questionnaire | residence | average greenness (500 m), tree canopy cover, GS access/quality/usage | GHQ | age, gender, ethnicity, SES orientation of rooms duration of residence, time spent at home, air pollution, noise, population density | No direct associations; positive association via serial mediation (restoration, physical activity, social cohesion). |
| Feng and Astell-Burt, 2017, Australia [25] | longitudinal | 4968 4–13 years | land cover map, question-naire | residence | amount of GS (SA2), GS quality | SDQ | age, gender, ethnicity, SES, nSES, urbanicity | Amount and quality of GS inversely associated with TDS, IS and ES, for all age groups; for older children GS quality more strongly inversely associatied with IS. |
| Feng, 2017, Australia [17] | cross-sectional | 3083 12–13 years | land cover map, question-naire | residence | amount of GS (SA2), GS quality | SDQ | age, gender, SES, nSES, geographic remoteness | Amount of GS inversely associated with the parent-reported TDS and IS; GS quality inversely associated with both parent- and child-reported TDS, IS and ES; stronger associations found for parent-reported scores. |
| Flouri et al., 2014, UK [26] | longitudinal | 6383 3–7 years | land cover map, question-naire | residence | amount GS (LSOA), use of GS | SDQ | age, gender, ethnicity, SES, family structure, use of GS, access to private garden, life adversity, nSES, maternal (mental) health, physical activity | Amount of GS inversely associated with emotional problems score for age 3–5 years. |
| Huynh et al., 2013, Canada [27] | cross-sectional | 17,249 11–16 years | land cover map | school | amount GS (5000 m) | Cantrill ladder | age, gender, ethnicity, SES, nSES | Amount of GS not associated with well-being. |
| Kabisch et al., 2016, Germany [13] | ecological | 30,427 5–6 years | land cover map | residence | amount GS (LEA) (/capita) | health visit | sub-district level: SES, ethnicity, measles immunization, participation in check-up, kindergarten attendance, tobacco exposure | Amount of GS inversely associated with deficits in visuo-motoric development. |
| Kim et al., 2016, USA [28] | cross-sectional | 92 9–11 years | remote sensing data (NDVI-like) | residence | amount, number, size, distance to, cohesiveness of GS (400 m, 800 m) | PedsQL | age, gender, SES, nSES, BMI, physical activity | Larger and more tree areas positively associated with children’s health related quality of life. |
| Markevych et al., 2014, Germany [29] | cross-sectional | 1932 10 years | land cover map, NDVI | residence | distance to nearest GS | SDQ | age, gender, SES, maternal age at birth, parental marital status, screen/outdoors time | Residence > 500 m away from nearest GS positively associated with TDS, peer relationship and H/I problems (after stratification; only association with H/I for boys), no associations for residential average greenness. |
| Richardson et al., 2017, Scotland [30] | longitudinal | 2909 4–6 years | land cover map, question-naire | residence | amount GS and public parks (500 m), access to private garden | SDQ | age, gender, SES, parental mental health, nSES, hours of screen time | Private garden access strongly associated with TDS and H/I and to lesser extent with peer and conduct problems, neighborhood amount of GS associated with prosocial behavior scores, little evidence of influence on developmental trajectory. |
| Saw et al., 2015, Singapore [31] | cross-sectional | 426 18–25 years | land cover map, question-naire | residence | distance from nearest GS, number of GS’s (1200 m), use of GS | LSS, Pos.and Neg. Affect Scale, PSS | age, gender, SES, physical activity, serious health problems, personality traits | Neither access to or use of GS associated with well-being. |
| Ward et al., 2016, New Zealand [14] | cross-sectional | 72 11–14 years | geolocation and timing | all locations | time spent in GS | LSS; TDIW; HS; comp. CNS-Vital Signs test | age, gender, school, physical activity | Time spent in GS and physical activity positively associated with greater emotional wellbeing, no associations with neurocognitive development measures. |
| Wu et al., 2017, USA [12] | ecological | ~3 × 10⁶ 5–12 years | land cover map | school district | amout forest and grassland (school district), amount (near-road) tree canopy. | prevalence autism | district level: ethnicity, gender, SES, road density | Amount of GS and tree cover metrics inversely associated with autism prevalence in high road density districts. |
| Younan et al., 2016, USA [32] | longitudinal | 1287 9–18 years | NDVI | residence | average greenness (250 m, 350 m, 500 m, 1000 m) | CBCL-Agression | age, gender, ethnicity, SES, nSES, ambient temperature, traffic density and proximity to freeways and roads, maternal depression, gestational smoking | IQR increase in average greenness inversely associated with aggresive behaviour. |
| Zach et al., 2016, Germany [16] | cross-sectional | 6206 6–12 years | questionnaire | residence | availablity of GS | SDQ | gender, country of birth, SES, single parenthood, crowding, traffic load | Non-accessibility of green space associated with TDS and hyperactivity/inattention problems. |
© 2018 by the authors. Licensee MDPI, Basel, Switzerland. This article is an open access article distributed under the terms and conditions of the Creative Commons Attribution (CC BY) license (http://creativecommons.org/licenses/by/4.0/).
Share and Cite
Vanaken, G.-J.; Danckaerts, M. Impact of Green Space Exposure on Children’s and Adolescents’ Mental Health: A Systematic Review. Int. J. Environ. Res. Public Health 2018, 15, 2668. https://doi.org/10.3390/ijerph15122668
Vanaken G-J, Danckaerts M. Impact of Green Space Exposure on Children’s and Adolescents’ Mental Health: A Systematic Review. International Journal of Environmental Research and Public Health. 2018; 15(12):2668. https://doi.org/10.3390/ijerph15122668
Chicago/Turabian StyleVanaken, Gert-Jan, and Marina Danckaerts. 2018. "Impact of Green Space Exposure on Children’s and Adolescents’ Mental Health: A Systematic Review" International Journal of Environmental Research and Public Health 15, no. 12: 2668. https://doi.org/10.3390/ijerph15122668
APA StyleVanaken, G.-J., & Danckaerts, M. (2018). Impact of Green Space Exposure on Children’s and Adolescents’ Mental Health: A Systematic Review. International Journal of Environmental Research and Public Health, 15(12), 2668. https://doi.org/10.3390/ijerph15122668