Prediction of Prehypertenison and Hypertension Based on Anthropometry, Blood Parameters, and Spirometry


Abstract
1. Introduction
2. Materials and Methods
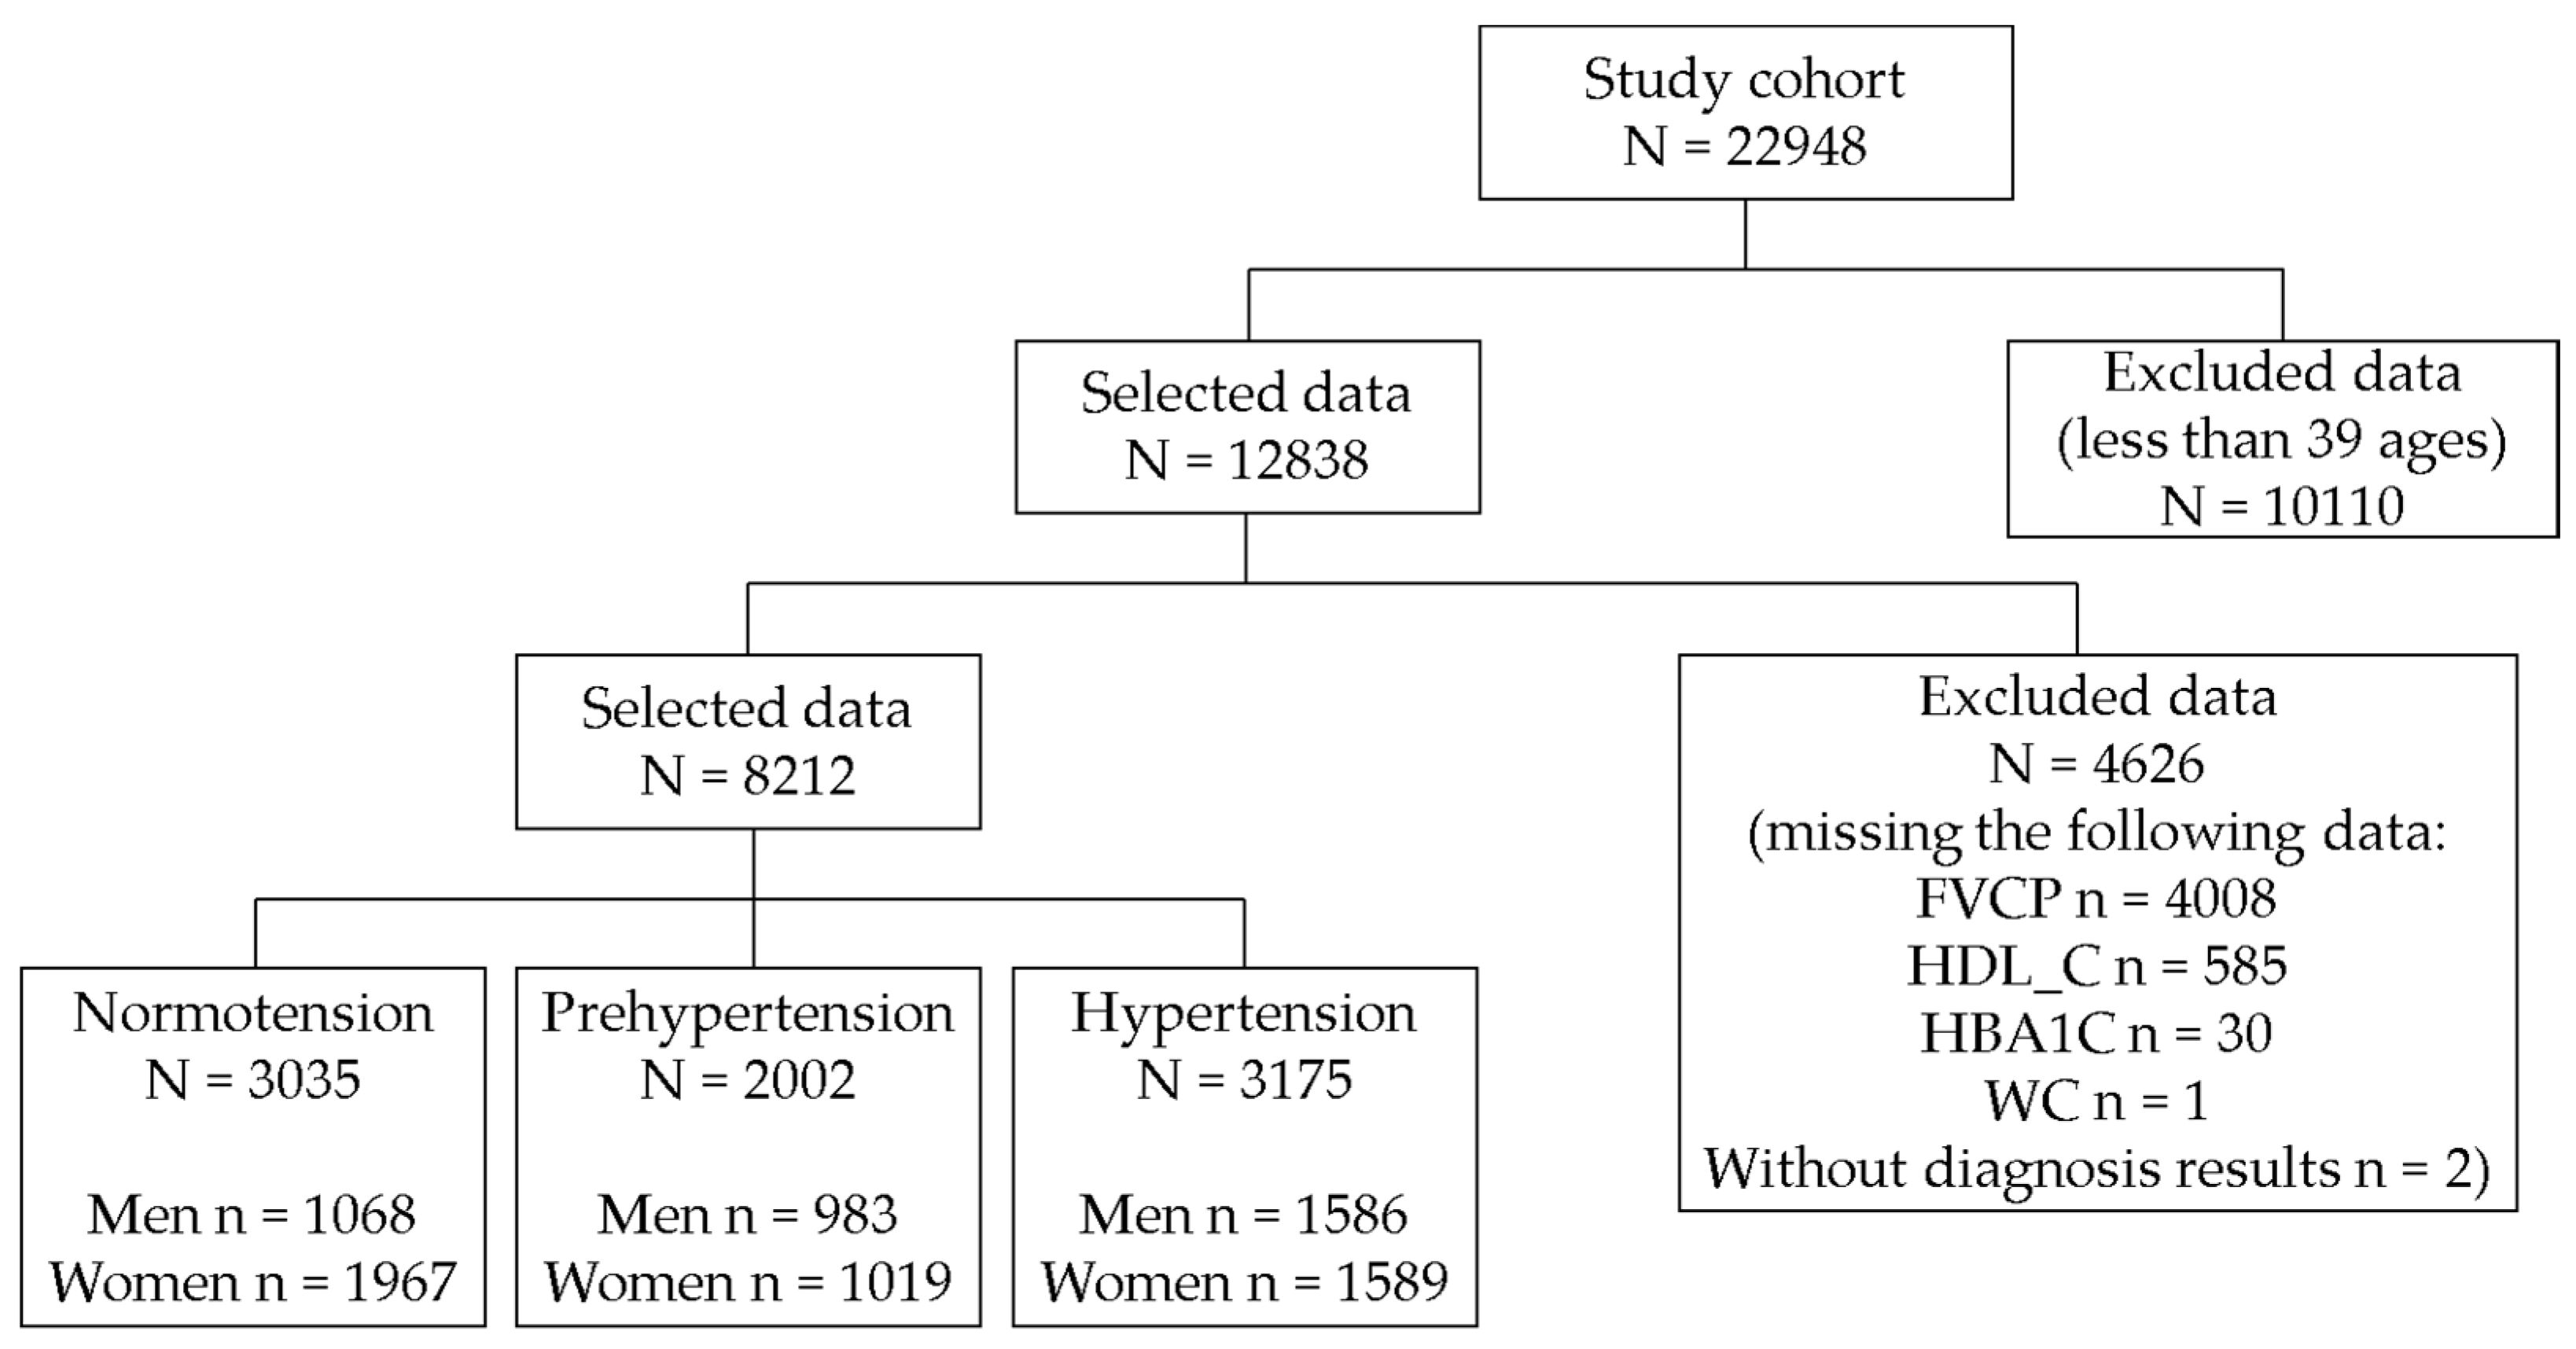
2.1. Subjects and Dataset
- We selected 12,838 individuals after excluding 10110 participants under 40 years of age.
- We excluded 4626 patients with missing values (FVCP, n = 4008; HDL-C, n = 585; HbA1c, n = 30; WC, n = 1; and hypertension diagnosis, n = 2).
2.2. Definitions of Prehypertension and Hypertension
2.3. Statistical Analysis
2.4. Performance Evaluation
3. Results
3.1. Statistical Analysis of Prehypertension
3.2. Statistical Analysis of Hypertension
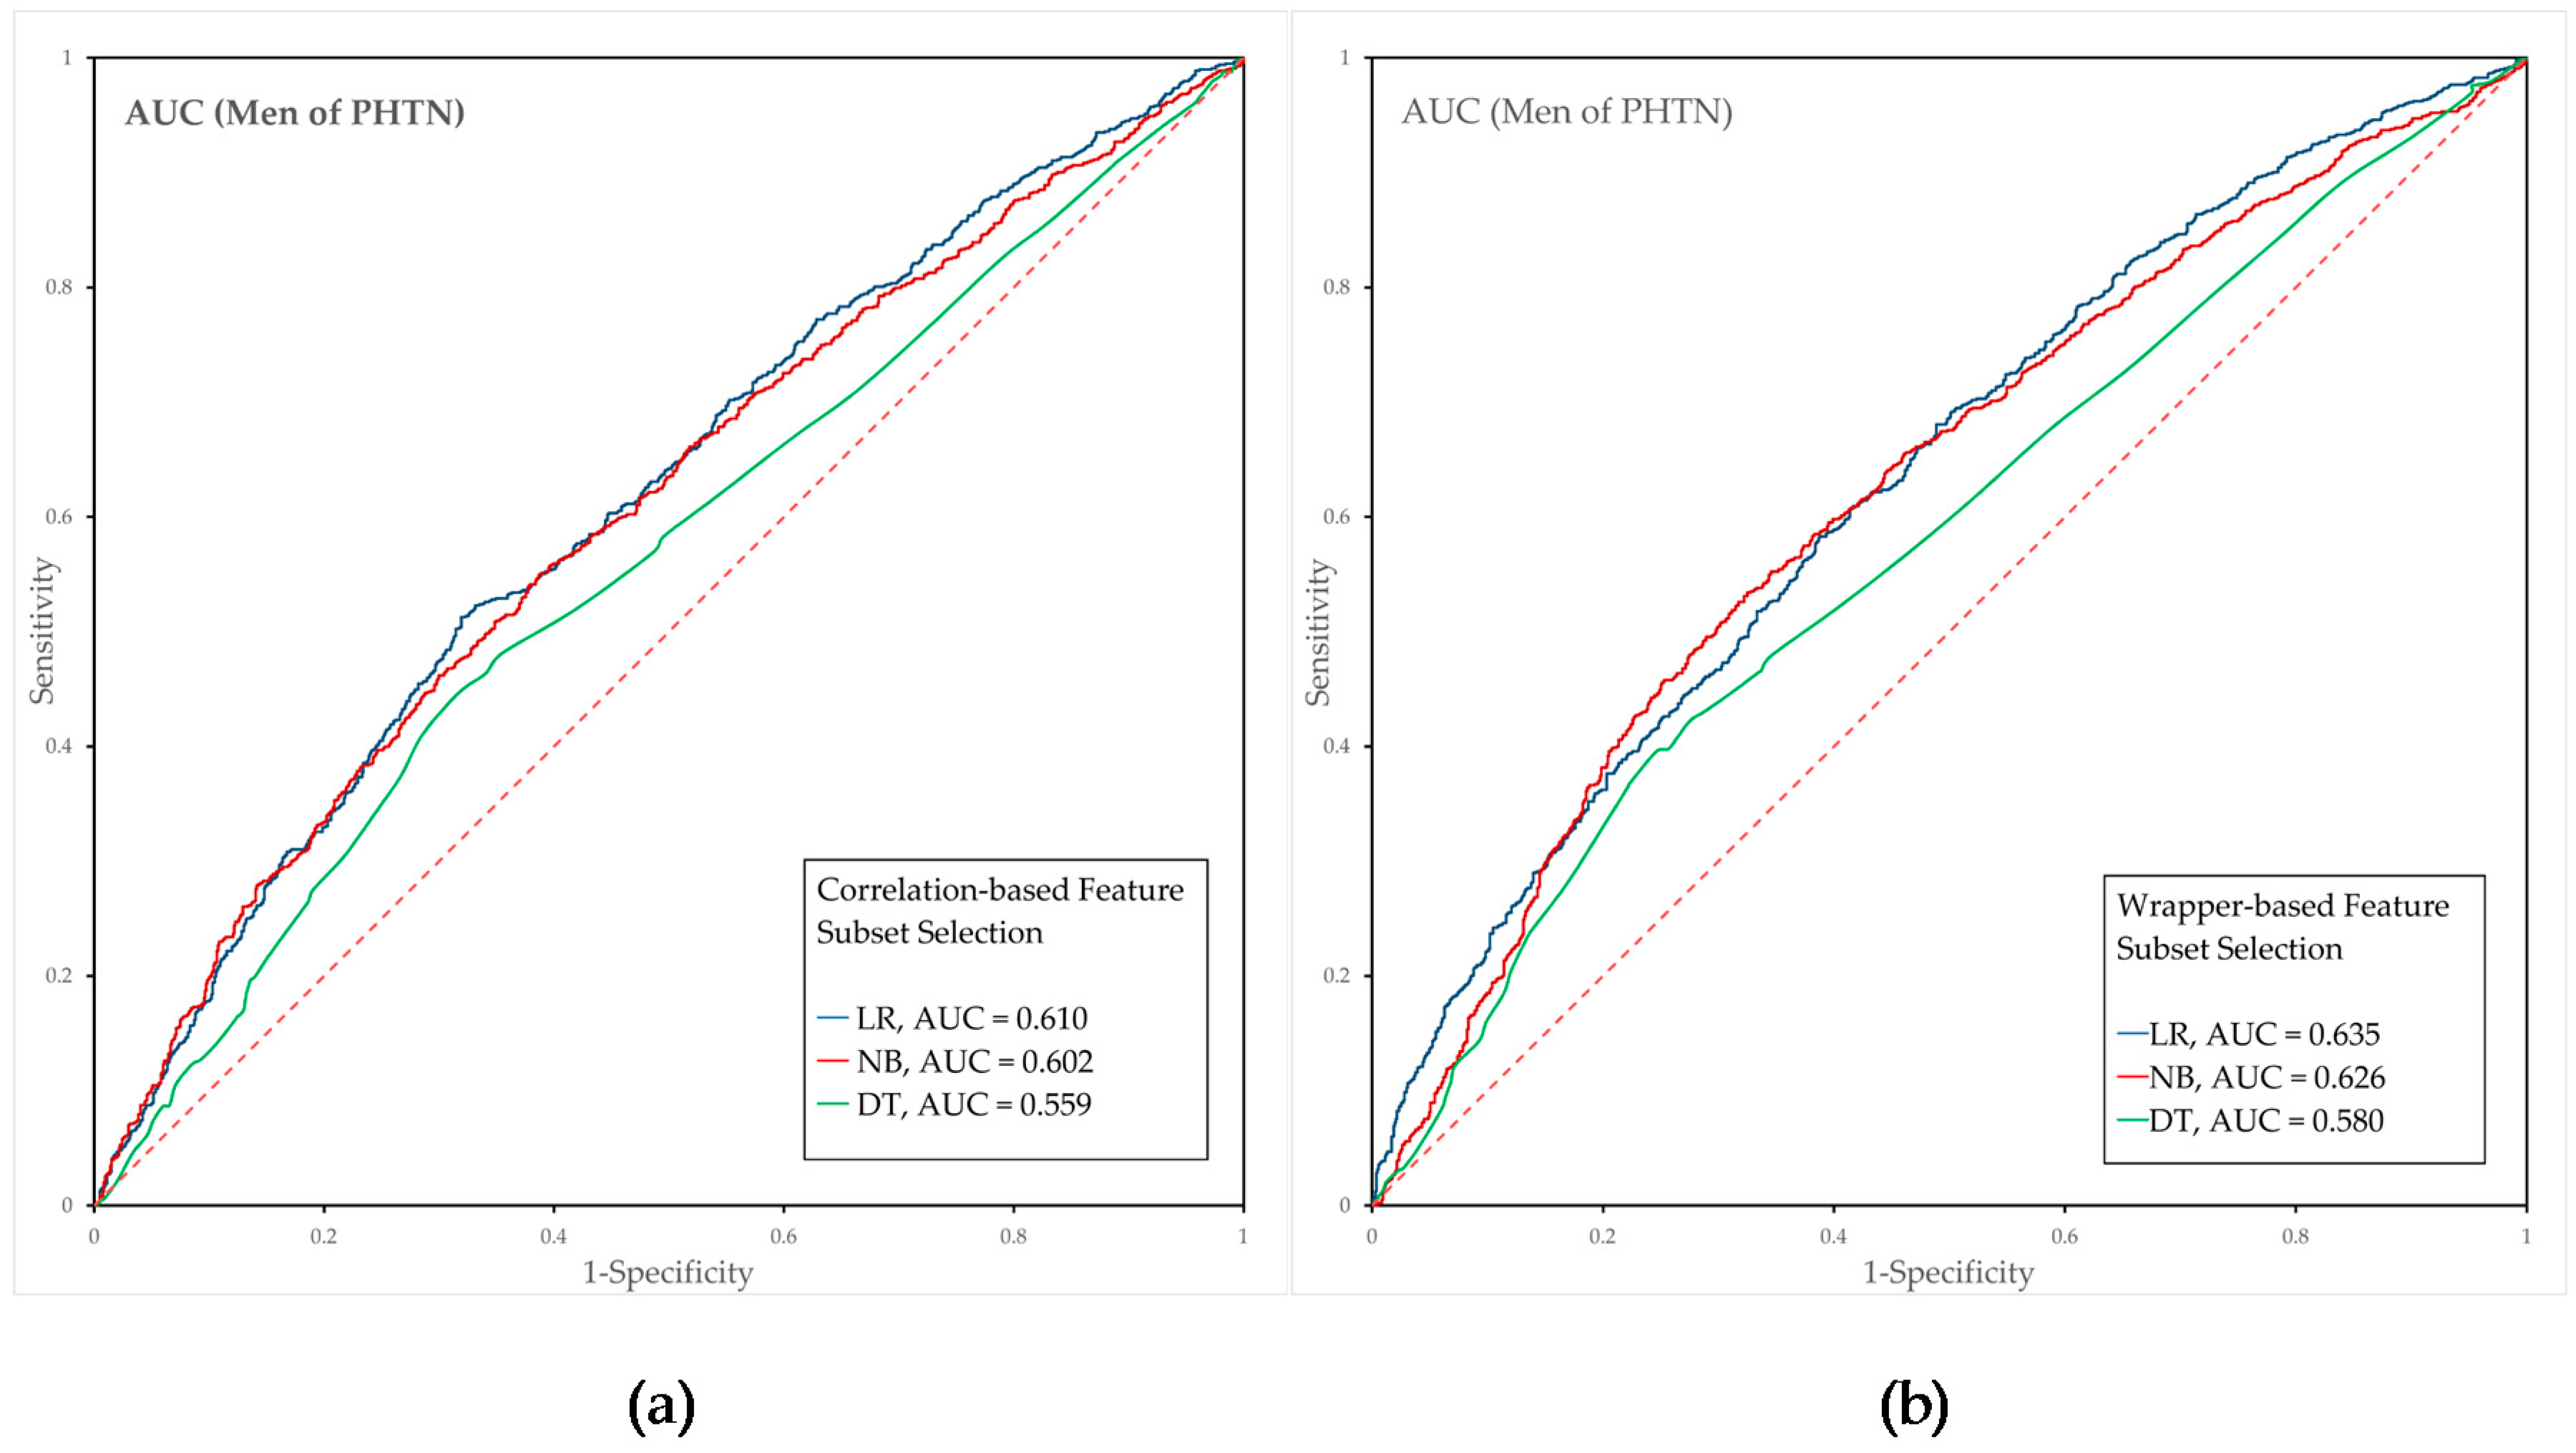
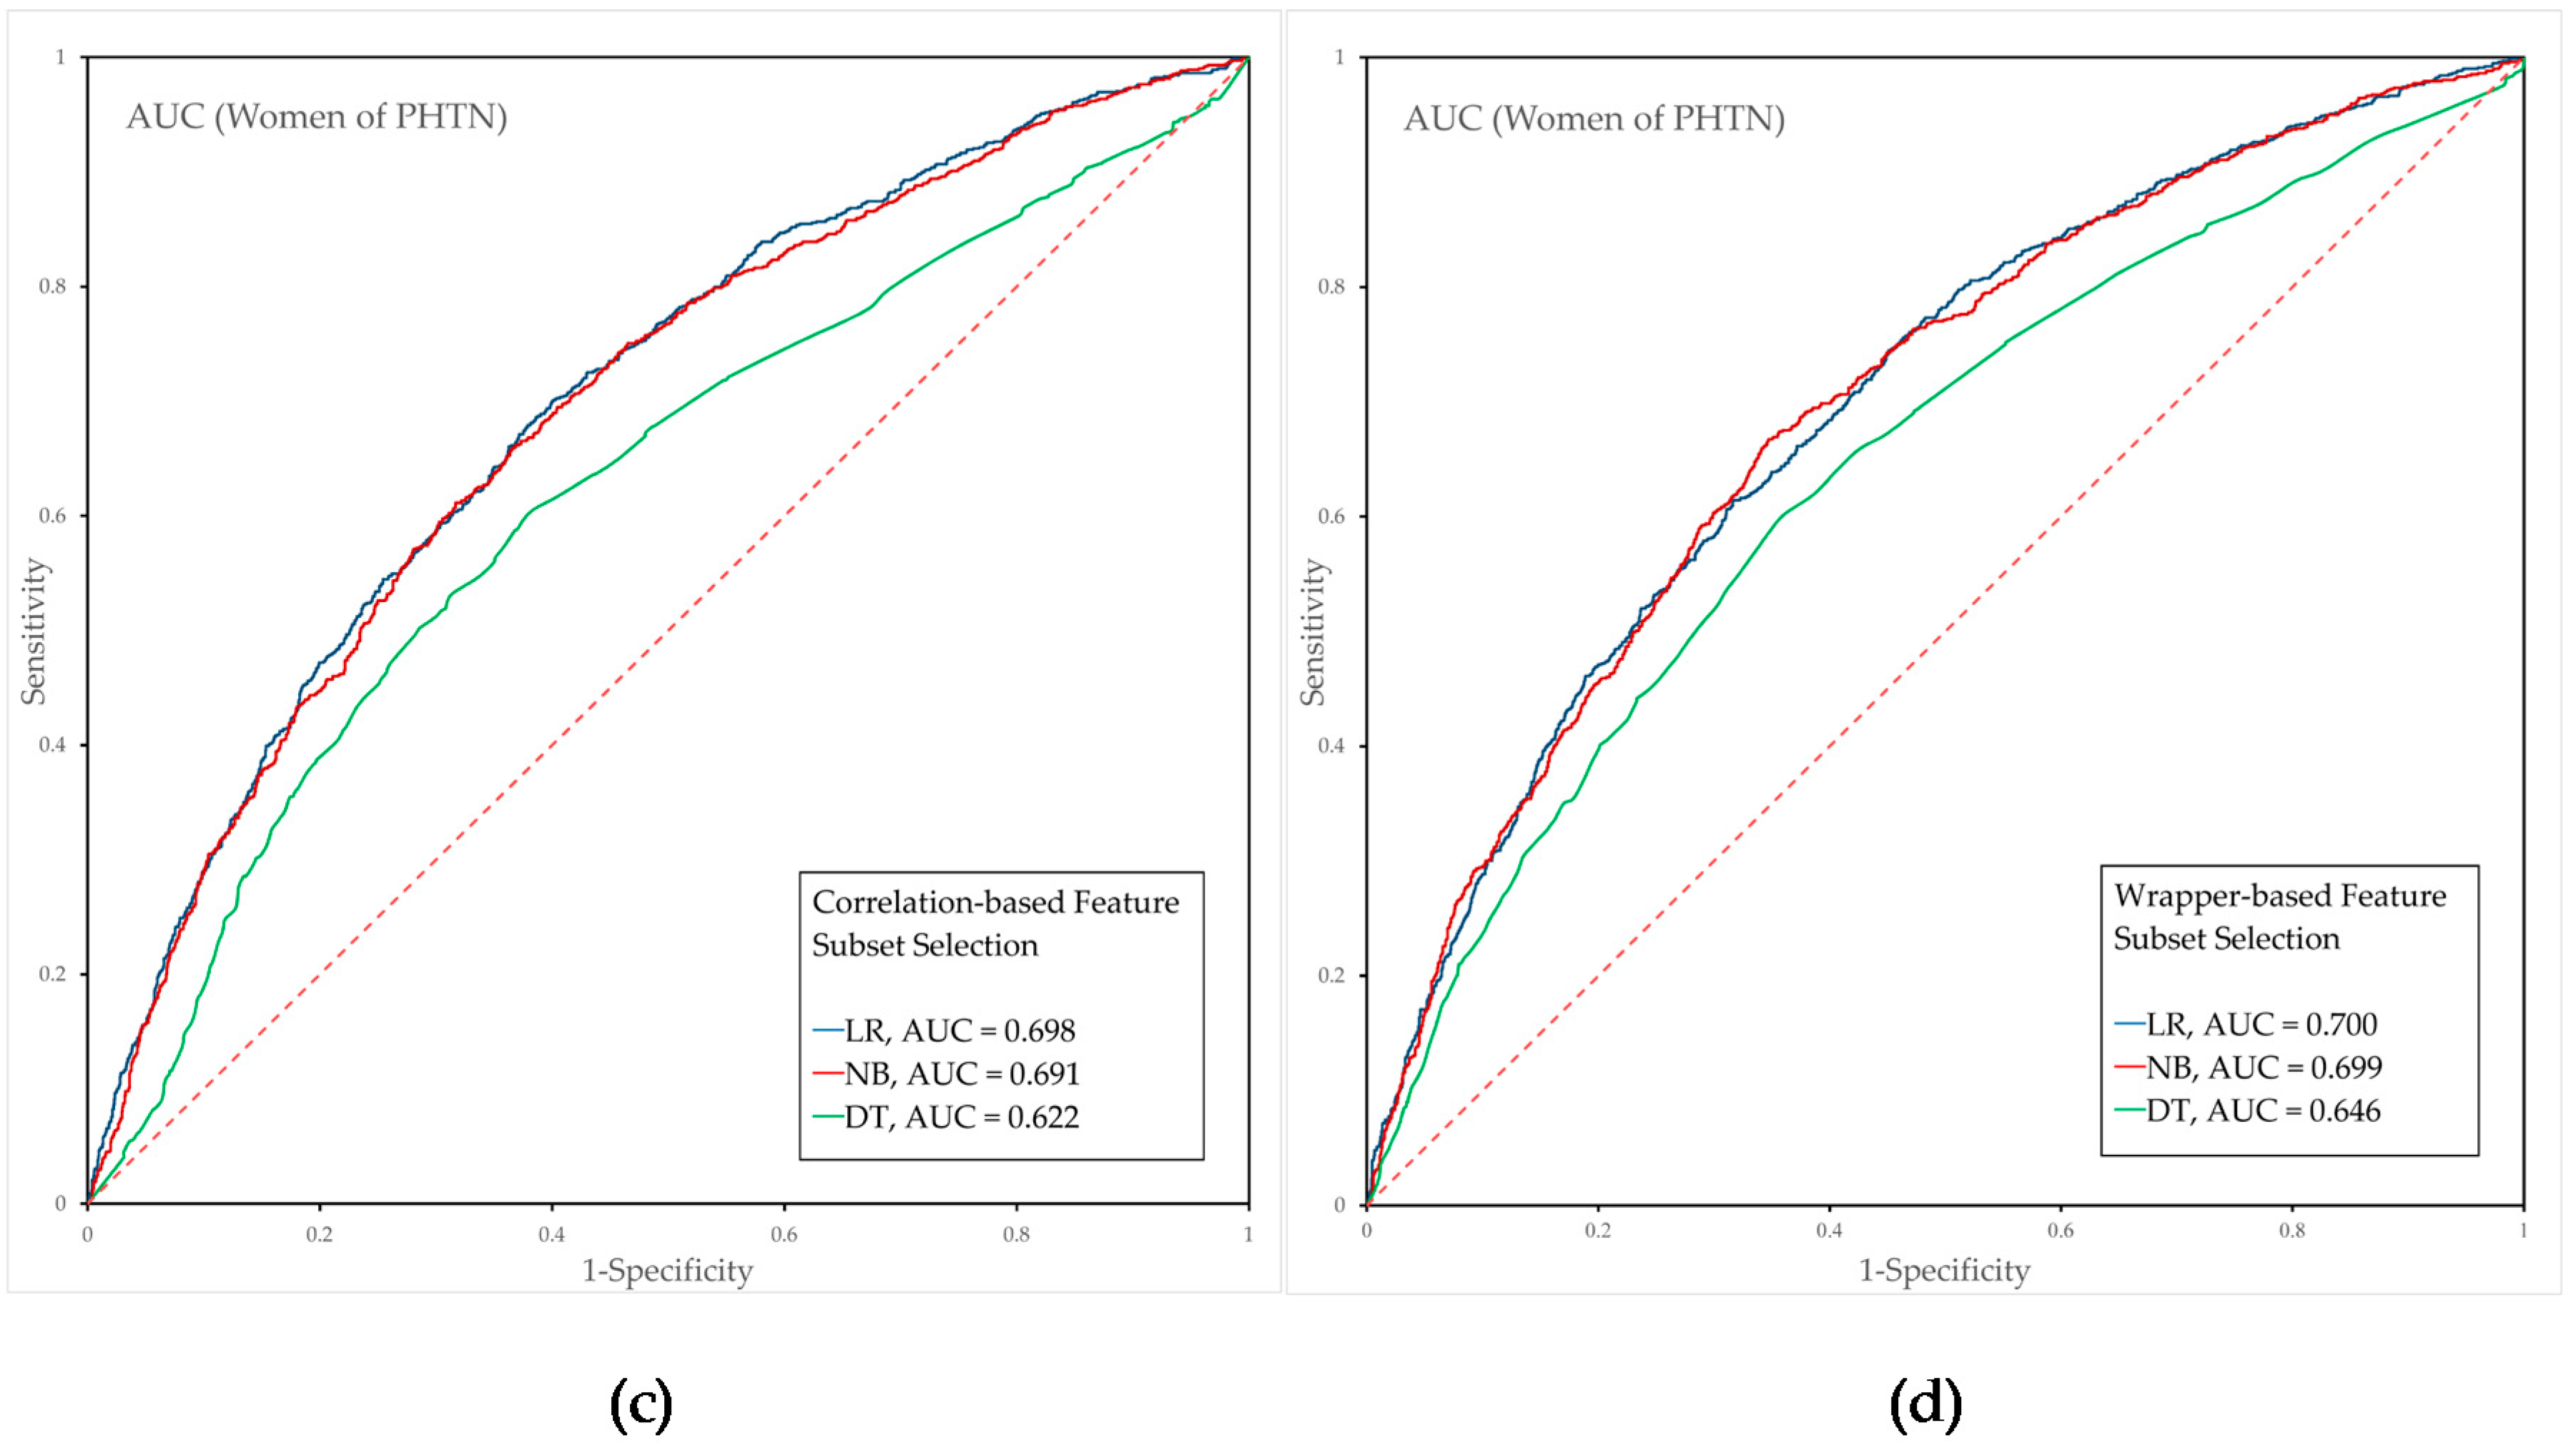
3.3. Performance Evaluation of the Prehypertension Prediction Model Combined with Feature Selection
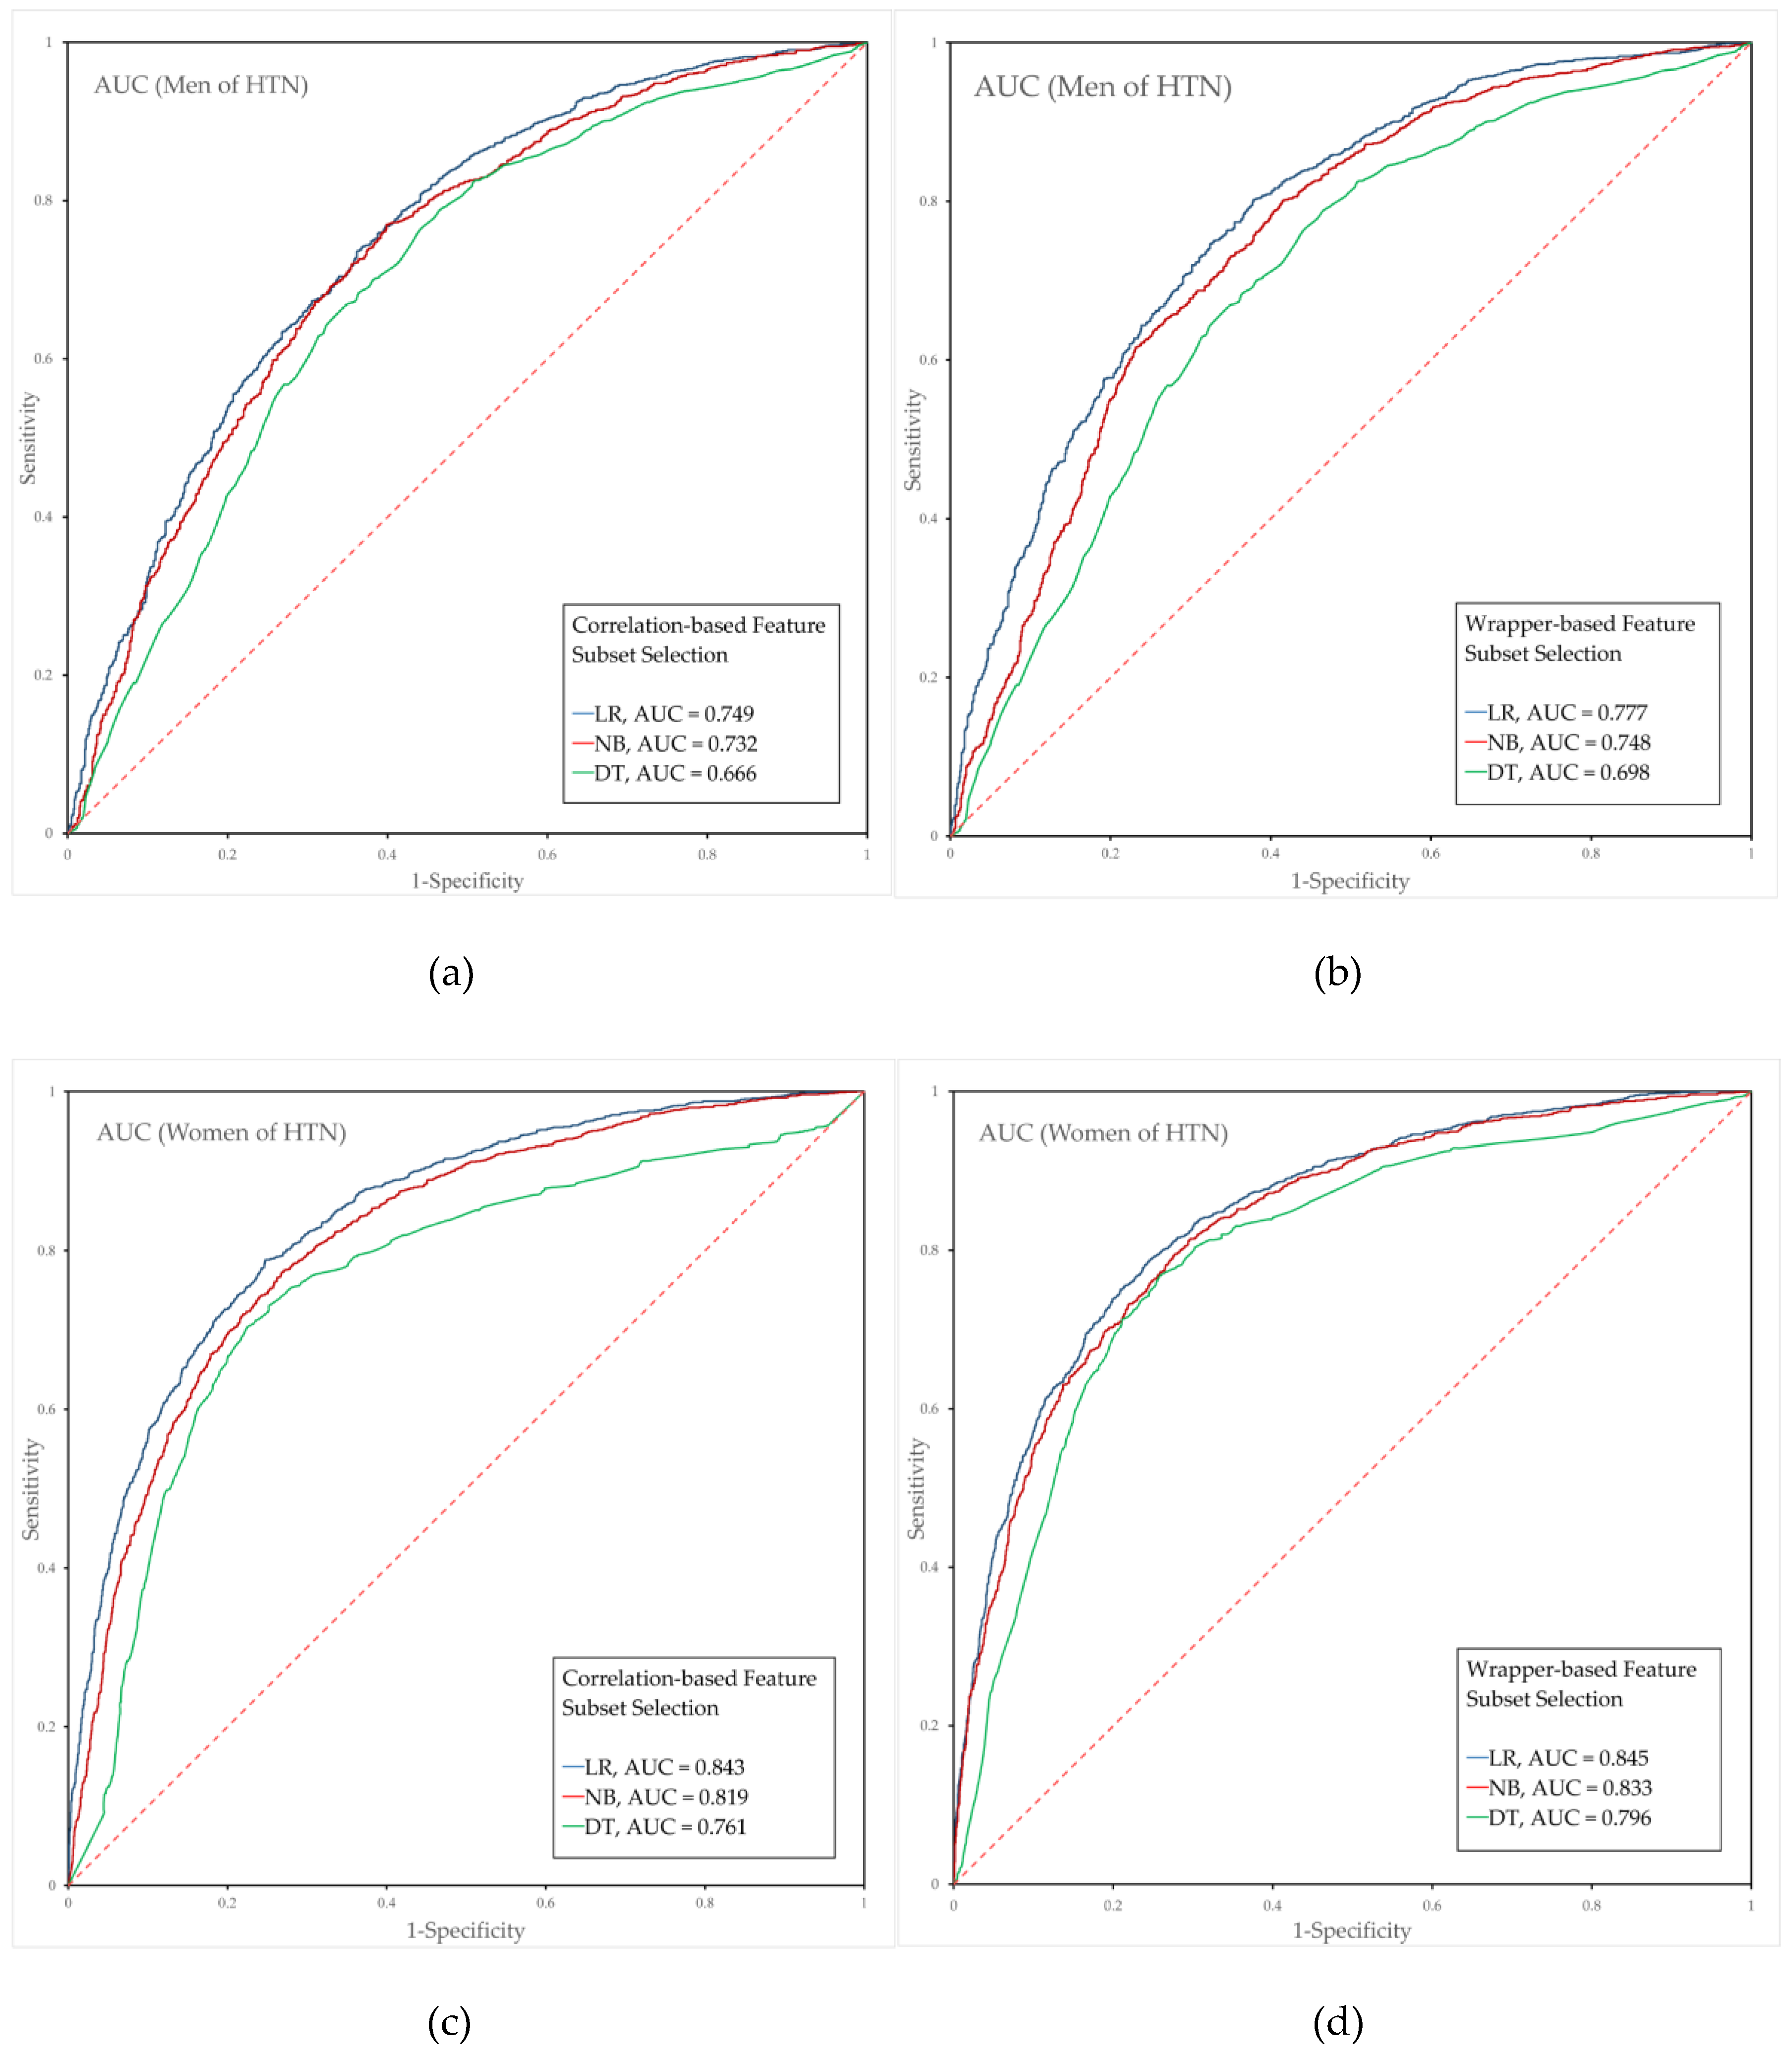
3.4. Performance Evaluation of the Hypertension Prediction Models Combined with Feature Selection
4. Discussion
5. Conclusions
Author Contributions
Funding
Acknowledgments
Conflicts of Interest
References
- James, P.A.; Oparil, S.; Carter, B.L.; Cushman, W.C.; Dennison-Himmelfarb, C.; Handler, J.; Lackland, D.T.; LeFevre, M.L.; MacKenzie, T.D.; Ogedegbe, O. 2014 evidence-based guideline for the management of high blood pressure in adults: Report from the panel members appointed to the Eighth Joint National Committee (JNC 8). Jama 2014, 311, 507–520. [Google Scholar] [CrossRef] [PubMed]
- Lawes, C.M.; Vander Hoorn, S.; Rodgers, A. Global burden of blood-pressure-related disease, 2001. Lancet 2008, 371, 1513–1518. [Google Scholar] [CrossRef]
- Ogden, L.G.; He, J.; Lydick, E.; Whelton, P.K. Long-term absolute benefit of lowering blood pressure in hypertensive patients according to the JNC VI risk stratification. Hypertension 2000, 35, 539–543. [Google Scholar] [CrossRef] [PubMed]
- Kannel, W.B. Blood pressure as a cardiovascular risk factor: Prevention and treatment. Jama 1996, 275, 1571–1576. [Google Scholar] [CrossRef] [PubMed]
- World Health Organization; International Society of Hypertension Writing Group. 2003 World Health Organization (WHO)/International Society of Hypertension (ISH) statement on management of hypertension. J. Hypertens. 2003, 21, 1983–1992. [Google Scholar] [CrossRef]
- Muntner, P.; Anderson, A.; Charleston, J.; Chen, Z.; Ford, V.; Makos, G.; O’Connor, A.; Perumal, K.; Rahman, M.; Steigerwalt, S. Hypertension awareness, treatment, and control in adults with CKD: Results from the Chronic Renal Insufficiency Cohort (CRIC) Study. Am. J. Kidney Dis. 2010, 55, 441–451. [Google Scholar] [CrossRef] [PubMed]
- Whelton, P.K.; Carey, R.M.; Aronow, W.S.; Casey, D.E.; Collins, K.J.; Himmelfarb, C.D.; DePalma, S.M.; Gidding, S.; Jamerson, K.A.; Jones, D.W. 2017 ACC/AHA/AAPA/ABC/ACPM/AGS/APhA/ASH/ASPC/NMA/PCNA Guideline for the Prevention, Detection, Evaluation, and Management of High Blood Pressure in Adults: A Report of the American College of Cardiology/American Heart Association Task Force on Clinical Practice Guidelines. J. Am. Coll. Cardiol. 2017, 71, e13–e115. [Google Scholar]
- Gupta, A.K.; McGlone, M.; Greenway, F.L.; Johnson, W.D. Prehypertension in disease-free adults: A marker for an adverse cardiometabolic risk profile. Hypertens. Res. 2010, 33, 905–910. [Google Scholar] [CrossRef] [PubMed]
- Vasan, R.S.; Larson, M.G.; Leip, E.P.; Evans, J.C.; O’Donnell, C.J.; Kannel, W.B.; Levy, D. Impact of high-normal blood pressure on the risk of cardiovascular disease. N. Engl. J. Med. 2001, 345, 1291–1297. [Google Scholar] [CrossRef] [PubMed]
- Kim, M.-J.; Lim, N.-K.; Park, H.-Y. Relationship between prehypertension and chronic kidney disease in middle-aged people in Korea: The Korean genome and epidemiology study. BMC Public Health 2012, 12, 960. [Google Scholar] [CrossRef] [PubMed]
- Greenlund, K.J.; Croft, J.B.; Mensah, G.A. Prevalence of heart disease and stroke risk factors in persons with prehypertension in the United States, 1999–2000. Arch. Intern. Med. 2004, 164, 2113–2118. [Google Scholar] [CrossRef]
- Chan, Q.; Stamler, J.; Griep, L.M.O.; Daviglus, M.L.; Van Horn, L.; Elliott, P. An update on nutrients and blood pressure. J. Atheroscler. Thromb. 2016, 23, 276–289. [Google Scholar] [CrossRef] [PubMed]
- Beckett, N.S.; Peters, R.; Fletcher, A.E.; Staessen, J.A.; Liu, L.; Dumitrascu, D.; Stoyanovsky, V.; Antikainen, R.L.; Nikitin, Y.; Anderson, C. Treatment of hypertension in patients 80 years of age or older. N. Engl. J. Med. 2008, 358, 1887–1898. [Google Scholar] [CrossRef] [PubMed]
- Hansson, L.; Zanchetti, A.; Carruthers, S.G.; Dahlöf, B.; Elmfeldt, D.; Julius, S.; Ménard, J.; Rahn, K.H.; Wedel, H.; Westerling, S. Effects of intensive blood-pressure lowering and low-dose aspirin in patients with hypertension: Principal results of the Hypertension Optimal Treatment (HOT) randomised trial. Lancet 1998, 351, 1755–1762. [Google Scholar] [CrossRef]
- Staessen, J.A.; Wang, J.-G.; Thijs, L. Cardiovascular protection and blood pressure reduction: A meta-analysis. Lancet 2001, 358, 1305–1315. [Google Scholar] [CrossRef]
- Carr, M.J.; Bao, Y.; Pan, J.; Cruickshank, K.; McNamee, R. The predictive ability of blood pressure in elderly trial patients. J. Hypertens. 2012, 30, 1725–1733. [Google Scholar] [CrossRef] [PubMed]
- Kannel, W.B.; Vasan, R.S. Assessment of cardiovascular risk and choice of antihypertensive therapy. Curr. Hypertens. Rep. 2004, 6, 346–351. [Google Scholar] [CrossRef] [PubMed]
- Tsai, J.-C.; Chang, W.-Y.; Kao, C.-C.; Lu, M.-S.; Chen, Y.-J.; Chan, P. Beneficial effect on blood pressure and lipid profile by programmed exercise training in Taiwanese patients with mild hypertension. Clin. Exp. Hypertens. 2002, 24, 315–324. [Google Scholar] [CrossRef] [PubMed]
- Pescatello, L.S.; Franklin, B.A.; Fagard, R.; Farquhar, W.B.; Kelley, G.A.; Ray, C.A. Exercise and hypertension. Med. Sci. Sports Exerc. 2004, 36, 533–553. [Google Scholar] [CrossRef] [PubMed]
- Liu, J.; Sui, X.; Lavie, C.J.; Zhou, H.; Park, Y.-M.M.; Cai, B.; Liu, J.; Blair, S.N. Effects of cardiorespiratory fitness on blood pressure trajectory with aging in a cohort of healthy men. J. Am. Coll. Cardiol. 2014, 64, 1245–1253. [Google Scholar] [CrossRef]
- Carnethon, M.R.; Gidding, S.S.; Nehgme, R.; Sidney, S.; Jacobs, D.R., Jr.; Liu, K. Cardiorespiratory fitness in young adulthood and the development of cardiovascular disease risk factors. Jama 2003, 290, 3092–3100. [Google Scholar] [CrossRef] [PubMed]
- Hayashi, T.; Tsumura, K.; Suematsu, C.; Okada, K.; Fujii, S.; Endo, G. Walking to work and the risk for hypertension in men: The Osaka Health Survey. Ann. Intern. Med. 1999, 131, 21–26. [Google Scholar] [CrossRef] [PubMed]
- Okosun, I.S.; Cooper, R.S.; Rotimi, C.N.; Osotimehin, B.; Forrester, T. Association of waist circumference with risk of hypertension and type 2 diabetes in Nigerians, Jamaicans, and African-Americans. Diabetes Care 1998, 21, 1836–1842. [Google Scholar] [CrossRef] [PubMed]
- Grievink, L.; Alberts, J.; O’niel, J.; Gerstenbluth, I. Waist circumference as a measurement of obesity in the Netherlands Antilles; associations with hypertension and diabetes mellitus. Eur. J. Clin. Nutr. 2004, 58, 1159–1165. [Google Scholar] [CrossRef] [PubMed]
- Olinto, M.; Nacul, L.; Gigante, D.; Costa, J.; Menezes, A.; Macedo, S. Waist circumference as a determinant of hypertension and diabetes in Brazilian women: A population-based study. Public Health Nutr. 2004, 7, 629–635. [Google Scholar] [CrossRef] [PubMed]
- Carba, D.B.; Bas, I.N.; Gultiano, S.A.; Lee, N.R.; Adair, L.S. Waist circumference and the risk of hypertension and prediabetes among Filipino women. Eur. J. Nutr. 2013, 52, 825–832. [Google Scholar] [CrossRef] [PubMed]
- Dua, S.; Bhuker, M.; Sharma, P.; Dhall, M.; Kapoor, S. Body Mass Index Relates to Blood Pressure among Adults. N. Am. J. Med. Sci. 2014, 6, 89–95. [Google Scholar] [CrossRef] [PubMed]
- Colin Bell, A.; Adair, L.S.; Popkin, B.M. Ethnic Differences in the Association between Body Mass Index and Hypertension. Am. J. Epidemiol. 2002, 155, 346–353. [Google Scholar] [CrossRef] [PubMed]
- Dalton, M.; Cameron, A.; Zimmet, P.; Shaw, J.; Jolley, D.; Dunstan, D.; Welborn, T. Waist circumference, waist–hip ratio and body mass index and their correlation with cardiovascular disease risk factors in Australian adults. J. Intern. Med. 2003, 254, 555–563. [Google Scholar] [CrossRef] [PubMed]
- Ko, G.T.; Chan, J.C.; Cockram, C.S.; Woo, J. Prediction of hypertension, diabetes, dyslipidaemia or albuminuria using simple anthropometric indexes in Hong Kong Chinese. Int. J. Obes. Relat. Metab. Disord. 1999, 23, 1136. [Google Scholar] [CrossRef] [PubMed]
- Li, W.-C.; Chen, I.-C.; Chang, Y.-C.; Loke, S.-S.; Wang, S.-H.; Hsiao, K.-Y. Waist-to-height ratio, waist circumference, and body mass index as indices of cardiometabolic risk among 36,642 Taiwanese adults. Eur. J. Nutr. 2013, 52, 57–65. [Google Scholar] [CrossRef] [PubMed]
- Lee, J.-W.; Lim, N.-K.; Baek, T.-H.; Park, S.-H.; Park, H.-Y. Anthropometric indices as predictors of hypertension among men and women aged 40–69 years in the Korean population: The Korean Genome and Epidemiology Study. BMC Public Health 2015, 15, 140. [Google Scholar] [CrossRef] [PubMed]
- Tsai, P.-S.; Ke, T.-L.; Huang, C.-J.; Tsai, J.-C.; Chen, P.-L.; Wang, S.-Y.; Shyu, Y.-K. Prevalence and determinants of prehypertension status in the Taiwanese general population. J. Hypertens. 2005, 23, 1355–1360. [Google Scholar] [CrossRef] [PubMed]
- Cirillo, M.; Laurenzi, M.; Trevisan, M.; Stamler, J. Hematocrit, blood pressure, and hypertension. The Gubbio Population Study. Hypertension 1992, 20, 319–326. [Google Scholar] [CrossRef] [PubMed]
- Emamian, M.; Hasanian, S.M.; Tayefi, M.; Bijari, M.; Shafiee, M.; Avan, A.; Heidari-Bakavoli, A.; Moohebati, M.; Ebrahimi, M.; Darroudi, S. Association of hematocrit with blood pressure and hypertension. J. Clin. Lab. Anal. 2017. [Google Scholar] [CrossRef] [PubMed]
- Singer, D.E.; Nathan, D.M.; Anderson, K.M.; Wilson, P.W.; Evans, J.C. Association of HbA1c with prevalent cardiovascular disease in the original cohort of the Framingham Heart Study. Diabetes 1992, 41, 202–208. [Google Scholar] [CrossRef] [PubMed]
- Coresh, J.; Wei, G.L.; McQuillan, G.; Brancati, F.L.; Levey, A.S.; Jones, C.; Klag, M.J. Prevalence of high blood pressure and elevated serum creatinine level in the United States: Findings from the third National Health and Nutrition Examination Survey (1988–1994). Arch. Intern. Med. 2001, 161, 1207–1216. [Google Scholar] [CrossRef] [PubMed]
- Chrysohoou, C.; Pitsavos, C.; Panagiotakos, D.B.; Skoumas, J.; Stefanadis, C. Association between prehypertension status and inflammatory markers related to atherosclerotic disease: The ATTICA Study. Am. J. Hypertens. 2004, 17, 568–573. [Google Scholar] [CrossRef] [PubMed]
- Sparrow, D.; Weiss, S.T.; Vokonas, P.S.; Cupples, L.A.; Ekerdt, D.J.; Colton, T. Forced vital capacity and the risk of hypertension: The Normative Aging Study. Am. J. Epidemiol. 1988, 127, 734–741. [Google Scholar] [CrossRef] [PubMed]
- Jacobs, D.R.; Yatsuya, H.; Hearst, M.O.; Thyagarajan, B.; Kalhan, R.; Rosenberg, S.; Smith, L.J.; Barr, R.G.; Duprez, D.A. Rate of Decline of Forced Vital Capacity Predicts Future Arterial Hypertension. Hypertension 2012, 59, 219–225. [Google Scholar] [CrossRef] [PubMed]
- Wu, Y.; Vollmer, W.M.; Buist, A.S.; Tsai, R.; Cen, R.; Wu, X.; Chen, P.; Lai, Y.; Guo, C.; Mai, J.; et al. Relationship between lung function and blood pressure in Chinese men and women of Beijing and Guangzhou. Int. J. Epidemiol. 1998, 27, 49–56. [Google Scholar] [CrossRef] [PubMed]
- Engström, G.; Wollmer, P.; Valind, S.; Hedblad, B.; Janzon, L. Blood pressure increase between 55 and 68 years of age is inversely related to lung function: Longitudinal results from the cohort study ‘Men born in 1914’. J. Hypertens. 2001, 19, 1203–1208. [Google Scholar] [CrossRef] [PubMed]
- Chobanian, A.V.; Bakris, G.L.; Black, H.R.; Cushman, W.C.; Green, L.A.; Izzo, J.L., Jr.; Jones, D.W.; Materson, B.J.; Oparil, S.; Wright, J.T., Jr. The seventh report of the joint national committee on prevention, detection, evaluation, and treatment of high blood pressure: The JNC 7 report. Jama 2003, 289, 2560–2571. [Google Scholar] [CrossRef] [PubMed]
- Ma, M.; Tan, X.; Zhu, S. Prehypertension and its optimal indicator among adults in Hubei Province, Central China, 2013–2015. Clin. Exp. Hypertens. 2017, 39, 532–538. [Google Scholar] [CrossRef] [PubMed]
- Jang, S.Y.; Ju, E.Y.; Choi, S.; Seo, S.; Kim, D.E.; Kim, D.-K.; Park, S.W. Prehypertension and obesity in middle-aged Korean men and women: The third Korea national health and nutrition examination survey (KNHANES III) study. J. Public Health 2012, 34, 562–569. [Google Scholar] [CrossRef] [PubMed]
- Halloran, J. Classification: Naive Bayes vs. Logistic Regression. Available online: http://melodi.ee.washington.edu/~halloj3/pdfs/john (accessed on 8 November 2018).
- Patil, T.R.; Sherekar, S. Performance analysis of Naive Bayes and J48 classification algorithm for data classification. Int. J. Comput. Sci. Appl. 2013, 6, 256–261. [Google Scholar]
- Guyon, I.; Elisseeff, A. An introduction to variable and feature selection. J. Mach. Learn. Res. 2003, 3, 1157–1182. [Google Scholar]
- Kohavi, R.; John, G.H. Wrappers for feature subset selection. Artif. Intell. 1997, 97, 273–324. [Google Scholar] [CrossRef]
- Tayefi, M.; Esmaeili, H.; Saberi Karimian, M.; Amirabadi Zadeh, A.; Ebrahimi, M.; Safarian, M.; Nematy, M.; Parizadeh, S.M.R.; Ferns, G.A.; Ghayour-Mobarhan, M. The application of a decision tree to establish the parameters associated with hypertension. Comput. Methods Progr. Biomed. 2017, 139, 83–91. [Google Scholar] [CrossRef] [PubMed]
- Ture, M.; Kurt, I.; Turhan Kurum, A.; Ozdamar, K. Comparing classification techniques for predicting essential hypertension. Expert Syst. Appl. 2005, 29, 583–588. [Google Scholar] [CrossRef]
- Park, H.W.; Li, D.; Piao, Y.; Ryu, K.H. A Hybrid Feature Selection Method to Classification and Its Application in Hypertension Diagnosis. In Proceedings of the International Conference on Information Technology in Bio-and Medical Informatics, Lyon, France, 28–31 August 2017; pp. 11–19. [Google Scholar]
- Li, D.; Park, H.W.; Ishag, M.I.M.; Batbaatar, E.; Ryu, K.H. Design and Partial Implementation of Health Care System for Disease Detection and Behavior Analysis by Using DM Techniques. In Proceedings of the 2016 IEEE 14th Intl. Conf. on Dependable, Autonomic and Secure Computing, 14th Intl Conf on Pervasive Intelligence and Computing, 2nd Intl. Conf. on Big Data Intelligence and Computing and Cyber Science and Technology Congress (DASC/PiCom/DataCom/CyberSciTech), Athens, Greece, 8–12 August 2016; pp. 781–786. [Google Scholar]


| Features | Men (Mean SD) | Women (Mean SD) | Description |
|---|---|---|---|
| SUBJECTS | 3637 | 4575 | Number of subjects |
| AGE ** | 57.38 (10.78) | 56.68 (10.34) | Years of age |
| HT *** | 168.57 (6.21) | 155.78 (5.8) | Height |
| WT *** | 69.36 (10.17) | 58.19 (8.3) | Weight |
| WC *** | 85.88 (8.31) | 80.17 (8.79) | Waist circumference |
| WHTR *** | 0.5 (0.05) | 0.51 (0.06) | Waist-to-height circumference ratio |
| BMI *** | 24.35 (2.94) | 23.97 (3.16) | Weight divided by height squared |
| GLU *** | 106.28 (25.48) | 99.74 (20.78) | Glucose |
| HBA1C *** | 5.97 (0.92) | 5.85 (0.74) | Hemoglobin A1c |
| TC *** | 189.4 (35.35) | 196.21 (35.39) | Total cholesterol |
| HDL *** | 46.78 (11.18) | 52.76 (12.07) | High-density lipid cholesterol |
| TG *** | 167.91 (134.62) | 125.17 (78.93) | Triglyceride |
| AST *** | 25.02 (12.59) | 21.83 (9.18) | Aspartate aminotransferase |
| ALT *** | 25.19 (16.71) | 19.29 (13.09) | Alanine aminotransferase |
| HGB *** | 15.1 (1.23) | 13.2 (1.13) | Hemoglobin |
| HCT *** | 44.59 (3.37) | 39.79 (2.98) | Hematocrit |
| BUN *** | 15.85 (4.71) | 14.57 (4.28) | Blood urea nitrogen |
| CRT *** | 0.98 (0.37) | 0.72 (0.23) | Creatinine |
| WBC *** | 6.58 (1.82) | 5.84 (1.63) | White blood cell |
| RBC *** | 4.8 (0.41) | 4.35 (0.33) | Red blood cell |
| FVC *** | 4.17 (0.7) | 2.96 (0.5) | Forced vital capacity |
| FVCP *** | 91.83 (11.82) | 94.47 (11.58) | Predicted forced vital capacity predicted |
| FEV1 *** | 3.12 (0.67) | 2.35 (0.45) | Forced expiratory volume in 1 s |
| FEV1P *** | 90.24 (13.86) | 94.51 (12.73) | Predicted forced expiratory volume in 1 s predicted |
| FEV1FVC *** | 0.74 (0.08) | 0.79 (0.06) | Ratio of forced expiratory volume in 1 s to forced vital capacity |
| FEV6 *** | 3.99 (0.72) | 2.89 (0.5) | Forced expiratory volume in 6 s |
| FEF25–75 *** | 2.69 (1.2) | 2.42 (0.83) | Forced expiratory flow 25–75% |
| PEF *** | 8.49 (1.91) | 6.08 (1.21) | Peak expiratory flow |
| SBP *** | 122.26 (15.66) | 119.52 (17.23) | Systolic blood pressure |
| DBP *** | 78.16 (10.29) | 74.69 (9.7) | Diastolic blood pressure |
| Men | Women | |||
|---|---|---|---|---|
| Features | p | OR (95% CI) | p | OR (95% CI) |
| HT | 0.6494 | 0.978 (0.890–1.074) | 0.1333 | 0.939 (0.866–1.019) |
| WT | <0.0001 | 1.364 (1.241–1.500) | <0.0001 | 1.348 (1.248–1.455) |
| WC | <0.0001 | 1.318 (1.206–1.441) | <0.0001 | 1.385 (1.281–1.498) |
| WHTR | <0.0001 | 1.335 (1.219–1.462) | <0.0001 | 1.424 (1.313–1.545) |
| BMI | <0.0001 | 1.429 (1.303–1.567) | <0.0001 | 1.427 (1.321–1.542) |
| GLU | 0.0042 | 1.142 (1.042–1.251) | <0.0001 | 1.289 (1.180–1.410) |
| HBA1C | 0.1937 | 1.059 (0.970–1.157) | <0.0001 | 1.225 (1.126–1.333) |
| TC | 0.0102 | 1.122 (1.027–1.225) | <0.0001 | 1.229 (1.139–1.326) |
| HDL | 0.0035 | 1.138 (1.043–1.242) | 0.0381 | 0.924 (0.857–0.995) |
| TG | 0.0001 | 1.203 (1.093–1.323) | <0.0001 | 1.259 (1.162–1.365) |
| AST | 0.0006 | 1.193 (1.078–1.320) | 0.0990 | 1.070 (0.987–1.160) |
| ALT | 0.0004 | 1.187 (1.078–1.308) | <0.0001 | 1.191 (1.092–1.300) |
| HGB | <0.0001 | 1.322 (1.204–1.452) | <0.0001 | 1.166 (1.080–1.259) |
| HCT | <0.0001 | 1.262 (1.151–1.383) | 0.0001 | 1.159 (1.074–1.250) |
| BUN | 0.1314 | 0.933 (0.854–1.020) | 0.1414 | 0.943 (0.872–1.019) |
| CRT | 0.6373 | 0.979 (0.898–1.068) | 0.8151 | 0.991 (0.921–1.066) |
| WBC | 0.0673 | 1.084 (0.994–1.183) | <0.0001 | 1.216 (1.126–1.313) |
| RBC | 0.0009 | 1.168 (1.065–1.281) | <0.0001 | 1.285 (1.191–1.385) |
| FVC | 0.5738 | 1.029 (0.931–1.137) | <0.0001 | 0.827 (0.759–0.902) |
| FVCP | 0.8888 | 0.993 (0.909–1.085) | <0.0001 | 0.814 (0.755–0.877) |
| FEV1 | 0.6471 | 1.026 (0.916–1.150) | 0.0004 | 0.846 (0.770–0.928) |
| FEV1P | 0.3469 | 1.042 (0.955–1.138) | 0.0016 | 0.886 (0.822–0.955) |
| FEV1FVC | 0.8762 | 1.007 (0.912–1.113) | 0.3055 | 1.042 (0.962–1.129) |
| FEV6 | 0.7524 | 1.017 (0.914–1.130) | <0.0001 | 0.817 (0.747–0.893) |
| FEF25–75 | 0.9208 | 0.994 (0.891–1.109) | 0.6338 | 1.021 (0.937–1.112) |
| PEF | 0.9393 | 1.003 (0.908–1.109) | 0.1210 | 0.937 (0.864–1.017) |
| Men | Women | |||
|---|---|---|---|---|
| Features | p | OR (95% CI) | p | OR (95% CI) |
| HT | 0.0139 | 0.896 (0.822–0.978) | 0.0048 | 0.883 (0.810–0.963) |
| WT | <0.0001 | 1.745 (1.592–1.912) | <0.0001 | 1.768 (1.627–1.921) |
| WC | <0.0001 | 1.789 (1.637–1.955) | <0.0001 | 1.927 (1.764–2.105) |
| WHTR | <0.0001 | 1.902 (1.734–2.086) | <0.0001 | 2.071 (1.884–2.276) |
| BMI | <0.0001 | 1.993 (1.817–2.185) | <0.0001 | 2.033 (1.861–2.221) |
| GLU | <0.0001 | 1.363 (1.247–1.489) | <0.0001 | 1.675 (1.508–1.861) |
| HBA1C | <0.0001 | 1.248 (1.148–1.357) | <0.0001 | 1.539 (1.393–1.700) |
| TC | 0.0085 | 0.897 (0.827–0.972) | 0.6831 | 0.984 (0.912–1.061) |
| HDL | 0.5808 | 1.022 (0.944–1.106) | 0.0001 | 0.857 (0.792–0.926) |
| TG | <0.0001 | 1.434 (1.304–1.576) | <0.0001 | 1.423 (1.306–1.551) |
| AST | <0.0001 | 1.341 (1.212–1.485) | <0.0001 | 1.238 (1.134–1.350) |
| ALT | <0.0001 | 1.310 (1.198–1.432) | <0.0001 | 1.453 (1.317–1.602) |
| HGB | 0.0001 | 1.175 (1.081–1.278) | <0.0001 | 1.251 (1.151–1.359) |
| HCT | 0.0055 | 1.123 (1.034–1.220) | <0.0001 | 1.205 (1.112–1.306) |
| BUN | 0.4573 | 1.030 (0.951–1.117) | 0.0836 | 1.076 (0.990–1.169) |
| CRT | 0.0110 | 1.235 (1.049–1.453) | 0.0001 | 1.334 (1.149–1.549) |
| WBC | <0.0001 | 1.183 (1.092–1.282) | <0.0001 | 1.347 (1.243–1.460) |
| RBC | 0.0006 | 1.158 (1.064–1.260) | <0.0001 | 1.390 (1.283–1.505) |
| FVC | <0.0001 | 0.817 (0.744–0.898) | <0.0001 | 0.694 (0.630–0.764) |
| FVCP | <0.0001 | 0.791 (0.728–0.859) | <0.0001 | 0.681 (0.629–0.739) |
| FEV1 | 0.0263 | 0.888 (0.799–0.986) | <0.0001 | 0.753 (0.679–0.835) |
| FEV1P | 0.3479 | 0.962 (0.888–1.042) | <0.0001 | 0.827 (0.763–0.895) |
| FEV1FVC | 0.0046 | 1.138 (1.040–1.245) | 0.0002 | 1.170 (1.076–1.272) |
| FEV6 | <0.0001 | 0.806 (0.729–0.890) | <0.0001 | 0.682 (0.617–0.754) |
| FEF25-75 | 0.2276 | 1.063 (0.962–1.176) | 0.2248 | 1.057 (0.966–1.157) |
| PEF | 0.1416 | 0.933 (0.852–1.023) | 0.5117 | 0.970 (0.888–1.060) |
| Sex | BPS | FSM | Selected Features |
|---|---|---|---|
| Men | PHTN | CFS | WT, WHTR, BMI, GLU, AST, ALT, HGB |
| WFS | LR: AGE, BMI, GLU, TC, HDL, TG, AST, HGB and BUN; NB: AGE, BMI, GLU, HDL, TG, AST and WBC; DT: HT, BMI, GLU, TG, WBC and FEV1; | ||
| HTN | CFS | AGE, WC, WHTR, BMI, GLU, HBA1C, AST, CRT, FVC and FEV1 | |
| WFS | LR: AGE, WHTR, BMI, GLU, TC, HDL, TG, AST, BUN, CRT, WBC, FVC, FEV1FVC, FEV6 and PEF; NB: AGE, WHTR, BMI, GLU, TC, HDL, AST, HGB and PEF; DT: AGE, WHTR, BMI, AST and FEV6; | ||
| Women | PHTN | CFS | AGE, WT, WC, WHTR, BMI, GLU, HBA1C, TC, TG, HGB, RBC, FVC, FEV1, FEV6 and PEF |
| WFS | LR: AGE, WHTR, BMI, GLU, TC, TG, WBC, RBC and FVCP; NB: AGE, WT, WHTR, TC, TG, HGB, RBC, FVCP and PEF; DT: AGE, WHTR, BMI, GLU, HCT, RBC, FEV1 and FEV1P; | ||
| HTN | CFS | AGE, WC, WHTR, BMI, GLU, HBA1C, TG, ALT, CRT, RBC, FEV1, FEV6 and PEF | |
| WFS | LR: AGE, WC, BMI, GLU, TC, HDL, TG, ALT, CRT, WBC, RBC, FVC, FEV6 and FEF25–75; NB: AGE, BMI, TC, HGB, RBC and FVCP; DT: AGE, BMI, GLU and HGB; |
© 2018 by the authors. Licensee MDPI, Basel, Switzerland. This article is an open access article distributed under the terms and conditions of the Creative Commons Attribution (CC BY) license (http://creativecommons.org/licenses/by/4.0/).
Share and Cite
Heo, B.M.; Ryu, K.H. Prediction of Prehypertenison and Hypertension Based on Anthropometry, Blood Parameters, and Spirometry. Int. J. Environ. Res. Public Health 2018, 15, 2571. https://doi.org/10.3390/ijerph15112571
Heo BM, Ryu KH. Prediction of Prehypertenison and Hypertension Based on Anthropometry, Blood Parameters, and Spirometry. International Journal of Environmental Research and Public Health. 2018; 15(11):2571. https://doi.org/10.3390/ijerph15112571
Chicago/Turabian StyleHeo, Byeong Mun, and Keun Ho Ryu. 2018. "Prediction of Prehypertenison and Hypertension Based on Anthropometry, Blood Parameters, and Spirometry" International Journal of Environmental Research and Public Health 15, no. 11: 2571. https://doi.org/10.3390/ijerph15112571
APA StyleHeo, B. M., & Ryu, K. H. (2018). Prediction of Prehypertenison and Hypertension Based on Anthropometry, Blood Parameters, and Spirometry. International Journal of Environmental Research and Public Health, 15(11), 2571. https://doi.org/10.3390/ijerph15112571