Article

Eating Frequency Is Not Associated with Obesity in Chinese Adults

1
School of Health Sciences, Wuhan University, Wuhan 430071, China
2
Abt Associates, Durham, NC 27703, USA
3
Cerus Consulting, LLC, Winston-Salem, NC 27101, USA
4
College of Life Sciences, South-Central University for Nationalities, Wuhan 430074, China
5
Department of Nutrition, the University of Tennessee at Knoxville, Knoxville, TN 37996, USA
6
Department of Family & Community Medicine, Wake Forest School of Medicine, Wake Forest Baptist Medical Center, Medical Center Boulevard, Winston-Salem, NC 27157, USA
7
Department of Epidemiology & Prevention, Wake Forest School of Medicine, Bowman Gray Center, 475 Vine St, Winston-Salem, NC 27101, USA
8
Department of Implementation Science, Wake Forest School of Medicine, Bowman Gray Center, 475 Vine St, Winston-Salem, NC 27101, USA
*
Authors to whom correspondence should be addressed.
These authors contributed equally to this work.
Int. J. Environ. Res. Public Health 2018, 15(11), 2561; https://doi.org/10.3390/ijerph15112561
Submission received: 15 October 2018 / Revised: 11 November 2018 / Accepted: 12 November 2018 / Published: 15 November 2018
(This article belongs to the Section Health Behavior, Chronic Disease and Health Promotion)

Abstract

:
The prevalence of overweight and obesity has been increasing globally. Recent studies suggest that eating frequency (EF) might be a factor influencing the development of overweight and obesity. This study aims to explore the association between eating frequency and obesity in Chinese adults. A cross-sectional study was conducted in Wuhan, China, from March to June 2016. A self-administered questionnaire and 24-h dietary recall were used to collect data on sociodemographic variables, lifestyle factors, nutrition knowledge, and eating frequency. Participants were divided into four groups according to eating frequency and meal timing: traditional time pattern (TTP), traditional time plus late snack pattern (TTLSP), irregular time pattern (ITP), and all-day pattern (ADP). We performed the chi-squared test and multiple logistic regression to assess associations among variables using JMP statistical software version 14.0.0 (SAS Institute Inc., Cary, NC, USA). Respondents were Chinese adults (N = 2290; range 29–74 years; 1162 men). Lower education level, higher food budget, and lower nutrition knowledge were associated with higher likelihood of irregular EF patterns (TTLSP, ITP, or ADP). Men, non-smokers, and participants with less physical activity, lower education level, or lower nutrition knowledge were more likely to be obese. Body mass index (BMI) categorization was significantly different among EF pattern groups (χ2 = 25.40, p = 0.003); however, this association was no longer significant in the regression model after adjustment for age, sex, education, smoking, food budget, nutrition knowledge, and physical activity. Thus, EF is not associated with obesity in Chinese adults.

1. Introduction

The prevalence of being overweight and obesity has been increasing globally. As reported by the World Health Organization, more than 1.9 billion adults were overweight in 2016, and of these, over 650 million were obese [1]. In China, in 2013, 28.3% of men and 27.4% of women aged ≥20 years old were overweight or obese [2]. Overweight and obesity are associated with increased risk of many serious diseases and health conditions, including cardiovascular diseases [3], osteoarthritis [4], and certain cancers [5]. The fundamental cause of obesity and overweight is an energy imbalance between calories consumed and calories expended [2]. As a determining factor of energy intake, eating frequency (EF) has been suggested to be a factor potentially influencing overweight and obesity [6].
EF is defined as the number of eating occasions per day; commonly in research contexts, an eating occasion is defined as any instance in which participants report consumption of a meal or a snack, with a minimum gap of 15 min set between eating occasions (or they are counted as the same occasion) [7,8]. In 1964, Fábry et al. reported that lower EF might increase body weight [6]. Subsequently, many epidemiologic studies have been conducted to investigate the association between EF and body weight; however, the results have been highly inconsistent. Previous studies have observed inverse [9,10,11,12,13,14], null [15,16,17], and positive [18,19] associations of EF with overweight and obesity. Murakami et al. suggested that the inconsistencies were caused by different methods of assessing EF [18]. Currently, four different definitions of EF are commonly employed in surveys assessing meal and snack frequency based upon (1) contribution to total energy intake [20], (2) time of day [21], (3) self-reported eating occasions [22], and (4) neutral definition [23]. Lack of adjustment for potentially influential factors also contributed to the inconsistencies; potential confounding roles of physical activity, socioeconomic status, smoking, and nutrition knowledge have been reported [18,24,25,26,27,28,29]. Although several studies along these lines have been conducted in Western populations, studies conducted in eastern Asian populations are still lacking.
Therefore, the objective of the present investigation is to explore the associations between EF and overweight/obesity in Chinese adults, focusing on the influences of adjustment for nutrition knowledge, sociodemographic, and lifestyle factors.

2. Materials and Methods

2.1. Study Design

This cross-sectional study was conducted in Wuhan, China, from March to June 2016. A self-administered questionnaire was reviewed by a panel of experts and then piloted online for comprehensibility in April 2016. In the pretest, a convenience sample of 113 individuals completed the survey and the questions were evaluated by an expert panel for content, length, and readability. Forty-three questions were included in the final version. In the first week of May 2016, a revised questionnaire was distributed to adults whose children were studying at the No. 1 Jiangxia High School or the No. 4 Jiangxia Middle School in Wuhan, China; participants responded to the questionnaire voluntarily, without any incentives. Written informed consent was obtained from the participants before the completion of the survey. The study was conducted in accordance with the Declaration of Helsinki, and all procedures were approved by the Wuhan University Ethics Board (ethical approval code: 2016031270) and the school district administrators.
A total of 2824 adults consented to participate in the survey, of whom 2290 adults (aged 29–74; 1162 men and 1128 women) were included in the analytical sample. We excluded individuals according to the following criteria: BMI scores ± 2 z-scores above or below the normal range (i.e., BMI < 15.43 kg/m2 or BMI > 32.00 kg/m2); non-viable answers on the nutrition knowledge questions (e.g., answering “A” on all items).

2.2. Assessment of Sociodemographic Characteristics

Demographic information was collected by self-report. Age was divided into 29–33, 34–38, 39–43, 44–48, 49–53, 54–58, 59–63, 64–68, and 69–73-year-old groups, while educational attainment was divided into primary school, middle school, high school, some college, bachelor’s degree, and graduate degree groups. Information on current smoking status (yes or no) and weekly food budget was also collected. In 2013, the Engle’s Coefficient (food expenditures/total living expenditures) of China was 35% [30], and the annual average food cost of city residents was 26,955 RMB; therefore, the average monthly food budget was 786 RMB. We categorized food budgets into less than 500 RMB, 500–1000 RMB, 1000–1500 RMB, and more than 1500 RMB monthly.

2.3. Assessment and Definition of EF

EF was defined based upon the time of day participants reported eating meals [21]. We used the time intervals and local eating time traditions to define whether EF pattern was regular or not. A 24-h diet recall method was applied, in which participants were asked to report meals and snacks eaten between the hours of 600–1000, 1000–1100, 1100–1400, 1400–1600, 1600–2000, and 2000–600. Eating only between 600–1000, 1100–1400, and 1600–2000 was defined as the traditional time pattern (TTP). The traditional time plus late snack pattern (TTLSP) was assigned to people who ate meals at the TTP but also ate a snack between 2000 and 0600. The all-day pattern (ADP) was people who ate in each of the six-time blocks. The irregular time pattern (ITP) covered all people who did not fall into the other categories.

2.4. Evaluation of Nutrition Knowledge

Since there is no widely used or validated scale to evaluate nutrition knowledge in China, we designed a questionnaire based on previous Chinese research examining nutritional knowledge, attitudes, and practice [31]. Thirteen nutrition questions, pilot-tested for readability and content validity, were included in our questionnaire. A score of 1 was assigned when an answer was correct; correct answers were summed, and nutrition knowledge was categorized based on the total score (0–6 for low, 7–10 for moderate, and 11–13 for high levels of nutrition knowledge). Participant data were used only if they reported on a separate question that their responses represented their typical eating pattern.

2.5. Assessment of Overweight/Obesity and Physical Activity

Body mass index (BMI) was calculated by self-reported height (kg) and weight (m2), with overweight and obesity respectively defined as BMI ≥ 24.0 kg/m2 and ≥ 28.0 kg/m2, according to Chinese national standards [32]. Physical activity intensity was categorized according to how many days per week the respondent reported being engaged in high-intensity physical activities; examples given were running and jogging, hiking, riding a bicycle at a high speed, and competitive sports. Responses were dichotomized: participants who reported vigorous physical activity at least 4 days/week were considered to have an active lifestyle.

2.6. Statistical Analysis

Statistical analyses were performed using JMP statistical software, version 14.0.0 (SAS Institute Inc., Cary, NC, USA). Descriptive statistics were used to describe the distribution of the variables. The chi-squared test was conducted to compare Overweight/Obesity (BMI ≥ 24.0 kg/m2), nutrition knowledge, and sociodemographic, and lifestyle factors among EF patterns. Nominal logistic regression models were carried out to explore the potential influences on EF patterns. The association between EF pattern and BMI group was analyzed using models adjusted for sex, age, smoking, education, physical activity, food budget, and nutrition knowledge. Two-tailed statistical significance was set at p < 0.05.

3. Results

3.1. Demographic Information

Characteristics of participants are summarized in Table 1. Most participants were between 29–59 years old. Nearly 50% of men reported smoking. Most respondents were distributed between two food budget categories (≤1000 RMB/month or >1000 RMB/month). Over three-quarters of participants reported that they did not engage in regular vigorous physical activity (≥4 days per week). Only 27% of the participants had a high level of nutrition knowledge, and about 28% of participants were either overweight or obese. Respectively, 48%, 30%, 10%, and 12% of participants ate with TTP, ITP, TTLSP, and ADP.

3.2. Differences in BMI Distribution, Nutrition Knowledge, and Food Budget among EF Patterns

Table 2 shows a crosstabulation describing BMI distribution across different EF patterns. The percentage of respondents who were obese by EF pattern was 12.8% for ADP, 11.4% for TTLSP, 9.9% for ITP, and 9.5% for TTP. The difference in BMI distribution among EF patterns was statistically significant (χ2 = 25.40, p = 0.003). Table 3 shows that low nutrition knowledge rates increased, and high rates decreased in the above order. The difference in nutrition knowledge among EF patterns was significant (χ2 = 152.81, p < 0.001). There was a significant difference in food budget across EF patterns (χ2 = 59.83, p < 0.001). Notably, a greater percentage of participants spent more than 1500 RMB on foods from TTP to ADP (Table 4).

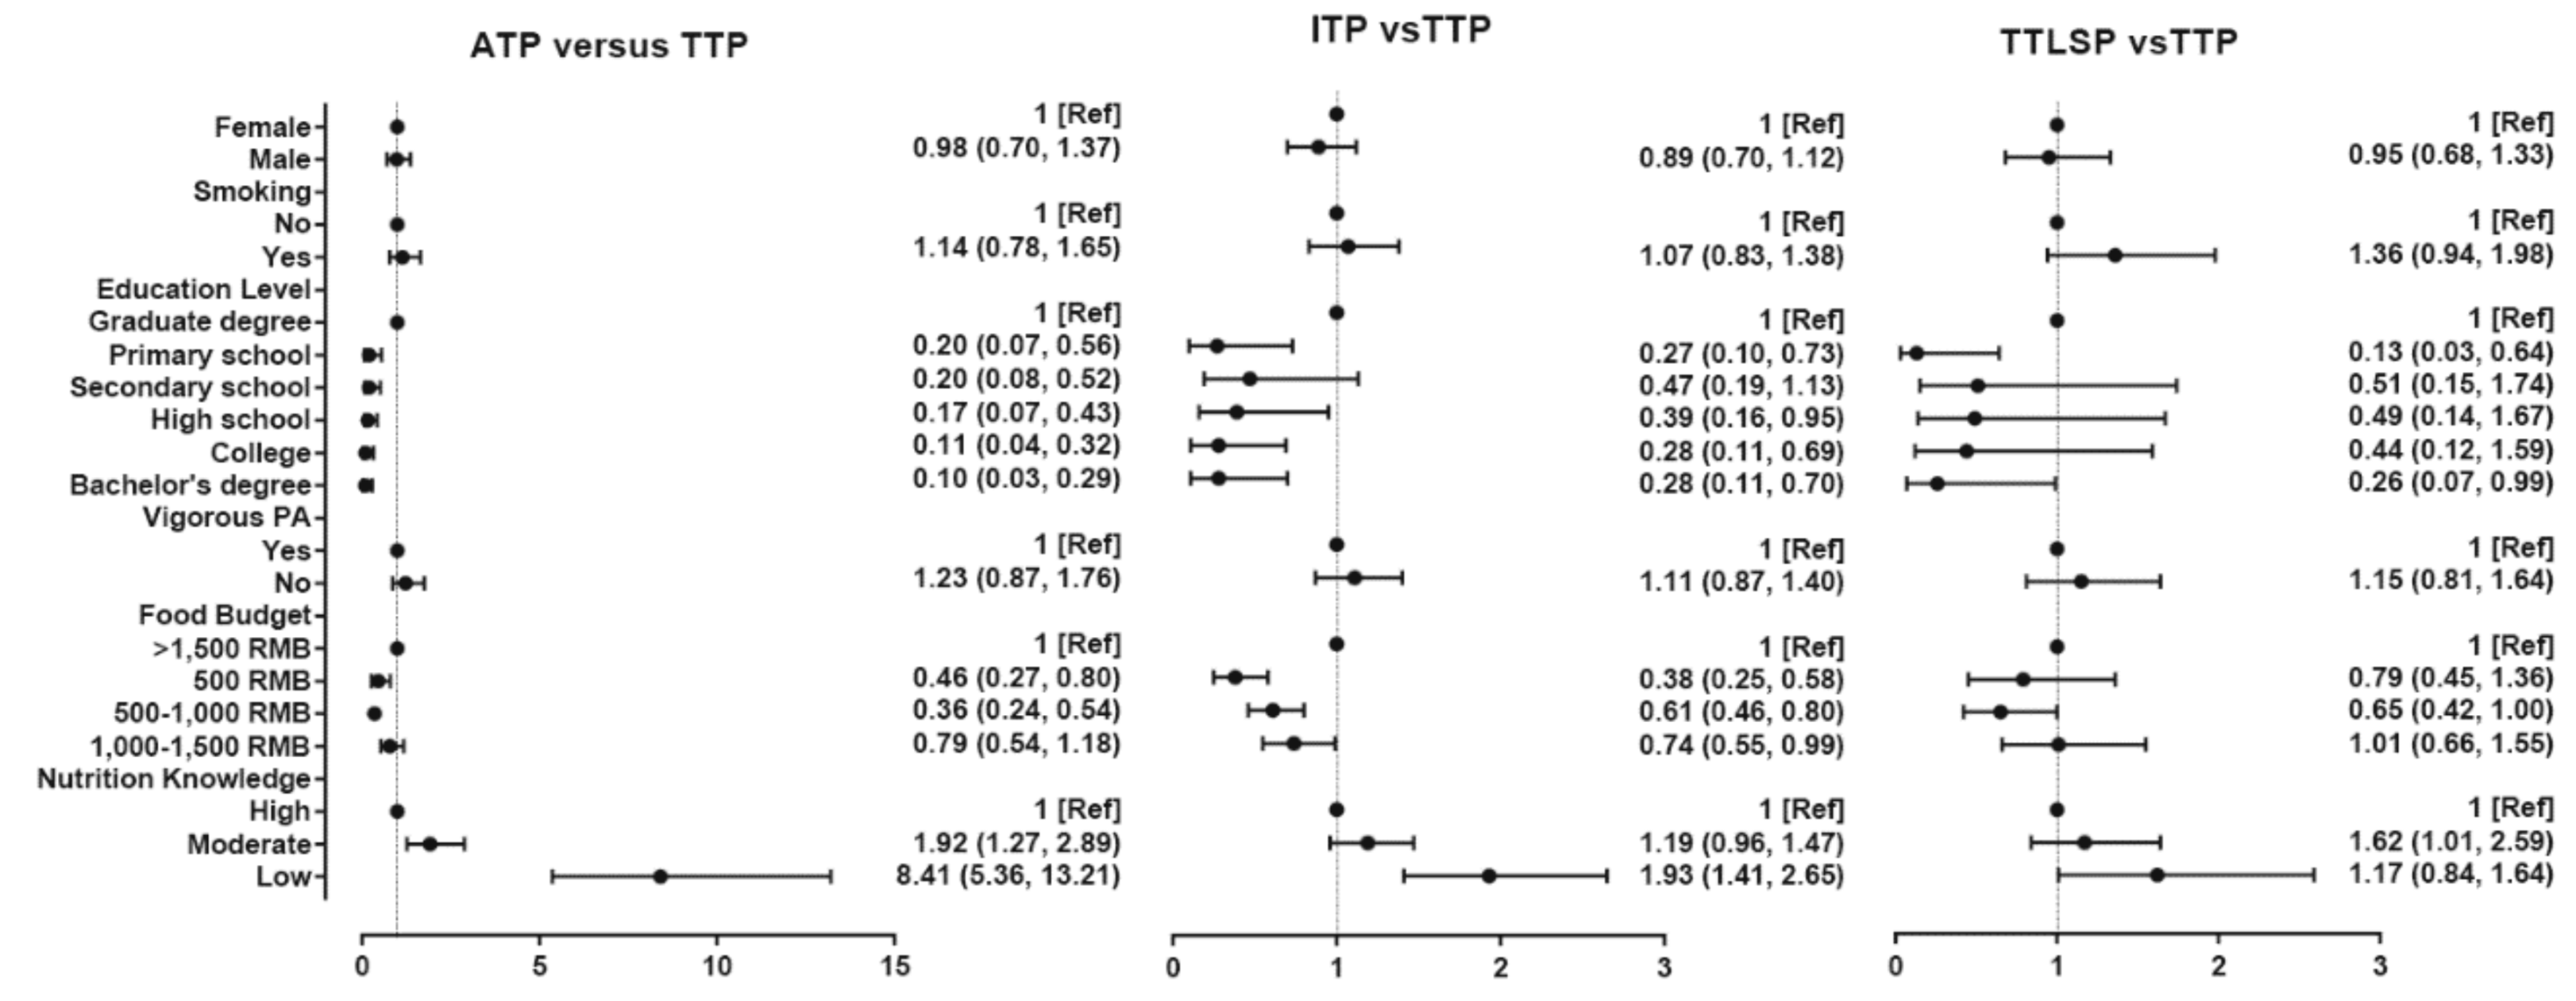
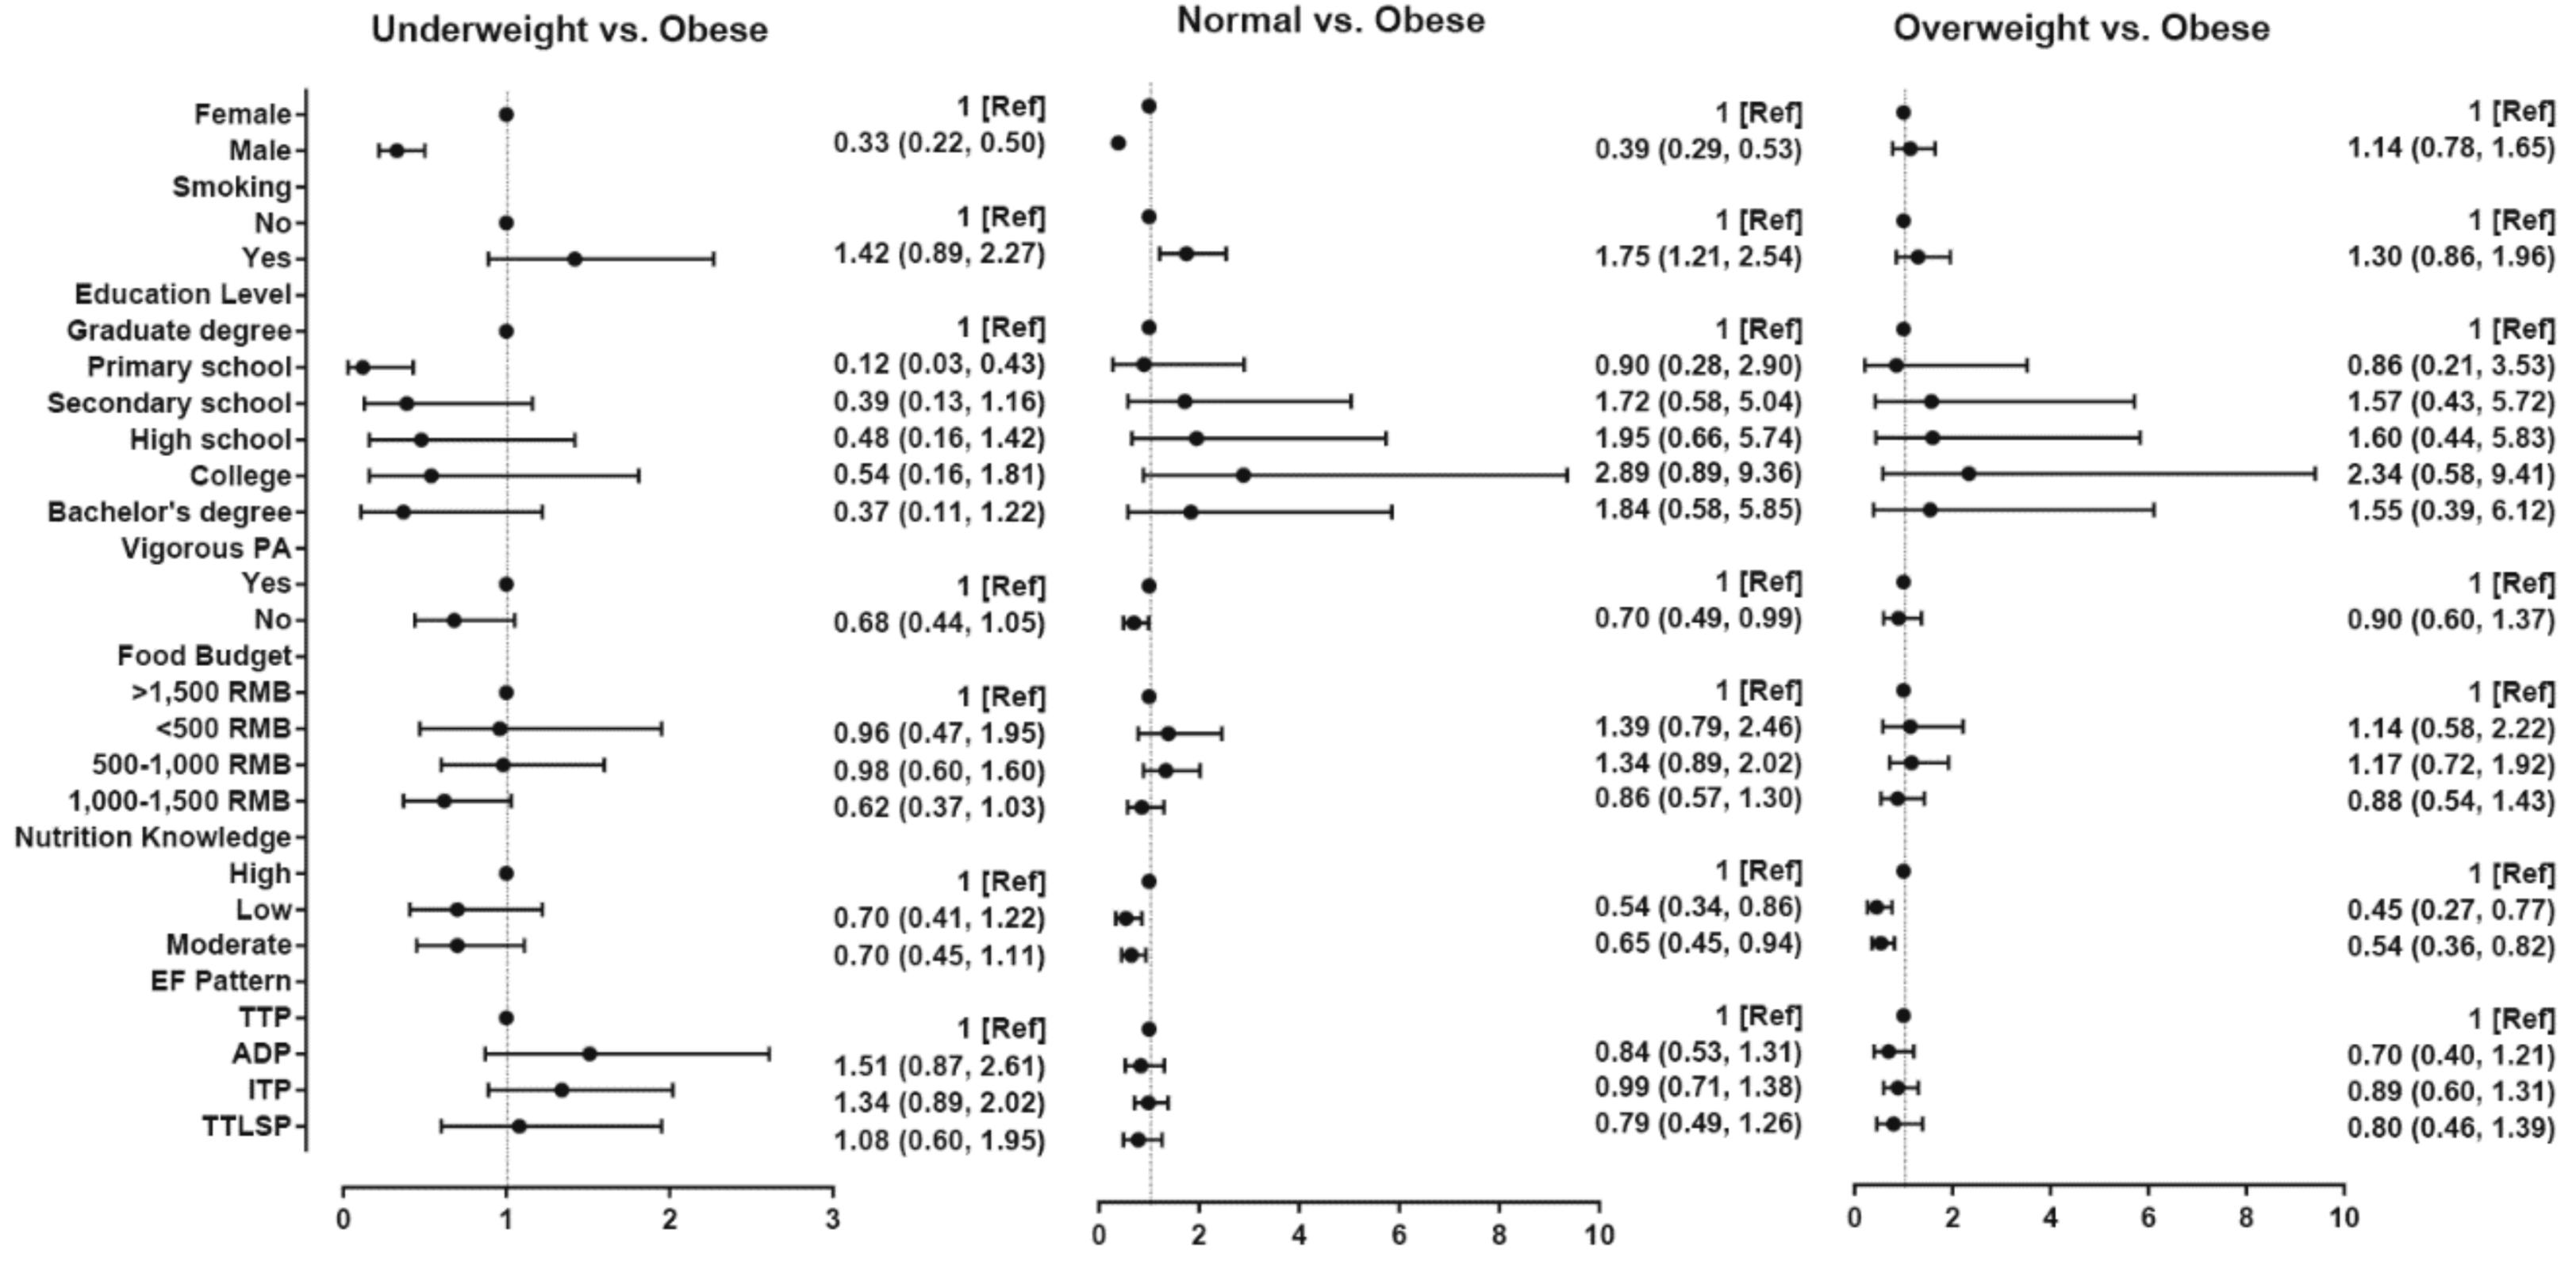
3.3. Associations among EF Pattern, Nutrition Knowledge, Sociodemographic, and Lifestyle Factors and BMI Group

The association between EF pattern and demographic factors is shown in Figure 1 and Table S1. Odds ratios (ORs) with 95% confidence intervals (CIs) for ADP from “Primary school” to “Bachelor’s degree” were respectively 0.20 (0.07, 0.56), 0.20 (0.08, 0.52), 0.17 (0.07, 0.43), 0.11 (0.04, 0.32), and 0.10 (0.03, 0.29). The same tendency also presented when ITP and TTLSP were compared with TTP: ORs with 95% CIs for ITP were respectively 0.27 (0.10, 0.73), 0.47 (0.19, 1.13), 0.39 (0.16, 0.95), 0.28 (0.11, 0.69), 0.28 (0.11, 0.70), and for TTLSP, 0.13 (0.03, 0.64), 0.51 (0.15, 1.74), 0.49 (0.14, 1.67), 0.44 (0.12, 1.59), 0.26 (0.07, 0.99). People with lower food budgets were more likely to have TTP rather than ITP: ORs with 95% CIs for ADP from “Less than 500 RMB” to “1000–1500 RMB” were respectively 0.46 (0.27, 0.80), 0.36 (0.24, 0.54), and 0.79 (0.54, 1.18), while for ITP they were respectively 0.38 (0.25, 0.58), 0.61 (0.46, 0.80), and 0.74 (0.55, 0.99), and for TTLSP, 0.79 (0.45, 1.36), 0.65 (0.42, 1.00), 1.01 (0.66, 1.55). A significant negative association between nutrition knowledge and ITP was also observed: ORs with 95% CIs for ADP from “Low nutrition knowledge” to “Moderate nutrition knowledge” were 8.41 (5.36, 13.21) and 1.92 (1.27, 2.89); for ITP were 1.93 (1.41, 2.65) and 1.19 (0.96, 1.47); and for TTLSP were 1.62 (1.01, 2.59) and 1.17 (0.84, 1.64). Our analysis did not find significant association between smoking, sex, or physical activity and EF pattern.
Model 2 utilized BMI group as the dependent variable (Figure 2 and Table S2); the results showed that people who smoked were more likely to have a normal BMI compared with those who did not (OR with 95% CI: 1.75 (1.21, 2.54)). Less vigorous physical activity was significantly associated with lower odds of being normal weight (OR with 95% CI: 0.70 (0.49, 0.99)). Men were less likely than women to be underweight or normal weight (OR with 95% CI for underweight: 0.33 (0.22, 0.50); for normal weight: 0.39 (0.29, 0.53)). People with lower nutrition knowledge were less likely to be normal weight or overweight. ORs with 95% CIs for normal and underweight among people with low nutrition knowledge were respectively 0.54 (0.34, 0.86) and 0.45 (0.27, 0.77), and among people with moderate nutrition knowledge, 0.65 (0.45, 0.94) and 0.54 (0.36, 0.82). No significant association between food budget and BMI group was observed in our results.

4. Discussion

In this study, we found that lower education level, a larger food budget, and lower nutrition knowledge were associated with higher likelihood of ITP. In addition, women and participants who reported smoking, more vigorous physical activity, higher education level, and higher nutrition knowledge were less likely to be obese. It is noteworthy that the significant association between EF patterns and BMI group disappeared in the regression model after adjustment for age, sex, education, smoking, food budget, nutrition knowledge, and physical activity, suggesting that it was these factors that impacted obesity and that EF pattern might just be a manifestation of these characteristics.
Previous studies have reported significant associations between EF and many sociodemographic and lifestyle factors, such as age, sex, education, smoking status, physical activity, and food budget [10,26,33,34,35,36], though few investigations have relied on models to predict the strength and direction of these associations. Consistent with the present findings, sociodemographic and lifestyle factors (e.g., physical activity) have previously been shown to contribute to the development of obesity [1]. For example, the prevalence of obesity shows significant variation by age and sex groups in many national surveys [28,29,37], and higher education level is often associated with a lower risk of obesity [24,38]. Inverse associations of nutrition knowledge and smoking with BMI, waist circumference, and waist circumference/height ratio have also been previously reported [27,38]. Higher nutrition knowledge might decrease the risk of obesity [25,26], consistent with our present results.
Contrary to some previously reported research conducted in Western contexts, however, the relationship between EF pattern and obesity in the present study was no longer statistically significant after adjustment for confounding factors. However, this finding is consistent with the results of a cohort study conducted by Kant et al. [16], whereas Duval et al. similarly found that the association between EF and BMI to be non-significant after adjustment for energy expenditure and physical fitness [17]. A randomized controlled study performed by Huseinovic et al. suggested that EF during intervention had a crude association with weight gain, but this association turned to be non-significant after adjustment for physical activity level, EF at baseline, and dietary treatment [15]. Nevertheless, other researchers have also found an inverse association [9,10,11,13,14,33] or positive relationship [18,19] between EF and BMI; however, they either did not take confounding factors into consideration or included fewer confounding factors than the present study.
The difference in EF definition might also contribute to inconsistent results. There are four definitions of EF applied in current studies: (1) contribution to total energy intake [20], (2) time of day [21], (3) self-reported eating occasions [22], and (4) neutral definition [23]. Among studies which focus on the association between EF and obesity, five studies calculated EF with time of day [10,14,16,17,19], three with contribution to energy intake [15,18,33], two with self-reported eating occasions [9,11], and one with neutral definition [13]. The methodological difference in the definition is likely to impact reported EF, but our results are consistent with other studies that using different EF definitions [15,16,17].
The fundamental modifiable cause of obesity is energy imbalance. Some studies have previously reported an inverse relationship between EF and energy intake [39,40], but overall, the research was equivocal [41]. In a randomized cross-over study, for instance, reduced EF did not have a significant impact on energy expenditure [10], and studies examining 24-h energy expenditure failed to detect differences between different EF groups [42]. Thus, EF does not appear to influence obesity in humans based on existing evidence; it might just be a symptom or by-product of associations among nutrition knowledge, sociodemographic, and lifestyle factors and obesity.
This study has several limitations, however. First, the cross-sectional design does not allow for the inference of causal relationships. Second, most of the data collected for this study were self-reported and, thus, vulnerable to recall bias, and the measures were potentially influenced by social norms. Third, ours is a convenience sample, which may limit generalizability. In addition, budgetary constraints limited data collection to one 24-hour dietary recall for estimating EF. Furthermore, a large time interval criterion may not be able to capture smaller eating occasions such as beverage-only occasions. A prospective cohort study in a Chinese population using objective, validated measures would improve the quality of data and impart a deeper understanding of the associations among EF, nutrition knowledge, sociodemographic, and lifestyle factors and obesity.

5. Conclusions

Our findings suggested that EF is associated with sociodemographic and lifestyle factors but not with obesity. The difference in BMI group among EF patterns might be just an artifact of the relationships between sociodemographic and lifestyle factors and obesity.

Supplementary Materials

The following are available online at https://www.mdpi.com/1660-4601/15/11/2561/s1, Table S1. Associations between nutrition knowledge, sociodemographic and lifestyle factors and EF, Table S2. Associations between nutrition knowledge, sociodemographic and lifestyle factors, EF, and BMI group.

Author Contributions

Conceptualization, X.Z., Y.W., R.L. and G.C.; software, J.S.B.; formal analysis, J.S.B., T.M.O., G.C. and J.B.M.; investigation, X.Z., Y.W, and R.L.; Writing-original draft preparation, X.Z. and Y.W.; Writing-review and editing, R.L., R.Z., J.B.M. and T.M.O.

Funding

This research was funded by National Natural Science Foundation of China, grant number 81402668 and Planning Project of Innovation and Entrepreneurship Training of National Undergraduate of Wuhan University, grant number 201610486114.

Acknowledgments

We thank the teachers, staff, and students from Jiangxia No.1 High School and Jiangxia No. 4 Middle School in Wuhan, China, for their assistance. We acknowledge the editorial assistance of Karen Klein, MA, through the Wake Forest Clinical and Translational Science Institute (UL1TR001420; PI: McClain). We would also like to thank Editage (www.editage.com) for English language editing.

Conflicts of Interest

The authors declare no conflict of interest.

Abbreviations

EF: eating frequency; BMI: body mass index; OR: odds ratio; ADP: all-day pattern; TTPLSP: traditional time plus late snack pattern; ITP: irregular time pattern; TTP: traditional time pattern.

References

  1. World Health Organization. Obesity and Overweight. Available online: www.who.int/news-room/fact-sheets/detail/obesity-and-overweight (accessed on 30 June 2018).
  2. Ng, M.; Fleming, T.; Robinson, M.; Thomson, B.; Graetz, N.; Margono, C.; Mullany, E.C.; Biryukov, S.; Abbafati, C.; Abera, S.F.; et al. Global, regional, and national prevalence of overweight and obesity in children and adults during 1980–2013: A systematic analysis for the Global Burden of Disease Study 2013. Lancet 2014, 384, 766–781. [Google Scholar] [CrossRef]
  3. Zhang, C.; Rexrode, K.M.; van Dam, R.M.; Li, T.Y.; Hu, F.B. Abdominal obesity and the risk of all-cause, cardiovascular, and cancer mortality sixteen years of follow-up in US Women. Circulation 2008, 117, 1658–1667. [Google Scholar] [CrossRef] [PubMed]
  4. Felson, D.T.; Anderson, J.J.; Naimark, A.; Walker, A.M.; Meenan, R.F. Obesity and knee osteoarthritis: The Framingham study. Ann. Int. Med. 1988, 109, 18–24. [Google Scholar] [CrossRef] [PubMed]
  5. Calle, E.E.; Rodriguez, C.; Walker-Thurmond, K.; Thun, M.J. Overweight, obesity, and mortality from cancer in a prospectively studied cohort of US adults. N. Engl. J. Med. 2003, 348, 1625–1638. [Google Scholar] [CrossRef] [PubMed]
  6. Fábry, P.; Hejl, Z.; Fodor, J.; Braun, T. The frequency of meals: Its relation to overweight, hypercholesterolaemia, and decreased glucose-tolerance. Lancet 1964, 2, 614–615. [Google Scholar] [CrossRef]
  7. Yannakoulia, M.; Melistas, L.; Solomou, E.; Yiannakouris, N. Association of eating frequency with body fatness in pre- and postmenopausal women. Obesity 2012, 15, 100–106. [Google Scholar] [CrossRef] [PubMed]
  8. Murakami, K.; Livingstone, M.B. Eating frequency in relation to body mass index and waist circumference in British adults. Int. J. Obes. (Lond.) 2014, 38, 1200–1206. [Google Scholar] [CrossRef] [PubMed]
  9. Jaaskelainen, A.; Schwab, U.; Kolehmainen, M.; Pirkola, J.; Jarvelin, M.R.; Laitinen, J. Associations of meal frequency and breakfast with obesity and metabolic syndrome traits in adolescents of Northern Finland Birth Cohort 1986. Nutr. Metab. Cardiovasc. Dis. 2013, 23, 1002–1009. [Google Scholar] [CrossRef] [PubMed]
  10. Arciero, P.J.; Ormsbee, M.J.; Gentile, C.L.; Nindl, B.C.; Brestoff, J.R.; Ruby, M. Increased protein intake and meal frequency reduces abdominal fat during energy balance and energy deficit. Obesity 2013, 21, 1357–1366. [Google Scholar] [CrossRef] [PubMed] [Green Version]
  11. Marín-Guerrero, A.C.; Gutiérrez-Fisac, J.L.; Guallar-Castillón, P.; Banegas, J.R.; Rodríguez-Artalejo, F. Eating behaviors and obesity in the adult population of Spain. Br. J. Nutr. 2008, 100, 1142–1148. [Google Scholar] [CrossRef] [PubMed]
  12. Ma, Y.; Bertone, E.R.; Stanek, E.J.; Reed, G.W.; Hebert, J.R.; Cohen, N.L.; Merriam, P.A.; Ockene, I.S. Association between eating patterns and obesity in a free-living US adult population. Am. J. Epidemiol. 2003, 158, 85–92. [Google Scholar] [CrossRef] [PubMed]
  13. Drummond, S.E.; Crombie, N.E.; Cursiter, M.C.; Kirk, T.R. Evidence that eating frequency is inversely related to body weight status in male, but not female, non-obese adults reporting valid dietary intakes. Int. J. Obes. Relat. Metab. Disord. 1998, 22, 105–112. [Google Scholar] [CrossRef] [PubMed] [Green Version]
  14. Bongard, V. Eating frequency and body fatness in middle-aged men. Int. J. Obes. Relat. Metab. Disord. 2002, 26, 1476–1483. [Google Scholar] [Green Version]
  15. Huseinovic, E.; Winkvist, A.; Bertz, F.; Bertéus, F.H.; Brekke, H.K. Eating frequency, energy intake and body weight during a successful weight loss trial in overweight and obese postpartum women. Eur. J. Clin. Nutr. 2014, 68, 71–76. [Google Scholar] [CrossRef] [PubMed]
  16. Kant, A.K.; Schatzkin, A.; Graubard, B.I.; Ballardbarbash, R. Frequency of eating occasions and weight change in the NHANES I Epidemiologic Follow-up Study. Int. J. Obes. Relat. Metab. Disord. 1995, 19, 468–474. [Google Scholar] [PubMed]
  17. Duval, K.; Strychar, I.; Cyr, M.J.; Prud’Homme, D.; Rabasa-Lhoret, R.; Doucet, E. Physical activity is a confounding factor of the relation between eating frequency and body composition. Am. J. Clin. Nutr. 2008, 88, 1200–1205. [Google Scholar] [PubMed]
  18. Murakami, K.; Livingstone, M.B. Eating frequency is positively associated with overweight and central obesity in US adults. J. Nutr. 2015, 145, 2715–2724. [Google Scholar] [CrossRef] [PubMed]
  19. Stote, K.S.; Baer, D.J.; Spears, K.; Paul, D.R.; Harris, G.K.; Rumpler, W.V.; Strycula, P.; Najjar, S.S.; Ferrucci, L.; Ingram, D.K. A controlled trial of reduced meal frequency without caloric restriction in healthy, normal-weight, middle-aged adults. Am. J. Clin. Nutr. 2007, 85, 981–988. [Google Scholar] [CrossRef] [PubMed]
  20. Ritchie, L.D. Less frequent eating predicts greater BMI and waist circumference in female adolescents. Am. J. Clin. Nutr. 2012, 95, 290–296. [Google Scholar] [CrossRef] [PubMed] [Green Version]
  21. Duffey, K.J.; Pereira, R.A.; Popkin, B.M. Prevalence and energy intake from snacking in Brazil: Analysis of the first nationwide individual survey. Eur. J. Clin. Nutr. 2013, 67, 868–874. [Google Scholar] [CrossRef] [PubMed]
  22. Kant, A.K.; Graubard, B.I. 40-year trends in meal and snack eating behaviors of American adults. J. Acad. Nutr. Diet. 2015, 115, 50–63. [Google Scholar] [CrossRef] [PubMed]
  23. Makela, J.; Kjaernes, U.; Pipping, E.M.; L’Orange, F.E.; Gronow, J.; Holm, L. Nordic meals: Methodological notes on a comparative survey. Appetite 1999, 32, 73–79. [Google Scholar] [CrossRef] [PubMed]
  24. Cohen, A.K.; Rehkopf, D.H.; Deardorff, J.; Abrams, B. Education and obesity at age 40 among American adults. Soc. Sci. Med. 2013, 78, 34–41. [Google Scholar] [CrossRef] [PubMed] [Green Version]
  25. Hankey, C.R.; Eley, S.; Leslie, W.S.; Hunter, C.M.; Lean, M.E. Eating habits, beliefs, attitudes and knowledge among health professionals regarding the links between obesity, nutrition and health. Public Health Nutr. 2004, 7, 337–343. [Google Scholar] [CrossRef] [PubMed]
  26. Bonaccio, M.; Di, C.A.; Costanzo, S.; De, L.F.; Olivieri, M.; Donati, M.B.; De, G.G.; Iacoviello, L.; Bonanni, A. Nutrition knowledge is associated with higher adherence to Mediterranean diet and lower prevalence of obesity. Results from the Moli-sani study. Appetite 2013, 68, 139–146. [Google Scholar] [CrossRef] [PubMed]
  27. Lv, J.; Chen, W.; Sun, D.; Li, S.; Millwood, I.Y.; Smith, M.; Guo, Y.; Bian, Z.; Yu, C.; Zhou, H. Gender-specific association between tobacco smoking and central obesity among 0.5 million Chinese people: The China kadoorie biobank study. PLoS ONE 2015, 10, e124586. [Google Scholar] [CrossRef] [PubMed]
  28. Flegal, K.M.; Carroll, M.D.; Kit, B.K.; Ogden, C.L. Prevalence of obesity and trends in the distribution of body mass index among US adults, 1999–2010. JAMA 2012, 307, 491–497. [Google Scholar] [CrossRef] [PubMed]
  29. Main, M.L.; Rao, S.C.; O’Keefe, J.H. Trends in obesity and extreme obesity among US adults. JAMA 2010, 303, 1695–1696. [Google Scholar] [CrossRef] [PubMed]
  30. National Bureau of Statistics of China. Statistical Communiqué of the People’s Republic of China on the 2013 National Economic and Social Development, 1st ed.; China Statistics Press: Beijing, China, 2014; pp. 12–16.
  31. Shi, Q.J. Analysis of Knowledge-Attitude-Practice and Health Intervention About Nutritional in Parents of Preschool Children in Yingkou. Master’s Thesis, Dalian Medical University, Dalian, China, 29 November 2017. [Google Scholar]
  32. Department of Disease Control, Ministry of Health of the People’s Republic of China. Guidelines for Prevention and Control of Overweight and Obesity in Adults in China; People’s Medical Publishing House: Beijing, China, 2006.
  33. Zhu, Y.; Hollis, J.H. Associations between eating frequency and energy intake, energy density, diet quality and body weight status in adults from the USA. Br. J. Nutr. 2016, 115, 2138–2144. [Google Scholar] [CrossRef] [PubMed]
  34. Beyene, M.; Worku, A.G.; Wassie, M.M. Dietary diversity, meal frequency and associated factors among infant and young children in Northwest Ethiopia: A cross-sectional study. BMC Public Health 2015, 15, 1007. [Google Scholar] [CrossRef] [PubMed]
  35. Nuvoli, G. Family meal frequency, weight status and healthy management in children, young adults and seniors. A study in Sardinia, Italy. Appetite 2015, 89, 160–166. [Google Scholar] [CrossRef] [PubMed]
  36. Hassanzadeh, S.; Saneei, P.; Keshteli, A.H.; Daghaghzadeh, H.; Esmaillzadeh, A.; Adibi, P. Meal frequency in relation to prevalence of functional dyspepsia among Iranian adults. Nutrition 2015, 32, 242–248. [Google Scholar] [CrossRef] [PubMed]
  37. Lee, H.; Saunders, M. Trends in Overweight and Obesity Among Korean Children and Adolescents, 1998–2010. In Proceedings of the 141st APHA Annual Meeting and Exposition 2013, Boston, MA, USA, 2–6 November 2013. [Google Scholar]
  38. Flegal, K.M.; Kruszon-Moran, D.; Carroll, M.D.; Fryar, C.D.; Ogden, C.L. Trends in obesity among adults in the United States, 2005 to 2014. JAMA 2016, 315, 2284–2291. [Google Scholar] [CrossRef] [PubMed]
  39. Hartlinegrafton, H.L.; Rose, D.; Johnson, C.C.; Rice, J.C.; Webber, L.S. The influence of weekday eating patterns on energy intake and BMI among female elementary school personnel. Obesity 2010, 18, 736–742. [Google Scholar] [CrossRef] [PubMed]
  40. Mills, J.P.; Perry, C.D.; Reicks, M. Eating frequency is associated with energy intake but not obesity in midlife women. Obesity 2011, 19, 552–559. [Google Scholar] [CrossRef] [PubMed]
  41. Hutchison, A.T.; Heilbronn, L.K. Metabolic impacts of altering meal frequency and timing—Does when we eat matter? Biochimie 2016, 124, 187–197. [Google Scholar] [CrossRef] [PubMed]
  42. Ohkawara, K.; Cornier, M.A.; Kohrt, W.M.; Melanson, E.L. Effects of increased meal frequency on fat oxidation and perceived hunger. Obesity 2013, 21, 336–343. [Google Scholar] [CrossRef] [PubMed] [Green Version]
Figure 1. Associations between nutrition knowledge, sociodemographic, and lifestyle factors and eating frequency (EF).
Ijerph 15 02561 g001
Figure 2. Associations between nutrition knowledge, sociodemographic, and lifestyle factors, EF, and body mass index (BMI) group.
Ijerph 15 02561 g002
Table 1. Characteristics of the study population (N = 2290).
CharacteristicsMale (N = 1162)Female (N = 1128)Total (N = 2290)
N%N%N%
Age group
29–34272%404%673%
34–3915814%28425%44219%
39–4453046%54548%107547%
44–4935631%21319%56925%
49–54706%323%1024%
54–59131%61%191%
59–6450%30%80%
64–6920%40%60%
69–7410%10%20%
Highest level of education
Primary school494%686%1175%
Secondary school42036%40936%82936%
High school44238%43038%87238%
College11710%10810%22510%
Bachelor’s degree11110%948%2059%
Graduate degree232%192%422%
Smoking
Yes54847%333%58125%
No61453%109597%170975%
Food budget monthly
Less than 500 RMB14112%938%23410%
500–1000 RMB47441%50445%97843%
1000–1500 RMB35030%33830%68830%
More than 1500 RMB19717%19317%39017%
Vigorous PA (4+ days)
No87876%91681%179478%
Yes28424%21219%49622%
Nutrition knowledge
Low22019%16815%38817%
Moderate65957%62455%128356%
High28324%33630%61927%
BMI Group
Normal61353%72464%133758%
Obese14713%878%23410%
Overweight27824%13412%41218%
Underweight12411%18316%30713%
EF pattern
ADP12.31%143 10.82%122 26512%
TTLSP10.93%127 9.66%109 23610%
ITP28.66%333 31.38%354 68730%
TTP48.11%559 48.13%543 110248%
Table 2. Differences in body mass index (BMI) distribution among eating frequency (EF) patterns.
UnderweightNormalOverweightObeseAll
N%N%N%N%N
EF Pattern
ADP5320.00%13952.45%3914.72%3412.83%265
TTLSP3313.98%13255.93%4418.64%2711.44%236
ITP10415.14%40058.22%11516.74%689.90%687
TTP11710.62%66660.44%21419.42%1059.53%1102
All30713.41%133758.38%41217.99%23410.22%2290
χ2 = 25.40, p = 0.003.
Table 3. Differences in nutrition knowledge distribution among EF patterns.
LowModerateHighAll
N%N%N%N
EF Pattern
ADP11041.51%12145.66%3412.83%265
ITP12217.76%38956.62%17625.62%687
TTLSP3615.25%13758.05%6326.69%236
TTP12010.89%63657.71%34631.40%1102
All38816.94%128356.03%61927.03%2290
χ2 = 152.81, p < 0.001.
Table 4. Differences in food budget distribution among EF patterns.
Less than 500 RMB500–1000 RMB1000–1500 RMBMore than 1500 RMBAll
N%N%N%N%N
EF Pattern
ADP2710.19%7528.30%9636.23%6725.28%265
ITP486.99%29542.94%20730.13%13719.94%236
TTLSP2711.44%8937.71%8134.32%3916.53%687
TTP13211.98%51947.10%30427.59%14713.34%1102
All2710.19%7528.30%9636.23%6725.28%2290
χ2 = 59.83, p < 0.001.

