Profiles of Environmental Mold: Indoor and Outdoor Air Sampling in a Hematology Hospital in Seoul, South Korea

 , ,
, ,
Abstract
1. Introduction
2. Methods
2.1. Hospital Setting, Location and Study Design
2.2. Sampling Methods
2.3. Colony Counting Methods
2.4. Fungal Identification
2.5. Statistical Analysis
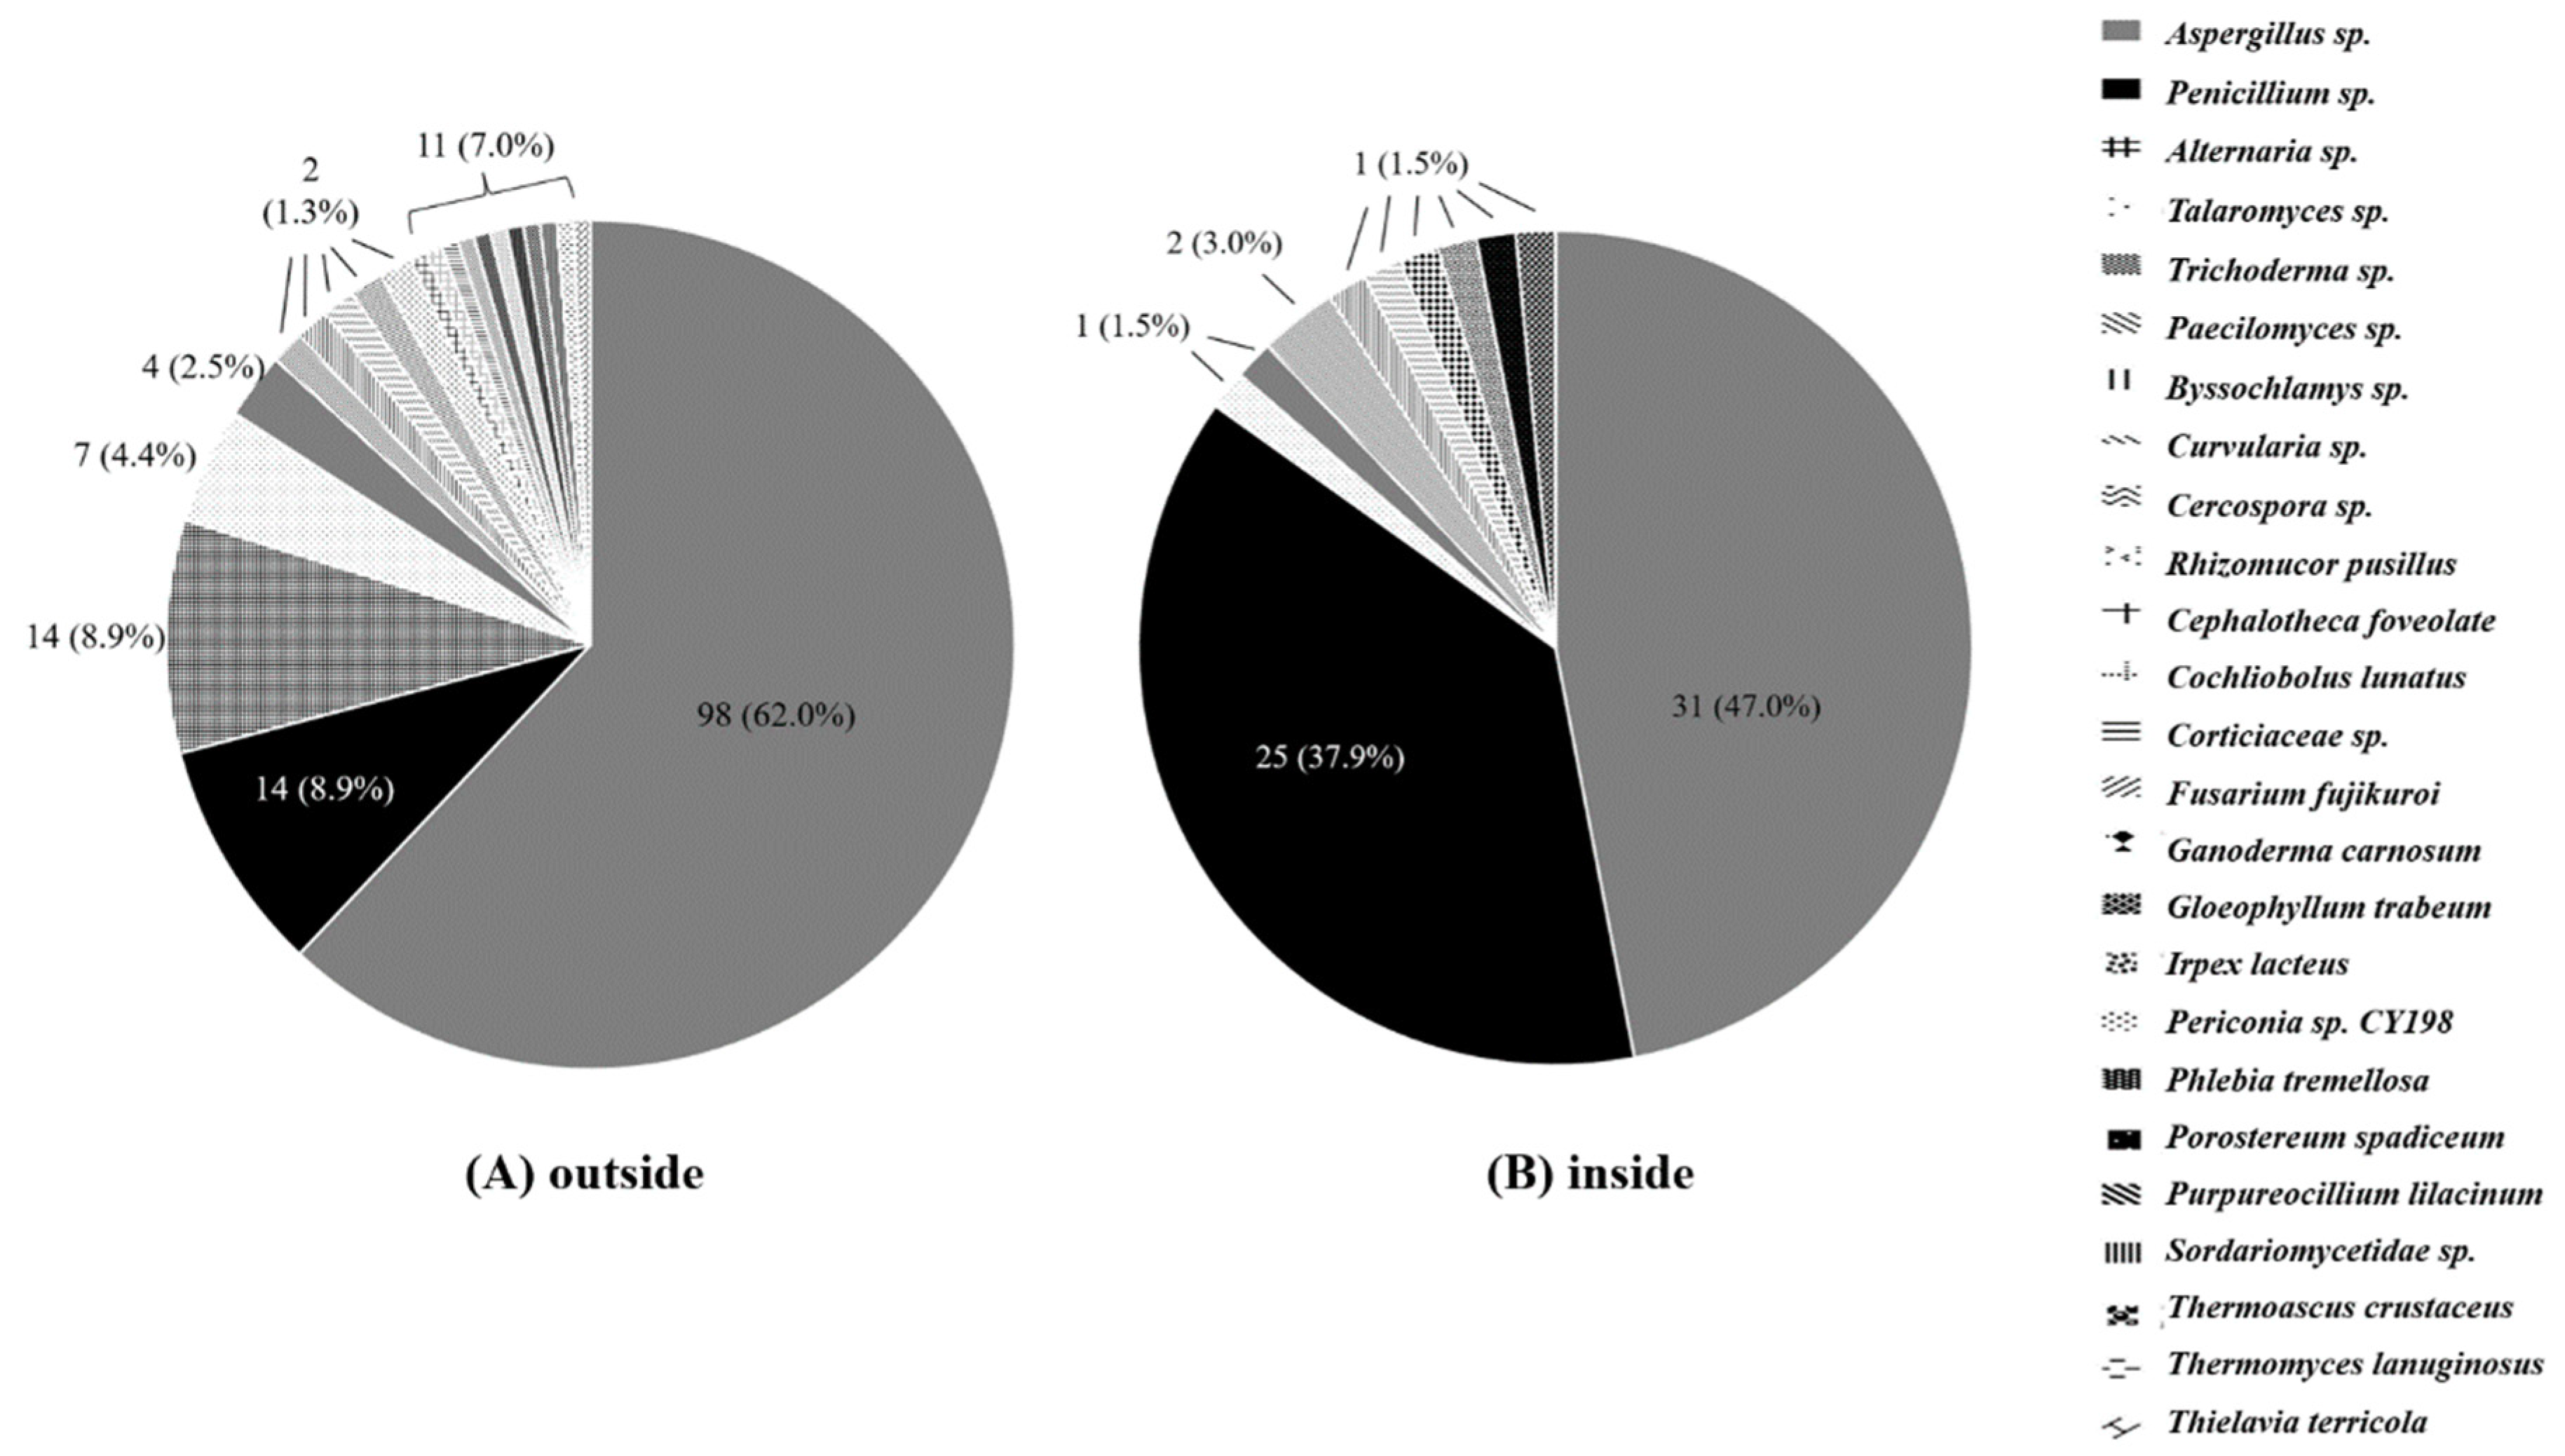
3. Results
4. Discussion
Author Contributions
Funding
Conflicts of Interest
References
- Shelton, B.G.; Kirkland, K.H.; Flanders, W.D.; Morris, G.K. Profiles of airborne fungi in buildings and outdoor environments in the United States. Appl. Environ. Microbiol. 2002, 68, 1743–1753. [Google Scholar] [CrossRef] [PubMed]
- Gangneux, J.P.; Bougnoux, M.E.; Hennequin, C.; Godet, C.; Chandenier, J.; Denning, D.W.; Dupont, B. An estimation of burden of serious fungal infections in France. J. Mycol. Med. 2016, 26, 385–390. [Google Scholar] [CrossRef] [PubMed]
- Ullmann, A.J.; Aguado, J.M.; Arikan-Akdagli, S.; Denning, D.W.; Groll, A.H.; Lagrou, K.; Lass-Flörl, C.; Lewis, R.E.; Munoz, P.; Verweij, P.E.; et al. Diagnosis and management of Aspergillus diseases: Executive summary of the 2017 ESCMID-ECMM-ERS guideline. Clin. Microbiol. Infect. 2018, 24 (Suppl. 1), e1–e38. [Google Scholar] [CrossRef] [PubMed]
- Roemer, T.; Krysan, D.J. Antifungal Drug Development: Challenges, Unmet Clinical Needs, and New Approaches. Cold Spring Harb. Perspect. Med. 2014, 4, a019703. [Google Scholar] [CrossRef] [PubMed]
- Bellanger, A.P.; Reboux, G.; Demonmerot, F.; Gbaguidi-Haore, H.; Millon, L. Fungal aerocontamination exposure risk for patients in 3 successive locations of a pediatric hematology unit department: Influence of air equipment and building structure on air quality. Am. J. Infect. Control 2017, 45, e109–e113. [Google Scholar] [CrossRef] [PubMed]
- Heutte, N.; Andre, V.; Dubos Arvis, C.; Bouchart, V.; Lemarie, F.; Legendre, P.; Votier, E.; Louis, M.Y.; Madelaine, S.; Seguin, V.; et al. Assessment of multi-contaminant exposure in a cancer treatment center: A 2-year monitoring of molds, mycotoxins, endotoxins, and glucans in bioaerosols. Environ. Monit. Assess. 2017, 189, 31. [Google Scholar] [CrossRef] [PubMed]
- Araujo, R.; Carneiro, A.; Costa-Oliveira, S.; Pina-Vaz, C.; Rodrigues, A.G.; Guimaraes, J.E. Fungal infections after haematology unit renovation: Evidence of clinical, environmental and economical impact. Eur. J. Haematol. 2008, 80, 436–443. [Google Scholar] [CrossRef] [PubMed]
- Falvey, D.G.; Streifel, A.J. Ten-year air sample analysis of Aspergillus prevalence in a university hospital. J. Hosp. Infect. 2007, 67, 35–41. [Google Scholar] [CrossRef] [PubMed]
- Martinez-Herrera, E.O.; Frias De-Leon, M.G.; Duarte-Escalante, E.; Calderon-Ezquerro Mdel, C.; Jimenez-Martinez Mdel, C.; Acosta-Altamirano, G.; Rivera-Becerril, F.; Toriello, C.; Reyes Montes Mdel, R. Fungal diversity and Aspergillus species in hospital environments. Ann. Agric. Environ. Med. 2016, 23, 264–269. [Google Scholar] [CrossRef] [PubMed]
- Park, D.U.; Yeom, J.K.; Lee, W.J.; Lee, K.M. Assessment of the levels of airborne bacteria, Gram-negative bacteria, and fungi in hospital lobbies. Int. J. Environ. Res. Public Health 2013, 10, 541–555. [Google Scholar] [CrossRef] [PubMed]
- Yahara, K.; Miura, M.; Masunaga, K.; Matsumoto, K.; Miyao, T.; Tanamachi, C.; Hashimoto, K.; Sagawa, K.; Watanabe, H. Comparison of two control measures of weatherstripping in reducing blowing dust during hospital renovations. J. Infect. Chemother. Off. J. Jpn. Soc. Chemother. 2010, 16, 431–435. [Google Scholar] [CrossRef] [PubMed]
- Sautour, M.; Sixt, N.; Dalle, F.; L’Ollivier, C.; Fourquenet, V.; Calinon, C.; Paul, K.; Valvin, S.; Maurel, A.; Aho, S.; et al. Profiles and seasonal distribution of airborne fungi in indoor and outdoor environments at a French hospital. Sci. Total Environ. 2009, 407, 3766–3771. [Google Scholar] [CrossRef] [PubMed]
- Sandle, T. A review of cleanroom microflora: Types, trends, and patterns. PDA J. Pharm. Sci. Technol. 2011, 65, 392–403. [Google Scholar] [CrossRef] [PubMed]
- International Organization for Standardization (ISO). Cleanrooms and Associated Controlled Environments—Part 1: Classification of Air Cleanliness by Particle Concentration; International Organization for Standardization: Geneva, Switzerland, 2015. [Google Scholar]
- Andersen, A.A. New sampler for the collection, sizing, and enumeration of viable airborne particles. J. Bacteriol. 1958, 76, 471–484. [Google Scholar] [PubMed]
- Toju, H.; Tanabe, A.S.; Yamamoto, S.; Sato, H. High-coverage ITS primers for the DNA-based identification of ascomycetes and basidiomycetes in environmental samples. PLoS ONE 2012, 7, e40863. [Google Scholar] [CrossRef] [PubMed]
- Department of Environment. Enforcement Decree of Indoor Air Quality Control in Public-Use Facilities, etc. Act; Department of Environment: Sejong-si, Korea, 2018. [Google Scholar]
- Woo, C.; An, C.; Xu, S.; Yi, S.M.; Yamamoto, N. Taxonomic diversity of fungi deposited from the atmosphere. ISME J. 2018, 12, 2051–2060. [Google Scholar] [CrossRef] [PubMed]
- Ortiz, G.; Yague, G.; Segovia, M.; Catalan, V. A study of air microbe levels in different areas of a hospital. Curr. Microbiol. 2009, 59, 53–58. [Google Scholar] [CrossRef] [PubMed]
- Troutt, C.; Levetin, E. Correlation of spring spore concentrations and meteorological conditions in Tulsa, Oklahoma. Int. J. Biometeorol. 2001, 45, 64–74. [Google Scholar] [CrossRef] [PubMed]


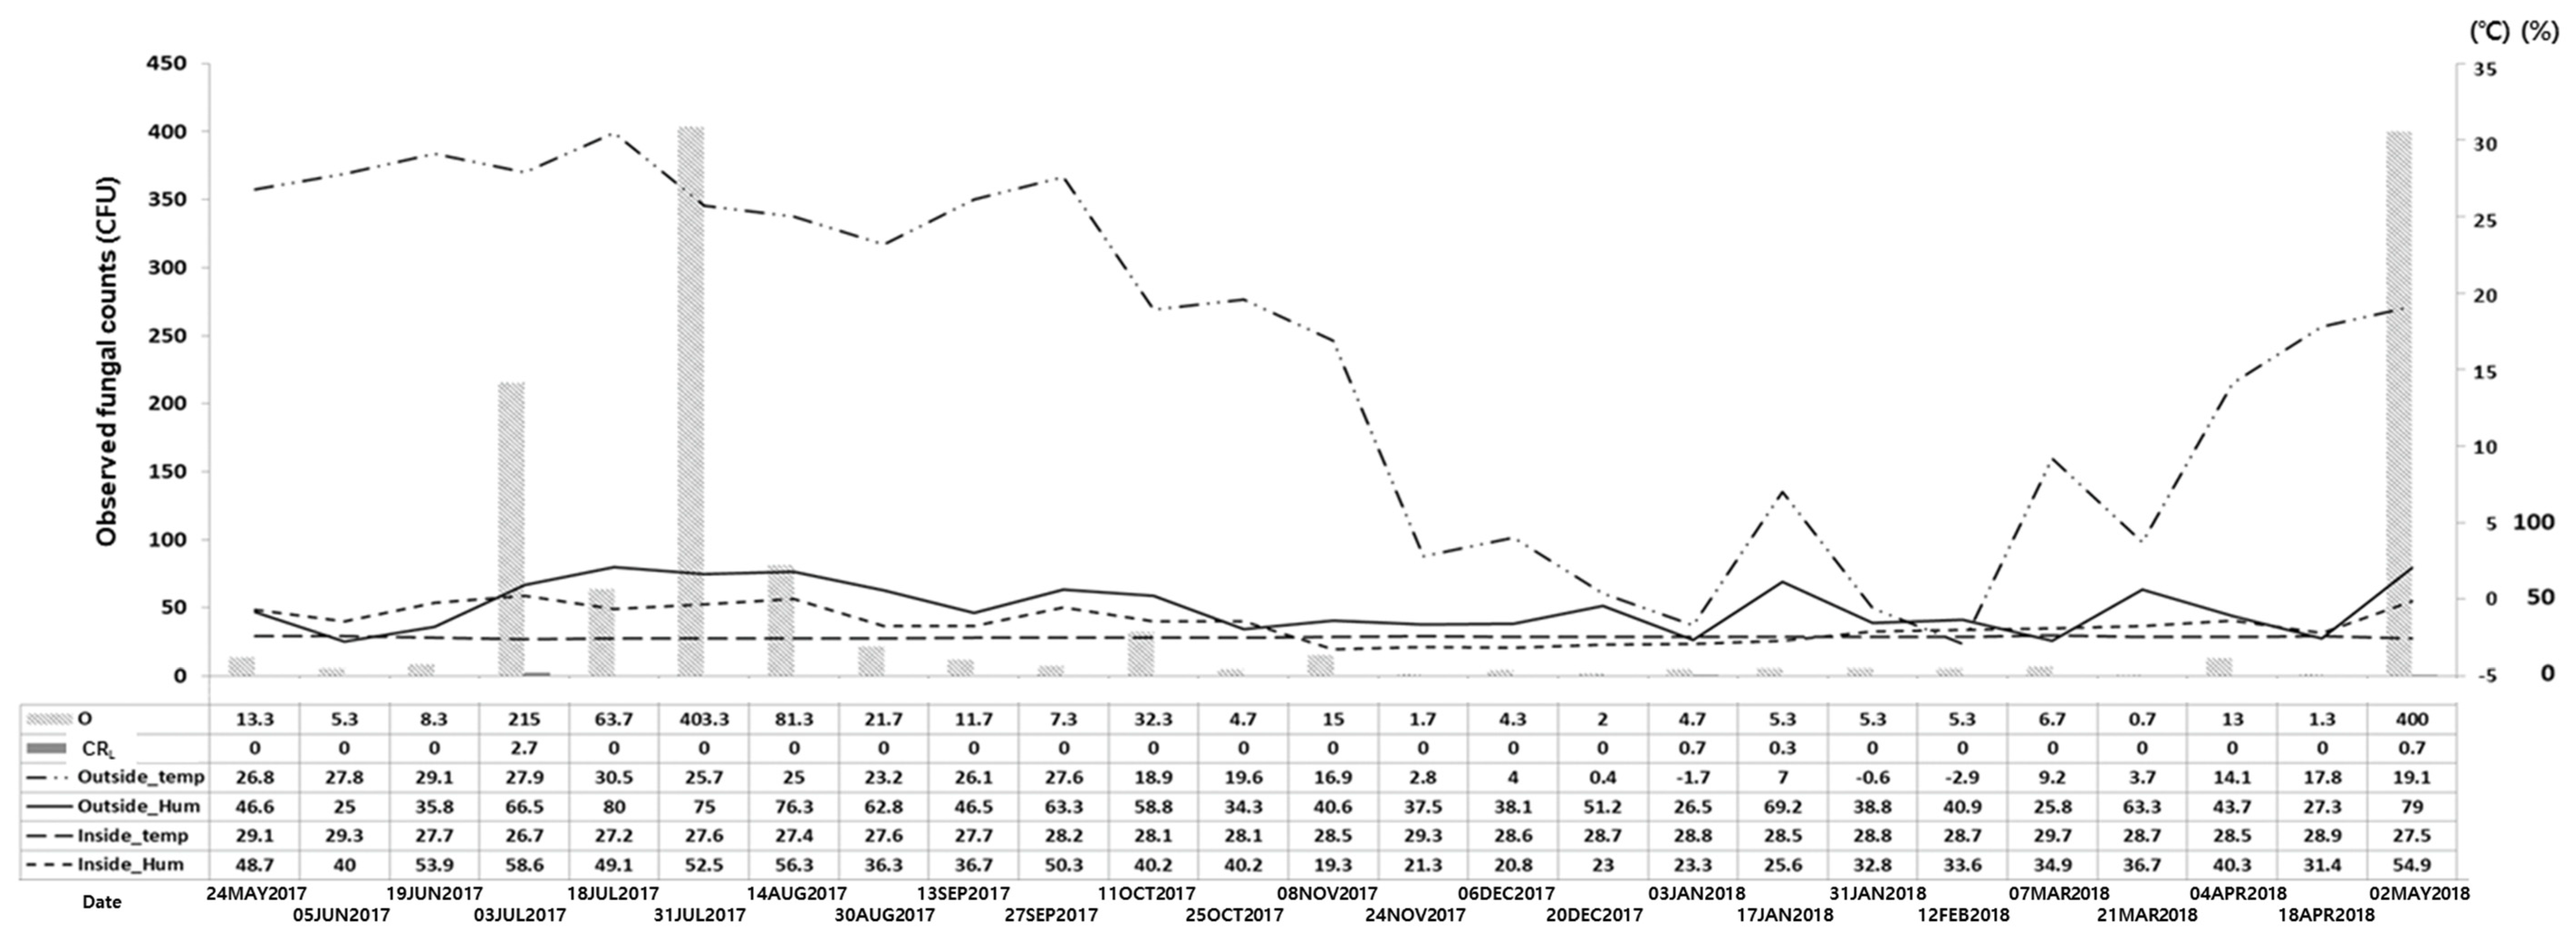
| O | GW | CRL | CRR | |||||||||
|---|---|---|---|---|---|---|---|---|---|---|---|---|
| Mean | SD | (Min., Max.) | Mean | SD | (Min., Max.) | Mean | SD | (Min., Max.) | Mean | SD | (Min., Max.) | |
| Temperature (°C) | 15.9 | 11.3 | (−2.9, 30.5) * | 26.7 | 0.9 | (24.7, 29.0) | 26.5 | 1.6 | (23.5, 29.0) | 28.3 | 0.7 | (26.0, 29.0) |
| Spring | 15.1 | 8.1 | (3.7, 26.8) | 26.3 | 0.8 | (24.8, 27.0) | 27.0 | 2.0 | (24.1, 29.4) | 28.7 | 0.7 | (27.5, 29.7) |
| Summer | 27.0 | 2.5 | (23.2, 30.5) | 27.2 | 1.1 | (26.0, 29.0) | 27.1 | 1.3 | (25.8, 29.2) | 27.6 | 0.8 | (26.7, 29.3) |
| Autumn | 18.7 | 8.8 | (2.8, 27.6) | 26.9 | 0.5 | (26.2, 27.5) | 26.0 | 1.2 | (24.2, 27.4) | 28.3 | 0.5 | (27.7, 29.3) |
| Winter | 1.0 | 3.8 | (−2.9, 7.0) | 26.4 | 1.0 | (24.7, 27.5) | 25.6 | 1.9 | (23.5, 27.7) | 28.7 | 0.1 | (28.5, 28.8) |
| Relative humidity (%) | 50.1 | 17.9 | (25.0, 80.0) * | 41.3 | 12.6 | (22.4, 64.0) | 40.0 | 11.3 | (26.4, 62.1) | 38.4 | 12.1 | (19.3, 58.6) |
| Spring | 47.6 | 20.7 | (25.8, 79.0) | 42.4 | 8.9 | (33.6, 55.9) | 38.6 | 10.1 | (26.4, 52.0) | 41.1 | 8.9 | (31.4, 54.9) |
| Summer | 60.2 | 21.4 | (25.0, 80.0) | 52.2 | 11.8 | (38.9, 64.0) | 51.0 | 9.0 | (37.5, 62.1) | 49.5 | 8.4 | (36.3, 58.6) |
| Autumn | 46.8 | 11.8 | (34.3, 63.3) | 37.7 | 13.5 | (22.4, 56.8) | 37.7 | 11.1 | (27.4, 53.3) | 34.7 | 12.0 | (19.3, 50.3) |
| Winter | 44.1 | 14.6 | (26.5, 69.2) | 31.2 | 5.0 | (22.4, 37.3) | 31.1 | 3.5 | (27.0, 35.5) | 26.5 | 5.4 | (20.8, 33.6) |
| Date | Observed Fungal Count (CFU) | Adjusted Fungal Count (CFU) | Fungal Concentration (CFU/m3) | |||||||||
|---|---|---|---|---|---|---|---|---|---|---|---|---|
| O | GW | CRL | CRR | O | GW | CRL | CRR | O | GW | CRL | CRR | |
| 24 May 2017 | 13.3 | 0.0 | 0 | 0 | 13 | 0 | 0 | 0 | 54.2 | 0.0 | 0.0 | 0 |
| 5 June 2017 | 5.3 | 0.0 | 0 | 0 | 5 | 0 | 0 | 0 | 20.8 | 0.0 | 0.0 | 0 |
| 19 June 2017 | 8.3 | 1.3 | 0 | 0 | 8 | 1 | 0 | 0 | 33.3 | 4.2 | 0.0 | 0 |
| 3 July 2017 | 286.5 | 1.3 | 2.7 | 0 | 505 | 1 | 2.7 | 0 | 2104.2 | 4.2 | 11.3 | 0 |
| 18 July 2017 | 94.0 | 2.0 | 0 | 0.3 | 107 | 2 | 0 | 0 | 445.8 | 8.3 | 0.0 | 0 |
| 31 July 2017 | 400.0 | 2.3 | 0 | 0.3 | 2427 | 2 | 0 | 0 | 10,112.5 | 8.3 | 0.0 | 0 |
| 14 August 2017 | 81.3 | 2.0 | 0 | 0 | 91 | 2 | 0 | 0 | 379.2 | 8.3 | 0.0 | 0 |
| 30 August 2017 | 21.7 | 4.0 | 0 | 0 | 22 | 4 | 0 | 0 | 91.7 | 16.7 | 0.0 | 0 |
| 13 September 2017 | 13.7 | 2.0 | 0 | 0 | 14 | 2 | 0 | 0 | 58.3 | 8.3 | 0.0 | 0 |
| 27 September 2017 | 7.3 | 2.7 | 0 | 0 | 7 | 3 | 0 | 0 | 29.2 | 12.5 | 0.0 | 0 |
| 11 October 2017 | 32.3 | 0.0 | 0 | 0 | 33 | 0 | 0 | 0 | 137.5 | 0.0 | 0.0 | 0 |
| 25 October 2017 | 4.7 | 0.3 | 0 | 0 | 5 | 0 | 0 | 0 | 20.8 | 0.0 | 0.0 | 0 |
| 8 November 2017 | 15.0 | 0.0 | 0 | 0 | 15 | 0 | 0 | 0 | 62.5 | 0.0 | 0.0 | 0 |
| 24 November 2017 | 1.7 | 1.0 | 0 | 0 | 2 | 1 | 0 | 0 | 8.3 | 4.2 | 0.0 | 0 |
| 6 December 2017 | 4.3 | 0.3 | 0 | 0 | 4 | 0 | 0 | 0 | 16.7 | 0.0 | 0.0 | 0 |
| 20 December 2017 | 2.0 | 1.0 | 0 | 0 | 2 | 1 | 0 | 0 | 8.3 | 4.2 | 0.0 | 0 |
| 3 January 2018 | 4.7 | 1.3 | 0.7 | 0.3 | 5 | 1 | 0.7 | 0 | 20.8 | 4.2 | 2.9 | 0 |
| 17 January 2018 | 5.3 | 0.3 | 0.3 | 0 | 5 | 0 | 0.3 | 0 | 20.8 | 0.0 | 1.3 | 0 |
| 31 January 2018 | 5.3 | 1.0 | 0 | 0 | 5 | 1 | 0 | 0 | 20.8 | 4.2 | 0.0 | 0 |
| 12 February 2018 | 5.3 | 1.7 | 0 | 0 | 5 | 2 | 0 | 0 | 20.8 | 8.3 | 0.0 | 0 |
| 7 March 2018 | 6.7 | 1.0 | 0 | 0 | 7 | 1 | 0 | 0 | 29.2 | 4.2 | 0.0 | 0 |
| 21 March 2018 | 0.7 | 0.3 | 0 | 0 | 1 | 0 | 0 | 0 | 4.2 | 0.0 | 0.0 | 0 |
| 4 April 2018 | 13.0 | 0.0 | 0 | 0.3 | 13 | 0 | 0 | 0 | 54.2 | 0.0 | 0.0 | 0 |
| 18 April 2018 | 1.3 | 0.0 | 0 | 0 | 1 | 0 | 0 | 0 | 4.2 | 0.0 | 0.0 | 0 |
| 2 May 2018 | 400.0 | 0.7 | 0.7 | 0 | 2427 | 1 | 0.7 | 0 | 10,112.5 | 4.2 | 2.9 | 0 |
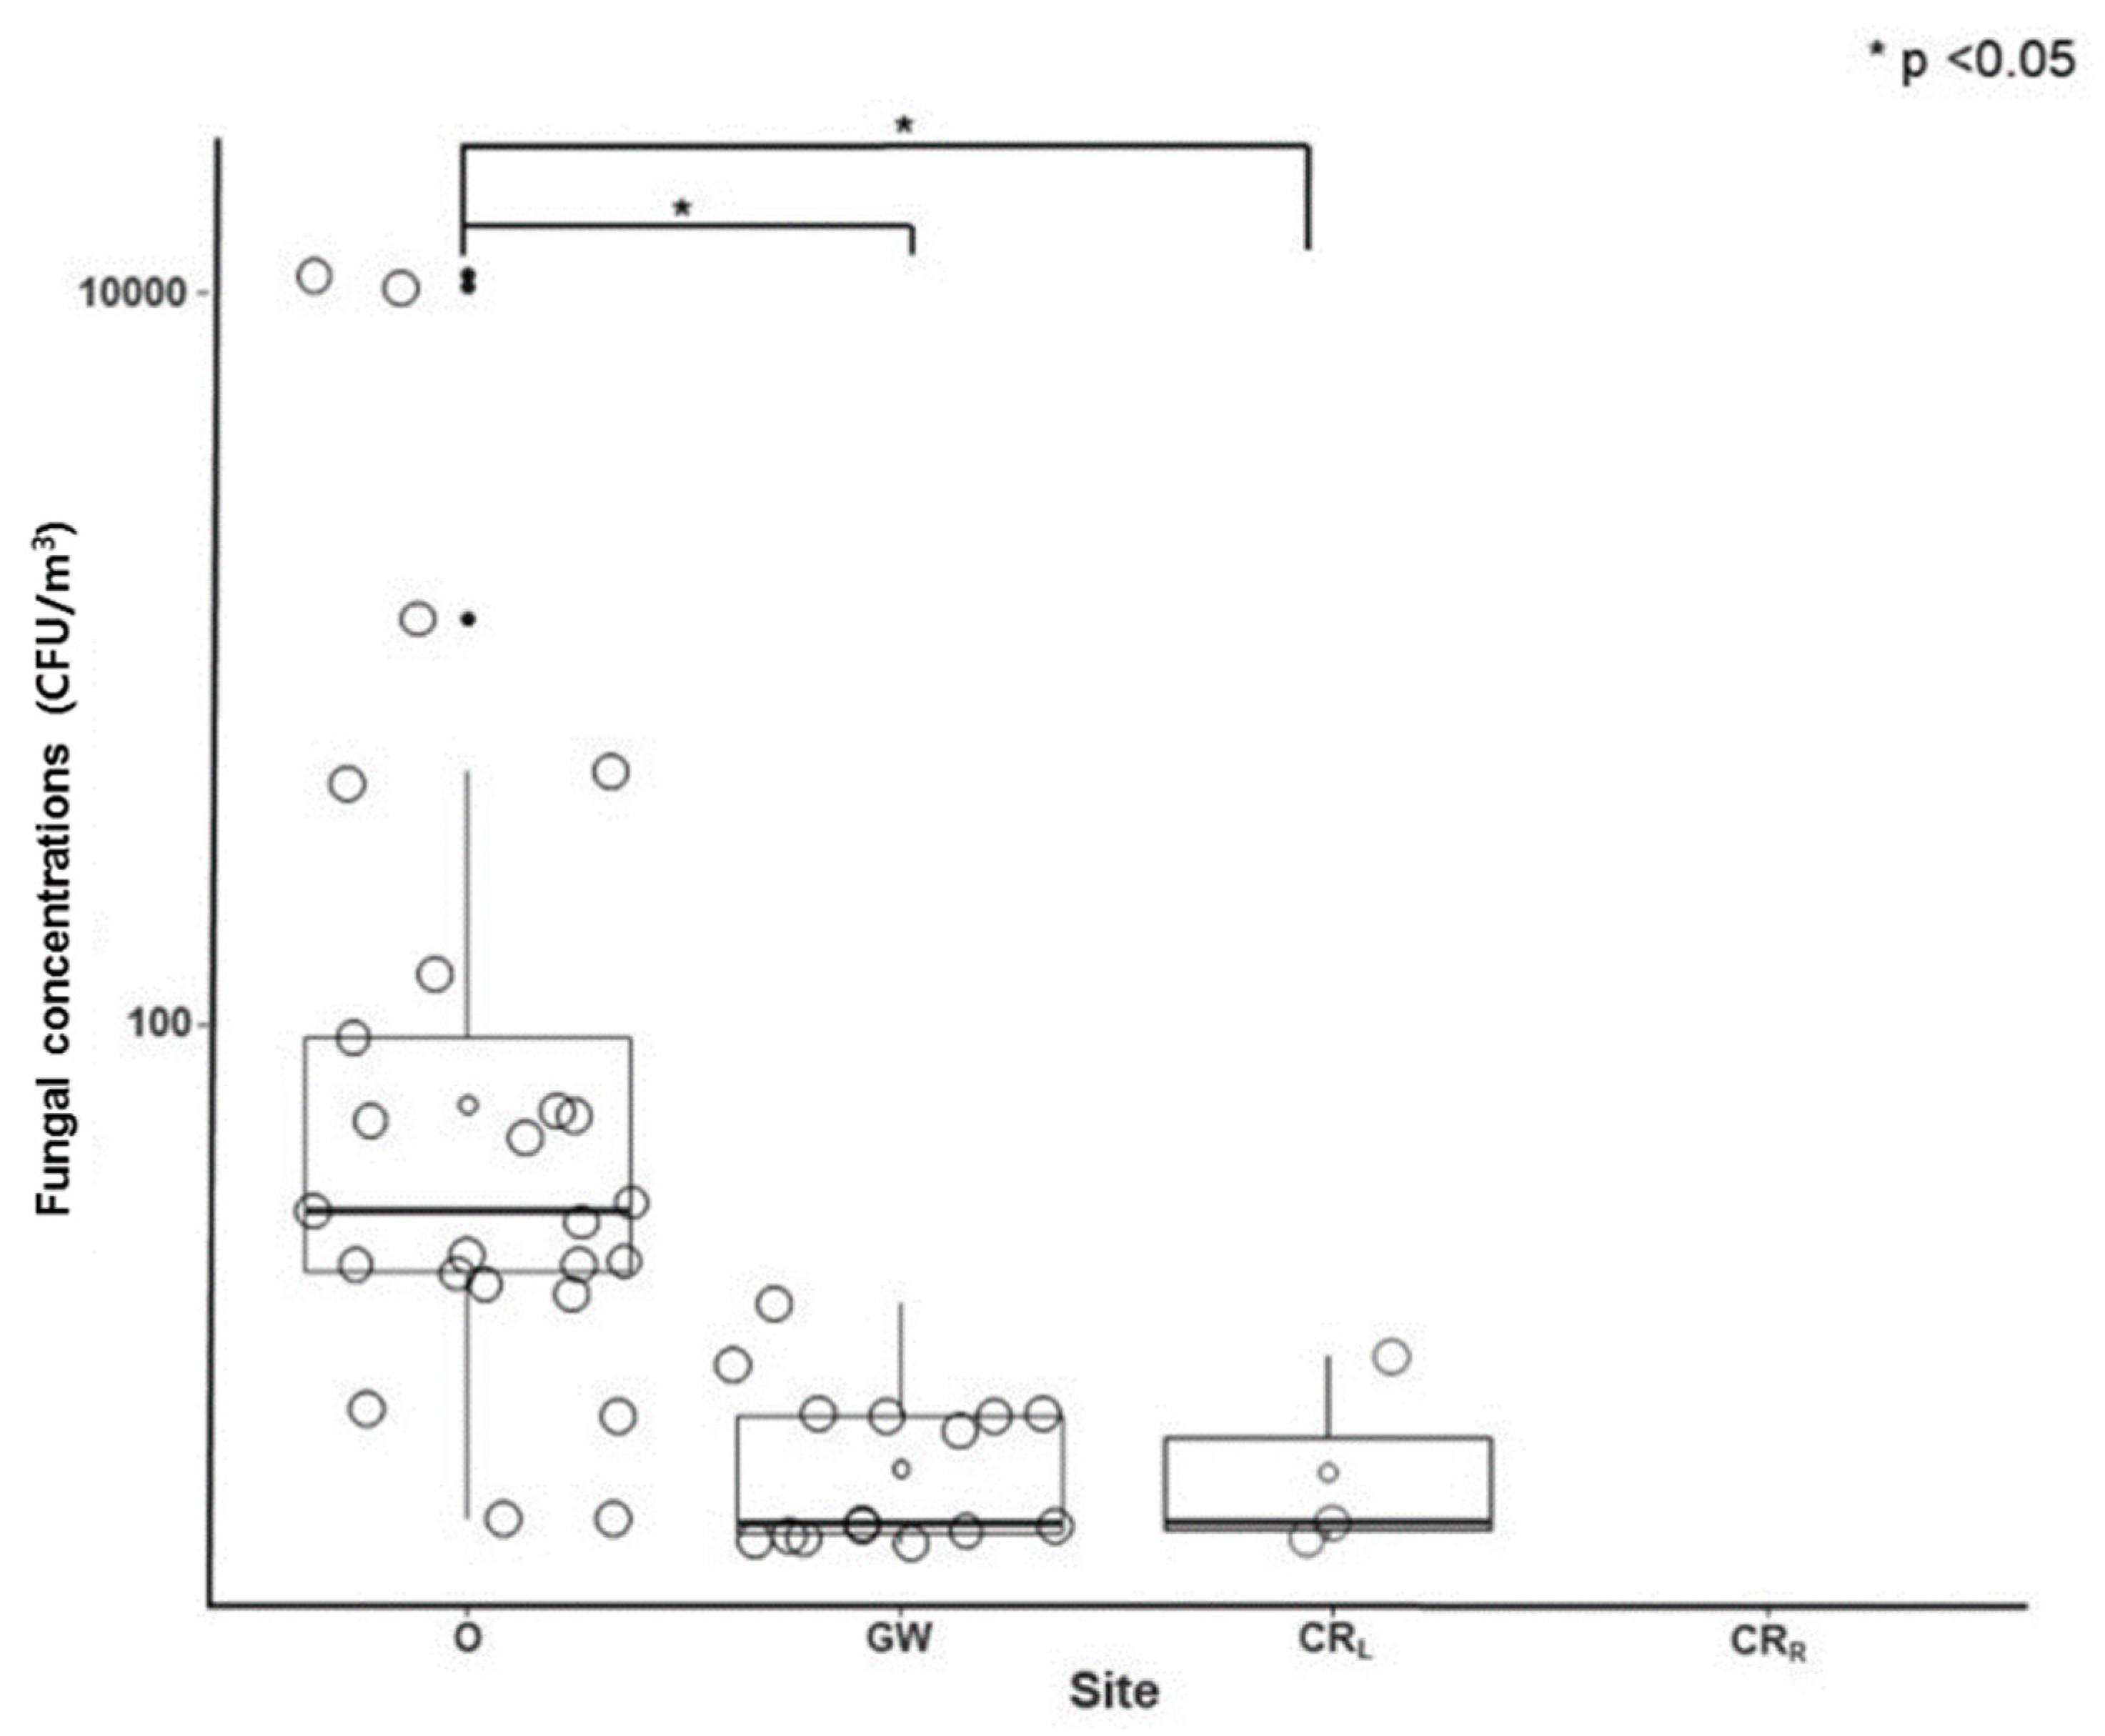
| Total (/Year) | 1433.7 | 26.5 | 4.4 | 1.2 | 5729 | 25 | 4.4 | 0 | 23,870.8 | 104.3 | 0.7 | 0 |
| Average (/sample) | 57.35 | 1.06 | 0.18 | 0.05 | 229.2 | 1 | 0.18 | 0 | 954.8 | 4.1 | 0.7 | 0 |
| Range | 0.7–400 | 0–4.0 | 0–2.7 | 0–0.3 | 1–2427 | 0–4 | 0–2.7 | 0–0 | 4.2–10,112.5 | 0–16.7 | 0–11.3 | 0–0 |
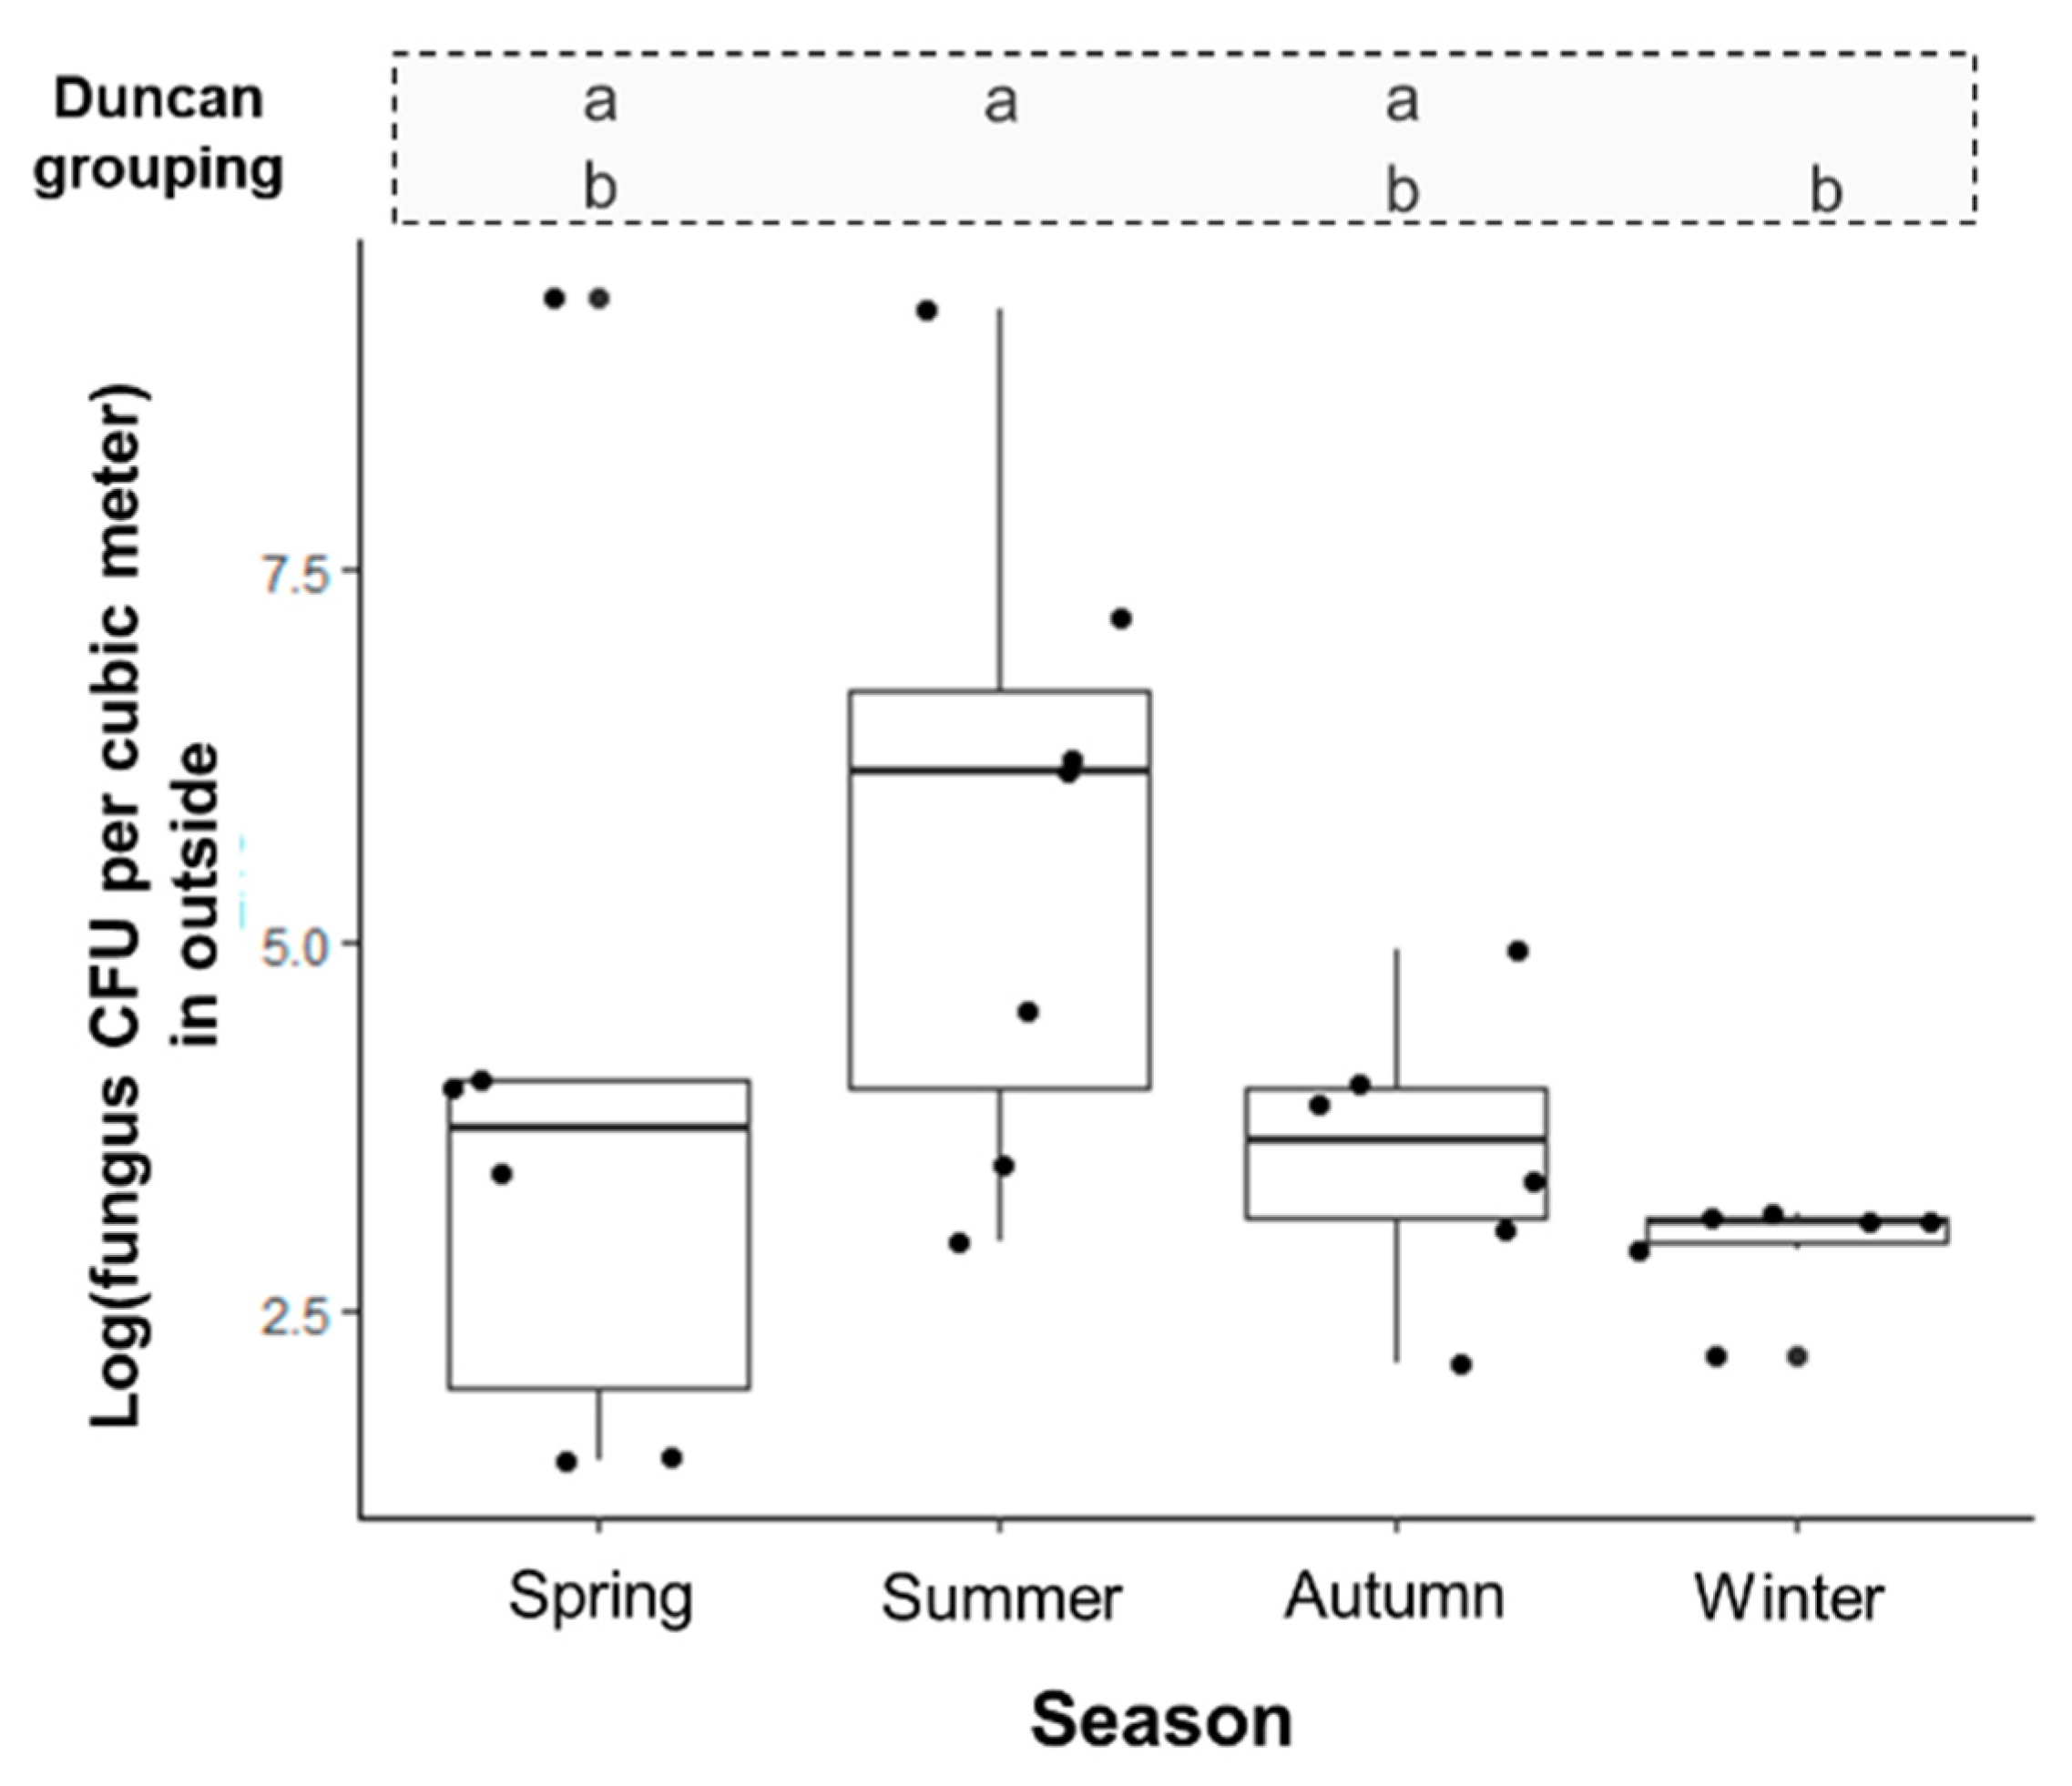
| Season | p Value | ||||
|---|---|---|---|---|---|
| Spring | Summer | Autumn | Winter | ||
| Aspergillus sp. | 5 (33.3) | 27 (77.1) | 38 (84.4) | 28 (73.7) | <0.001 |
| Penicillium sp. | 0 (0.0) | 4 (11.4) | 6 (13.3) | 4 (10.5) | |
| Alternaria sp. | 10 (66.7) | 2 (5.7) | 0 (0.0) | 2 (5.3) | |
| Talaromyces sp. | 0 (0.0) | 2 (5.7) | 1 (2.2) | 4 (10.5) | |
© 2018 by the authors. Licensee MDPI, Basel, Switzerland. This article is an open access article distributed under the terms and conditions of the Creative Commons Attribution (CC BY) license (http://creativecommons.org/licenses/by/4.0/).
Share and Cite
Cho, S.-Y.; Myong, J.-P.; Kim, W.-B.; Park, C.; Lee, S.J.; Lee, S.H.; Lee, D.-G. Profiles of Environmental Mold: Indoor and Outdoor Air Sampling in a Hematology Hospital in Seoul, South Korea. Int. J. Environ. Res. Public Health 2018, 15, 2560. https://doi.org/10.3390/ijerph15112560
Cho S-Y, Myong J-P, Kim W-B, Park C, Lee SJ, Lee SH, Lee D-G. Profiles of Environmental Mold: Indoor and Outdoor Air Sampling in a Hematology Hospital in Seoul, South Korea. International Journal of Environmental Research and Public Health. 2018; 15(11):2560. https://doi.org/10.3390/ijerph15112560
Chicago/Turabian StyleCho, Sung-Yeon, Jun-Pyo Myong, Won-Bok Kim, Chulmin Park, Sung Jeon Lee, Sang Hyeon Lee, and Dong-Gun Lee. 2018. "Profiles of Environmental Mold: Indoor and Outdoor Air Sampling in a Hematology Hospital in Seoul, South Korea" International Journal of Environmental Research and Public Health 15, no. 11: 2560. https://doi.org/10.3390/ijerph15112560
APA StyleCho, S.-Y., Myong, J.-P., Kim, W.-B., Park, C., Lee, S. J., Lee, S. H., & Lee, D.-G. (2018). Profiles of Environmental Mold: Indoor and Outdoor Air Sampling in a Hematology Hospital in Seoul, South Korea. International Journal of Environmental Research and Public Health, 15(11), 2560. https://doi.org/10.3390/ijerph15112560