Factors Associated with Home Fire Escape Plans in New South Wales: Multinomial Analysis of High-Risk Individuals and New South Wales Population


Abstract
1. Introduction
2. Methods
2.1. Data Source
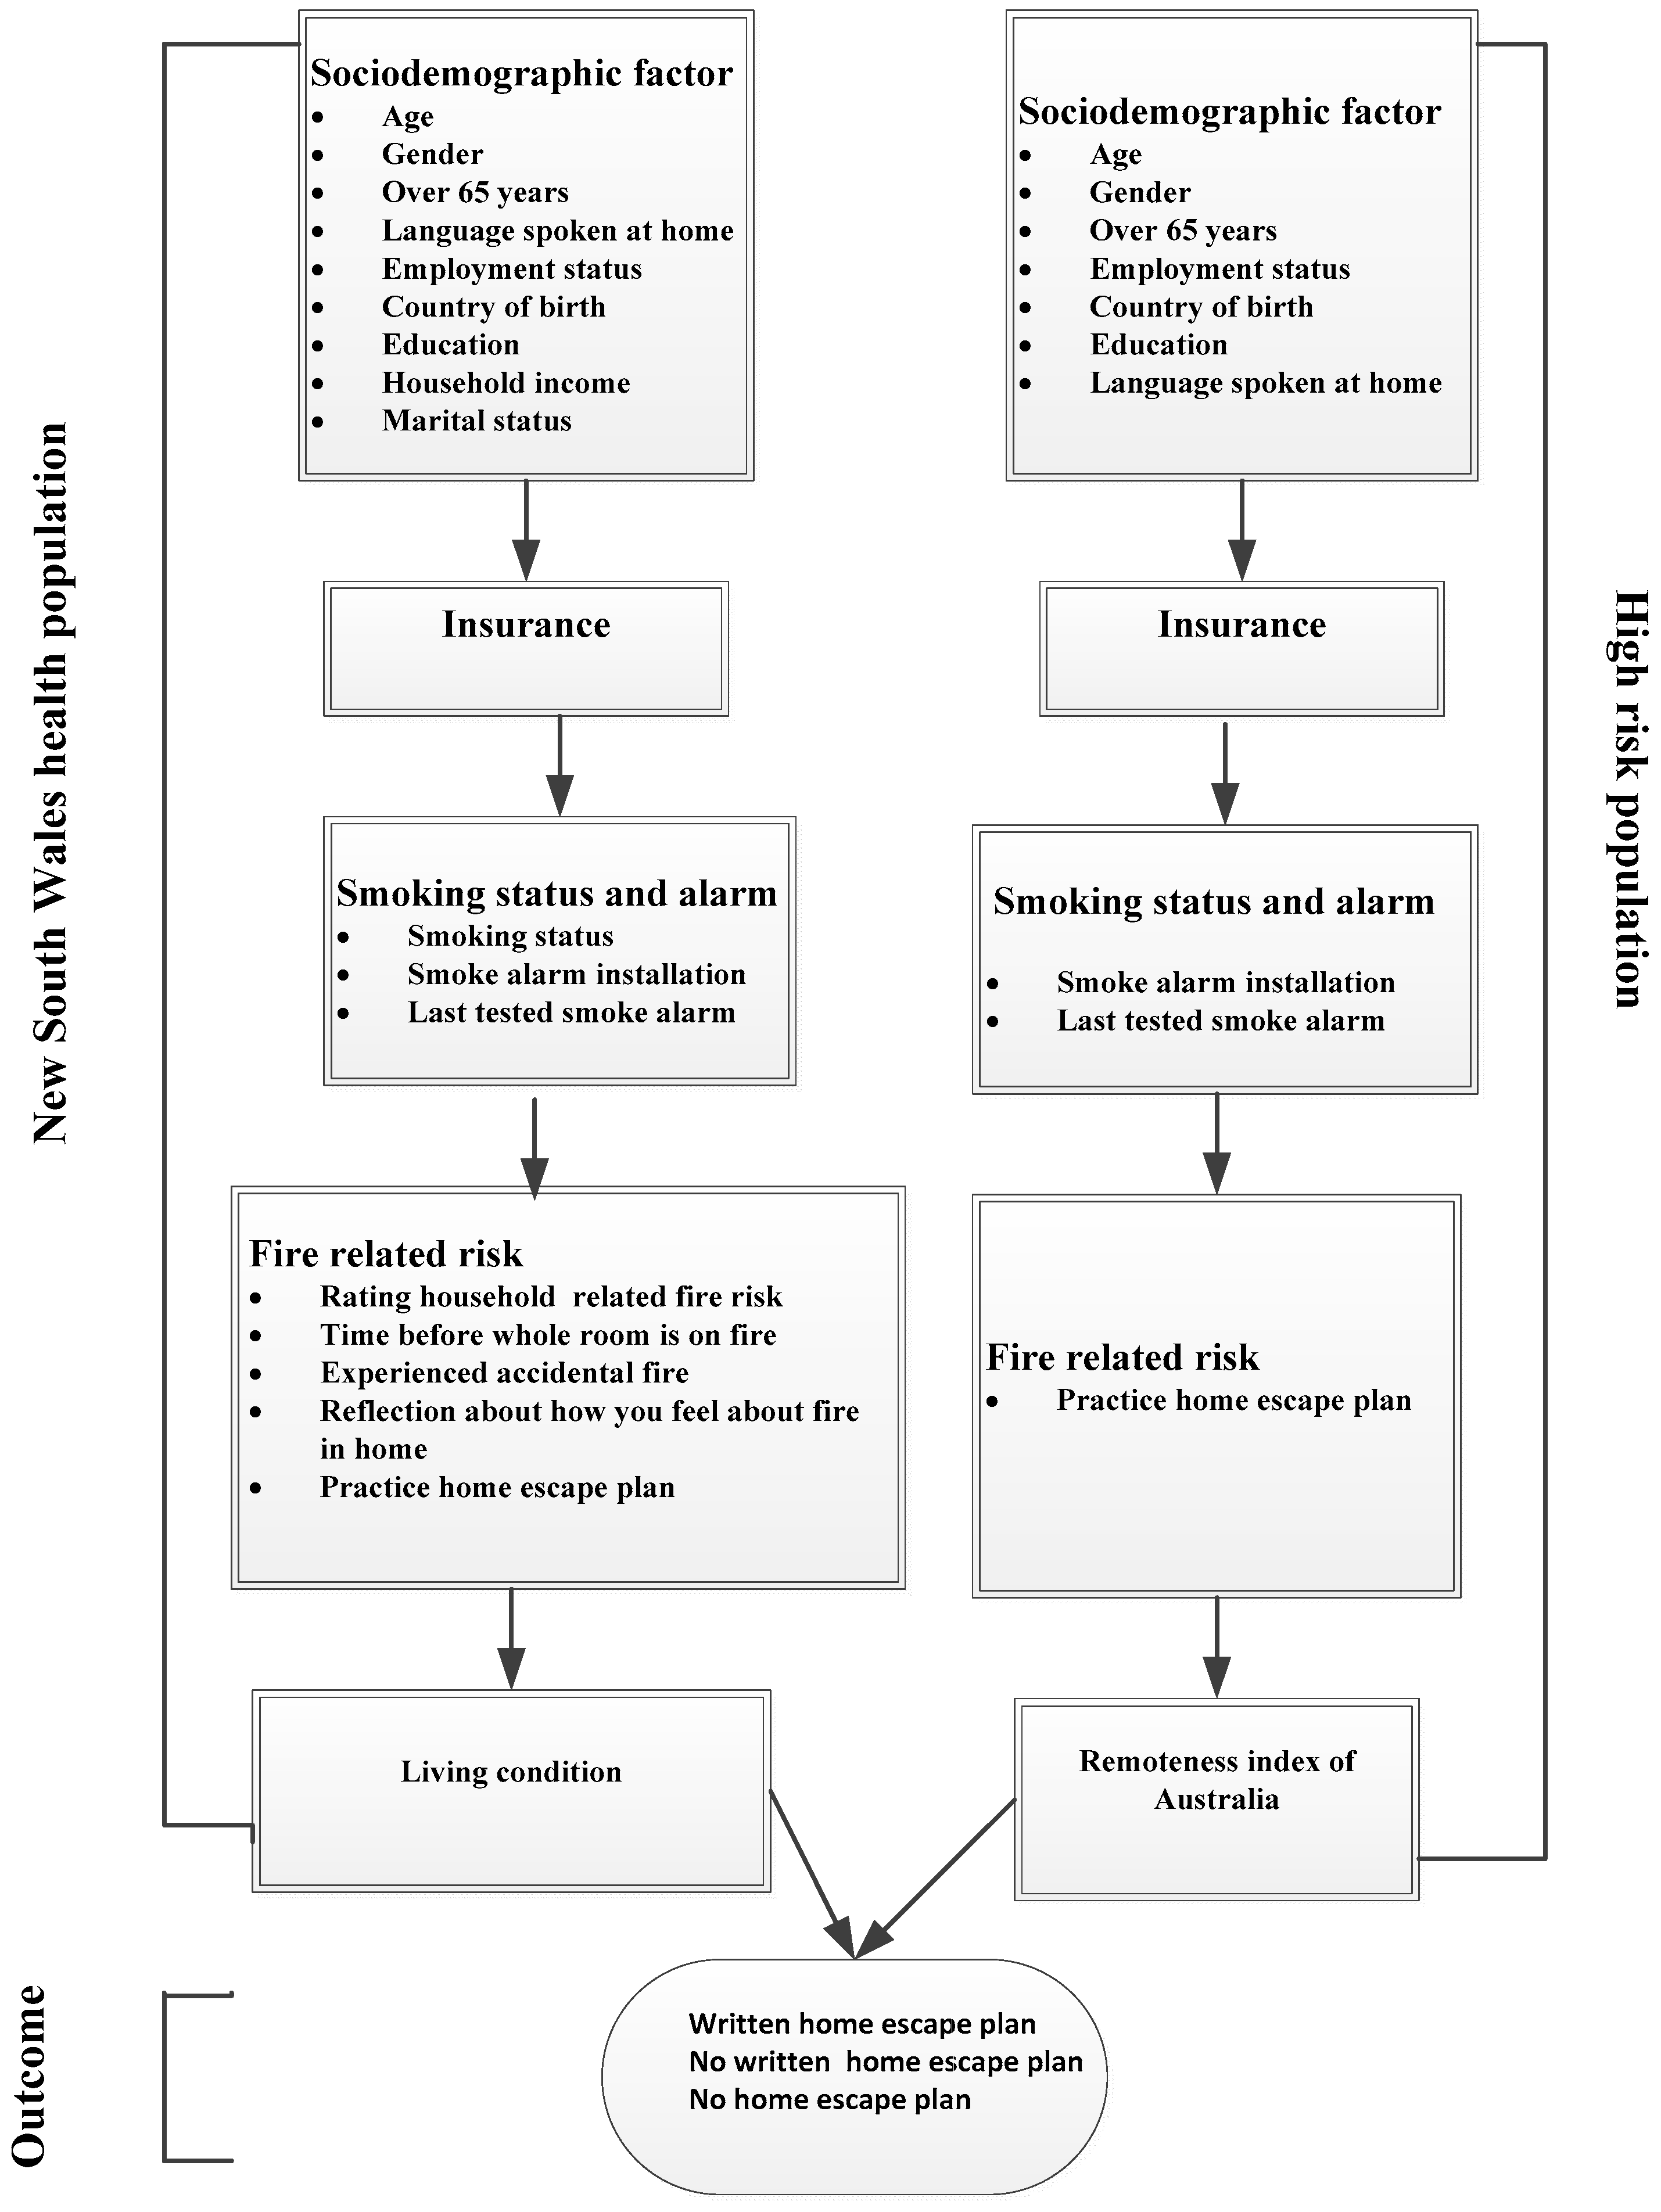
2.2. Conceptual Framework and Study Variables
3. Statistical Analysis
4. Results
4.1. Characteristics of the Respondents
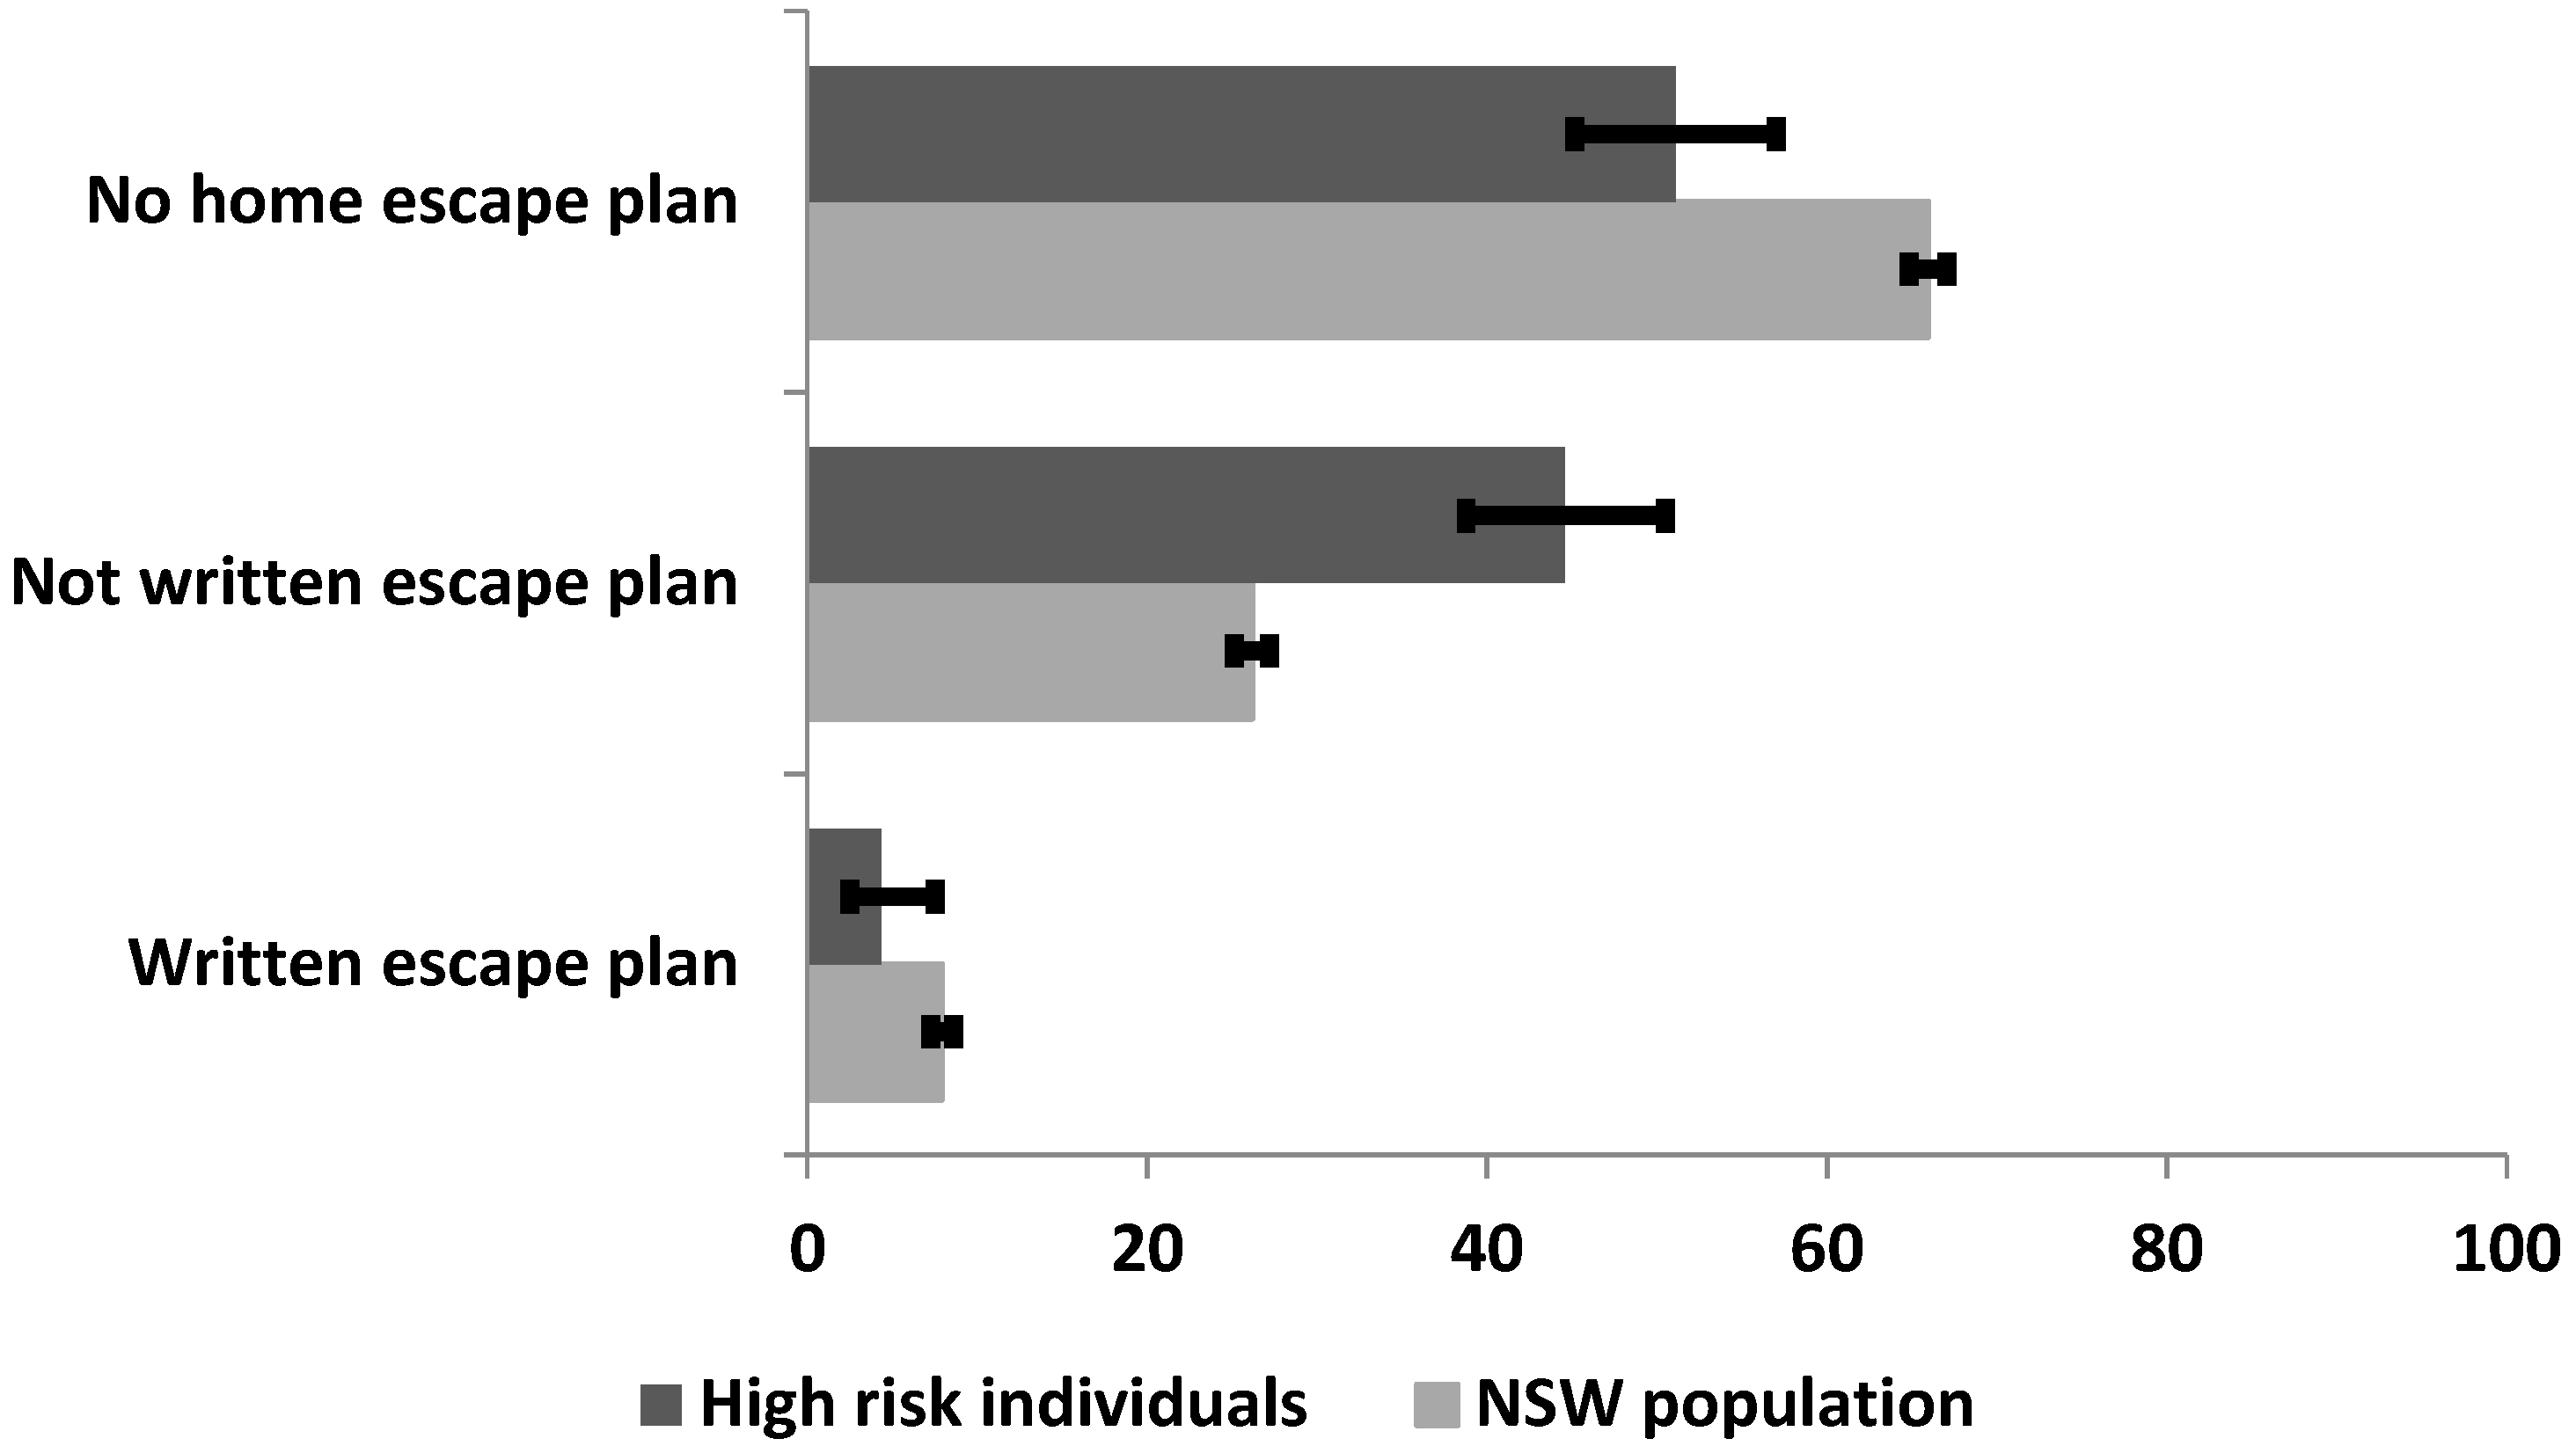
4.2. Prevalence of Home-Fire Escape Plans
4.3. Unadjusted Estimates of Home-Fire Escape Plans
4.4. Factors Associated with Home-Fire Escape Plans
5. Discussion
6. Conclusions
Author Contributions
Funding
Acknowledgments
Conflicts of Interest
References
- Australia Productivity Commission. Report on Government Services 2018; Productivity Commission: Melbourne, Australia, 2018.
- Boffa, J.W.; Stanley, I.H.; Hom, M.A.; Norr, A.M.; Joiner, T.E.; Schmidt, N.B. PTSD symptoms and suicidal thoughts and behaviors among firefighters. J. Psychiatr. Res. 2017, 84, 277–283. [Google Scholar] [CrossRef] [PubMed]
- Lewis, C. Are house fires changing? Aust. J. Emerg. Manag. 2008, 23, 44. [Google Scholar]
- Bukowski, R.W.; Peacock, R.D.; Averill, J.D.; Cleary, T.G.; Bryner, N.P.; Reneke, P.A. Performance of Home Smoke Alarms, Analysis of the Response of Several Available Technologies in Residential Fire Settings; NIST: Gaithersburg, MD, USA, 2003.
- McKenna, S.T.; Birtles, R.; Dickens, K.; Walker, R.G.; Spearpoint, M.J.; Stec, A.A.; Hull, T.R. Flame retardants in UK furniture increase smoke toxicity more than they reduce fire growth rate. Chemosphere 2018, 196, 429–439. [Google Scholar] [CrossRef] [PubMed]
- Marshall, S.W.; Runyan, C.W.; Bangdiwala, S.I.; Linzer, M.A.; Sacks, J.J.; Butts, J.D. Fatal residential fires: Who dies and who survives? JAMA 1998, 279, 1633–1637. [Google Scholar] [CrossRef] [PubMed]
- Ahrens, M. U.S. Experience with Smoke Alarms and Other Fire Detection/Alarm Equipment; NFPA Report; National Fire Protection Association: Quincy, MA, USA, 2007. [Google Scholar]
- American Academy of Pediatrics. Reducing the number of deaths and injuries from residential fires. Pediatrics 2000, 105, 1355–1357. [Google Scholar] [CrossRef]
- Ballesteros, M.F.; Kresnow, M.-J. Prevalence of residential smoke alarms and fire escape plans in the US: Results from the Second Injury Control and Risk Survey (ICARIS-2). Public Health Rep. 2007, 122, 224–231. [Google Scholar] [CrossRef] [PubMed]
- Lehna, C.; Coty, M.-B.; Fahey, E.; Williams, J.; Scrivener, D.; Wishnia, G.; Myers, J. Intervention study for changes in home fire safety knowledge in urban older adults. Burns 2015, 41, 1205–1211. [Google Scholar] [CrossRef] [PubMed]
- Ballesteros, M.F.; Jackson, M.L.; Martin, M.W. Working toward the elimination of residential fire deaths: The Centers for Disease Control and Prevention’s Smoke Alarm Installation and Fire Safety Education (SAIFE) program. J. Burn Care Rehabil. 2005, 26, 434–439. [Google Scholar] [CrossRef] [PubMed]
- U.S. Consumer Product Safety Commission. Test All Smoke Alarms (Detectors) and Annually Replace Batteries Develop and Rehearse an Escape Plan; U.S. Consumer Product Safety Commission: Bethesda, MD, USA, 2018.
- Mallonee, S.; Istre, G.R.; Rosenberg, M.; Reddish-Douglas, M.; Jordan, F.; Silverstein, P.; Tunell, W. Surveillance and prevention of residential-fire injuries. N. Engl. J. Med. 1996, 335, 27–31. [Google Scholar] [CrossRef] [PubMed]
- Weiger, P. Remembering When. NFPA J. 2002, 96, 64–67. [Google Scholar]
- Centers for Disease Control Prevention. Nonfatal residential fire-related injuries treated in emergency departments—United States, 2001. MMWR Morb. Mortal. Wkly. Rep. 2003, 52, 906–908. [Google Scholar]
- Tancogne-Dejean, M.; Laclémence, P. Fire risk perception and building evacuation by vulnerable persons: Points of view of laypersons, fire victims and experts. Fire Saf. J. 2016, 80, 9–19. [Google Scholar] [CrossRef]
- Yang, J.; Peek-Asa, C.; Allareddy, V.; Zwerling, C.; Lundell, J. Perceived risk of home fire and escape plans in rural households. Am. J. Prev. Med. 2006, 30, 7–12. [Google Scholar] [CrossRef] [PubMed]
- Barr, M.L.; Ferguson, R.A.; Hughes, P.J.; Steel, D.G. Developing a weighting strategy to include mobile phone numbers into an ongoing population health survey using an overlapping dual-frame design with limited benchmark information. BMC Med. Res. Methodol. 2014, 14, 102. [Google Scholar] [CrossRef] [PubMed]
- Halvorsen, K.; Almklov, P.G.; Gjøsund, G. Fire safety for vulnerable groups: The challenges of cross-sector collaboration in Norwegian municipalities. Fire Saf. J. 2017, 92, 1–8. [Google Scholar] [CrossRef]
- Tannous, W.K.; Williams Tetteh, V. Evaluation of Vulnerable Communities Resilience Project for Fire & Rescue New South Wales Final Report; Western Sydney University: Sydney, Australia, 2016. [Google Scholar]
- Turner, S.L.; Johnson, R.D.; Weightman, A.L.; Rodgers, S.E.; Arthur, G.; Bailey, R.; Lyons, R.A. Risk factors associated with unintentional house fire incidents, injuries and deaths in high-income countries: A systematic review. Inj. Prev. 2017, 23, 131–137. [Google Scholar] [CrossRef] [PubMed]
- Yu, S.M.; Huang, Z.J.; Schwalberg, R.H.; Overpeck, M.D.; Kogan, M.D. Association of language spoken at home with health and school issues among Asian American adolescents. J. Sch. Health 2002, 72, 192–198. [Google Scholar] [CrossRef] [PubMed]
- Babio, G.O.; Daponte-Codina, A. Factors associated with seatbelt, helmet, and child safety seat use in a Spanish high-risk injury area. J. Trauma Acute Care Surg. 2006, 60, 620–626. [Google Scholar] [CrossRef] [PubMed]
- Gove, W.R. Sex, marital status, and mortality. Am. J. Sociol. 1973, 79, 45–67. [Google Scholar] [CrossRef] [PubMed]
- Umberson, D. Family status and health behaviors: Social control as a dimension of social integration. J. Health Soc. Behav. 1987, 28, 306–319. [Google Scholar] [CrossRef] [PubMed]
- Umberson, D. Gender, marital status and the social control of health behavior. Soc. Sci. Med. 1992, 34, 907–917. [Google Scholar] [CrossRef]
- Baker, E.V.; Mosteller, J.J.; Williams, J.V.; Bennett, T.J. Evaluating the Need for a Consumer Focused Smoke Alarm Performance System; Worcester Polytechnic Institute: Worcester, MA, USA, 2015. [Google Scholar]


| Variables | High-Risk Individuals n = 296 | NSW Population n = 13,027 |
|---|---|---|
| Demographic | n (%) | n (%) |
| Gender | ||
| Male | 95 (33.1) | 5416 (41.6) |
| Female | 192 (66.9) | 7611 (58.4) |
| Age | 57.1 (16.6) | 54.0 (18.3) |
| Language spoken at home | ||
| English | 241 (83.1) | 10,741 (85.9) |
| English plus other languages | 49 (16.9) | 1765 (14.1) |
| Over 65 years | ||
| No | 116 (39.2) | 8841 (67.9) |
| Yes | 180 (60.8) | 4186 (32.1) |
| Current employment status | ||
| Employed | 12 (43.1) | 6987 (53.9) |
| Not employed | 161 (56.9) | 5969 (46.1) |
| Country of birth | ||
| Australia | 230 (79.6) | 9204 (70.6) |
| Others | 59 (20.4) | 3823 (29.4) |
| Education status | ||
| Uni | 68 (24.4) | 3999 (31.1) |
| TAFE | 59 (21.1) | 3512 (37.3) |
| SC | 152 (54.5) | 5347 (41.6) |
| Household income (before tax) | ||
| <$20,000 | 2076 (20.5) | |
| $20,000–40,000 | 2139 (21.2) | |
| $40,000–60,000 | 1382 (13.7) | |
| $60,000–80,000 | 1161 (11.4) | |
| >$80,000 | 3340 (33.0) | |
| Marital status | ||
| Married | 6711 (51.9) | |
| Widowed | 1473 (11.4) | |
| Separated | 1911 (14.8) | |
| Never married | 2840 (21.9) | |
| Insurance | ||
| No | 132 (44.6) | 5486 (42.5) |
| Yes | 164 (55.4) | 7423 (57.5) |
| Smoking status | ||
| Never | 6293 (48.4) | |
| Ever | 4882 (37.5) | |
| Now | 1826 (14.1) | |
| Smoke Alarm | ||
| Smoke alarm installation | ||
| Battery | 191 (66.3) | 8137 (68.1) |
| Hardwire | 51 (17.7) | 2347 (19.7) |
| Both | 46 (16) | 1463 (12.2) |
| Last tested smoke alarm | ||
| Less than 6 months | 64 (21.6) | 7802 (59.9) |
| 6 months or over | 232 (78.4) | 5225 (40.1) |
| Attitude towards fires | ||
| Rating household related fire risk | ||
| Low-risk | 160 (54.1) | |
| High-risk | 136 (45.9) | |
| Fire awareness | ||
| Time have before whole room is on fire | ||
| <5 min | 186 (72.1) | |
| 5–15 min | 72 (27.9) | |
| Experienced unintentional or accidental fire | ||
| Yes | 40 (13.9) | |
| No | 247 (86.1) | |
| Reflection about how you feel about fire in home | ||
| High thought risk | 195 (65.9) | |
| Low thought risk | 101 (34.1) | |
| Practice home escape plan | ||
| <1 year | 54 (24.4) | 1169 (9.0) |
| 1 year or more | 167 (75.6) | 11,760 (91.0) |
| Living condition | ||
| Own | 213 (74) | |
| Rent | 75 (26) | |
| Remoteness Index of Australia | ||
| Highly accessible | 1969 (15.1) | |
| Accessible | 2224 (17.1) | |
| Moderately accessible | 2800 (21.5) | |
| Remote/Very remote | 6028 (46.3) |
| Variables | High-Risk Individuals | New South Wales (NSW) Population | ||||||
|---|---|---|---|---|---|---|---|---|
| Does Your Household Have Home Escape Plan | Does Your Household Have Home Escape Plan | |||||||
| Written | Not Written | No Home Escape Plan | p-Value | Written | Not Written | No Home Escape Plan | p-Value | |
| % [95% CI] | % [95% CI] | % [95% CI] | % [95% CI] | % [95% CI] | % [95% CI] | |||
| Gender | ||||||||
| Male | 2.3 [0.6, 8.8] | 47.1 [36.8, 57.7] | 50.6 [40.1, 61.0] | 7.9 [7.2, 8.6] | 24.0 [22.9, 25.2] | 68.1 [66.9, 69.4] | ||
| Female | 5.5 [3.0, 10.0] | 41.4 [34.4, 48.8] | 53.0 [45.7, 60.2] | 0.394 | 7.6 [7.0, 8.2] | 28.6 [27.6, 29.6] | 63.8 [62.7, 64.9] | <0.001 |
| Age in years (mean, sd) | 59.8 (15.4) | 58.4 (14.6) | 54.3 (17.5) | 0.096 | 53.1 (20.4) | 55.1 (16.9) | 53.7 (18.5) | <0.001 |
| Language spoken at home | ||||||||
| English | 3.5 [1.8, 6.9] | 46.5 [40.0, 53.0] | 50.0 [43.5, 56.5] | 7.4 [6.9, 7.9] | 28.6 [27.7, 29.5] | 64.0 [63.1, 64.9] | ||
| English plus other languages | 8.9 [3.4, 21.5] | 31.1 [19.3, 46.0] | 60.0 [45.1, 73.2] | 0.077 | 10.5 [9.1, 12.0] | 18.9 [17.1, 20.9] | 70.6 [68.4, 72.8] | <0.001 |
| Over 65 years | ||||||||
| No | 5.8 [2.6, 12.4] | 48.5 [39.0, 58.2] | 45.6 [36.2, 55.4] | 7.5 [7.0, 8.1] | 26.2 [25.3, 27.1] | 66.3 [65.3, 67.2] | ||
| Yes | 3.5 [1.6, 7.5] | 42.2 [35.0, 49.7] | 54.3 [46.8, 61.7] | 0.308 | 8.1 [7.3, 9.0] | 27.7 [26.3, 29.1] | 64.3 [62.8, 65.7] | 0.0834 |
| Current employment status | ||||||||
| Employed | 2.5 [0.8, 7.6] | 42.4 [33.7, 51.5] | 55.1 [46.0, 63.9] | 7.4 [6.8, 8.0] | 27.3 [26.2, 28.4] | 65.3 [64.2, 66.4] | ||
| Not employed | 6.1 [3.2, 11.4] | 45.6 [37.7, 53.7] | 48.3 [40.3, 56.4] | 0.276 | 8.1 [7.4, 8.8] | 26.1 [24.9, 27.2] | 65.9 [64.6, 67.1] | 0.1433 |
| Country of birth | ||||||||
| Australia | 3.2 [1.5, 6.6] | 47.0 [40.4, 53.7] | 49.8 [43.1, 56.4] | 7.2 [6.7, 7.8] | 28.7 [27.8, 29.6] | 64.1 [63.1, 65.1] | ||
| Others | 9.4 [4.0, 20.8] | 32.1 [20.9, 45.8] | 58.5 [44.8, 70.9] | 0.041 | 8.9 [8.0, 9.9] | 21.7 [20.4, 23.1] | 69.4 [67.9, 70.9] | <0.001 |
| Educational status | ||||||||
| Uni | 2.9 [0.7, 11.1] | 41.2 [30.1, 53.2] | 55.9 [43.9, 67.2] | 7.7 [6.9, 8.6] | 28.3 [26.9, 29.7] | 64.0 [62.5, 65.5] | ||
| TAFE | 5.3 [1.7, 15.2] | 52.6 [39.7, 65.2] | 42.1 [30.0, 55.2] | 7.4 [6.5, 8.3] | 30.0 [28.5, 31.5] | 62.7 [61.0, 64.3] | <0.001 | |
| SC | 3.6 [1.5, 8.3] | 42.1 [34.2, 50.5] | 54.3 [45.9, 62.4] | 0.547 | 7.9 [7.2, 8.6] | 23.6 [22.5, 24.8] | 68.5 [67.2, 69.7] | |
| Household income (before tax) | ||||||||
| <$20,000 | 8.7 [7.5, 10.0] | 24.7 [22.8, 26.6] | 66.7 [64.6, 68.7] | |||||
| $20,000–40,000 | 7.3 [6.2, 8.5] | 28.9 [27.0, 30.9] | 63.8 [61.8, 65.9] | |||||
| $40,000–60,000 | 7.9 [6.6, 9.5] | 26.8 [24.5, 29.2] | 65.3 [62.7, 67.8] | 0.0131 | ||||
| $60,000–80,000 | 6.8 [5.5, 8.5] | 27.6 [25.1, 30.3] | 65.5 [62.7, 68.2] | |||||
| >$80,000 | 6.8 [6.0, 7.7] | 29.1 [27.6, 30.7] | 64.1 [62.5, 65.8] | |||||
| Marital status | ||||||||
| Married | 7.0 [6.4, 7.6] | 29.1 [28.0, 30.2] | 64.0 [62.8, 65.1] | |||||
| Widowed | 9.3 [7.9, 11.0] | 24.6 [22.4, 26.9] | 66.1 [63.6, 68.5] | |||||
| Separated | 6.9 [5.8, 8.1] | 27.5 [25.5, 29.5] | 65.7 [63.5, 67.8] | |||||
| Never married | 9.3 [8.3, 10.5] | 21.5 [20.0, 23.1] | 69.2 [67.4, 70.9] | |||||
| Insurance | ||||||||
| No | 4.2 [1.7, 9.7] | 40.8 [32.4, 49.9] | 55.0 [46.0, 63.7] | 8.0 [7.3, 8.8] | 24.5 [23.3, 25.6] | 67.5 [66.2, 68.7] | ||
| Yes | 4.5 [2.1, 9.2] | 47.4 [39.7, 55.3] | 48.1 [40.3, 55.9] | 0.520 | 7.4 [6.8, 8.0] | 28.4 [27.3, 29.4] | 64.3 [63.2, 65.4] | <0.001 |
| Smoking status | ||||||||
| Never | 7.9 [7.3, 8.6] | 26.7 [25.6, 27.9] | 65.3 [64.1, 66.5] | |||||
| Ever | 7.2 [6.5, 8.0] | 27.7 [26.4, 29.0] | 65.1 [63.8, 66.5] | 0.0169 | ||||
| Now | 8.2 [7.0, 9.6] | 23.7 [21.8, 25.8] | 68.0 [65.8, 70.2] | |||||
| Smoke Alarm | ||||||||
| Smoke alarm installation | ||||||||
| Battery | 5.1 [2.7, 9.6] | 41.7 [34.6, 49.2] | 53.1 [45.7, 60.5] | 6.9 [6.4, 7.5] | 26.0 [25.1, 27.0] | 67.1 [66.0, 68.1] | ||
| Hardwire | 0 | 59.2 [45.0, 72.0] | 40.8 [28.0, 55.0] | 0.178 | 9.9 [8.8, 11.2] | 28.6 [26.8, 30.5] | 61.4 [59.4, 63.4] | <0.001 |
| Both | 4.3 [1.1, 15.9] | 43.5 [30.0, 58.0] | 52.2 [37.9, 66.1] | 9.3 [7.9, 10.9] | 34.5 [32.1, 37.0] | 56.1 [53.6, 58.7] | ||
| Last tested smoke alarm | ||||||||
| Less than 6 months | 7.9 [3.3, 17.8] | 50.8 [38.6, 62.9] | 41.3 [29.8, 53.8] | 8.9 [8.2, 9.5] | 29.9 [28.8, 30.9] | 61.3 [60.2, 62.4] | ||
| 6 months or over | 3.3 [1.6, 6.8] | 42.7 [36.2, 49.5] | 54.0 [47.2, 60.6] | 0.099 | 6.0 [5.3, 6.6] | 21.8 [20.7, 23.0] | 72.2 [71.0, 73.4] | <0.001 |
| Attitude towards fires | ||||||||
| Rating household related fire risk | ||||||||
| Low-risk | 3.4 [1.4, 8.1] | 42.8 [34.9, 51.0] | 53.8 [45.6, 61.8] | |||||
| High-risk | 5.3 [2.6, 10.8] | 46.6 [38.2, 55.2] | 48.1 [39.6, 56.7] | 0.542 | ||||
| Fire awareness | ||||||||
| Time have before whole room is on fire | ||||||||
| <5 min | 4.5 [2.2, 8.7] | 42.5 [35.4, 49.9] | 53.1 [45.7, 60.3] | |||||
| 5–15 min | 4.3 [1.4, 12.7] | 53.6 [41.8, 65.1] | 42.0 [30.9, 54.0] | 0.278 | ||||
| Experienced unintentional or accidental fire | ||||||||
| Yes | 2.6 [0.4, 16.3] | 41.0 [26.8, 56.9] | 56.4 [40.6, 71.0] | |||||
| No | 3.8 [2.0, 7.3] | 45.3 [39.0, 51.8] | 50.9 [44.4, 57.3] | 0.785 | ||||
| Reflection about how you feel about fire in home | ||||||||
| High thought risk | 4.3 [2.2, 8.5] | 51.6 [44.4, 58.8] | 44.0 [37.0, 51.3] | |||||
| Low thought risk | 4.3 [1.6, 11.1] | 30.4 [21.9, 40.6] | 65.2 [54.9, 74.3] | 0.003 | ||||
| Practice home escape plan | ||||||||
| <1 year | 15.7 [8.0, 28.5] | 78.4 [65.0, 87.7] | 5.9 [1.9, 16.8] | 36.0 [33.3, 38.8] | 64.0 [61.2, 66.7] | 0 | ||
| 1 year or more | 2.5 [0.9, 6.6] | 46.5 [38.9, 54.4] | 50.9 [43.1, 58.7] | <0.001 | 16.9 [15.6, 18.3] | 83.1 [81.7, 84.4] | 0 | <0.001 |
| Living condition | ||||||||
| Own | 4.9 [2.6, 8.8] | 45.1 [38.4, 52.0] | 50.0 [43.2, 56.8] | |||||
| Rent | 3.1 [0.8, 11.6] | 38.5 [27.4, 50.8] | 58.5 [46.1, 69.8] | 0.465 | ||||
| Remoteness Index of Australia | ||||||||
| Highly accessible | 7.3 [6.2, 8.6] | 26.2 [24.3, 28.2] | 66.5 [64.3, 68.6] | |||||
| Accessible | 7.5 [6.4, 8.6] | 26.7 [24.9, 28.6] | 65.8 [63.8, 67.8] | |||||
| Moderately accessible | 8.2 [7.2, 9.3] | 28.0 [26.3, 29.7] | 63.8 [62.0, 65.6] | 0.4613 | ||||
| Remote/Very remote | 7.7 [7.1, 8.4] | 26.2 [25.1, 27.3] | 66.1 [64.9, 67.3] | |||||
| Variables | High-Risk Individuals | New South Wales (NSW) Population | ||||||||||||||
|---|---|---|---|---|---|---|---|---|---|---|---|---|---|---|---|---|
| Not Written | No Home Escape Plan | Not Written | No Home Escape Plan | |||||||||||||
| OR | 95% CI | p-Value | OR | 95% CI | p-Value | OR | 95% CI | p-Value | OR | 95% CI | p-Value | |||||
| Gender | ||||||||||||||||
| Male | 1.00 | 1.00 | 1.00 | 1.00 | ||||||||||||
| Female | 0.37 | 0.08 | 1.75 | 0.208 | 0.44 | 0.09 | 2.08 | 0.297 | 1.19 | 1.04 | 1.36 | 0.010 | 0.98 | 0.86 | 1.11 | 0.740 |
| Age (Continuous) | 0.99 | 0.96 | 1.03 | 0.785 | 0.98 | 0.94 | 1.02 | 0.270 | 1.00 | 1.00 | 1.00 | 0.980 | 1.00 | 1.00 | 1.01 | 0.035 |
| Language spoken at home | ||||||||||||||||
| English | 1.00 | 1.00 | 1.00 | 1.00 | ||||||||||||
| English plus other languages | 0.27 | 0.07 | 0.99 | 0.050 | 0.48 | 0.13 | 1.70 | 0.255 | 0.49 | 0.40 | 0.59 | <0.001 | 0.84 | 0.71 | 0.99 | 0.040 |
| Over 65 years | ||||||||||||||||
| No | 1.00 | 1.00 | 1.00 | 1.00 | ||||||||||||
| Yes | 1.46 | 0.45 | 4.79 | 0.532 | 2.00 | 0.61 | 6.54 | 0.251 | 0.92 | 0.80 | 1.07 | 0.277 | 0.93 | 0.82 | 1.07 | 0.323 |
| Current employment status | ||||||||||||||||
| Employed | 1.00 | 1.00 | 1.00 | 1.00 | ||||||||||||
| Not employed | 0.45 | 0.11 | 1.74 | 0.244 | 0.36 | 0.09 | 1.40 | 0.142 | 0.87 | 0.76 | 1.01 | 0.062 | 0.92 | 0.81 | 1.05 | 0.227 |
| Country of birth | ||||||||||||||||
| Australia | 1.00 | 1.00 | 1.00 | 1.00 | ||||||||||||
| Others | 0.23 | 0.07 | 0.82 | 0.023 | 0.40 | 0.12 | 1.35 | 0.141 | 0.60 | 0.52 | 0.69 | <0.001 | 0.92 | 0.80 | 1.05 | 0.199 |
| Educational status | ||||||||||||||||
| Uni | 1.00 | 1.00 | 1.00 | 1.00 | ||||||||||||
| TAFE | 0.71 | 0.11 | 4.60 | 0.723 | 0.42 | 0.07 | 2.71 | 0.362 | 1.11 | 0.92 | 1.34 | 0.283 | 1.03 | 0.86 | 1.22 | 0.784 |
| SC | 0.84 | 0.15 | 4.62 | 0.844 | 0.80 | 0.15 | 4.32 | 0.795 | 0.82 | 0.69 | 0.97 | 0.021 | 1.05 | 0.90 | 1.23 | 0.546 |
| Household income (before tax) | ||||||||||||||||
| <$20,000 | 1.00 | 1.00 | ||||||||||||||
| $20,000–40,000 | 1.39 | 1.10 | 1.77 | 0.006 | 1.12 | 0.90 | 1.40 | 0.303 | ||||||||
| $40,000–60,000 | 1.26 | 0.97 | 1.63 | 0.080 | 1.04 | 0.82 | 1.33 | 0.729 | ||||||||
| $60,000–80,000 | 1.44 | 1.09 | 1.90 | 0.010 | 1.23 | 0.95 | 1.59 | 0.122 | ||||||||
| >$80,000 | 1.66 | 1.34 | 2.04 | <0.001 | 1.24 | 1.02 | 1.50 | 0.034 | ||||||||
| Marital status | ||||||||||||||||
| Married | 1.00 | 1.00 | ||||||||||||||
| Widowed | 0.63 | 0.51 | 0.79 | <0.001 | 0.81 | 0.67 | 1.00 | 0.047 | ||||||||
| Separated | 0.96 | 0.78 | 1.18 | 0.704 | 1.06 | 0.87 | 1.28 | 0.580 | ||||||||
| Never married | 0.58 | 0.49 | 0.69 | <0.001 | 0.85 | 0.73 | 0.99 | 0.038 | ||||||||
| Smoking status | ||||||||||||||||
| Never | 1.00 | 1.00 | ||||||||||||||
| Ever | 1.14 | 0.98 | 1.33 | 0.098 | 1.10 | 0.95 | 1.27 | 0.207 | ||||||||
| Now | 0.86 | 0.69 | 1.06 | 0.155 | 1.00 | 0.83 | 1.22 | 0.962 | ||||||||
| Insurance | ||||||||||||||||
| No | 1.00 | 1.00 | 1.00 | 1.00 | ||||||||||||
| Yes | 1.08 | 0.32 | 3.59 | 0.902 | 0.81 | 0.25 | 2.68 | 0.732 | 1.30 | 1.14 | 1.49 | <0.001 | 1.05 | 0.93 | 1.20 | 0.404 |
| Smoke alarm installation | ||||||||||||||||
| Battery | 1.00 | 1.00 | ||||||||||||||
| Hardwire | 0.80 | 0.68 | 0.94 | 0.008 | 0.67 | 0.58 | 0.79 | <0.001 | ||||||||
| Both | 1.02 | 0.85 | 1.24 | 0.808 | 0.64 | 0.53 | 0.77 | <0.001 | ||||||||
| Last tested smoke alarm | ||||||||||||||||
| Less than 6 months | 1.00 | 1.00 | 1.00 | 1.00 | ||||||||||||
| 6 months or over | 2.03 | 0.60 | 6.85 | 0.253 | 3.16 | 0.93 | 10.74 | 0.065 | 1.18 | 1.02 | 1.36 | 0.027 | 1.88 | 1.65 | 2.16 | <0.001 |
| Attitude towards fires | ||||||||||||||||
| Rating household related fire risk | ||||||||||||||||
| Low-risk | 1.00 | 1.00 | ||||||||||||||
| High-risk | 0.70 | 0.21 | 2.34 | 0.565 | 0.58 | 0.17 | 1.91 | 0.367 | ||||||||
| Fire awareness | ||||||||||||||||
| Time have before whole room is on fire | ||||||||||||||||
| <5 min | 1.00 | 1.00 | ||||||||||||||
| 5–15 min | 1.30 | 0.33 | 5.18 | 0.712 | 0.81 | 0.20 | 3.27 | 0.772 | ||||||||
| Experienced unintentional or accidental fire | ||||||||||||||||
| Yes | 1.00 | 1.00 | ||||||||||||||
| No | 0.74 | 0.09 | 6.21 | 0.778 | 0.60 | 0.07 | 4.98 | 0.637 | ||||||||
| Reflection about how you feel about fire in home | ||||||||||||||||
| High thought risk | 1.00 | 1.00 | ||||||||||||||
| Low thought risk | 0.59 | 0.17 | 2.10 | 0.415 | 1.48 | 0.43 | 5.15 | 0.536 | ||||||||
| Practice home escape plan | ||||||||||||||||
| <1 year | 1.00 | 1.00 | ||||||||||||||
| 1 year or more | 3.70 | 1.05 | 13.05 | 0.042 | 54.00 | 10.23 | 285.10 | <0.001 | ||||||||
| Living condition | ||||||||||||||||
| Own | 1.00 | 1.00 | ||||||||||||||
| Rent | 1.34 | 0.28 | 6.53 | 0.714 | 1.84 | 0.39 | 8.81 | 0.443 | ||||||||
| Remoteness Index of Australia | ||||||||||||||||
| Highly accessible | 1.00 | 1.00 | ||||||||||||||
| Accessible | 0.93 | 0.73 | 1.19 | 0.566 | 0.91 | 0.72 | 1.14 | 0.395 | ||||||||
| Moderately accessible | 0.85 | 0.68 | 1.06 | 0.159 | 0.77 | 0.62 | 0.95 | 0.015 | ||||||||
| Remote/Very remote | 0.85 | 0.69 | 1.04 | 0.107 | 0.84 | 0.70 | 1.02 | 0.076 | ||||||||
| Variables | High-Risk Individuals | New South Wales (NSW) Population | ||||||||||||||
|---|---|---|---|---|---|---|---|---|---|---|---|---|---|---|---|---|
| Not Written | No Home Escape Plan | Not Written | No Home Escape Plan | |||||||||||||
| OR | 95% CI | p-Value | OR | 95% CI | p-Value | OR | 95% CI | p-Value | OR | 95 %CI | p-Value | |||||
| Language spoken at home | ||||||||||||||||
| English | 1.00 | 1.00 | 1.00 | 1.00 | ||||||||||||
| English plus other languages | 0.24 | 0.07 | 0.89 | 0.033 | 0.50 | 0.12 | 2.01 | 0.329 | 0.44 | 0.34 | 0.56 | <0.001 | 0.62 | 0.50 | 0.77 | <0.001 |
| Gender | ||||||||||||||||
| Male | 1.00 | 1.00 | ||||||||||||||
| Female | 1.36 | 1.14 | 1.62 | 0.001 | 0.99 | 0.84 | 1.16 | 0.866 | ||||||||
| Marital status | ||||||||||||||||
| Married | 1.00 | 1.00 | ||||||||||||||
| Widowed | 0.68 | 0.50 | 0.91 | 0.010 | 0.78 | 0.59 | 1.03 | 0.084 | ||||||||
| Separated | 0.96 | 0.74 | 1.24 | 0.736 | 1.02 | 0.80 | 1.31 | 0.857 | ||||||||
| Never married | 0.56 | 0.45 | 0.70 | <0.001 | 0.74 | 0.60 | 0.90 | 0.003 | ||||||||
| Household income (before tax) | ||||||||||||||||
| <$20,000 | 1.00 | 1.00 | ||||||||||||||
| $20,000–40,000 | 1.29 | 0.99 | 1.69 | 0.058 | 1.12 | 0.87 | 1.43 | 0.383 | ||||||||
| $40,000–60,000 | 1.16 | 0.86 | 1.57 | 0.326 | 1.09 | 0.83 | 1.45 | 0.530 | ||||||||
| $60,000–80,000 | 1.38 | 0.99 | 1.93 | 0.056 | 1.28 | 0.93 | 1.74 | 0.125 | ||||||||
| >$80,000 | 1.46 | 1.12 | 1.89 | 0.005 | 1.30 | 1.02 | 1.66 | 0.036 | ||||||||
| Smoke alarm installation | ||||||||||||||||
| Battery | 1.00 | 1.00 | ||||||||||||||
| Hardwire | 0.71 | 0.58 | 0.88 | 0.001 | 0.60 | 0.49 | 0.73 | <0.001 | ||||||||
| Both | 0.87 | 0.68 | 1.10 | 0.252 | 0.57 | 0.45 | 0.71 | <0.001 | ||||||||
| Last tested smoke alarm | ||||||||||||||||
| Less than 6 months | 1.00 | 1.00 | ||||||||||||||
| 6 months or over | 1.27 | 1.05 | 1.55 | 0.016 | 1.90 | 1.58 | 2.28 | <0.001 | ||||||||
© 2018 by the authors. Licensee MDPI, Basel, Switzerland. This article is an open access article distributed under the terms and conditions of the Creative Commons Attribution (CC BY) license (http://creativecommons.org/licenses/by/4.0/).
Share and Cite
Tannous, W.K.; Agho, K.E. Factors Associated with Home Fire Escape Plans in New South Wales: Multinomial Analysis of High-Risk Individuals and New South Wales Population. Int. J. Environ. Res. Public Health 2018, 15, 2353. https://doi.org/10.3390/ijerph15112353
Tannous WK, Agho KE. Factors Associated with Home Fire Escape Plans in New South Wales: Multinomial Analysis of High-Risk Individuals and New South Wales Population. International Journal of Environmental Research and Public Health. 2018; 15(11):2353. https://doi.org/10.3390/ijerph15112353
Chicago/Turabian StyleTannous, W. Kathy, and Kingsley E. Agho. 2018. "Factors Associated with Home Fire Escape Plans in New South Wales: Multinomial Analysis of High-Risk Individuals and New South Wales Population" International Journal of Environmental Research and Public Health 15, no. 11: 2353. https://doi.org/10.3390/ijerph15112353
APA StyleTannous, W. K., & Agho, K. E. (2018). Factors Associated with Home Fire Escape Plans in New South Wales: Multinomial Analysis of High-Risk Individuals and New South Wales Population. International Journal of Environmental Research and Public Health, 15(11), 2353. https://doi.org/10.3390/ijerph15112353