Article

Effects of Weir Construction on Phytoplankton Assemblages and Water Quality in a Large River System

1
Nakdong River Environment Research Center, National Institute of Environmental Research, Goryeong 40103, Korea
2
Geum River Environment Research Center, National Institute of Environmental Research, Okcheon 29027, Korea
*
Author to whom correspondence should be addressed.
Int. J. Environ. Res. Public Health 2018, 15(11), 2348; https://doi.org/10.3390/ijerph15112348
Submission received: 3 September 2018 / Revised: 19 October 2018 / Accepted: 22 October 2018 / Published: 24 October 2018

Abstract

:
Flow regulation is one of the most common anthropogenic factors affecting rivers worldwide. In Korea, 16 weirs were constructed along four major rivers from 2009 to 2012. This study aimed to elucidate initial changes in physical, chemical, and biological variables after the construction of consecutive weirs on the Nakdong River, a major large river system. Water quality variables and phytoplankton cell densities were investigated at eight representative sites and compared with the data recorded before the weir construction. There were spatial and temporal changes in the hydraulic retention time (HRT), total phosphorus (TP), and chlorophyll a concentrations among the eight weir sections. HRT increased after the weir construction, while TP and chlorophyll a tended to decrease from the middle to lower section of the Nakdong River. Furthermore, differences were observed in the phytoplankton community composition between 2006–2007 and 2013. There was a marginal decrease in the duration of centric diatom (Stephanodiscus hantzschii) blooms after weir construction. However, Microcystis aeruginosa proliferated more extensively during summer and autumn than it did before the weir construction. Our results suggest that changes in hydrological factors, in response to consecutive weir construction, may contribute to greater physical, chemical, and ecological variability.

1. Introduction

The ecological effects of hydrological changes, including the water level, river flow, water velocity, and hydraulic retention time (HRT), on aquatic ecosystems have often been studied. Hydrological changes alter the physical, chemical, and biological characteristics of a river [1,2,3,4,5] and cause habitat fragmentation within rivers, as well as changes in nutrient cycling and primary productivity [6]. Phytoplankton is a source of food and energy for organisms at higher trophic levels within an aquatic ecosystem [7,8], and phytoplankton composition usually changes with seasonal fluctuations in water temperature [9]. The phytoplankton species composition and biomass depend, in a complex manner, on various environmental factors, including the concentration of nutrients (nitrogen and phosphorus) derived from watersheds, light, water temperature, flow, turbidity, and HRT [10,11,12,13,14,15,16].
Since the early 1990s, water quality has deteriorated in the Nakdong River, the second largest river in South Korea, resulting in problems of its use as a source of drinking water, especially downstream. Harmful cyanobacterial (Microcystis aeruginosa) blooms from summer to autumn (June to September) and small centric diatom (Stephanodiscus hantzschii) blooms from late -autumn to next spring (November to April) are mostly responsible for the deterioration in water quality [17,18,19].
However, significant changes in hydrodynamic conditions have occurred recently in the Nakdong River. Eight artificial weirs were constructed over a stretch of approximately 200 km on the mainstream of the Nakdong River from 2009 to 2012. After the weir construction, the water level and storage capacity of the system have increased, affecting not only the physical and chemical environment of the water, including dilution and accumulation of nutrients, but also the structure of phytoplankton communities [1,4,5]. Studies have shown that drastic changes in the hydrodynamic conditions alter water quality variables and the ecosystem [4,20,21]. However, it has not been elucidated how physical changes in a large river system, with consecutive weirs, affect chemical and biological parameters, such as the water quality and phytoplankton distribution.
The present study was based on the following hypotheses: (1) the physical and chemical environmental conditions in the Nakdong River would be affected, both spatially and temporally, by changes in its hydraulics, due to the construction of consecutive weirs, and (2) the phytoplankton community composition and cyanobacterial cell density would vary spatially and temporally, depending on the hydraulics in a weir section. Based on these hypotheses, we compared and analyzed environmental variables and the phytoplankton composition before and after the construction of weirs on the Nakdong River.

2. Materials and Methods

2.1. Study Area and Sampling Sites

The Nakdong River, which originates from Hwangji Pond in Mount Taebaek, is the longest river in South Korea, with its length equal to 510 km. The river crosses the middle-eastern part of South Korea, covering a watershed area of 23,384 km2, and flows to the south through the Nakdong Estuary. The Nakdong River has been an important source of drinking, industrial, and agricultural water in the watershed area along the river. Since August 2012, a total of eight weirs (Sangju, Nakdan, Gumi, Chilgok, Gangjeong-Goryeong, Dalseong, Hapcheon-Changnyeong, and Changnyeong-Haman) have been constructed over a stretch of approximately 200 km (Table 1 and Figure 1). The water level between these weirs is maintained by controlling the weir gates. To assess the water quality variables and phytoplankton composition, surface water samples were collected 500 m upstream of each of the eight weirs once a week from January to December 2013. The temperature, pH, dissolved oxygen, and electrical conductivity of the water were measured in situ using a portable water quality meter (YSI 556 MPS; YSI, Yellow Springs, OH, USA) at each sampling site. To analyze chemical quality parameters, water samples were collected in clean polyethylene bottles and immediately transported to the laboratory on ice. To analyze the phytoplankton density, surface water samples were collected from the same sites and preserved by adding 0.3% Lugol’s solution. To compare water quality parameters at all stations (St.), from Sangju (St. 1) to Changnyeong-Haman (St. 8), before and after the construction of the weirs, previous data (2006–2007) on organic matter, including biochemical oxygen demand (BOD5) and chemical oxygen demand (CODMn), nutrients, including total nitrogen (TN), nitrate nitrogen (NO3-N), ammonia nitrogen (NH4+-N), total phosphorus (TP), and phosphate phosphorus (PO43−-P), and chlorophyll a (Chl-a) were obtained from the Water Information System (http://water.nier.go.kr) of the Korean Government. Phytoplankton monitoring data from 2006 to 2007 [22] were used to compare the temporal distribution of phytoplankton in the area of the Dalseong weir (located in the middle of the Nakdong River) with that in the areas of the Goryeong and Changnyeong-Haman weirs (located downstream of Namji) (Figure 1). Monthly air temperature and rainfall data, provided by the regional observation stations at Sangju, Gumi, Daegu, Hapcheon, and Milyang, which are the nearest stations to the eight weirs on the Nakdong River, were obtained from the Korea Meteorological Administration website (http://web.kma.go.kr).

2.2. Physical and Chemical Variables and Phytoplankton Density

HRT was calculated using discharge rates and the volume provided by K-water (http://kwater.or.kr). BOD5 was measured by standard methods [23], and CODMn was analyzed by estimating the consumption of potassium permanganate. Chl-a was analyzed using a spectrophotometer (Lambda 45; PerkinElmer, Waltham, MA, USA), for which the water samples were filtered through Whatman GF-F filters and extracted with 90% acetone for 24 h [23]. TN and TP contents were analyzed using an autoanalyzer (INTEGRAL Futura; Ams Alliance, Frépillon, France). The NO3-N content was analyzed using ion chromatography (850 Professional IC; Metrohm, Switzerland). Concentrations of NH4+-N and PO43−-P were determined with an ion analyzer (Smartchem 140; Ams Alliance, Frépillon, France). Phytoplankton samples were identified to the genus or species level following John et al. [24] and Komárek and Anagnostidis [25,26]. For quantitative analysis, 1 mL of a sample was added to and allowed to settle in a Sedgwick–Rafter counting chamber, followed by examination under an optical microscope (Imager M1; Carl Zeiss, Oberkochen, Germany) at a 200× to 400× magnification to calculate the cell density per milliliter.

2.3. Data Analysis

Environmental variables were analyzed by the paired t-test using the SPSS 12.0 software (SPSS Inc., Chicago, IL, USA) to determine significance of differences between values recorded before (monthly mean data from January to December 2006 and 2007) and after (January to December 2013) the weir construction. A p-value of <0.05 was considered significant in all comparisons. Redundancy analysis (RDA) ordination was performed using the CANOCO software version 5.0 [27] to elucidate the relationships between environmental variables and dominant phytoplankton species after the weir construction at representative sites between the Sangju and Changnyeong-Haman weirs.

3. Results

3.1. Atmospheric, Hydraulic, and Hydrological Conditions in the Weir Section

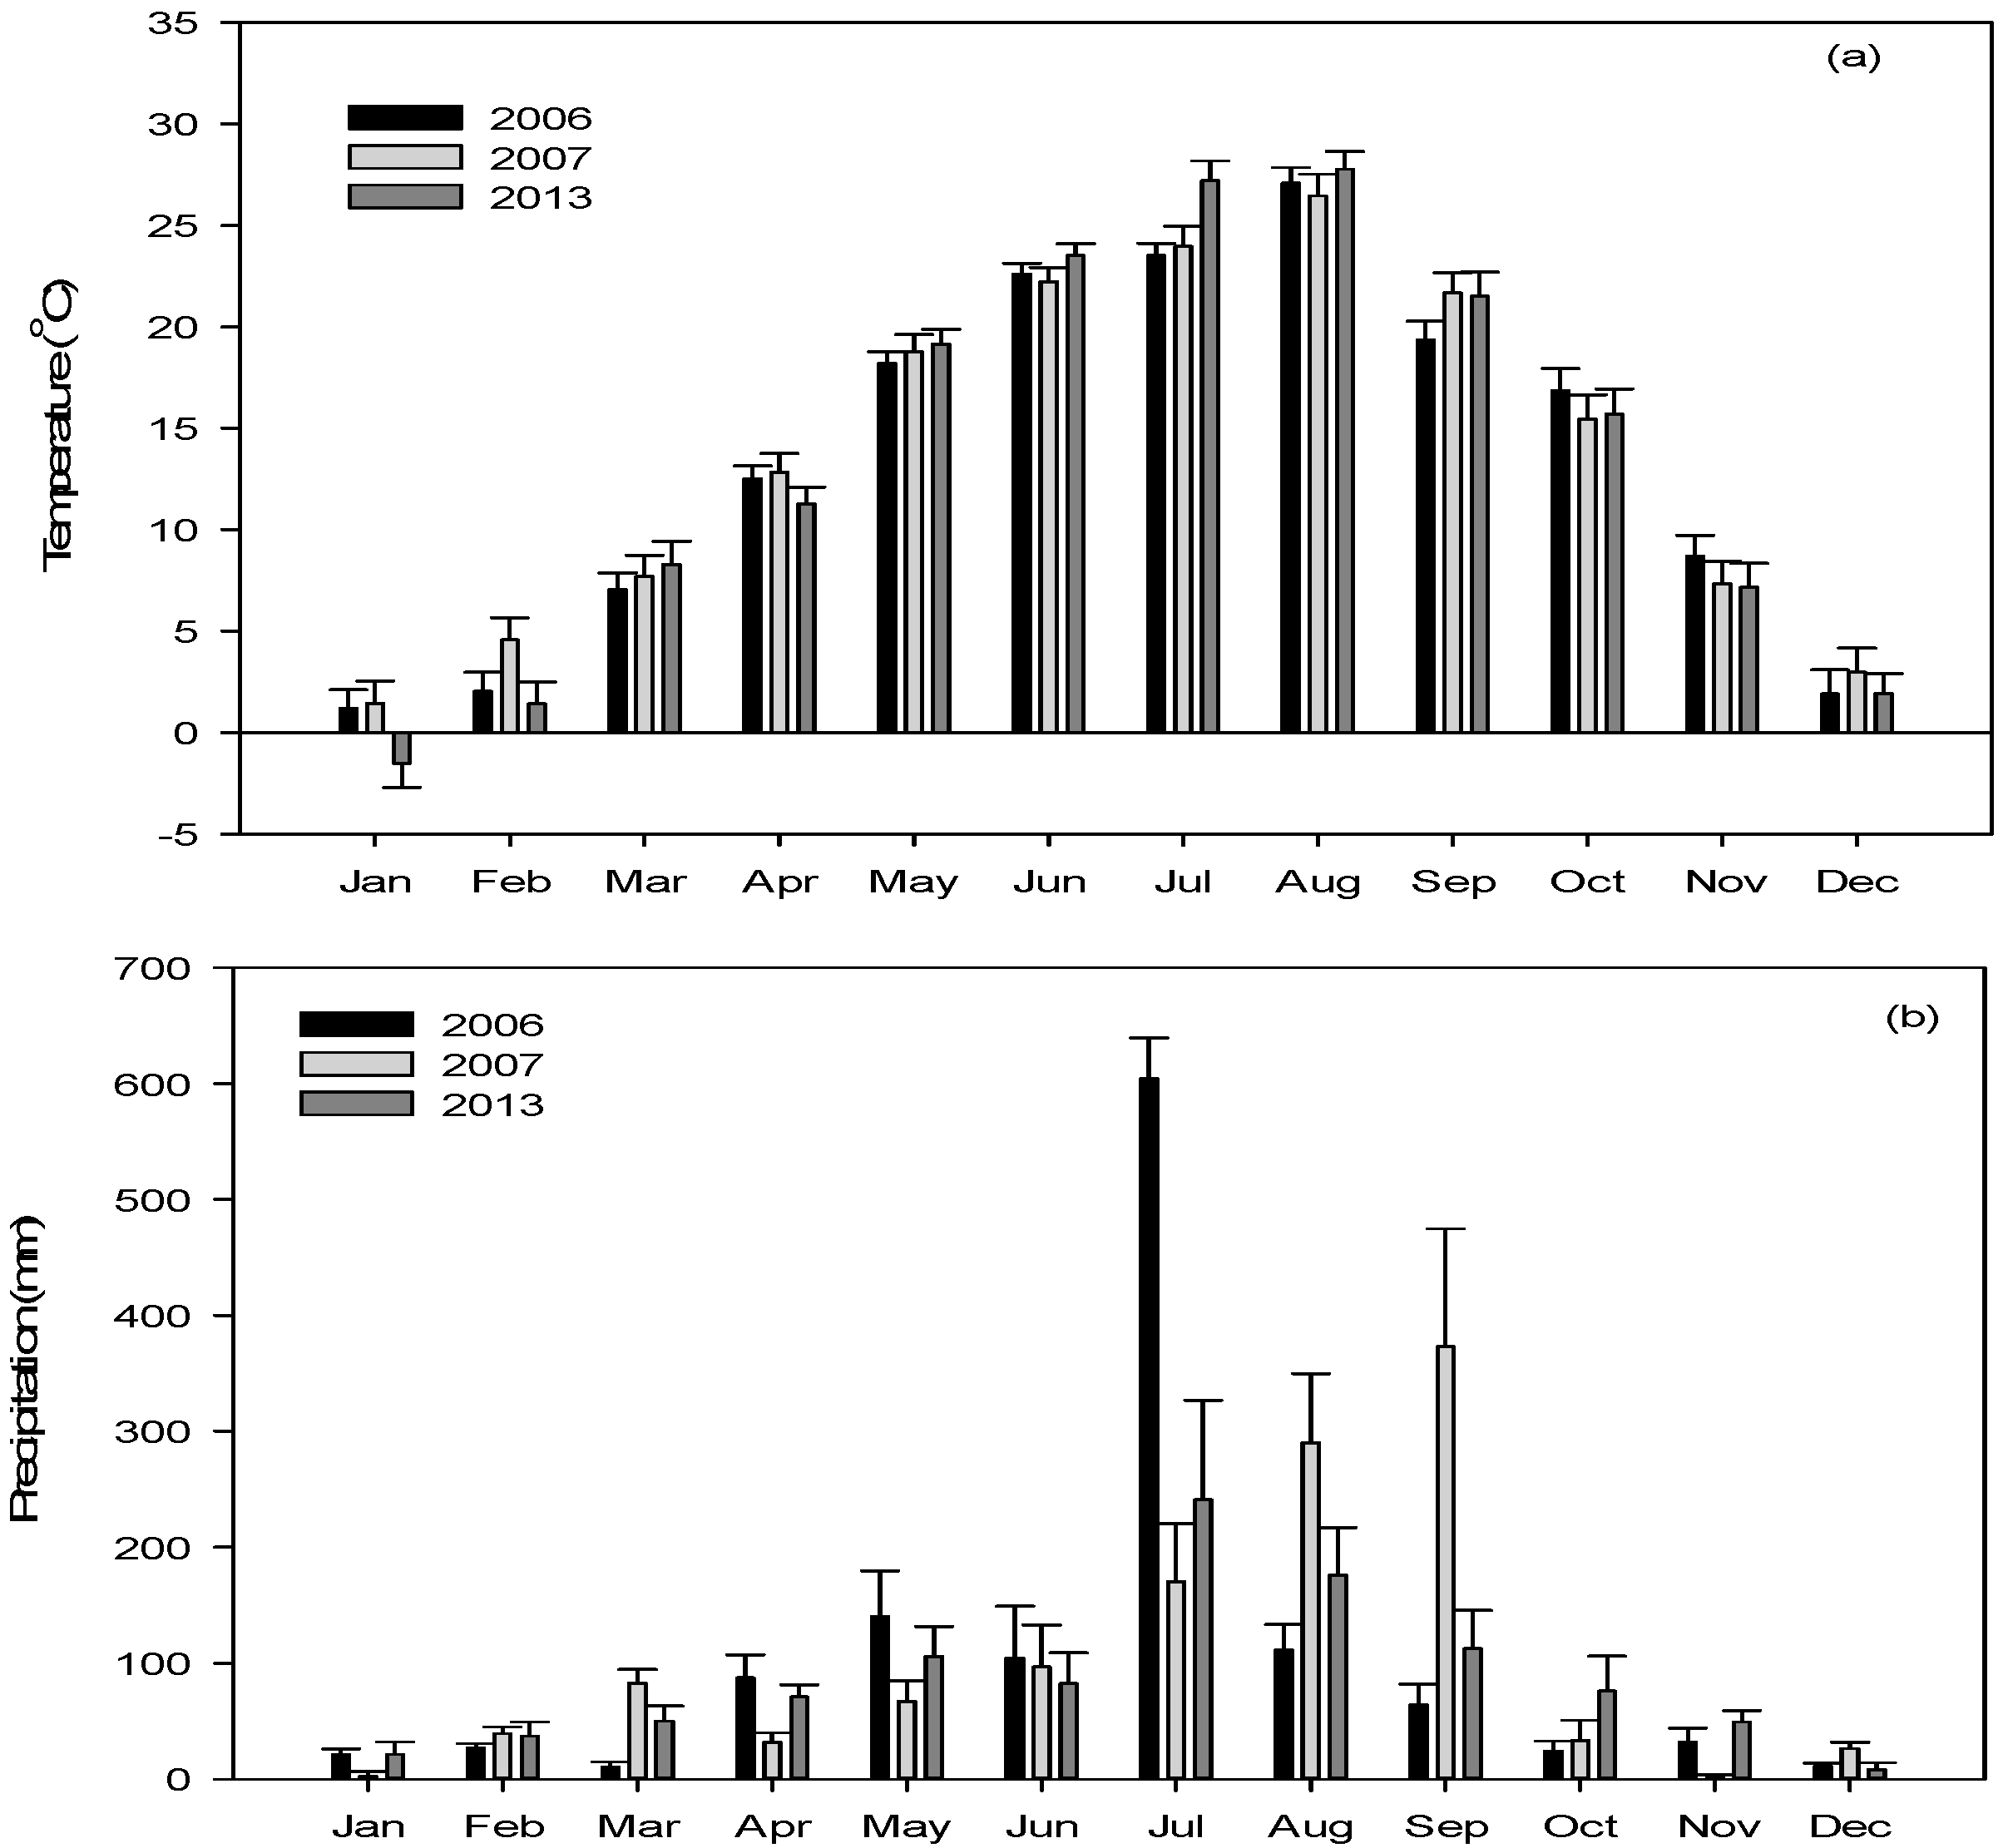
The mean monthly air temperatures in the Nakdong River weir section ranged from −1.5 to 27.8 °C, and the average annual air temperature was 13.6 °C during the study period from January to December 2013 (Figure 2a). The annual precipitation from January to December 2013 was 1031 mm, thus showing a 16% decrease compared with the mean data obtained during the same period from 2006 to 2007 (1227 mm). The precipitation in July 2013 (241 mm) was the highest monthly record (Figure 2b).
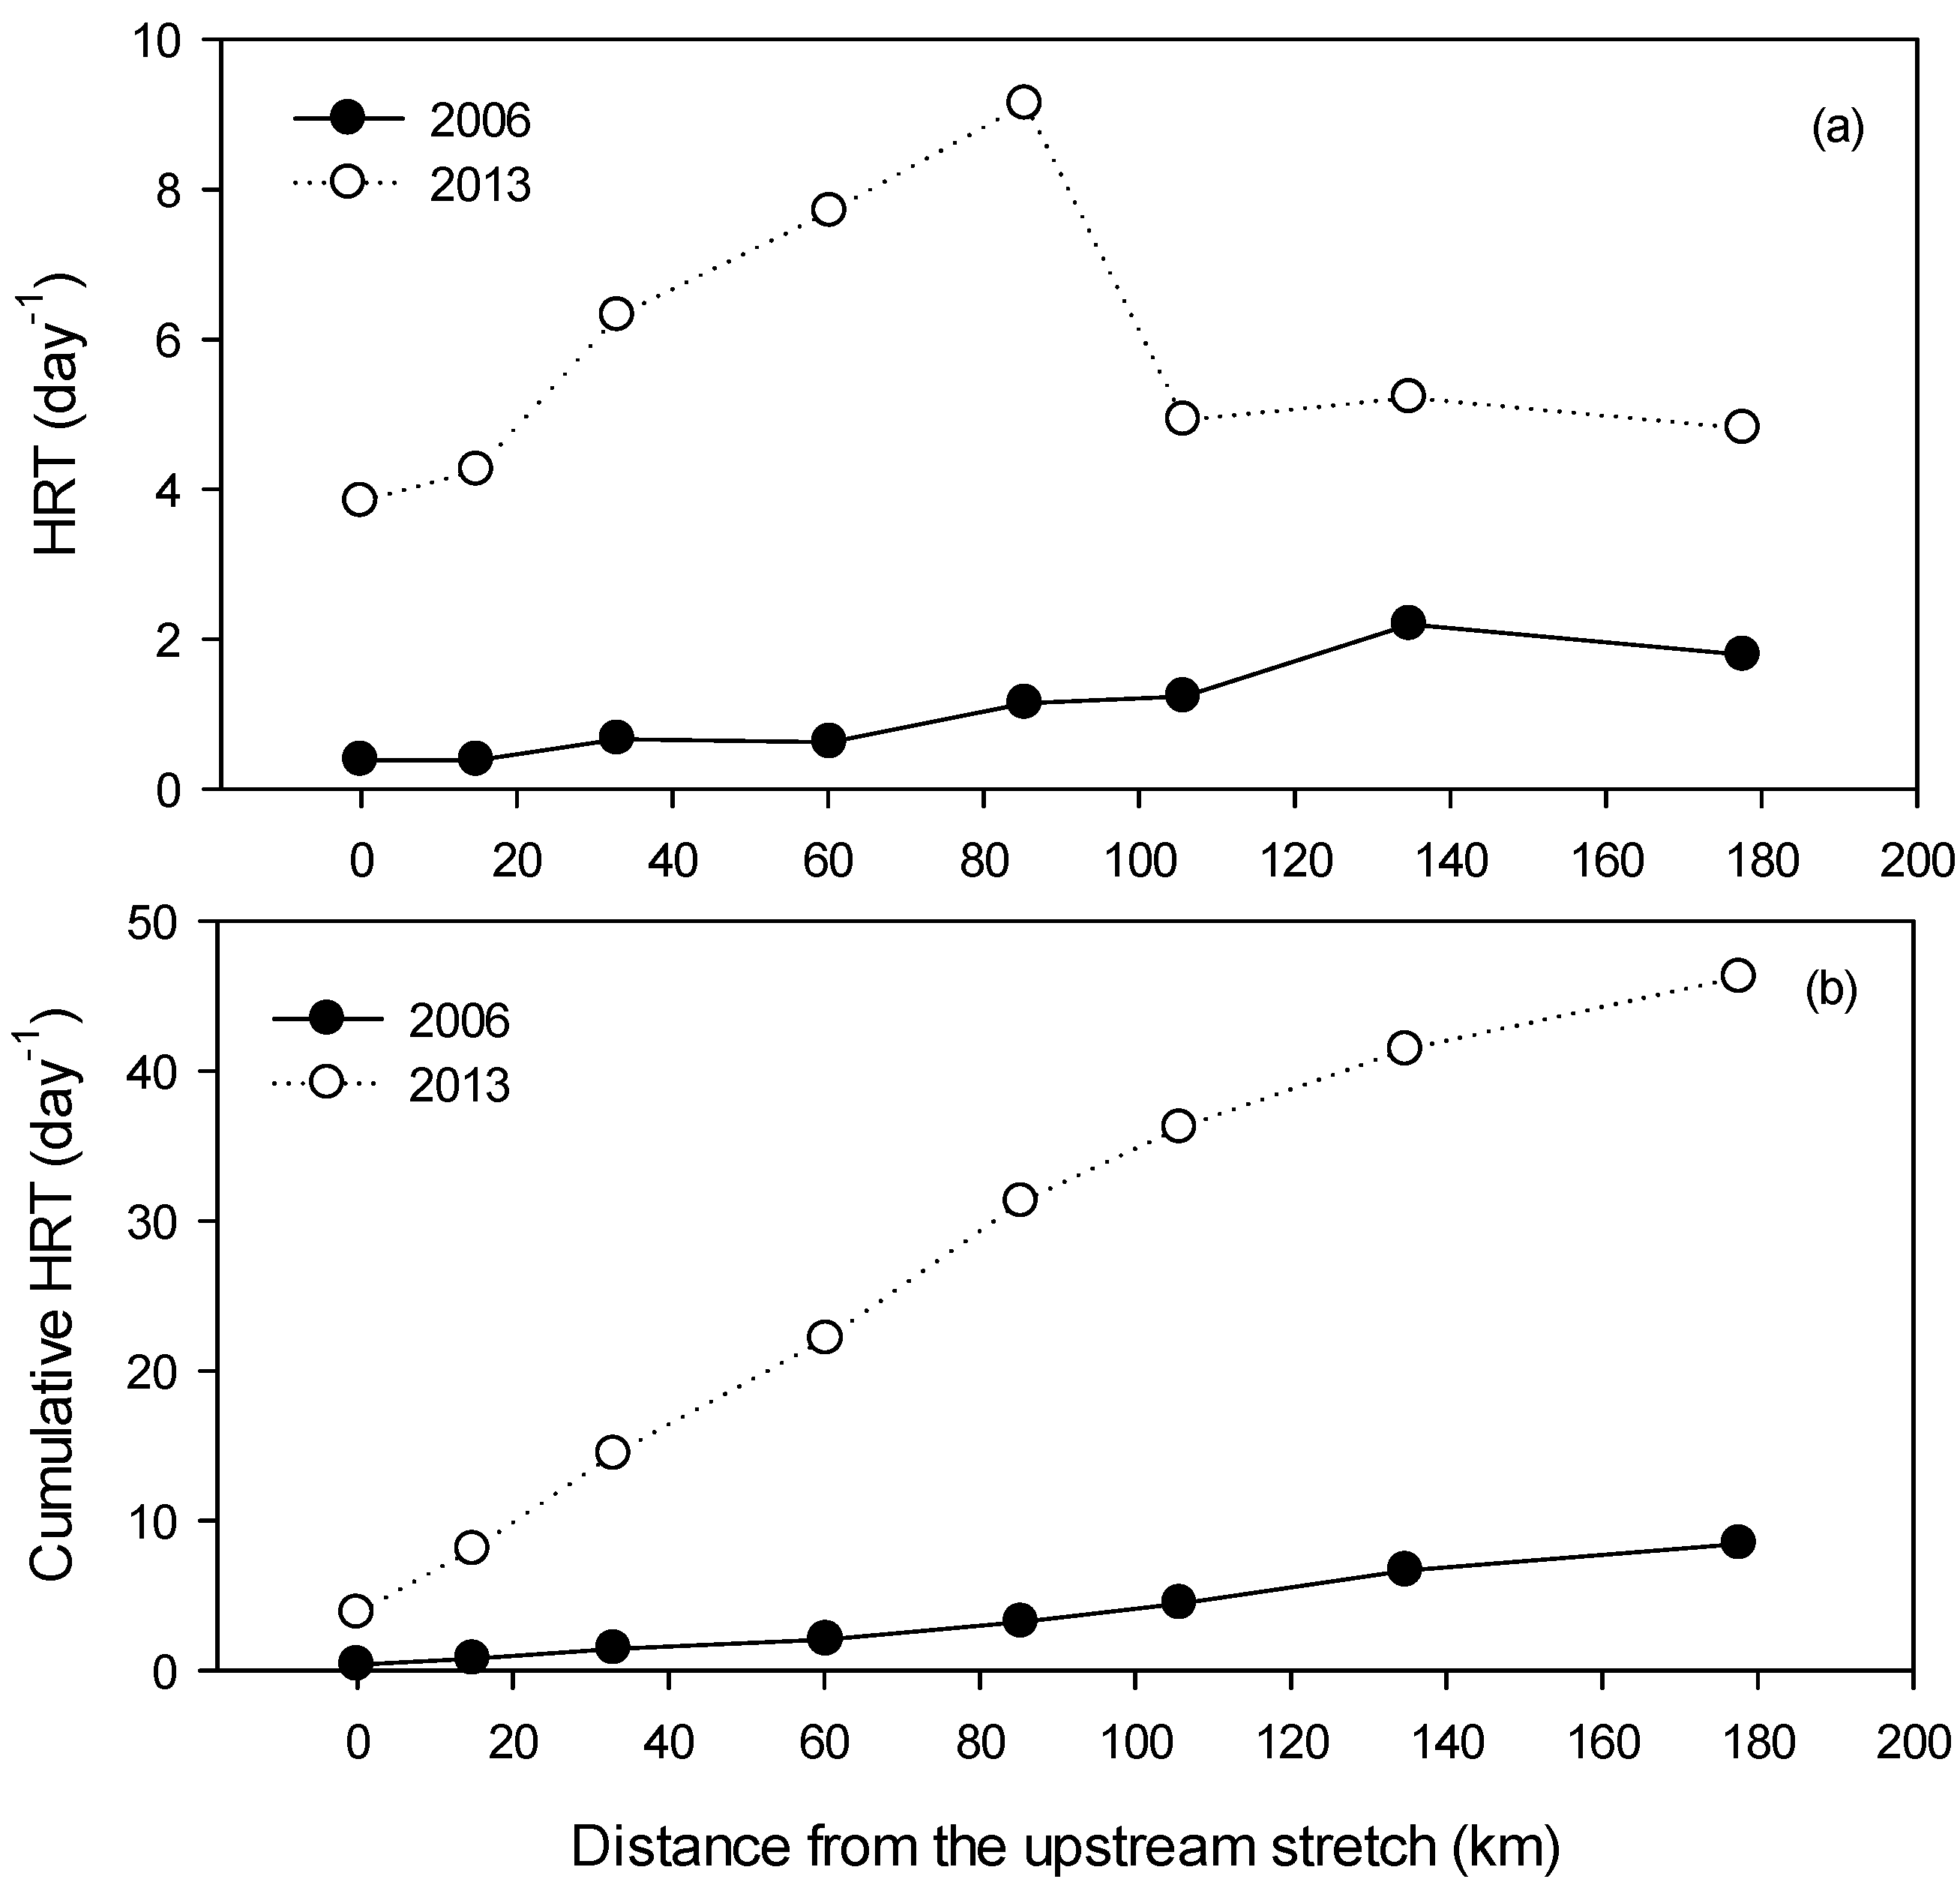
The investigation of hydraulic and hydrological characteristics at the study sites during the study periods after the weir construction revealed that HRT in the Nakdong River was regulated by precipitation and the amount of outflow through regulation of weir gates. The HRT values in the Nakdong River increased 2- to 12-fold (Figure 3a) after the construction of the Hapcheon-Changnyeong and Chilgok weirs respectively, compared to the HRTs of before the weir construction in 2006 [28]. Furthermore, the cumulative HRT between St. 1, located upstream, and St. 8, located downstream, was 46.2 days after the weir construction, i.e., five times longer than that before the construction (Figure 3b).

3.2. Variations in Physical and Chemical Parameters

During 2006–2007, before the construction of the eight weirs, the mean BOD5 concentrations ranged between 0.8 and 2.8 mg·L−1 at the study sites along the Nakdong River. The annual mean BOD5 concentration for the upstream stretch, from St. 1 to St. 4, was 1.0 mg·L−1. In the middle to lower sections of the Nakdong River, which are represented by the stretch between St. 5 and St. 8, the annual mean BOD5 concentration was 2.6 mg·L−1, indicating that organic pollution increased from the upstream to downstream areas. In 2013, after the weir construction, the annual mean BOD5 concentrations ranged from 1.9 to 2.5 mg·L−1 at the weir sites. In the upstream stretch, from St. 1 to St. 4, the average value was 2.3 mg·L−1, which indicated that organic pollution levels increased after the weir construction (p < 0.05). By contrast, in the middle to lower parts of the river, from St. 5 to St. 8, the annual mean BOD5 concentration was 2.4 mg·L−1, which was lower than that before the construction, but there were no statistically significant differences (p > 0.05). These results showed that the organic pollution levels were different in each stretch of the Nakdong River after the weir construction (Table 2).
The annual mean CODMn concentration in the Nakdong River during 2006–2007, before the weir construction, was 4.6 mg·L−1; the values were 3.5 mg·L−1 in the upstream stretch, from St. 1 to St. 4, and 5.8 mg·L−1 in the middle to lower stretch, between St. 5 and St. 8. In 2013, after the weir construction, the CODMn concentration increased in the upstream stretch between St. 1 and St. 4 (p < 0.01) but did not significantly change in the downstream stretch (Table 2). The annual mean TP concentrations ranged between 0.047 and 0.200 mg·L−1 at the eight sites during 2006–2007 and were usually high in the middle and downstream stretch of the Nakdong River, except St. 5 (Table 2). However, after the weir construction, the annual TP concentrations ranged between 0.044 and 0.075 mg·L−1 at the weir sites. The middle to lower sections of the Nakdong River, represented by the stretch between St. 4 and St. 8, exhibited a significant decrease in TP concentrations (p < 0.05) (Table 2). The annual mean TN concentrations at the eight sites ranged between 2.457 and 4.045 mg·L−1 during 2006–2007. After the weir construction, the TN concentrations at the sites ranged from 2.506 to 3.699 mg·L−1, showing spatial differences after the construction of the weirs.
The annual mean Chl-a concentrations at the study sites ranged from 7.7 to 58.7 mg·m−3 in 2006 and 2007, before the weir construction, and from 18.6 to 32.7 mg·m−3 in 2013, after the weir construction. In the upper stretch, including St. 1, St. 2, and St. 3, the concentration of Chl-a increased after the weir construction (p < 0.05); however, it decreased by approximately 50% in the downstream stretch, at St. 7 and St. 8 (p < 0.05), after the weir construction (Table 2).
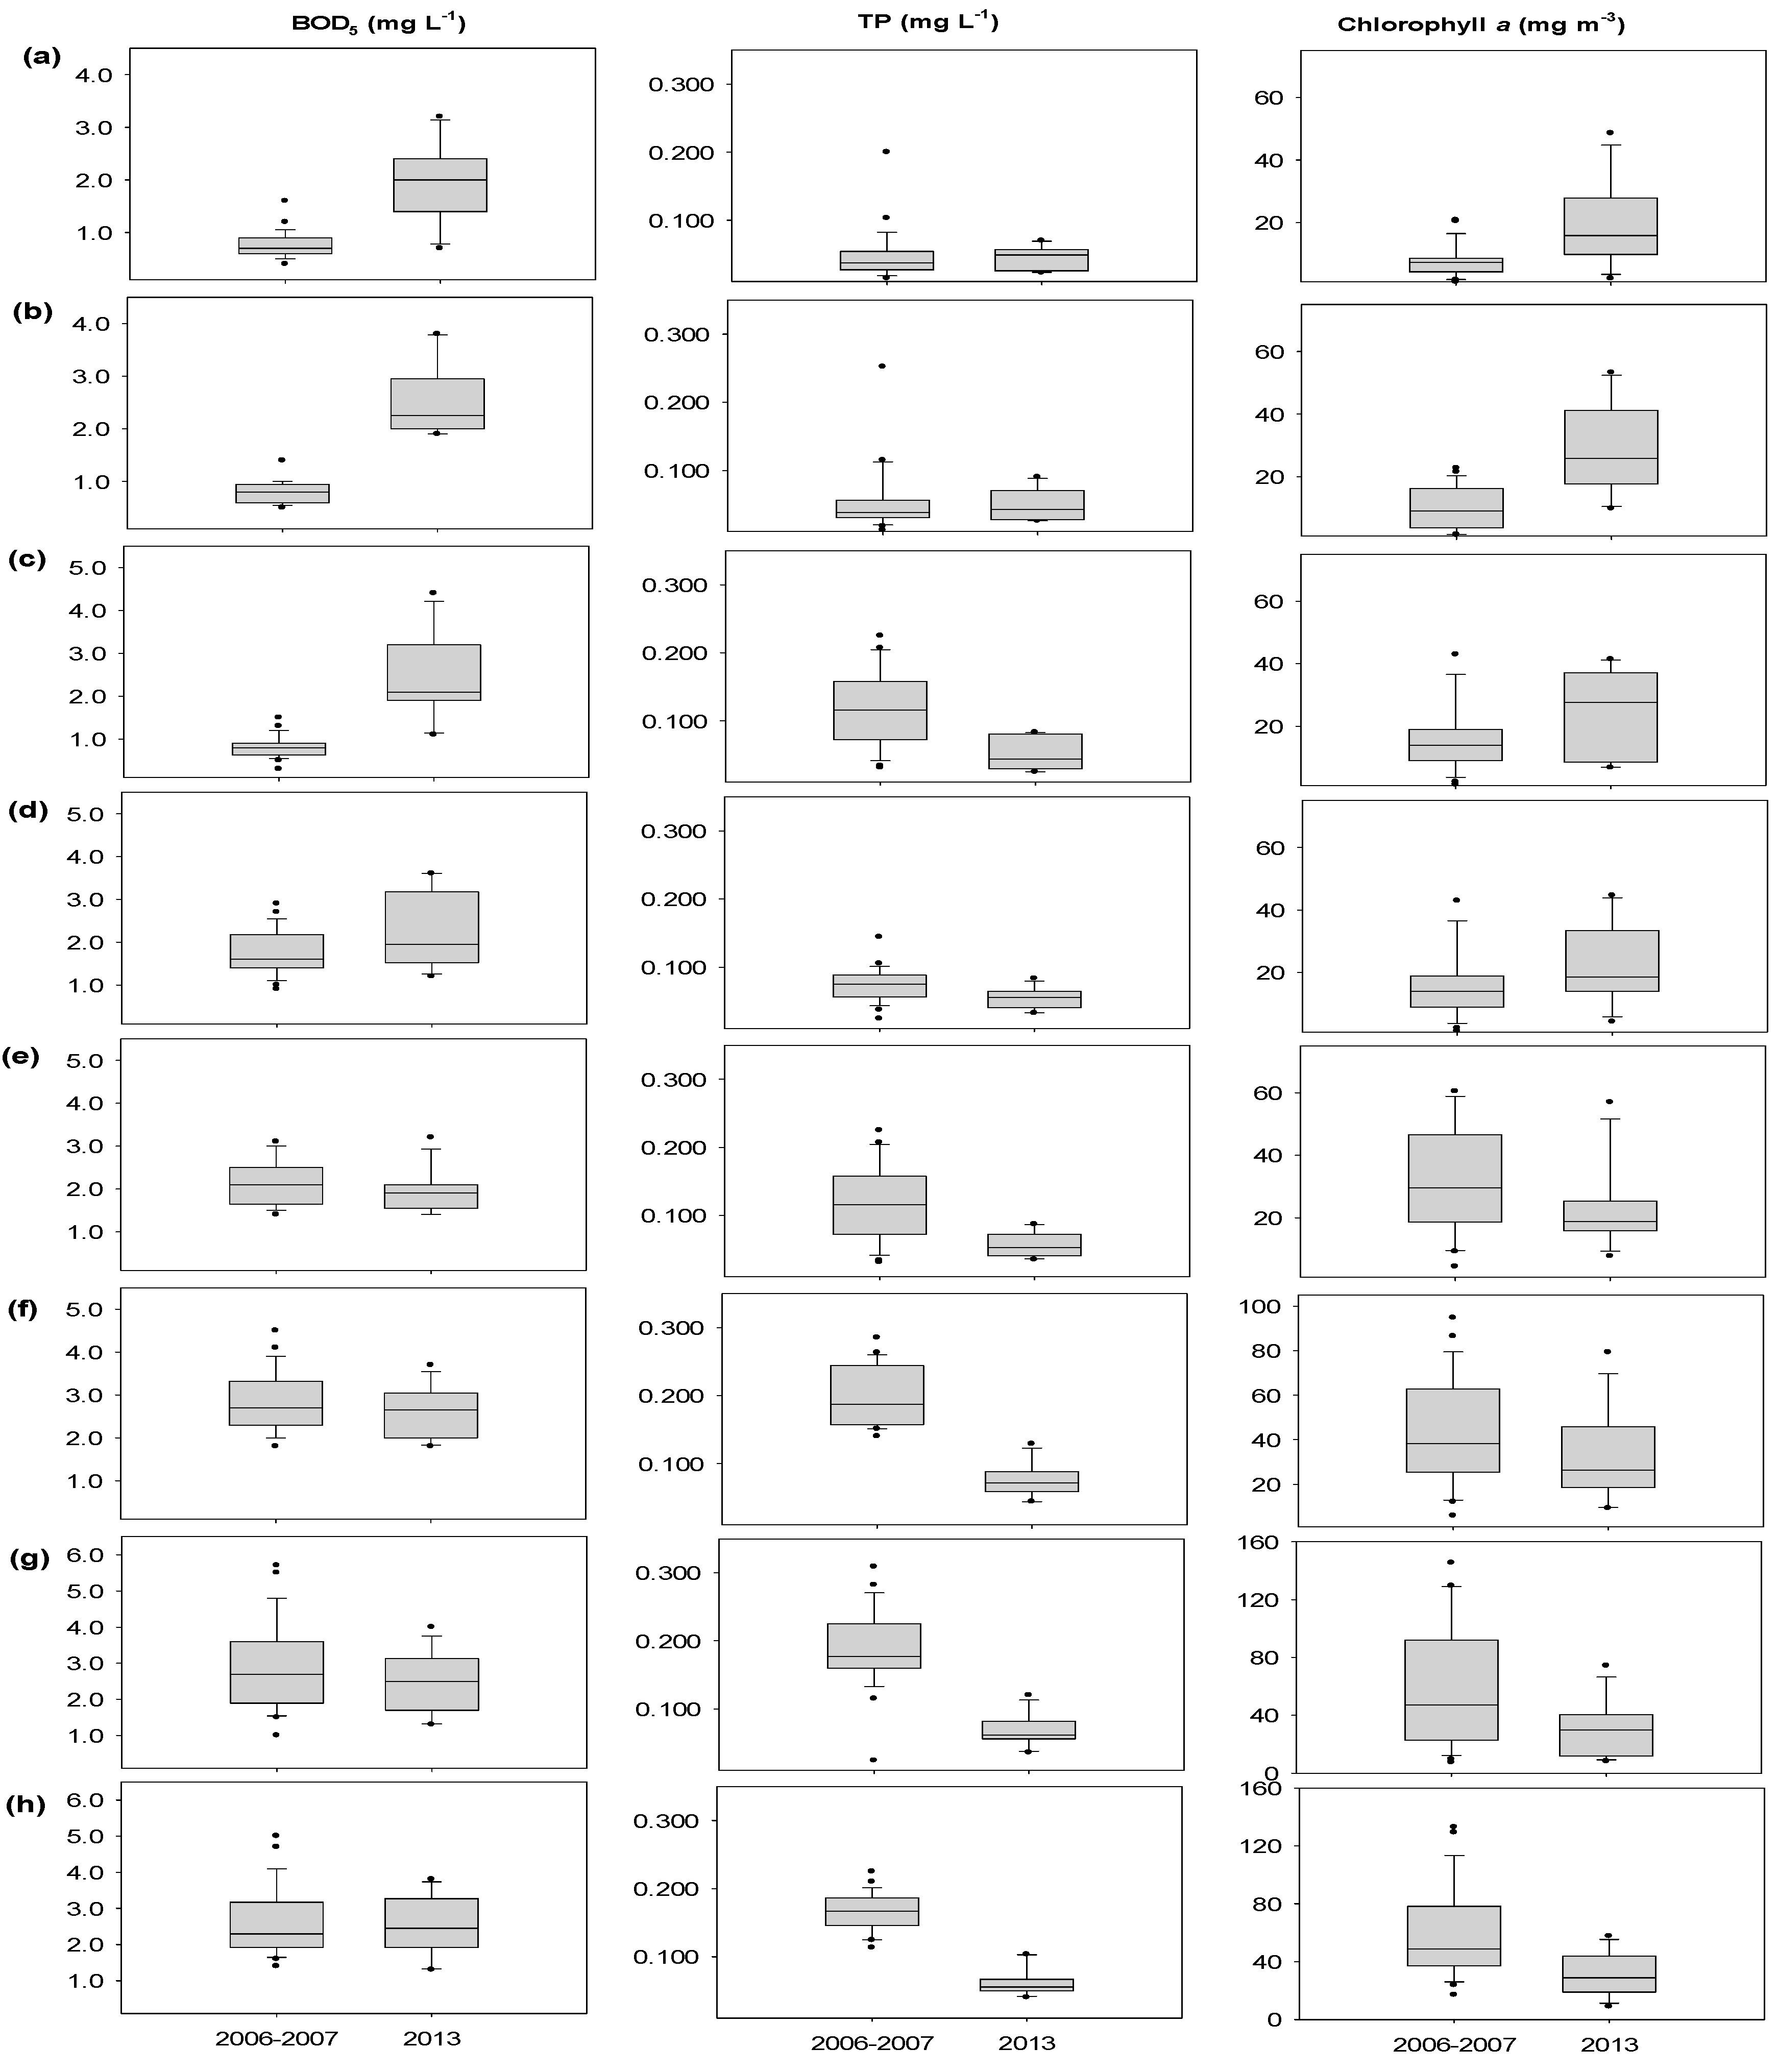
The box plots of BOD5, TP, and Chl-a concentrations, shown in Figure 4, present differences in the water quality variables at the eight study sites, detected by paired t-test analysis. Comparison of the data obtained before and after the weir construction showed significant increases in the mean BOD5 (p < 0.001) and Chl-a concentrations (p < 0.05) in the upper stretch, St. 1, St. 2, and St. 3 (Figure 4a–c). Considerable spatial and temporal differences were detected in the TP concentrations from St. 4 to St. 8. after the construction of the eight weirs (p < 0.05), (Figure 4d–h). Lower Chl-a concentrations were also observed at the downstream weir sites, St. 7 and St. 8, in 2013 (p < 0.05).

3.3. Variations in Phytoplankton Density

During 2006–2007, before the weir construction, diatoms dominated the study sites, including Goryeong and Namji in the middle and downstream sections of the Nakdong River, in winter and spring. Small numbers of green algae and cyanobacteria occasionally appeared during this period. The dominant species in the Nakdong River were the centric diatom Stephanodiscus hantzschii and the colonial cyanobacterium Microcystis aeruginosa from winter to the following spring and from summer to fall, respectively (Figure 5).
In 2013, after the weir construction, the diatom S. hantzschii also dominated from fall to the following spring (November to April); however, the cyanobacterium M. aeruginosa proliferated to a greater extent during summer and fall (June to September). The phytoplankton cell densities ranged from 8.4 × 10³ to 17.5 × 10³ cells·mL−1 in the upstream stretch, between the Sangju and Chilgok weirs, and from 10.2 × 10³ to 15.8 × 10³ cells·mL−1 in the midstream stretch, from the Gangjeong-Goryeong to Hapcheon-Changnyeong weirs; the density was 19.6 × 10³ cells·mL−1 at the downstream Changnyeong-Haman weir (Figure 6).

3.4. Correlation between Phytoplankton Species and Environmental Variables

The correlation between environmental variables and major phytoplankton species after the weir construction was determined by RDA (Figure 7). The first two axes explained 57.0% of the total variance, showing a positive correlation between Microcystis and the water temperature, TP, CODMn, BOD5, and Chl-a, while Stephanodiscus negatively correlated with the water temperature, but was closely related to DO and TN.

4. Discussion

In recent years, eight multifunctional weirs have been constructed along the Nakdong River section stretching for approximately 200 km to (1) ensure sufficient flow during the dry season for agricultural uses; (2) maintain environmental flow to the river stretch; and (3) enhance the water quality in the river. The physical environment, such as the water depth, flow rate, and velocity, has changed in the Nakdong River weir section [29,30,31]. The HRT values in the upper stretch (St. 1 to St. 4) ranged between 2.7 and 7.3 days, showing a 3- to 10-fold increase, while the HRT values in the lower part of the river (St. 5 to St. 8) ranged between 3.1 and 8.4 days, indicating a 2- to 6-fold increase compared with those before the weir construction, based on the flow travel time simulation [30].
In the present study, the physical and chemical environments varied between the upstream and downstream stretches of the Nakdong River. The BOD5 concentrations increased at the upper three sites, from St. 1 to St. 3, while only marginal changes were observed in the downstream stretch, including St. 4, after the weir construction. The BOD5 concentration in the upper stretch was affected by changes in the phytoplankton cell density, based on the Chl-a concentrations before and after the weir construction. Wang et al. [32] found that the BOD5 concentration significantly positively correlates with the phytoplankton density during spring, summer, and autumn. In the present study, at three sites between the St. 1 and St. 3, the TP concentration exhibited marginal variations; however, the average Chl-a concentration increased approximately two-fold in 2013 compared with that before the weir construction. Wehr and Descy [33] reported that the levels of nutrients in rivers are often higher than algal requirements. Therefore, the phytoplankton cell density and production are often controlled by the discharge rate, which is related to the residence time, dilution rate, and other factors.
In the present study, in the stretch between St. 4 and St. 8, which corresponds to the middle and lower parts of the Nakdong River, the TP concentration decreased sharply, except at St. 5, compared with that before the weir construction. The Chl-a concentration also decreased compared with that before the weir construction. Based on the reduced nutrient and Chl-a concentrations, changes in the physical and chemical environments of the water in the middle and downstream stretches of the Nakdong River may be attributed to a higher dilution factor with the increase in the water depth and volume [30]. Furthermore, the loss of phytoplankton from sedimentation would also change because of a longer HRT, and the P input might be reduced by managing the wastewater treatment plant effluents, as well as industrial and municipal discharges, after the weir construction. [34].
There was no significant change in the seasonal succession of dominant species before (2006–2007) and after the weir construction (2013). However, the cell density of Stephanodiscus hantzschii, which usually dominated from fall to the following spring, was 6.0 × 10³ cells·mL−1 after the weir construction, showing a 20% decline compared with that before the weir construction
According to previous studies, the diatom growth in spring mainly depends on the water temperature, nutrient availability (silica and P), light intensity, and carbon availability [35,36,37]. Diatom growth in spring may be primarily attributed to the high growth rate of S. hantzschii at low water temperatures and to its superior competitive ability over other diatoms during the period of low nutrient concentrations as small centric diatoms have a half-saturation growth constant of <10 µg·L−1 for P [34,38]. Salmaso and Braioni [39] have also reported that a low flow rate is essential for the growth of planktonic algae, including small centric diatoms, in river systems, and low flow rates and water mixing during dry seasons can lead to downstream accumulation of diatom cells in large river systems. In the present study, the centric diatom cell density declined after the weir construction. This may be attributed to a complex combined effect of physical, chemical, and biological factors. Sedimentation can be one of the selective factors that suppresses the growth of centric diatoms and prevent their dominance in shallow river stretches [14]. Köhler [40] has suggested that centric diatoms would decline in lakes because the zooplankton density increase in spring, and there would be a shift toward growth of buoyant cyanobacteria. Moreover, the reduced flow with an increased HRT might have enhanced the grazing pressure on small centric diatoms in the main river system after the construction of the weirs. However, zooplankton density was not measured in the present study.
One of the most notable differences in the phytoplankton distribution between the periods before and after the weir construction was an increase in the frequency, intensity, and duration of cyanobacterial blooms. Among cyanobacterial species, Microcystis aeruginosa, which is generally dominant during summer and fall, increased more than 10-fold, from an average of 0.5 × 10³ cells·mL−1 before the weir construction to an average of 7.0 × 10³ cells·mL−1 after the construction. Hilton et al. [41] have demonstrated that large, deep, and impounded rivers are usually characterized by long retention times, which are greater than algal doubling times. Therefore, a high biomass of phytoplankton can accumulate in the middle and lower stretches of a river. Furthermore, Reynolds [14] has suggested that the lower end of the range of retention times, covering the transition range, is likely to be between 4 and 6 days, which, based on the doubling time of common cyanobacteria, would correspond to 0.3 to 1.4 doublings per day. The HRT values in the eight weir sections ranged between 2 and 8 days during the bloom period of M. aeruginosa in 2013. Thus, both the high-water temperature (>20 °C) and retention time, as well as sufficient nutrients such as TP, might have led to the increased growth of cyanobacteria in the Nakdong River after the weir construction. These results were similar to the studies that the Microcystis growth was positively correlated with phosphorus concentration when it was lower than 0.445 mg L−1 [42]. These findings suggest that meteorological parameters, such as the temperature and precipitation, may affect the time of the occurrence of cyanobacterial blooms in the weir sections. Thus, appropriate regulation of water discharges in the weir stretches, based on the weather conditions, may directly affect the occurrence of blooms and the composition of phytoplankton in the weir system.

5. Conclusions

To the best of our knowledge, the present study is the first to demonstrate changes in limnological characteristics, including physical, chemical, and biological parameters, after consecutive construction of weirs in a large river system. The results revealed spatial variations in the TP and Chl-a concentrations among consecutive weir sections. The phytoplankton community composition also changed after the weir construction. The average cell density of Stephanodiscus hantzschii marginally decreased after the construction; however, proliferation of Microcystis aeruginosa was more intense during the summer and fall seasons, as compared with that before the weir construction. Therefore, appropriate regulation of the water discharge in weir stretches, based on environmental factors, can be implemented to reduce the occurrence of cyanobacterial blooms in the weir system.

Author Contributions

All authors contributed substantially to this study. Conceptualization, S.-U.C., H.-J.L., and H.-K.P.; Data Analysis, H.-J.L.; Writing–Original Draft Preparation, H.-J.L.; Writing–Review and Editing, H.-K.P. and S.-U.C.; Project Administration and Funding Acquisition, S.-U.C.

Funding

This work was supported by a grant from the National Institute of Environment Research (NIER), funded by the Ministry of Environment (MOE) of the Republic of Korea (2013-NIER-1946-305-16).

Acknowledgments

We appreciate H. W. Paerl for his attention and recommendation to submit this paper. We also thank anonymous reviewers for valuable comments improving the manuscript. We thank J.H. Hwang, H.S. Ryu, and members of the Nakdong River Environment Research Center, NIER, for their invaluable field and laboratory assistance.

Conflicts of Interest

The authors declare no conflict of interest.

References

  1. Bain, M.B.; Fimm, J.T.; Booke, H.E. Streamflow regulation and fish community structure. Ecology 1988, 69, 382–392. [Google Scholar] [CrossRef]
  2. Humborg, C.; Ittekkot, V.; Cociasu, A.; Boudungen, B. Effect of Danube River dam on Black Sea biogeochemistry and ecosystem structure. Nature 1997, 386, 385–388. [Google Scholar] [CrossRef]
  3. Kelly, V.J. Influence of reservoir on solute transport: A regional-scale approach. Hydrol. Process. 2001, 15, 1227–1249. [Google Scholar] [CrossRef]
  4. Li, Z.; Wang, S.; Guo, J.; Fang, F.; Cao, X.; Long, M. Responses of phytoplankton diversity to physical disturbance under manual operation in a large reservoir, China. Hydrobiologia 2012, 684, 45–56. [Google Scholar] [CrossRef]
  5. Poff, N.L.; Ward, J.V. Implications of streamflow variability and predictability for lotic community structure: A regional analysis of streamflow patterns. Can. J. Fish. Aquat. Sci. 1989, 46, 1805–1818. [Google Scholar] [CrossRef]
  6. Rosenberg, D.M.; McCully, P.; Pringle, C.M. Global-scale environmental effects of hydrological alterations: Introduction. Bioscience 2000, 50, 746–751. [Google Scholar] [CrossRef]
  7. Horne, D.J.; Cohen, A.; Martens, K. Biology, taxonomy and identification techniques. In The Ostracoda: Applications in Quaternary Research, 1st ed.; Holmes, J.A., Chivas, A., Eds.; American Geophysical Union: Washington, DC, USA, 2002; pp. 6–36. [Google Scholar]
  8. Lindeman, R. The trophic dynamics aspect of ecology. Ecology 1942, 23, 399–417. [Google Scholar] [CrossRef]
  9. Paerl, H.W.; Fulton, R.S.; Moisander, P.H.; Dyble, J. Harmful freshwater algal blooms, with emphasis on cyanobacteria. Sci. World J. 2001, 1, 76–113. [Google Scholar] [CrossRef] [PubMed]
  10. Bowling, L.; Egan, S.; Holliday, J.; Honeyman, G. Did spatial and temporal variations in water quality influence cyanobacterial abundance, community composition and cell size in the Murray River, Australia during a drought-affected low-flow summer? Hydrobiologia 2016, 765, 356–377. [Google Scholar] [CrossRef]
  11. Istvánovics, V.; Honti, M.; Vörös, L.; Kozma, Z. Phytoplankton dynamics in relation to connectivity flow dynamics and resource availability—The case of a large, lowland river, the Hungarian Tisza. Hydrobiologia 2010, 637, 121–141. [Google Scholar] [CrossRef]
  12. Livingston, R.J. Eutrophication Processes in Coastal Systems: Origin and Succession of Plankton Blooms and Effect on Secondary Production in Gulf Coast Estuaries Center for Aquatic Research and Resources Management; CRC Press: Tallahassee, FL, USA, 2001. [Google Scholar]
  13. Perona, E.; Bonilla, I.; Mateo, P. Epilithic cyanobacterial communities and water quality: An alternative tool for monitoring eutrophication in the Alberche River (Spain). J. Appl. Phycol. 1998, 10, 183–191. [Google Scholar] [CrossRef]
  14. Reynolds, C.S.; Descy, J.P. The production, biomass and structure of phytoplankton in large rivers. Large Rivers 1996, 18, 161–187. [Google Scholar] [CrossRef]
  15. Reynolds, C.S.; Huszar, V.; Kruk, C.; Naselli-Flores, L.; Melo, S. Towards a functional classification of the freshwater phytoplankton. J. Plankton Res. 2002, 24, 417–428. [Google Scholar] [CrossRef] [Green Version]
  16. Wang, L.; Cai, Q.H.; Tan, L.; Kong, L.H. Longitudinal differences of phytoplankton community during a period of small water level fluctuations in a subtropical reservoir bay (Xingxi Bay, Three Gorges reservoir, China). Int. Rev. Hydrobiol. 2011, 96, 381–396. [Google Scholar] [CrossRef]
  17. Choi, A.R.; Oh, H.M.; Lee, J.A. Ecological study on the toxic Microcystis in the lower Nakdong River. Algae 2002, 17, 171–185. [Google Scholar] [CrossRef]
  18. Ha, K.; Kim, H.W.; Joo, G.J. The phytoplankton succession in the lower part of hypertrophic Nakdong River (Mulgum), South Korea. Hydrobiologia 1998, 369, 217–227. [Google Scholar] [CrossRef]
  19. Ha, K.; Jang, M.H.; Joo, G.J. Winter Stephanodiscus bloom development in the Nakdong River regulated by estuary dam and tributaries. Hydrobiologia 2003, 506, 221–227. [Google Scholar] [CrossRef]
  20. Li, Z.; Fang, F.; Chen, J.; Zhang, C.; Tian, G. Spring algal bloom and nutrients characteristics in Xiaojiang River backwater area, Three Gorges reservoir, 2007. J. Lake Sci. 2009, 21, 36–44. [Google Scholar]
  21. Meng, C.; Zhao, B. Study on the trend of eutrophication after impounding in Three Gorges reservoir. J. Agro-Environ. Sci. 2007, 26, 863–867. [Google Scholar]
  22. Hwang, D.J.; Lee, H.J.; Yoon, J.S.; Hur, S.N.; Lim, T.H.; Kwon, Y.H.; Shin, C.K.; Kim, H.W. Study on Ecological Characteristic of Algal Species Forming Bloom during Spring-Winter Season in the Nakdong River; NIER 2007-56-912; Nakdong River Environment Research Center: Goryeong, Korea; Sunchon National University: Seokhyeon-dong, Korea, 2007; pp. 1–144. [Google Scholar]
  23. American Public Health Association (APHA). Standard Methods for the Examination of Water and Wastewater, 21st ed.; American Public Health Association (APHA); American Water Works Association (AWWA); Water Environment Federation (WDF): Washington, DC, USA, 2005.
  24. John, D.M.; Whitton, B.A.; Brook, A.J. The Freshwater Algal Flora of the British Isles: An Identification Guide to Freshwater and Terrestrial Algae; Cambridge University Press: Cambridge, UK, 2002. [Google Scholar]
  25. Komárek, J.; Anagnostidis, K. Freshwater Flora of Central Europe Vol. 19/1 Cyanoprokaryota, 1st Part: Chroococcales; Gustav Fischer Verlag: Jena, Germany, 1999. [Google Scholar]
  26. Komárek, J.; Anagnostidis, K. Freshwater Flora of Central Europe, Volume 19/2 Cyanoprokaryota, Part 2: Oscillatoriales; Elsevier GmbH: München, Germany, 2005. [Google Scholar]
  27. ter Braak, C.J.F.; Šmilauer, P. Canoco Reference Manual and User’s Guide: Software for Ordination, version 5.0; Microcomputer Power: Ithaca, NY, USA, 2012. [Google Scholar]
  28. Cheon, S.U.; Lee, H.J.; Yu, J.J.; Park, H.K.; Lim, T.H.; Lee, J.J.; Lee, I.J.; Shin, S.H.; Yoon, J.S.; Lee, K.L.; et al. Changes of Water Environment and Phytoplankton Community Structures in the Nakdong River; NIER-RP 2013-245; Nakdong River Environment Research Center: Goryeong, Korea; Sunchon National University: Seokhyeon-dong, Korea, 2013; pp. 1–35. [Google Scholar]
  29. Ahn, J.M.; Lee, S.; Kang, T. Evaluation of dams and weirs operation for water resource management of the Geum River. Sci. Total Environ. 2014, 478, 103–115. [Google Scholar] [CrossRef] [PubMed]
  30. Jun, K.S.; Kim, J.S. The four major rivers restoration projects: Impact on river flows. J. Civ. Eng. 2011, 15, 217–224. [Google Scholar] [CrossRef]
  31. Seo, D.I.; Kim, M.; Ahn, J.H. Prediction of chlorophyll-a changes due to weir constructions in the Nakdong river using EFDC-WASP modeling. Environ. Eng. Res. 2012, 17, 95–102. [Google Scholar] [CrossRef]
  32. Wang, X.L.; Lu, L.Y.; He, G.Z.; Han, J.J.; Wang, T.Y. Exploration of relationship between phytoplankton biomass and related environmental variables using multivariate statistic analysis in a eutrophic shallow lake: A 5-year study. J. Environ. Sci. 2007, 19, 920–927. [Google Scholar] [CrossRef]
  33. Wehr, J.D.; Descy, J.P. Use of phytoplankton in large river management. J. Phycol. 1998, 34, 741–749. [Google Scholar] [CrossRef]
  34. Grücker, B.; Brauns, M.; Pusch, T. Effects of wastewater treatment plant discharge on ecosystem structure and function of lowland streams. J. N. Am. Benthol. Soc. 2006, 25, 313–329. [Google Scholar] [CrossRef]
  35. Harris, G.P. Phytoplankton Ecology: Structure, Function and Fluctuation; Chapman and Hall: London, UK, 1986. [Google Scholar]
  36. Kilham, P.A. Hypothesis concerning silica and the freshwater planktonic diatoms. Limnol. Oceanogr. 1971, 16, 10–18. [Google Scholar] [CrossRef]
  37. Krivtsov, V.; Bellinger, E.; Sigee, D. Ecological study of Stephanodiscus during a spring diatom bloom: Dynamics of intracellular elemental concentration and correlations in relation to water chemistry, and implications for overall chemical cycling in a temperate lake. Acta Oecol. 2003, 24, 265–274. [Google Scholar] [CrossRef]
  38. van Donk, E.; Kilham, S.S. Temperature effects on silicon- and phosphorus-limited growth and competitive interactions among three diatoms. J. Phycol. 1990, 26, 40–50. [Google Scholar] [CrossRef]
  39. Salmaso, N.; Braioni, M.G. Factors controlling the seasonal development and distribution of the phytoplankton community in the lowland course of a large river in Northern Italy (River Adige). Aquat. Ecol. 2008, 42, 533–545. [Google Scholar] [CrossRef]
  40. Kölhler, J. Origin and succession of phytoplankton in a river-lake system (Spree, Germany). Hydrobiologia 1994, 289, 78–83. [Google Scholar]
  41. Hilton, J.; O’Hare, M.; Bowes, M.J.; Jones, J.I. How green is my river? A new paradigm of eutrophication in rivers. Sci. Total Environ. 2006, 365, 66–83. [Google Scholar] [CrossRef] [PubMed]
  42. Jin, X.C.; Chu, Z.C.; Yi, W.L.; Hu, X.Z. Influence of phosphorus on Microcystis growth and the changes of other environmental factors. J. Environ. Sci. (China) 2005, 17, 931–941. [Google Scholar]
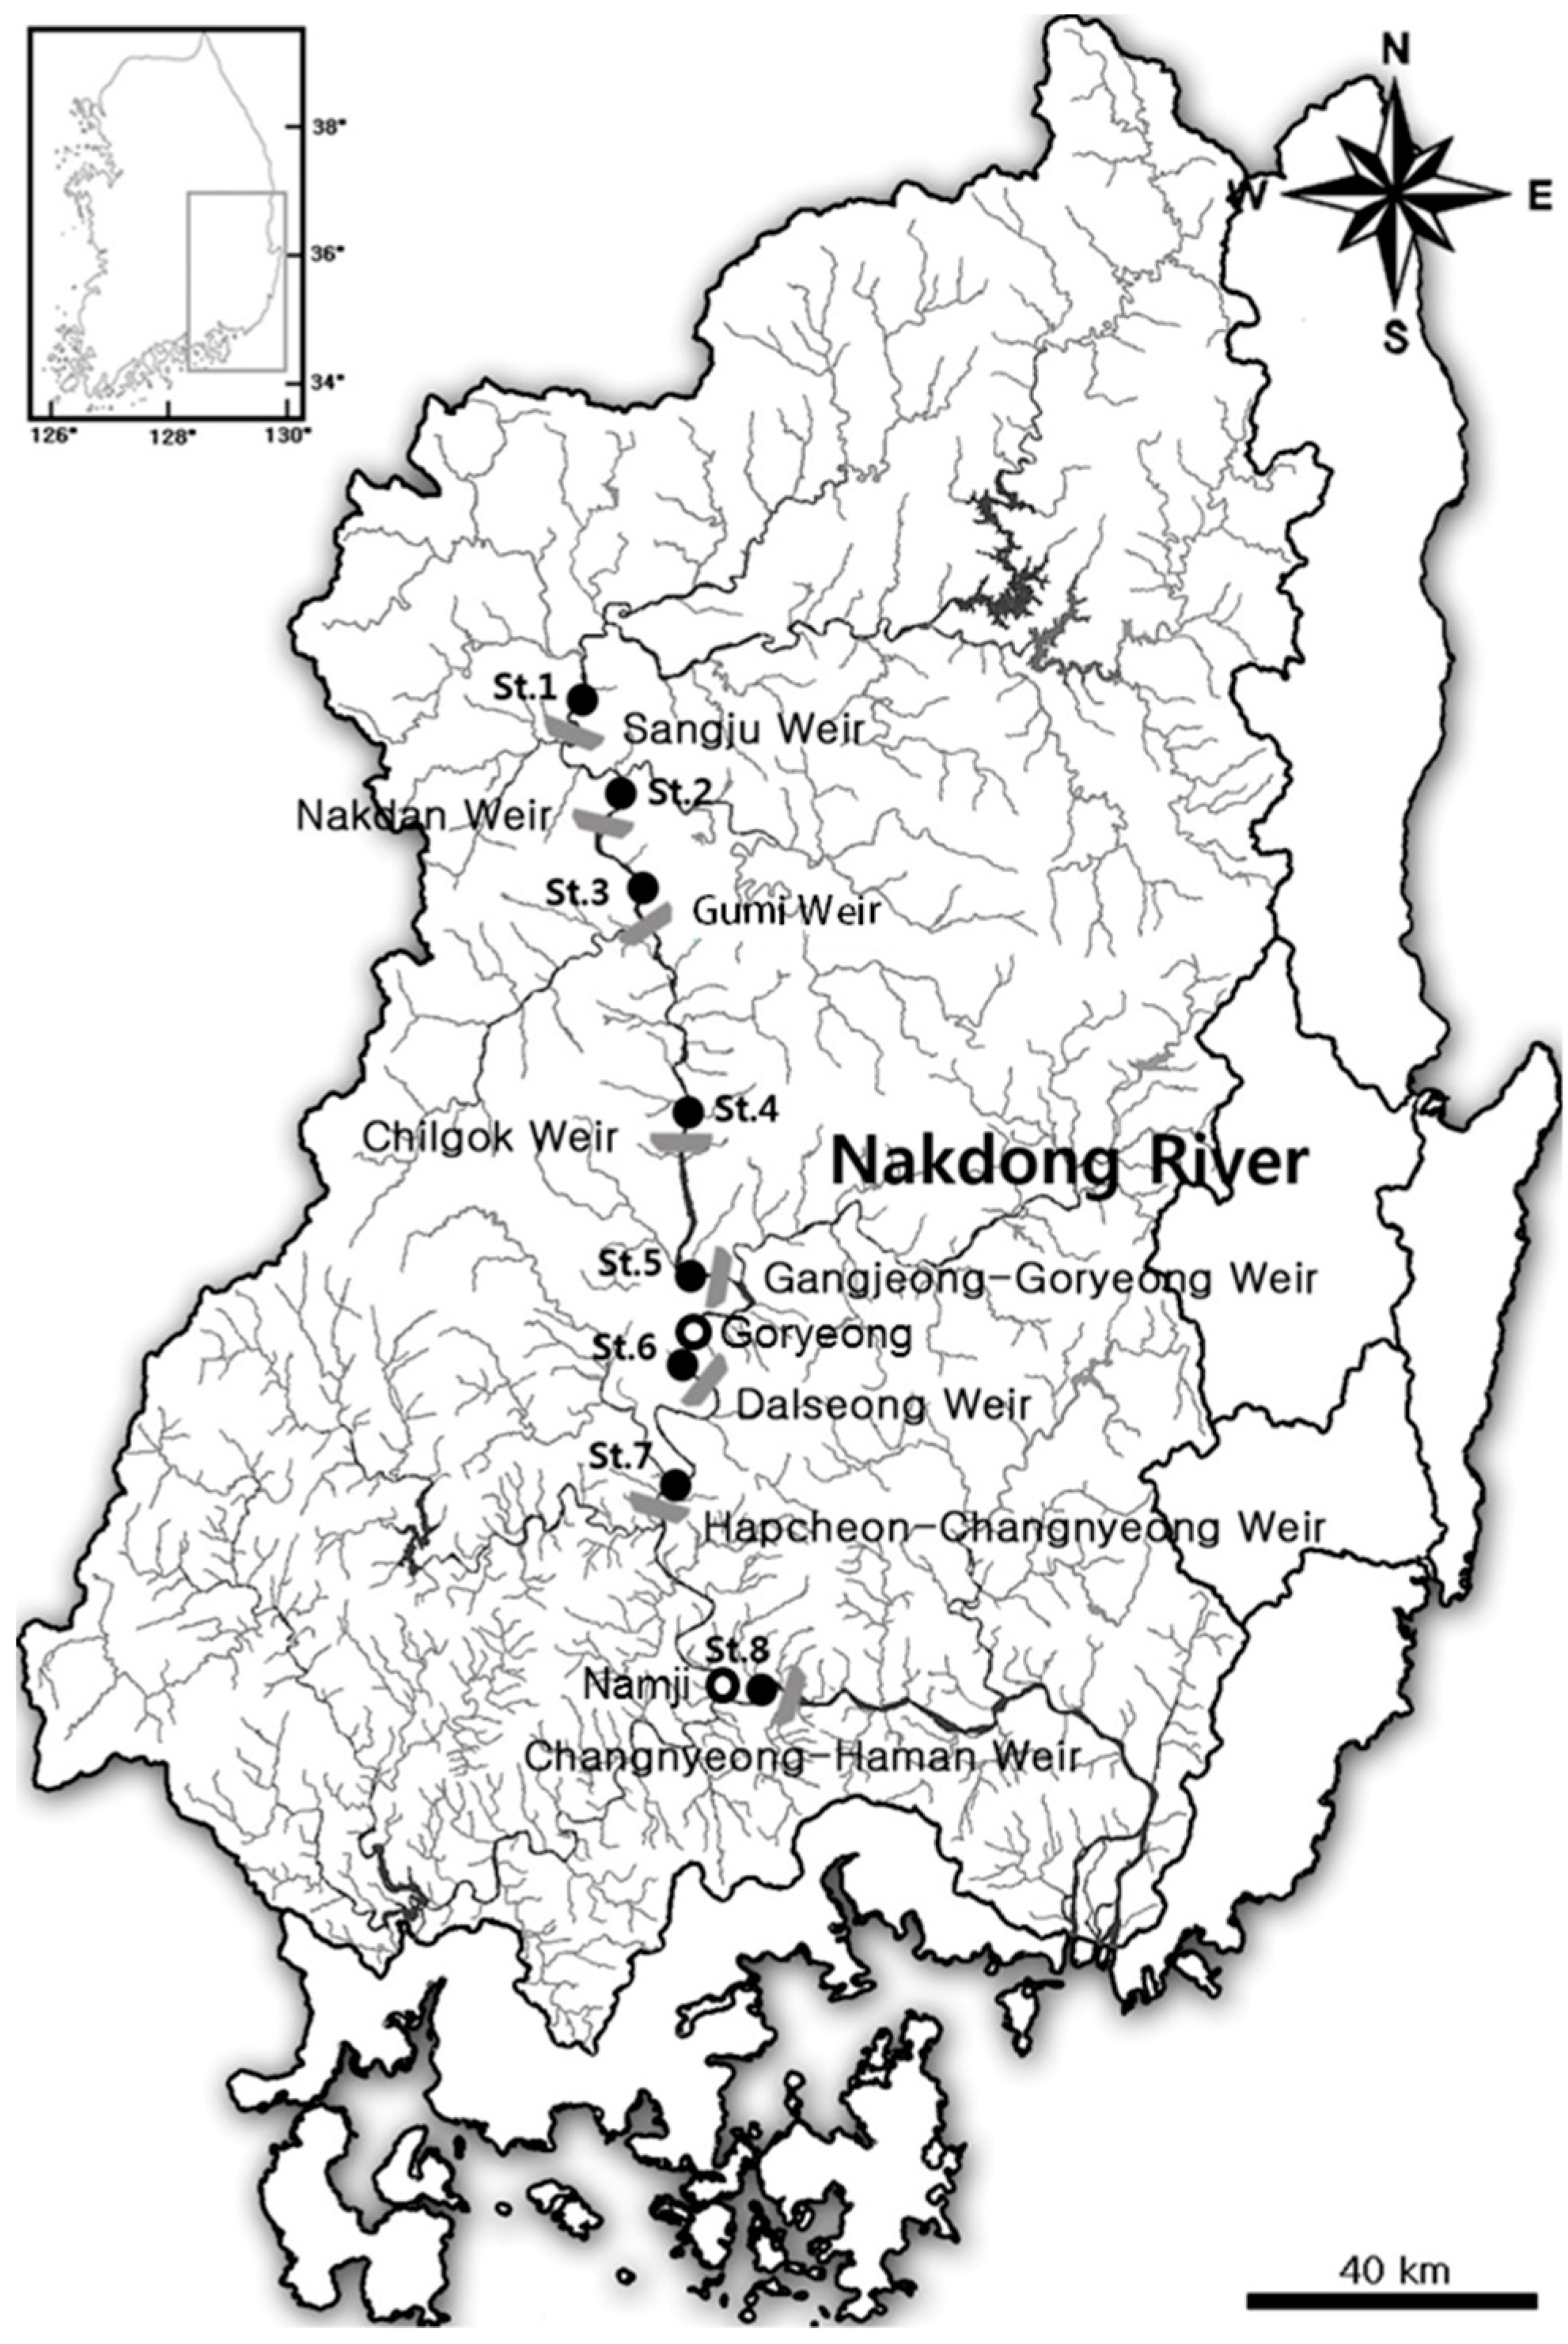
Figure 1. Sampling sites along the Nakdong River, Korea. Gray symbols indicate the major weirs constructed on the mainstream of the river; open and solid circles indicate the monitoring sites along the mainstream before (2006–2007) and after the weir construction (2013), respectively.
Ijerph 15 02348 g001
Figure 2. Monthly trends for the air temperature (a) and precipitation (b) during the study periods before (2006–2007) and after (2013) the weir construction on the Nakdong River.
Ijerph 15 02348 g002
Figure 3. Annual hydraulic retention times (HRTs) in the Nakdong River after the weir construction. (a) HRT at each weir section; (b) cumulative HRT.
Ijerph 15 02348 g003
Figure 4. Spatial variations in biochemical oxygen demand (BOD5), total phosphorus (TP), and chlorophyll a concentration in the Nakdong River before (2006–2007) and after (2013) the weir construction. Box plots indicate the minimum, 10%, 25%, median, 75%, 90%, and maximum levels at (a) Sangju weir (St. 1); (b) Nakdan weir (St. 2); (c) Gumi weir (St. 3); (d) Chilgok weir (St. 4); (e) Gangjeong-Goryeong weir (St. 5); (f), Dalseong weir (St. 6); (g) Hapcheon-Changnyeong weir (St. 7); and (h) Changnyeong-Haman weir (St. 8).
Ijerph 15 02348 g004
Figure 5. Comparison of the phytoplankton cell density before (2006–2007) and after (2013) the construction of the Goryeong, Dalseong, Namji, and Changnyeong-Haman weirs.
Ijerph 15 02348 g005
Figure 6. Temporal and spatial changes in the phytoplankton cell density in the Nakdong River after construction of the eight weirs (2013).
Ijerph 15 02348 g006
Figure 7. Ordination biplots of environmental variables and dominant species, obtained using redundancy analysis, in the Nakdong River weir section. Variables included the discharge rate (DiscRate), water temperature (WT), dissolved oxygen (DO), biochemical oxygen demand (BOD5), chemical oxygen demand (CODMn), suspended solids (SS), chlorophyll a (Chl-a), total nitrogen (TN), total phosphorus (TP), nitrate nitrogen (NO3-N), ammonia nitrogen (NH4+-N), and phosphate phosphorus (PO43−-P).
Ijerph 15 02348 g007
Table 1. Physical parameters of the study sites.
SiteElevation (EL m)Distance (km)Volume (106 m3)Catchment Area (km2)Average Depth (m)Geographic Coordinates (Latitude/Longitude)
Sangju (St. 1)47.028.227740711.036°25′51.1″ N/128°15′5.19″ E
Nakdan (St. 2)40.015.735922111.536°21′28.16″ N/128°18′27.96″ E
Gumi (St. 3)32.518.253955712.036°14′2.11″ N/128°20′52.48″ E
Chilgok (St. 4)25.527.57511,04011.536°0′45.51″ N/128°24′3.58″ E
Gangjeong-Goryeong (St. 5)19.526.29211,66710.535°50′27.73″ N/128°27′31.1″ E
Dalseong (St. 6)14.019.25914,24810.535°43′55.18″ N/128°25′10.9″ E
Hapcheon-Changnyeong (St. 7)10.529.87015,0749.035°35′16.13″ N/128°21′29.39″ E
Changnyeong-Haman (St. 8)5.042.510120,69713.235°22′39.42″ N/128°33′15.96″ E
Table 2. Environmental variables measured in the surface water at the study sites.
ParameterYear(s)Sangju (St. 1)Nakdan (St. 2)Gumi (St. 3)Chilgok (St. 4)Gangjeong-Goryeong (St. 5)Dalseong (St. 6)Hapcheon-Changnyeong (St. 7)Changnyeong-Haman (St. 8)
Temperature (°C)2006–2007
2013
15.5 ± 8.4
17.4 ± 9.8
15.2 ± 8.7
19.1 ± 8.7 *
15.5 ± 8.9
18.5 ± 10.0 *
15.4 ± 8.0
17.1 ± 110.5
16.2 ± 8.9
16.4 ± 10.0
16.3 ± 8.3
17.1 ± 9.8
16.5 ± 8.7
17.5 ± 9.9
16.4 ± 8.5
17.9 ± 10.3
pH2006–2007
2013
7.9 ± 0.2
8.4 ± 0.4 *
7.8 ± 0.2
8.6 ± 0.2 ***
7.9 ± 0.2
8.6 ± 0.4 ***
7.8 ± 0.3
8.4 ± 0.4 ***
8.2 ± 0.4
8.2 ± 0.3
8.0 ± 0.4
8.2 ± 0.3 *
7.7 ± 0.7
8.3 ± 0.3 **
7.6 ± 0.6
8.4 ± 0.3 **
DO (mg·L−1)2006–2007
2013
9.2 ± 2.1
11.5 ± 1.3 *
8.9 ± 2.1
11.1 ± 1.7 ***
9.1 ± 2.1
11.2 ± 1.9 ***
9.1 ± 2.1
11.3 ± 2.3 ***
11.4 ± 2.1
11.2 ± 2.6
10.7 ± 2.2
11.5 ± 2.6 *
11.0 ± 3.1
11.5 ± 2.6
10.9 ± 2.7
11.4 ± 2.2
Conductivity (µS·cm−1)2006–2007
2013
125 ± 25
189 ± 27 ***
128 ± 22
206 ± 23 ***
129 ± 25
195 ± 24 ***
202 ± 50
244 ± 42 *
250 ± 48
244 ± 40
383 ± 107
349 ± 82
305 ± 58
324 ± 71
255 ± 37
268 ± 50
BOD5 (mg·L−1)2006–2007
2013
0.8 ± 0.2
1.9 ± 0.7 ***
0.8 ± 0.2
2.5 ± 0.7 ***
0.8 ± 0.2
2.4 ± 1.0 ***
1.8 ± 0.4
2.3 ± 0.9
2.2 ± 0.5
1.9 ± 0.5
2.8 ± 0.7
2.6 ± 0.6
2.9 ± 1.0
2.5 ± 0.8
2.6 ± 0.9
2.6 ± 0.8
CODMn (mg·L−1)2006–2007
2013
3.1 ± 0.9
4.3 ± 0.8 **
3.2 ± 1.0
5.3 ± 1.0 ***
3.3 ± 0.9
5.3 ± 1.2 ***
4.3 ± 0.9
5.5 ± 1.2 **
4.9 ± 0.7
5.4 ± 0.9
6.2 ± 0.9
6.6 ± 1.0
6.3 ± 1.0
6.4 ± 1.2
5.9 ± 1.0
6.2 ± 1.2
Chlorophyll a (mg·m−3)2006–2007
2013
7.7 ± 3.7
18.6 ± 12.7 *
9.9 ± 5.6
29.3 ± 14.1 *
11.5 ± 7.1
24.6 ± 13.0 **
17.2 ± 13.4
23.2 ± 12.8
33.6 ± 18.4
22.9 ± 13.2
44.2 ± 23.1
32.7 ± 19.8
57.0 ± 36.0
29.6 ± 19.3 *
58.7 ± 29.4
31.2 ± 14.7 *
TN (mg·L−1)2006–2007
2013
2.457 ± 0.288
2.506 ± 0.331
2.509 ± 0.336
2.470 ± 0.315
2.478 ± 0.344
2.465 ± 0.391
3.162 ± 0.610
2.869 ± 0.494 *
2.830 ± 0.477
2.718 ± 0.542
4.045 ± 0.926
3.699 ± 0.829 **
3.669 ± 0.863
3.343 ± 0.718 *
3.249 ± 0.667
2.944 ± 0.641 **
NH3+-N (mg·L−1)2006–2007
2013
0.069 ± 0.050
0.049 ± 0.050
0.061 ± 0.036
0.040 ± 0.019 **
0.052 ± 0.027
0.053 ± 0.040
0.290 ± 0.268
0.099 ± 0.066 **
0.115 ± 0.099
0.083 ± 0.044
0.194 ± 0.147
0.108 ± 0.052 *
0.088 ± 0.071
0.090 ± 0.051
0.064 ± 0.062
0.072 ± 0.041
NO3-N (mg·L−1)2006–2007
2013
2.172 ± 0.360
2.011 ± 0.343
2.272 ± 0.336
1.839 ± 0.420
2.263 ± 0.344
1.841 ± 0.411 **
2.551 ± 0.426
2.101 ± 0.480 ***
2.319 ± 0.038
1.960 ± 0.502 ***
3.199 ± 0.813
2.722 ± 0.775 ***
2.388 ± 0.604
2.456 ± 0.704
2.014 ± 0.439
2.095 ± 0.062
TP (mg·L−1)2006–2007
2013
0.047 ± 0.026
0.044 ± 0.017
0.053 ± 0.038
0.050 ± 0.023
0.054 ± 0.038
0.051 ± 0.025
0.116 ± 0.047
0.057 ± 0.018 **
0.074 ± 0.017
0.054 ± 0.015 *
0.200 ± 0.037
0.075 ± 0.025 ***
0.189 ± 0.037
0.069 ± 0.024 ***
0.165 ± 0.021
0.063 ± 0.020 ***
PO43−-P (mg·L−1)2006–2007
2013
0.018 ± 0.010
0.009 ± 0.009
0.019 ± 0.012
0.006 ± 0.007 **
0.016 ± 0.013
0.008 ± 0.008 *
0.070 ± 0.037
0.012 ± 0.009 ***
0.016 ± 0.010
0.010 ± 0.006
0.121 ± 0.041
0.013 ± 0.011 ***
0.097 ± 0.023
0.013 ± 0.011 ***
0.071 ± 0.011
0.008 ± 0.008 ***
Notes: Values are the mean ± standard deviation. DO, dissolved oxygen; BOD5, biological oxygen demand; CODMn, chemical oxygen demand; TN, total nitrogen; NH4+-N, ammonia nitrogen; NO3-N, nitrate nitrogen; TP, total phosphorus; PO43−-P, phosphate phosphorus. Statistically significant differences are indicated: *** p ≤ 0.001; ** p < 0.01; * p < 0.05.