Global and Geographically Weighted Quantile Regression for Modeling the Incident Rate of Children’s Lead Poisoning in Syracuse, NY, USA

Abstract
1. Introduction
2. Theoretical Background
2.1. Quantile Regression
2.2. Geographically Weighted Quantile Regression (GWQR)
3. Materials and Methods
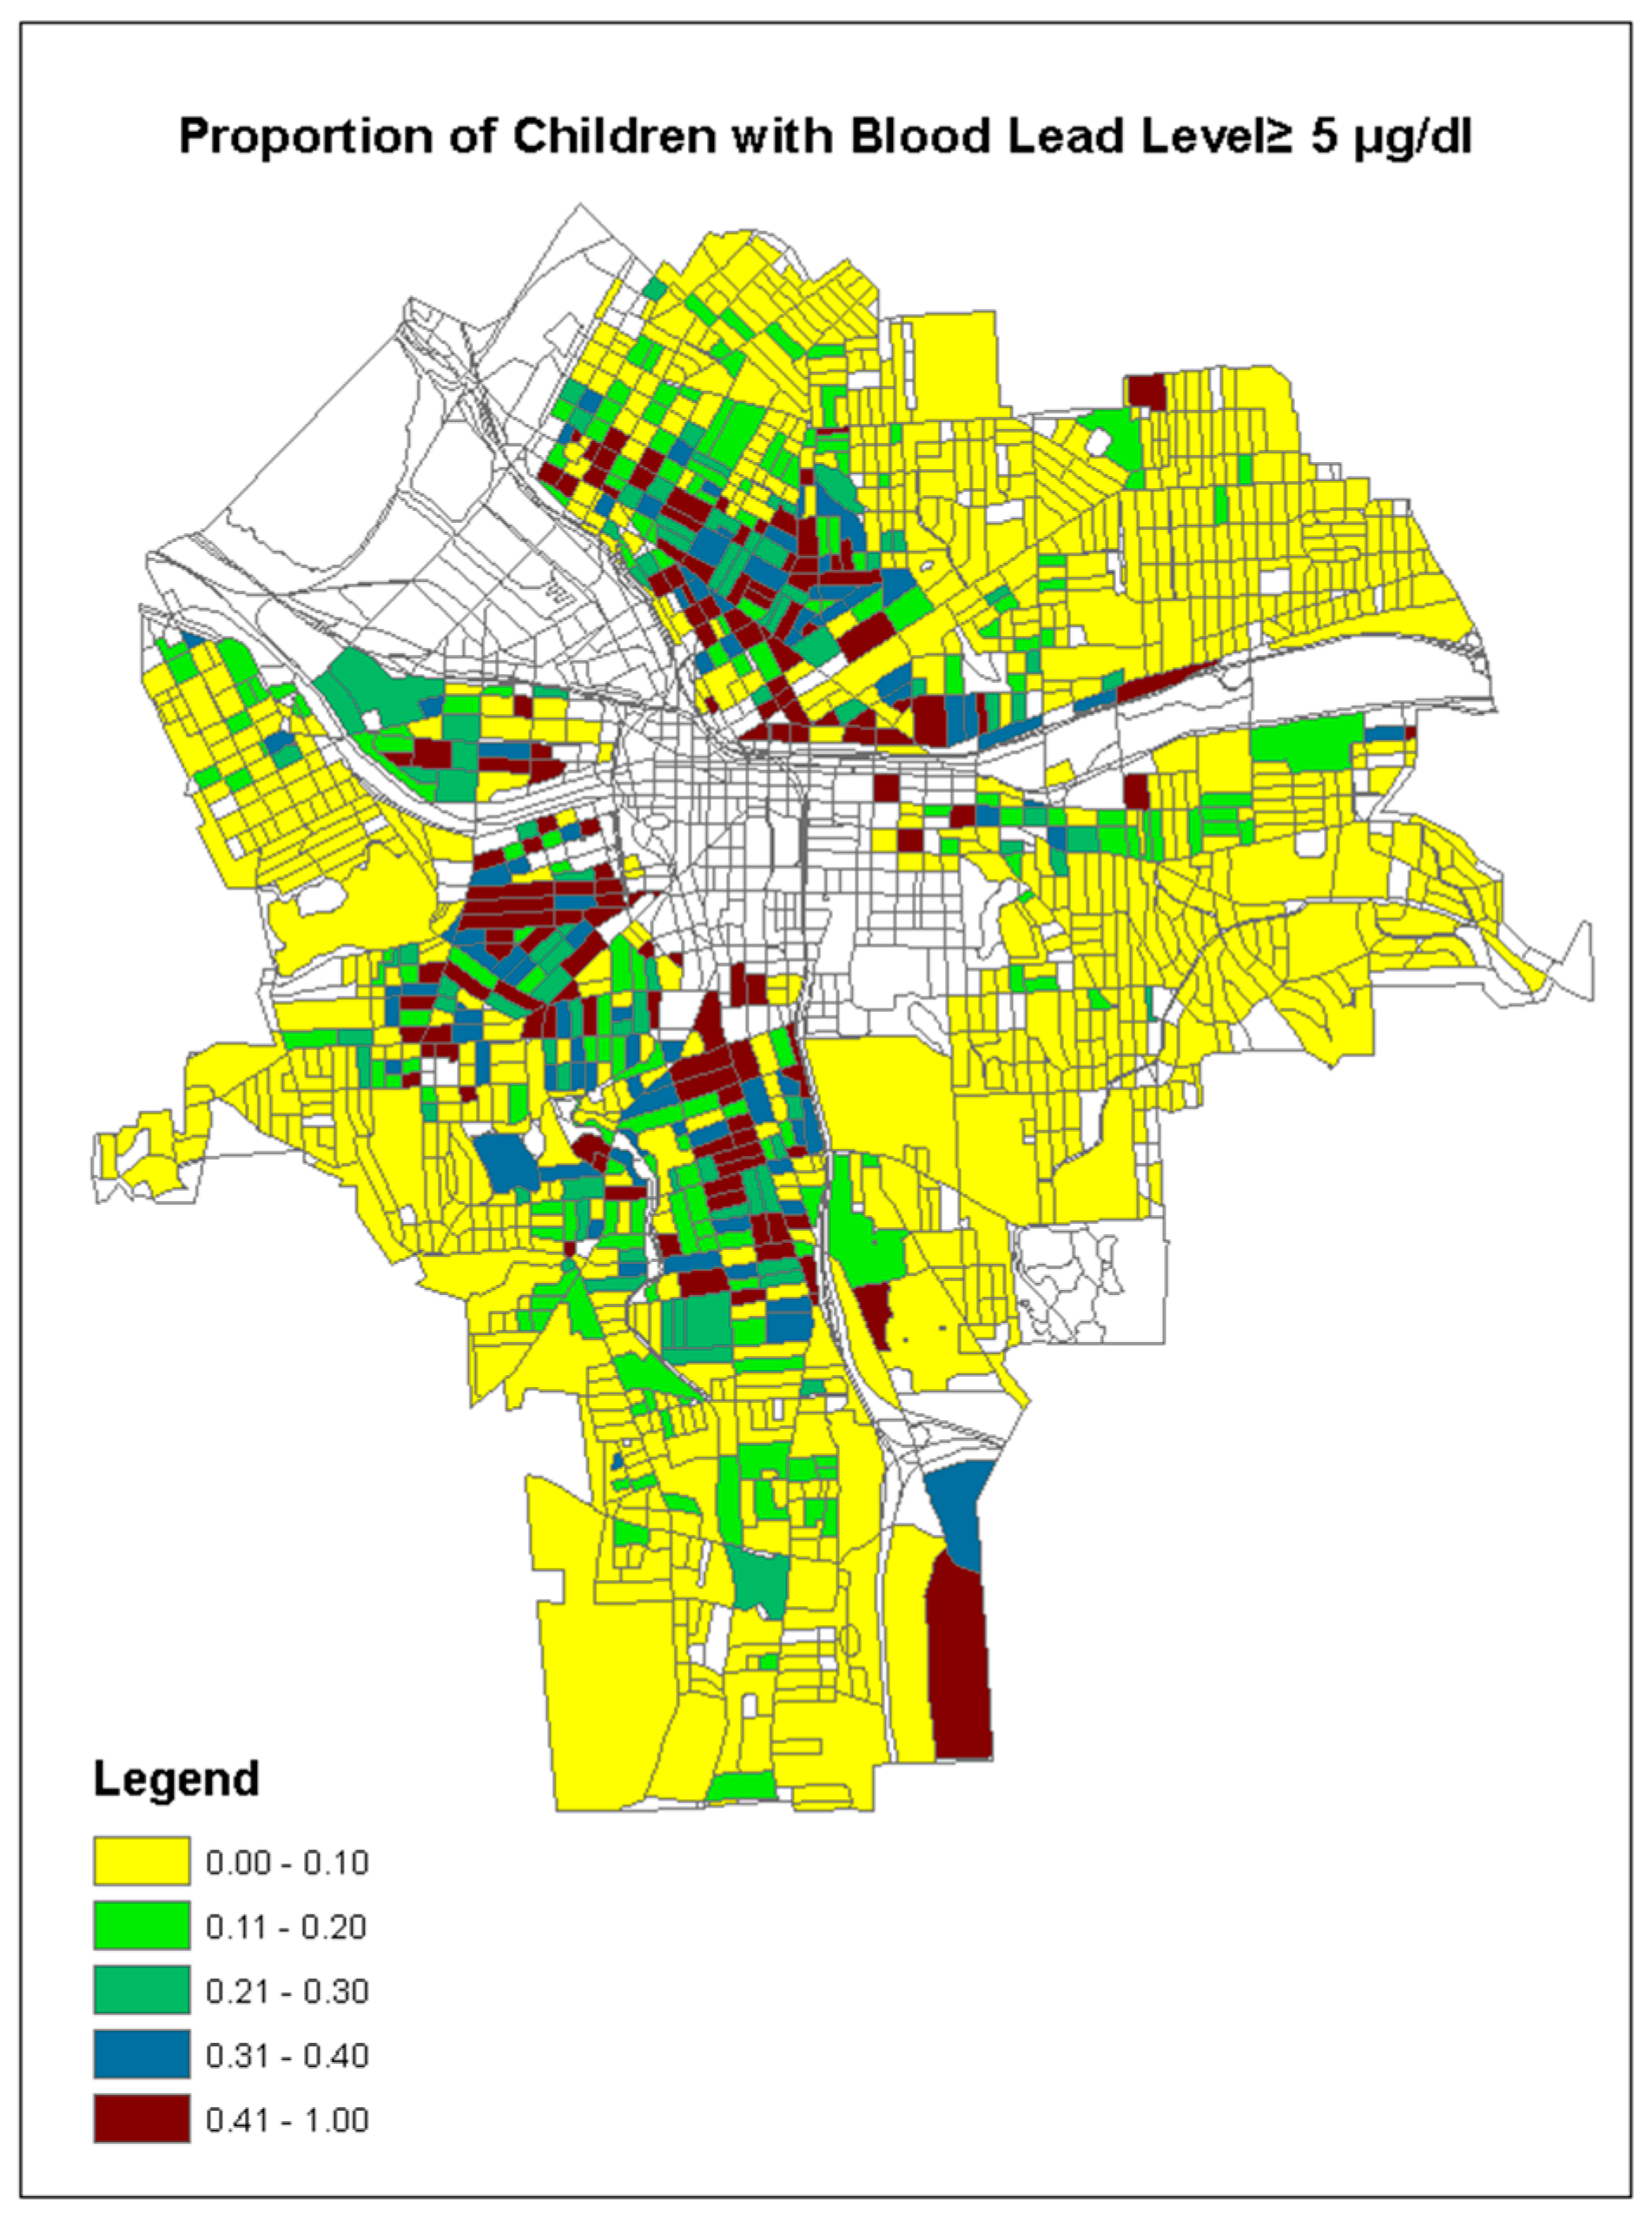
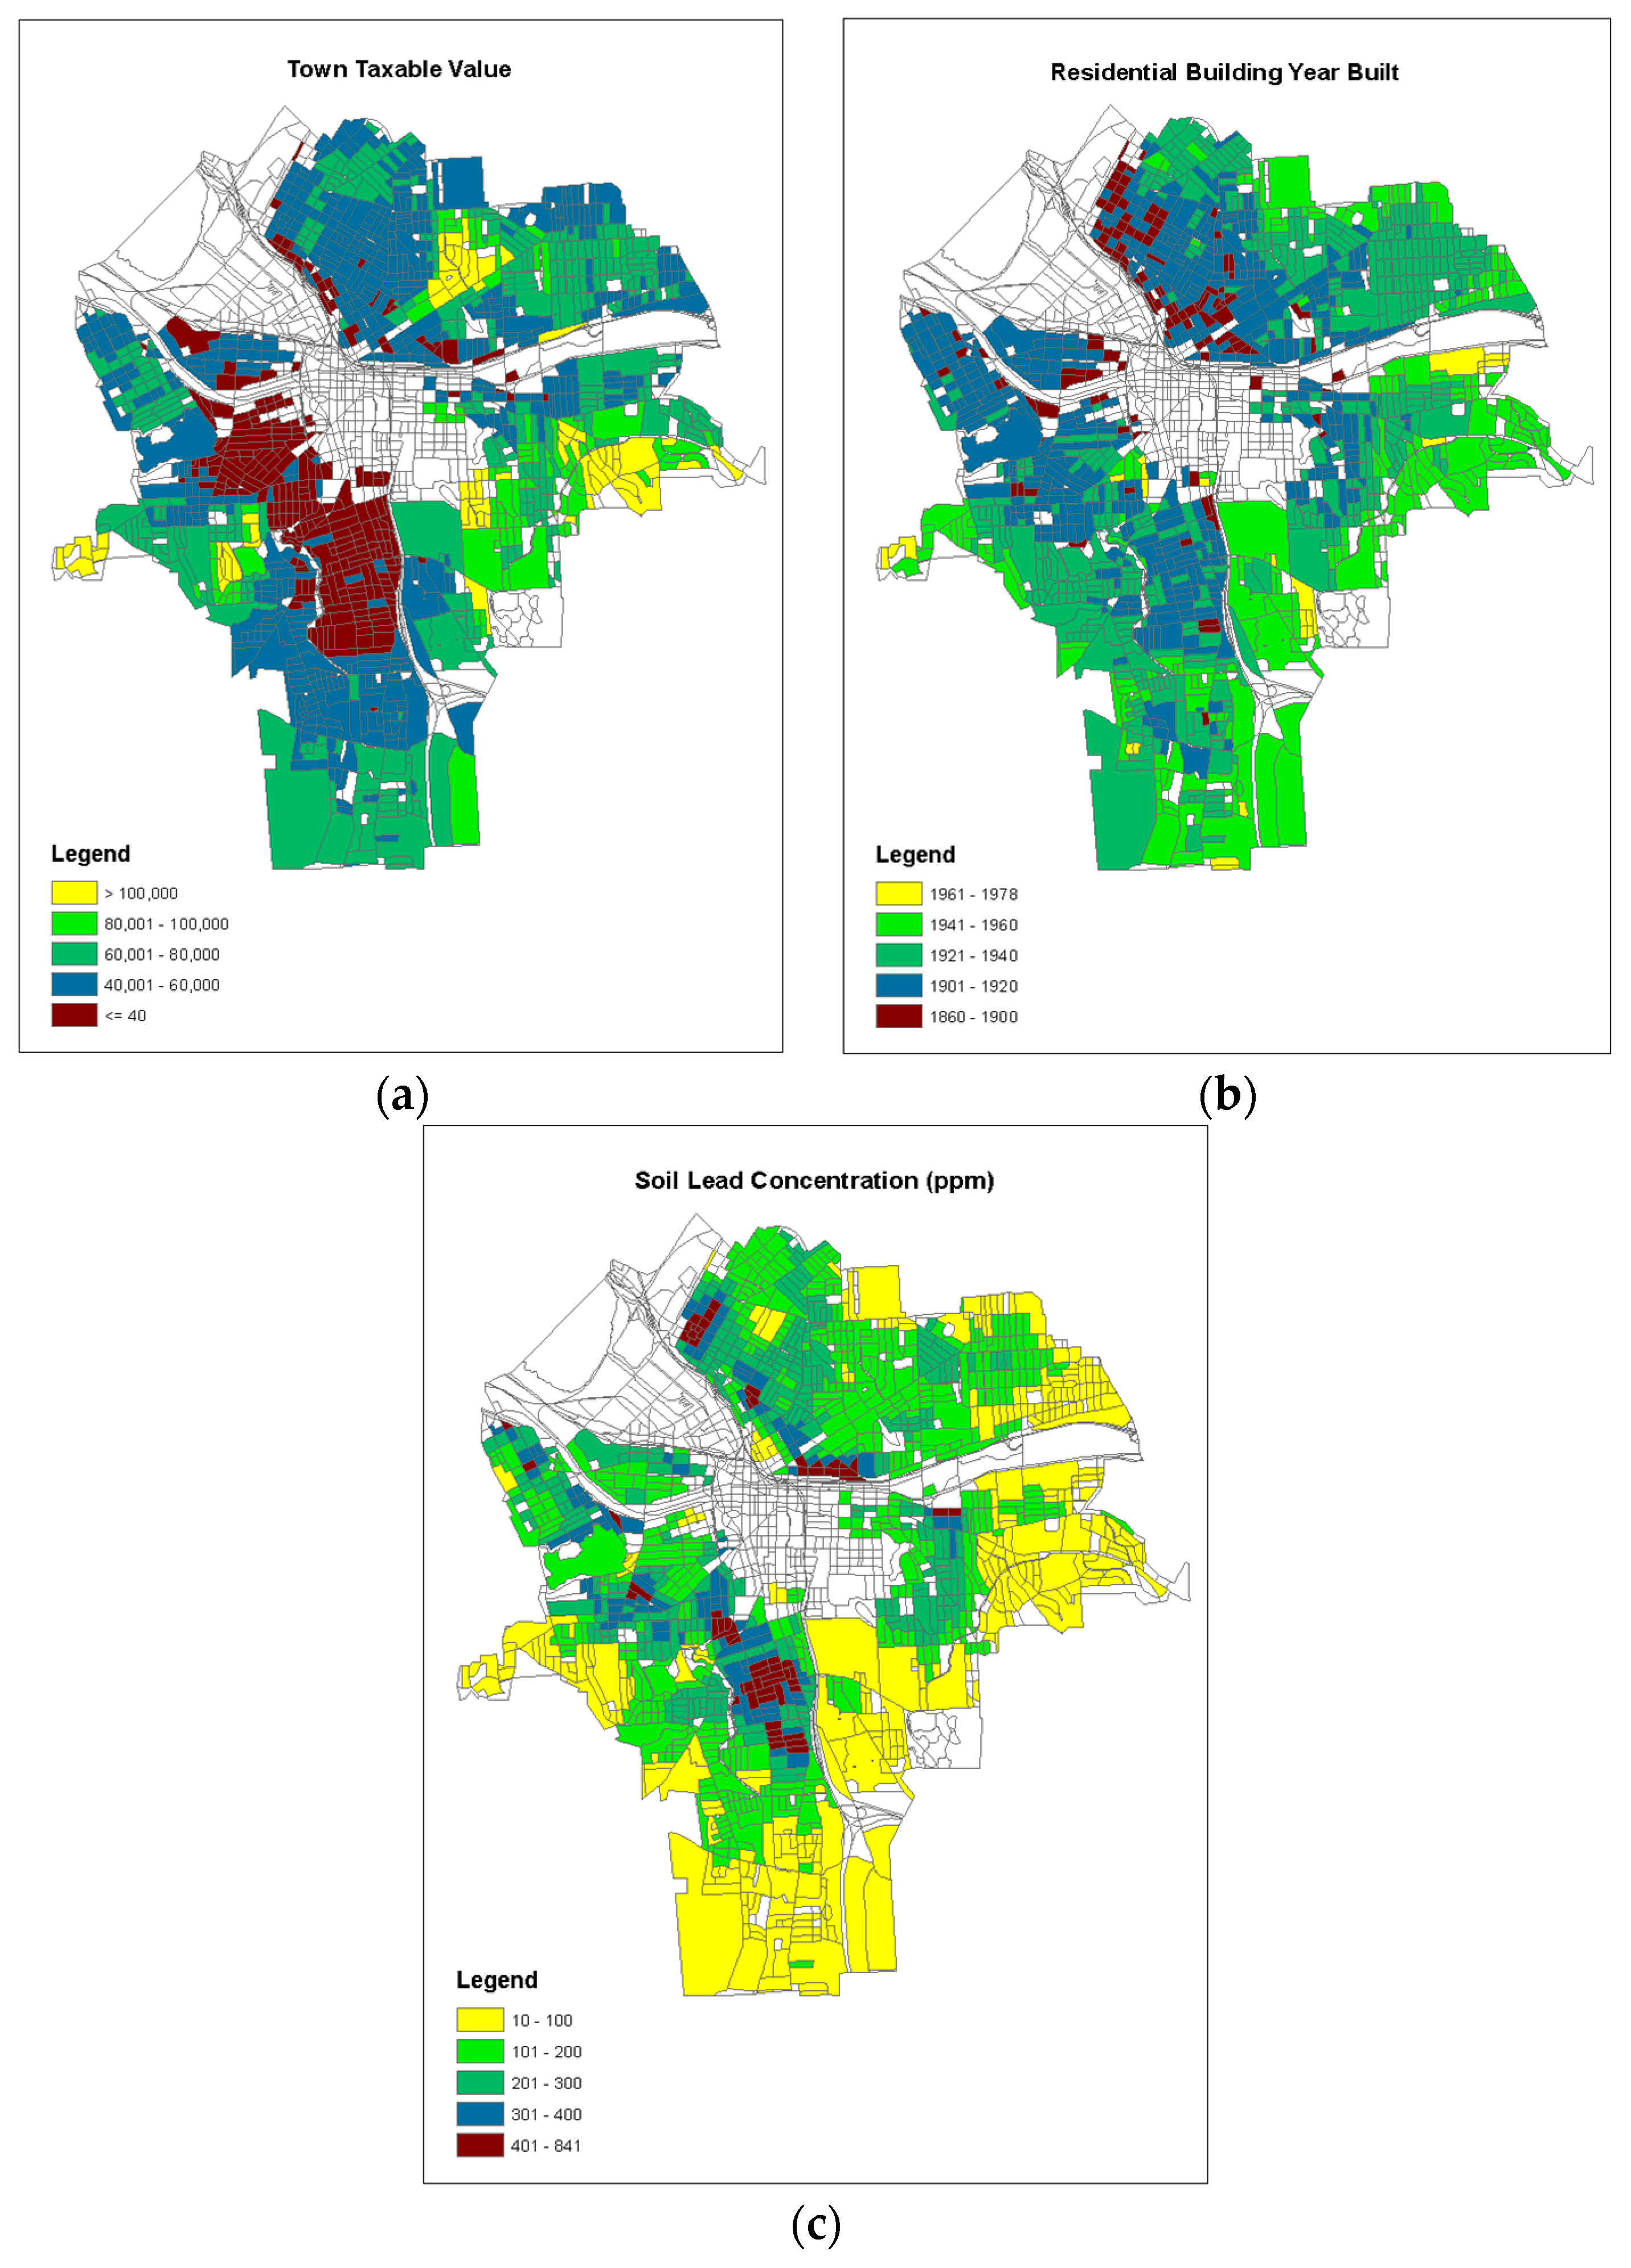
3.1. Data
3.2. Methods
3.2.1. Regression Model
3.2.2. Bandwidth Selection for GWQR
3.2.3. Assessment of Spatial Nonstationary
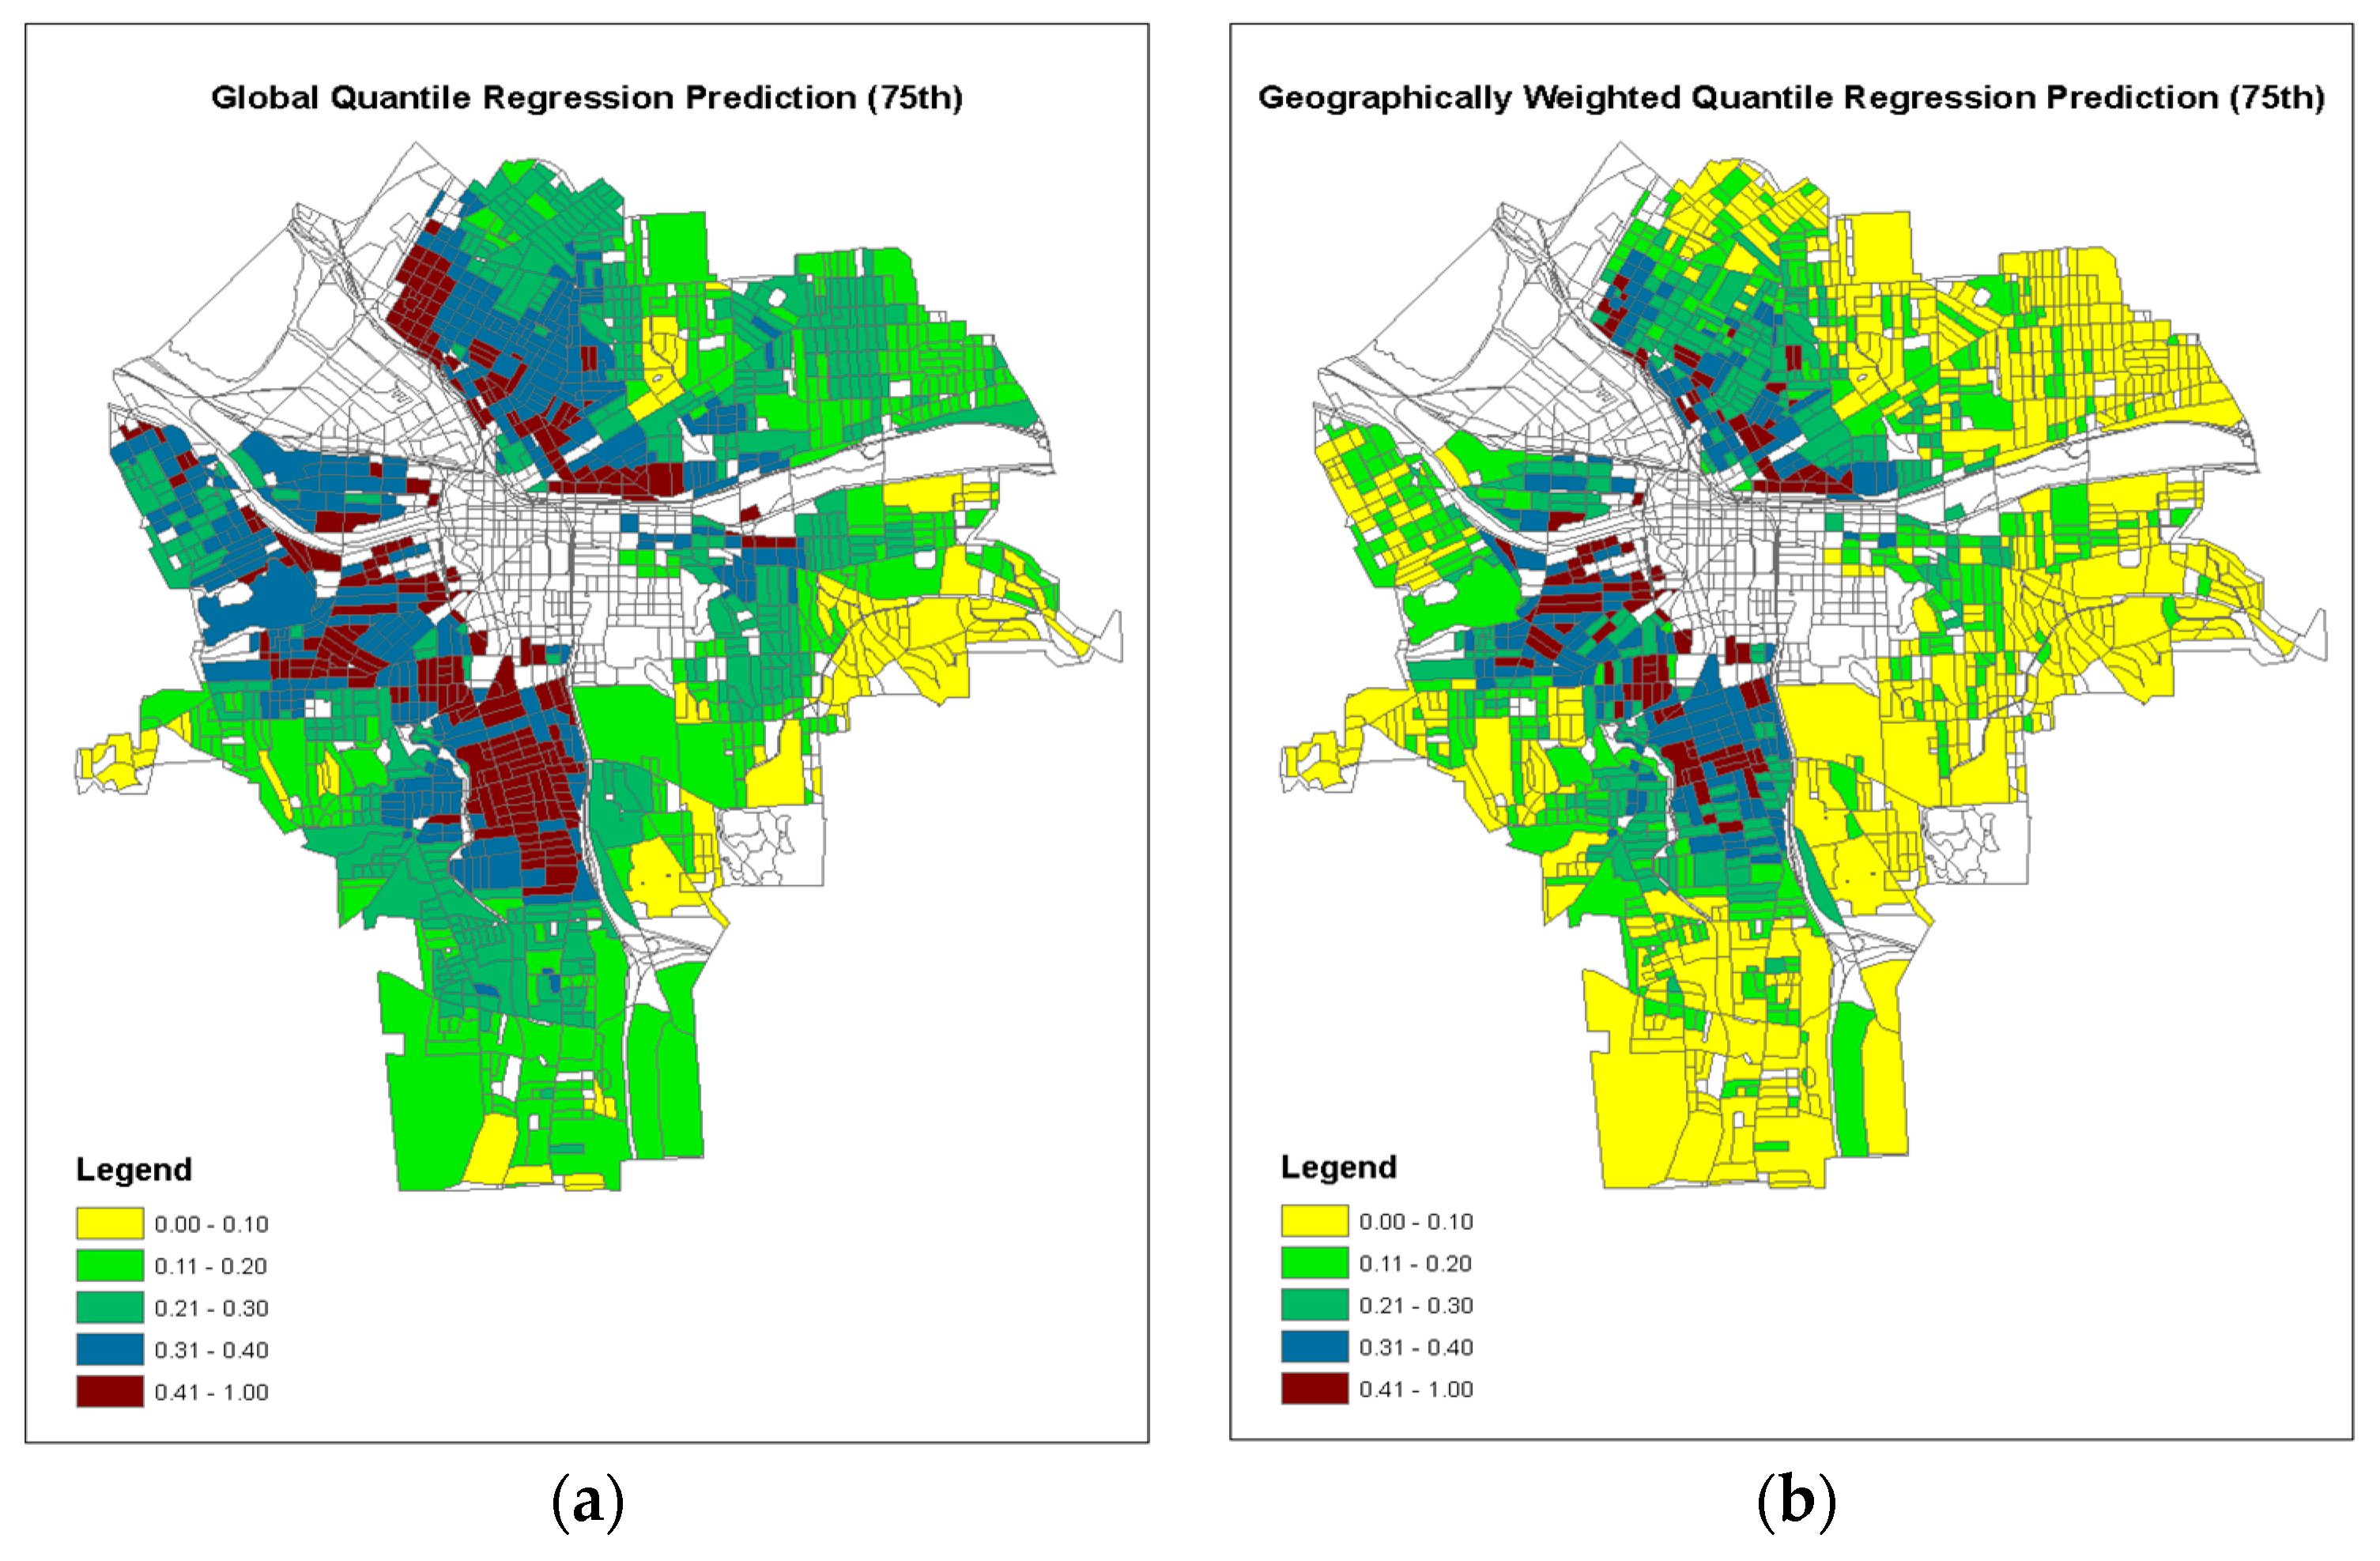
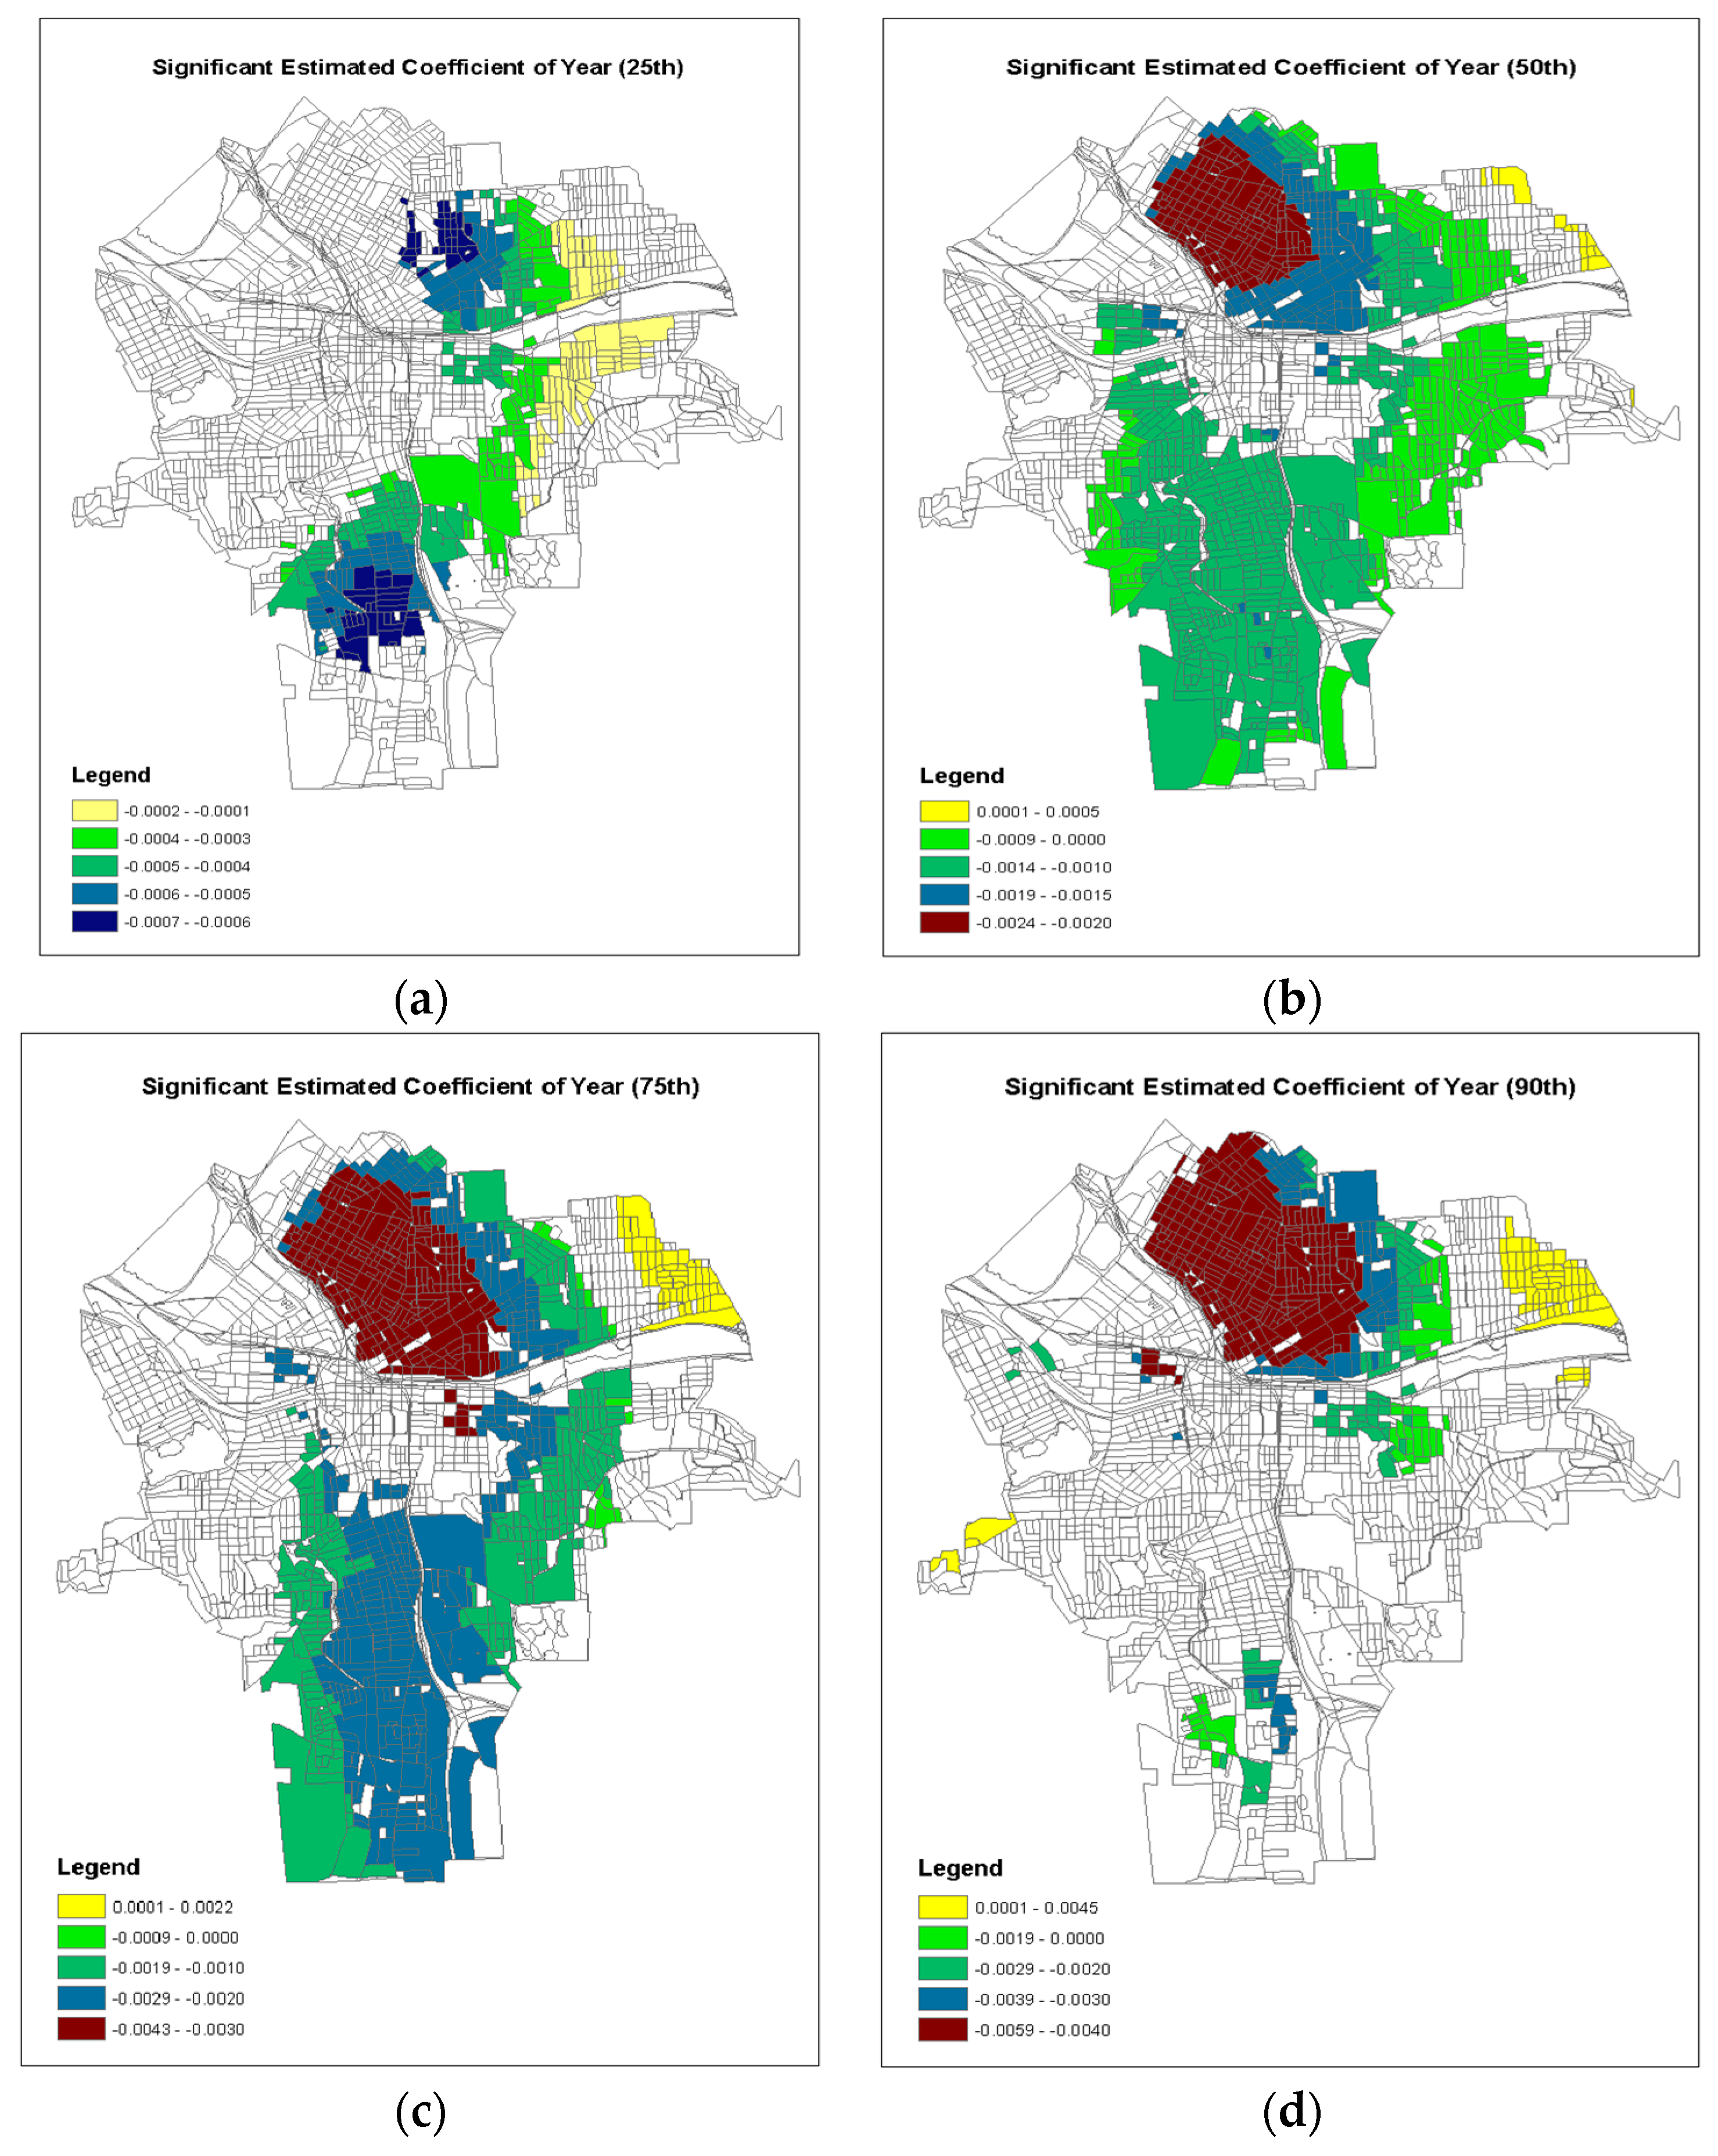
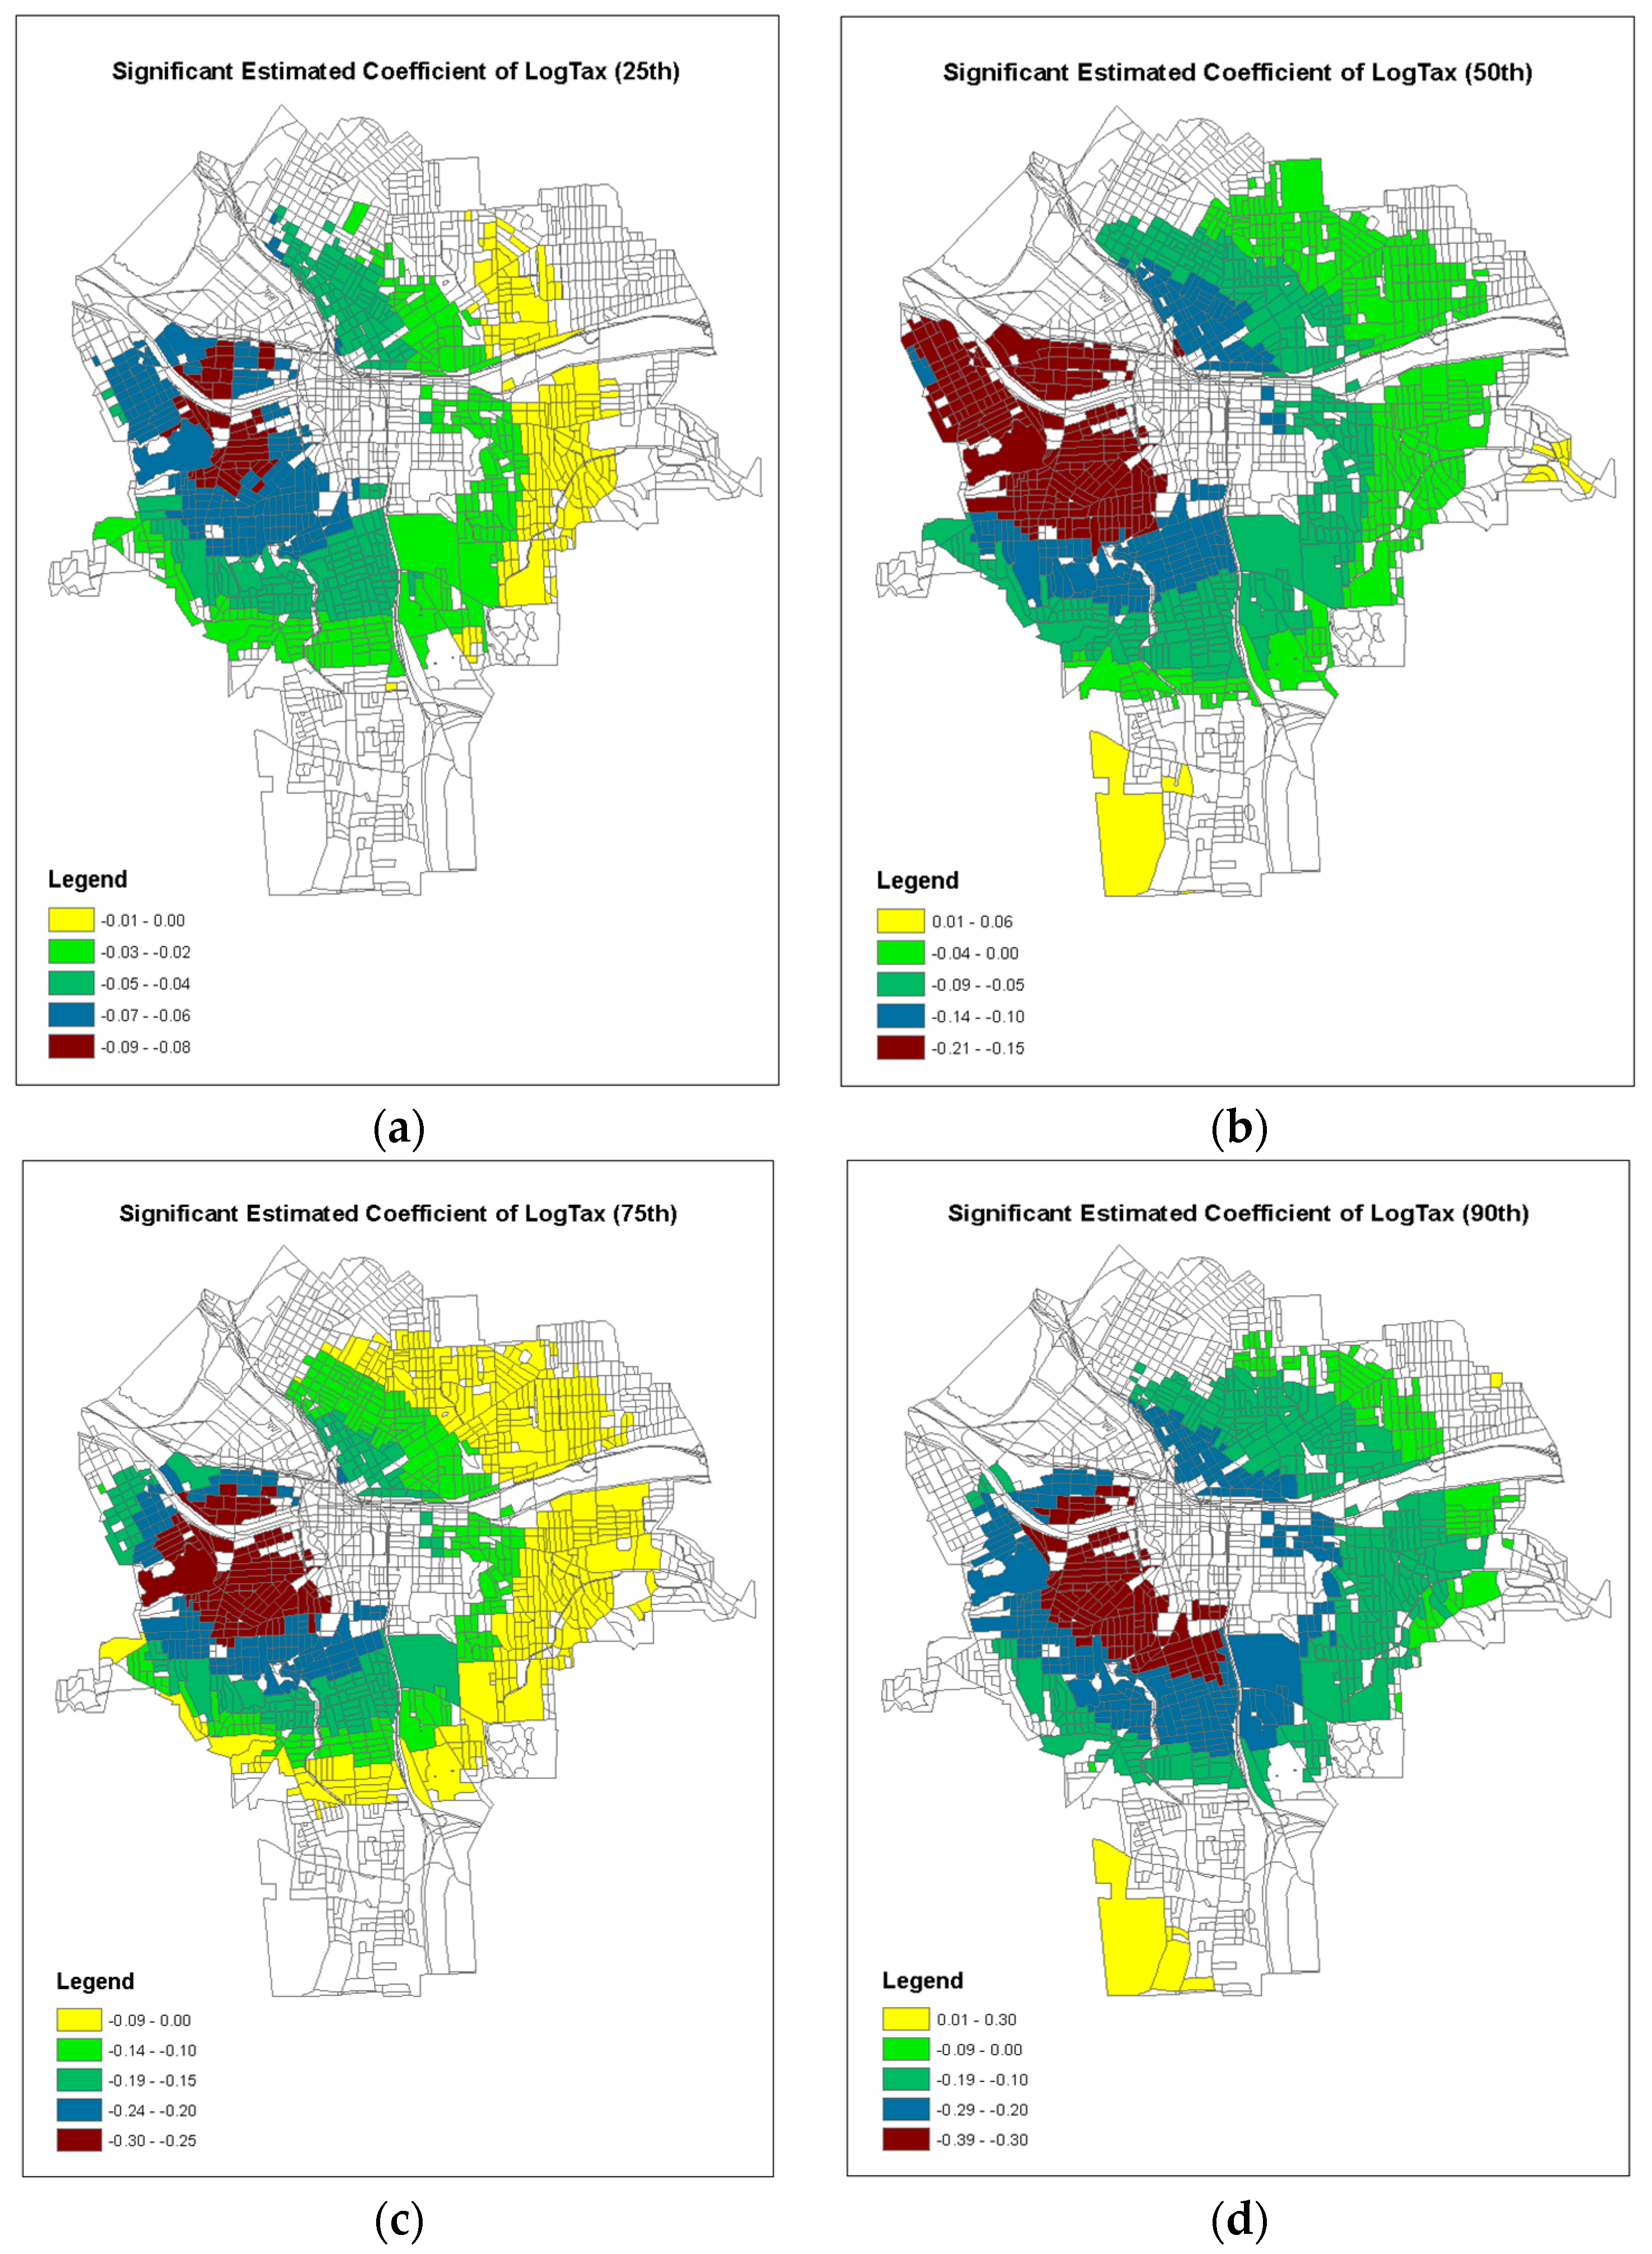
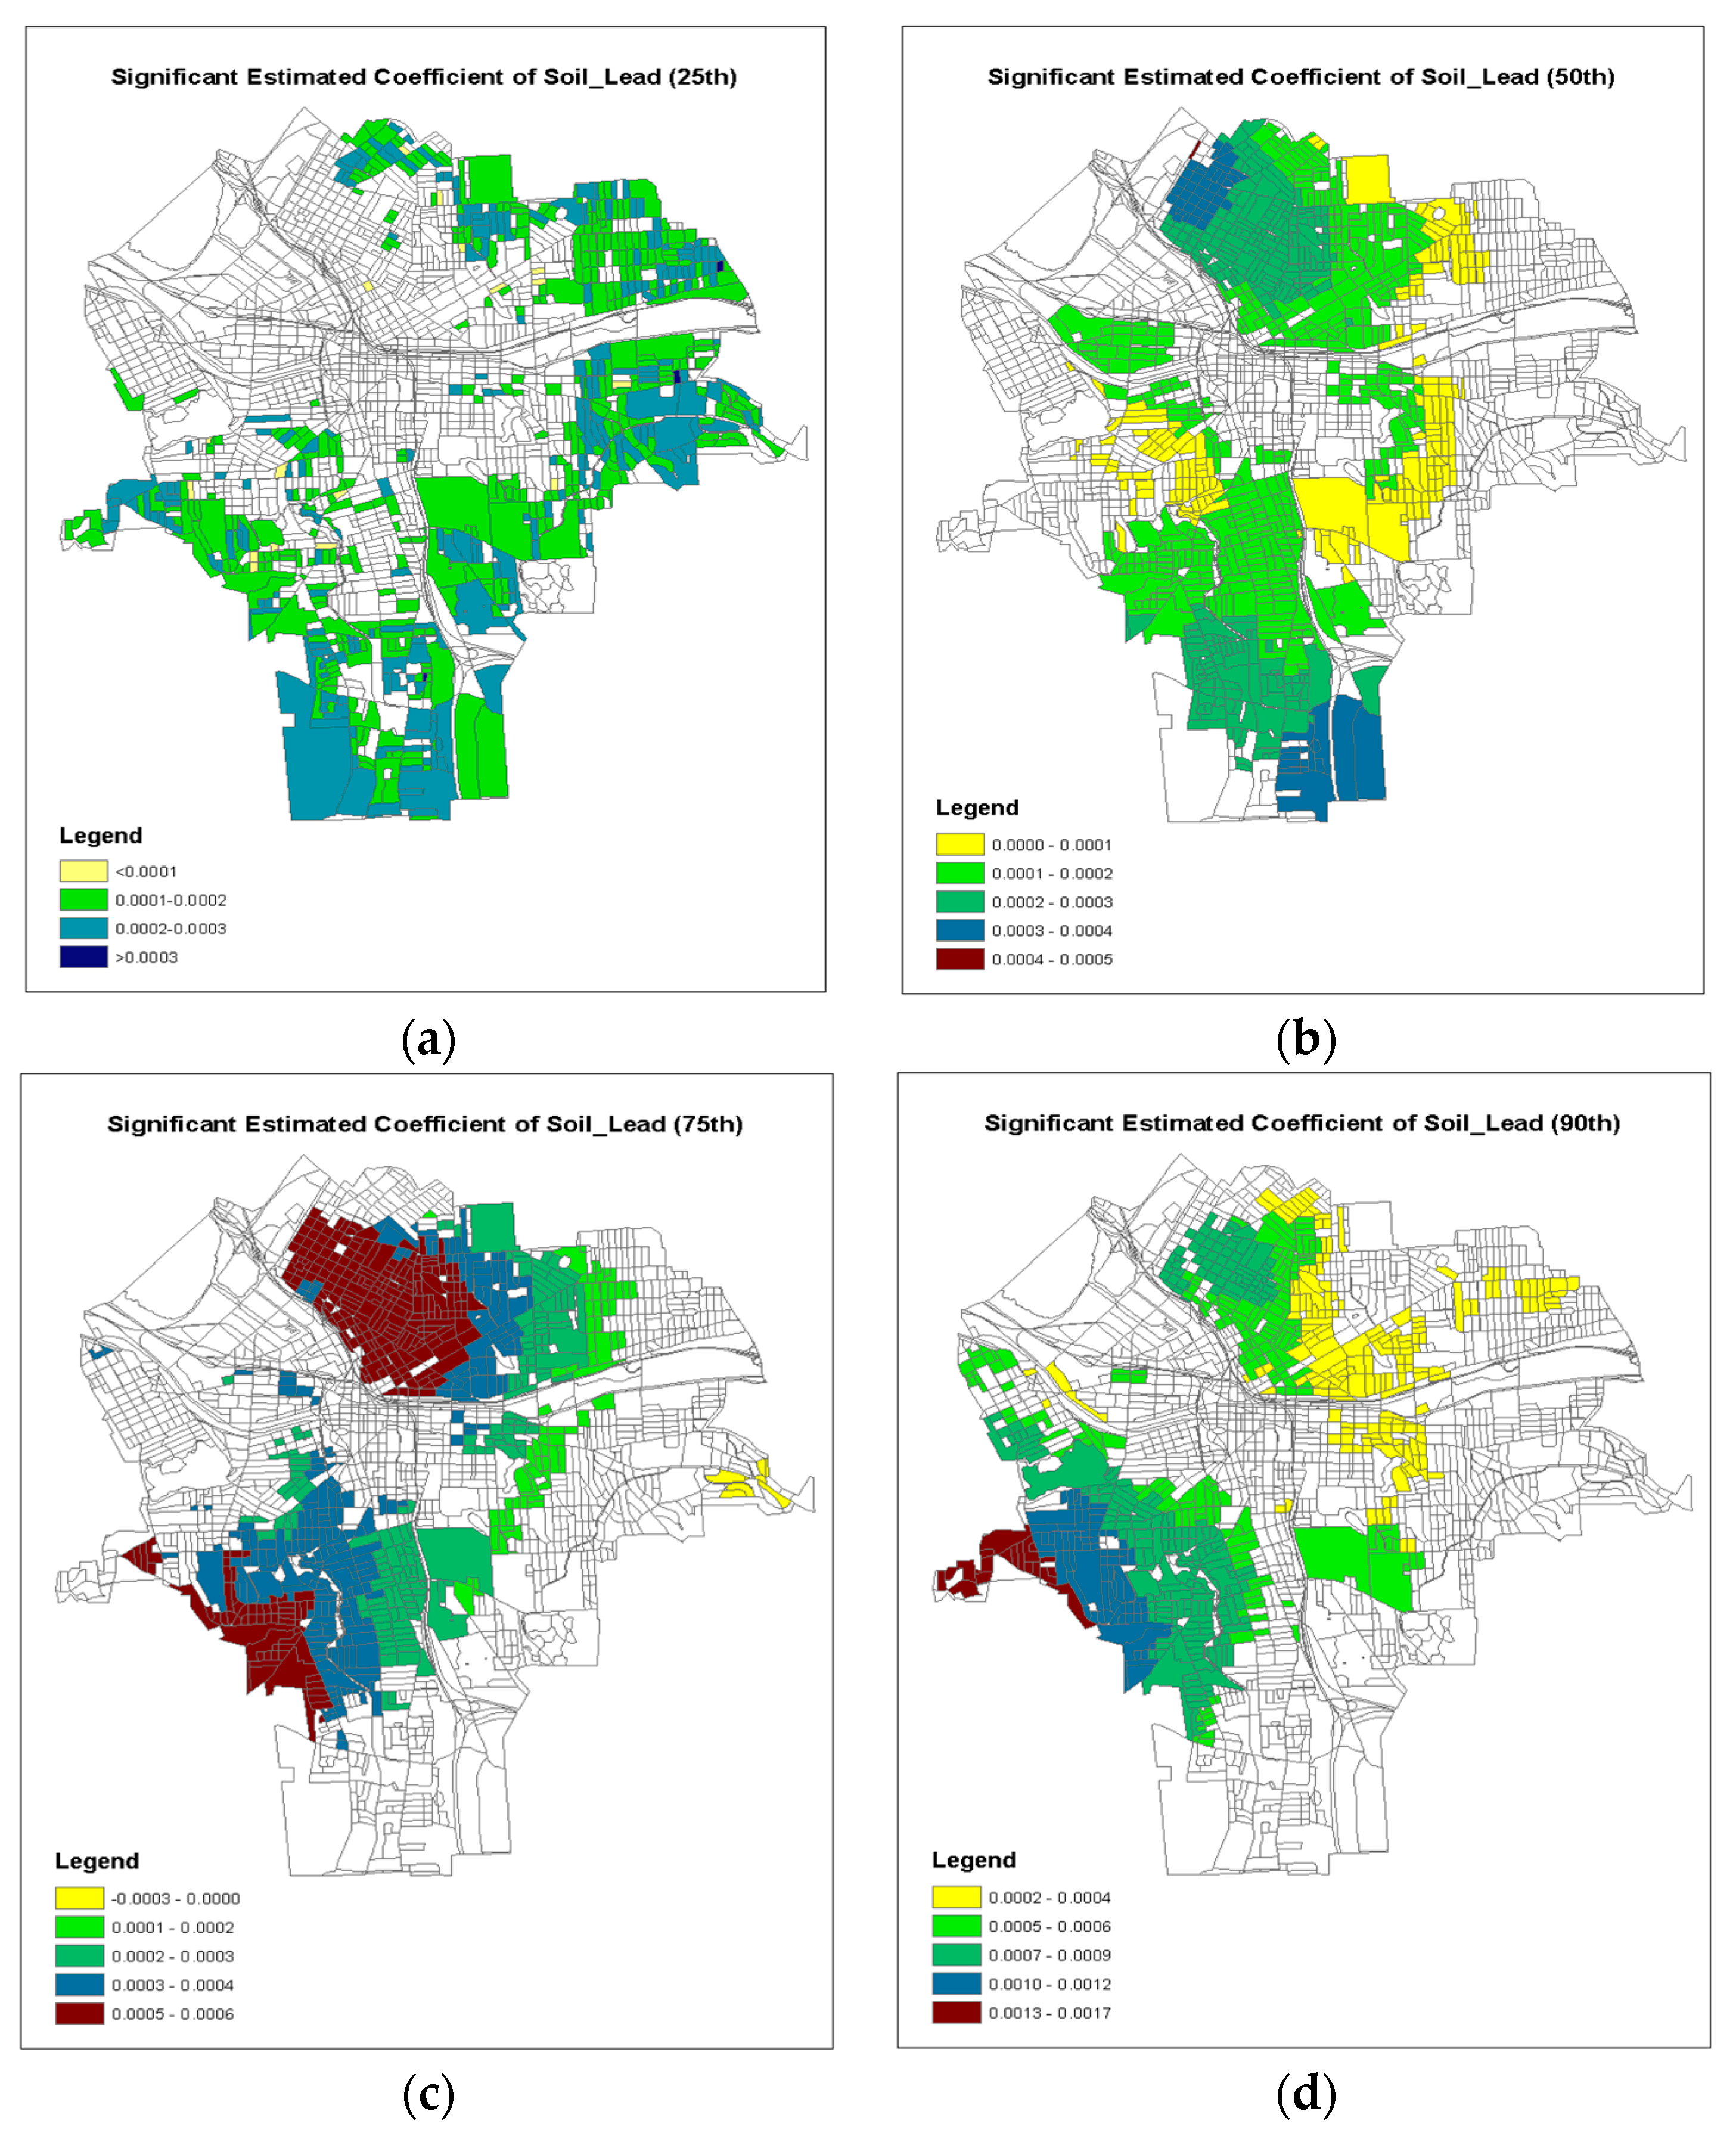
4. Results
5. Discussion
6. Conclusions
Author Contributions
Funding
Acknowledgments
Conflicts of Interest
References
- Obeng-Gyasi, E. Lead exposure and oxidative stress—A life course approach in US adults. Toxics 2018, 6, 42. [Google Scholar] [CrossRef] [PubMed]
- Dietrich, K.N.; Ris, M.D.; Succop, P.A.; Berger, O.G.; Bornschein, R.L. Early exposure to lead and juvenile delinquency. Neurotoxicol. Teratol. 2001, 23, 511–518. [Google Scholar] [CrossRef]
- Canfield, R.L.; Henderson, C.R.; Cory-Slechta, D.A.; Cox, C.; Jusko, T.A.; Lanphear, B.P. Intellectual impairment in children with blood lead concentrations below 10 µg per deciliter. N. Engl. J. Med. 2003, 348, 1517–1526. [Google Scholar] [CrossRef] [PubMed]
- Chiodo, L.M.; Jacobson, S.W.; Jacobson, J.L. Neurodevelopmental effects of postnatal lead exposure at very low levels. Neurotoxicol. Teratol. 2004, 26, 359–371. [Google Scholar] [CrossRef] [PubMed]
- Lanphear, B.P. Cognitive deficits associated with blood lead concentrations. Public Health Rep. 2000, 115, 521–529. [Google Scholar] [CrossRef] [PubMed]
- Pocock, S.J.; Smith, M.; Baghurst, P. Environmental lead and children’s intelligence: A systematic review of the epidemiological evidence. BMJ 1994, 309, 1189–1197. [Google Scholar] [CrossRef] [PubMed]
- Wasserman, G.A.; Staghezza-Jaramillo, B.; Shrout, P.; Popovac, D.; Graziano, J. The effect of lead exposure on behavior problems in preschool children. Am. J. Public Health 1998, 88, 481–486. [Google Scholar] [CrossRef] [PubMed]
- Lanphear, B.P.; Roghmann, K.J. Pathways of lead exposure in urban children. Environ. Res. 1997, 74, 67–73. [Google Scholar] [CrossRef] [PubMed]
- Markowitz, M. Lead poisoning. Pediatr. Rev. 2000, 21, 327–335. [Google Scholar] [CrossRef] [PubMed]
- Jusko, T.; Henderson, C.; Lanphear, B.; Cory-Slechta, D.; Parsons, P.; Canfield, R. Blood lead concentrations <10 g/dL and child intelligence at 6 years of age. Environ. Health Perspect. 2008, 116, 243–248. [Google Scholar] [CrossRef] [PubMed]
- Shao, L.; Zhang, L.; Zhen, Z. Exploring spatially varying relationships between children’s lead poisoning and environmental factors. Ann. N. Y. Acad. Sci. 2017, 1404, 49–60. [Google Scholar] [CrossRef] [PubMed]
- Betts, K.S. CDC Updates Guidelines for Children’s Lead Exposure. Environ. Health Perspect. 2012, 120, a268. [Google Scholar] [CrossRef] [PubMed]
- Centers for Disease Control and Prevention (CDC). Blood lead levels—United States, 1999−2002. MMWR Morb. Mortal. Wkly. Rep. 2005, 54, 513–516. [Google Scholar]
- Jones, R.L.; Homa, D.M.; Meyer, P.A.; Brody, D.J.; Caldwell, K.L.; Pirkle, J.L. Trends in blood lead levels and blood lead testing among US children aged 1 to 5 years, 1988−2004. Pediatrics 2009, 123, e376–e385. [Google Scholar] [CrossRef] [PubMed]
- Meyer, P.A.; Pivetz, T.; Dignam, T.A.; Homa, D.M.; Schoonover, J.; Brody, D. Surveillance for elevated blood lead levels among children—United States, 1997−2001. MMWR Surveill. Summ. 2003, 52, 1–21. [Google Scholar] [PubMed]
- Shao, L. The Temporal and Spatial Modeling of Children’s Lead Poisoning in Syracuse, New York. Ph.D. Thesis, SUNY-ESF, Syracuse, New York, NY, USA, 2013. [Google Scholar]
- Shao, L.; Zhang, L.; Zhen, Z. Interrupted time series analysis of children’s blood lead levels: A case study of lead hazard control program in Syracuse, New York. PLoS ONE 2017, 12, e0171778. [Google Scholar] [CrossRef] [PubMed]
- Moody, H.; Grady, S.C. Lead emissions and population vulnerability in the Detroit (Michigan, USA) metropolitan area, 2006–2013: A spatial and temporal analysis. Int. J. Environ. Res. Public Health 2017, 14, 1445. [Google Scholar] [CrossRef] [PubMed]
- Griffith, D.A.; Doyle, P.G.; Wheeler, D.C.; Johnson, D.L. A tale of two swaths: Urban childhood blood-lead levels across Syracuse, New York. Ann. Assoc. Am. Geogr. 1998, 88, 640–665. [Google Scholar] [CrossRef]
- Sargent, J.D.; Brown, M.J.; Freeman, J.L.; Bailey, A.; Goodman, D.; Freeman, D.H. Childhood lead poisoning in Massachusetts communities: Its association with sociodemographic and housing characteristics. Am. J. Public Health 1995, 85, 528–534. [Google Scholar] [CrossRef] [PubMed]
- Haley, V.B.; Talbot, T.O. Geographic analysis of blood lead levels in New York State children born 1994−1997. Environ. Health Perspect. 2004, 112, 1577–1582. [Google Scholar] [CrossRef] [PubMed]
- Morrison, D.; Lin, Q.; Wiehe, S.; Liu, G.; Rosenman, M.; Fuller, T. Spatial relationships between lead sources and children’s blood lead levels in the urban center of Indianapolis (USA). Environ. Geochem. Health 2013, 35, 171–183. [Google Scholar] [CrossRef] [PubMed]
- Griffith, D.A.; Johnson, D.L.; Hunt, A. The geographic distribution of metals in urban soils: The case of Syracuse, NY. GeoJournal 2009, 74, 275–291. [Google Scholar] [CrossRef]
- Elliott, P.; Wartenberg, D. Spatial epidemiology: Current approaches and future challenges. Environ. Health Perspect. 2004, 112, 998–1006. [Google Scholar] [CrossRef] [PubMed]
- Yang, T.C.; Shoff, C.; Noah, A.J. Spatializing health research: What we know and where we are heading. Geosp. Health 2013, 7, 161–168. [Google Scholar] [CrossRef] [PubMed]
- Shoff, C.; Chen, V.Y.J.; Yang, T.C. When homogeneity meets heterogeneity: The geographically weighted regression with spatial lag approach to prenatal care utilization. Geosp. Health 2014, 8, 557–568. [Google Scholar] [CrossRef] [PubMed]
- Comber, A.; Brunsdon, C.; Radburn, R. A spatial analysis of variations in health access: Linking geography, socio-economic status and access perceptions. Int. J. Health Geogr. 2011, 10, 44. [Google Scholar] [CrossRef] [PubMed]
- Fotheringham, A.S.; Charlton, M.E.; Brunsdon, C. Geographically weighted regression: A natural evolution of the expansion method for spatial data analysis. Environ. Plan. A 1998, 30, 1905–1927. [Google Scholar] [CrossRef]
- Fotheringham, A.S.; Bunsdon, C.A.; Charlton, M.E. Geographically Weighted Regression: The Analysis of Spatially Varying Relationships; John Wiley & Sons: New York, NY, USA, 2002; pp. 83–102. [Google Scholar]
- Gelfand, A.E.; Kim, H.; Sirmans, C.F.; Banerjee, S. Spatial modeling with spatially varying coefficient processes. JASA 2003, 98, 387–396. [Google Scholar] [CrossRef]
- Goovaerts, P.; Xiao, H.; Adunlin, G.; Ali, A.; Tan, F.; Gwede, C.K.; Huang, Y. Geographically weighted regression analysis of percentage of late-stage prostate cancer diagnosis in Florida. Appl. Geogr. 2015, 62, 191–200. [Google Scholar] [CrossRef] [PubMed]
- Lin, C.H.; Wen, T.H. Using geographically weighted regression (GWR) to explore spatial varying relationships of immature mosquitoes and human densities with the incidence of dengue. Int. J. Environ. Res. Public Health 2011, 8, 2798–2815. [Google Scholar] [CrossRef] [PubMed]
- Ma, Z.; Zuckerberg, B.; Porter, W.F.; Zhang, L. Spatial Poisson models for examining the influence of climate and land cover pattern on bird species richness. For. Sci. 2012, 58, 61–74. [Google Scholar] [CrossRef]
- Nakaya, T.; Fotheringham, A.S.; Brunsdon, C.; Charlton, M. Geographically weighted Poisson regression for disease association mapping. Stat. Med. 2005, 24, 2695–2717. [Google Scholar] [CrossRef] [PubMed]
- Yu, K.; Lu, Z.; Stander, J. Quantile regression: Applications and current research areas. J. R. Stat. Soc. A Stat. 2010, 52, 331–350. [Google Scholar] [CrossRef]
- Cade, B.S.; Terrell, J.W.; Schroeder, R.L. Estimating effects of limiting factors with regression quantiles. Ecology 1999, 80, 311–323. [Google Scholar] [CrossRef]
- Cade, B.S.; Noon, B.R. A gentle introduction to quantile regression for ecologists. Front. Ecol. Environ. 2003, 1, 412–420. [Google Scholar] [CrossRef]
- Koenker, R.; Bassett, G. Regression quantiles. Econometrica 1978, 46, 33–50. [Google Scholar] [CrossRef]
- Zhang, L.; Bi, H.; Gove, J.H.; Heath, L.S. A comparison of alternative methods for estimating the self-thinning boundary line. Can. J. For. Res. 2005, 35, 1507–1514. [Google Scholar] [CrossRef]
- Koenker, R.; Hallock, K.F. Quantile regression: An introduction. J. Econ. Perspect. 2001, 15, 143–156. [Google Scholar] [CrossRef]
- Levin, J. For whom the reductions count: A quantile regression analysis of class size and peer effects on scholastic achievement. EMP Econ. 2001, 26, 221–246. [Google Scholar] [CrossRef]
- Wei, Y.; Pere, A.; Koenker, R.; He, X. Quantile regression methods for reference growth charts. Stat. Med. 2006, 25, 1369–1382. [Google Scholar] [CrossRef] [PubMed]
- Buhai, I.S. Quantile regression: Overview and selected applications. Adv. Astra 2005, 4, 1–17. [Google Scholar]
- Chen, V.Y.J.; Deng, W.S.; Yang, T.; Matthews, S.A. Geographically weighted quantile regression (GWQR): An application to U.S. mortality data. Geogr. Anal. 2012, 44, 134–150. [Google Scholar] [CrossRef] [PubMed]
- Koenker, R. Quantile Regression; Cambridge University Press: Cambridge, UK, 2005. [Google Scholar]
- Chen, C.; Wei, Y. Computational issues for quantile regression. Sankhyā 2005, 67, 399–417. [Google Scholar]
- Centers for Disease Control and Prevention (CDC). Blood lead levels in children aged 1−5 years—United States, 1999−2010. MMWR Morb. Mortal. Wkly. Rep. 2013, 62, 245–248. [Google Scholar]
- Johnson, D.L.; Bretsch, J.K. Soil lead and children’s blood lead levels in Syracuse, NY, USA. Environ. Geochem. Health 2002, 24, 375–385. [Google Scholar] [CrossRef]
- Shmueli, G. To explain or to predict? Stat. Sci. 2010, 25, 289–310. [Google Scholar] [CrossRef]
- SAS. STAT 9.4; Software for Data Management, and Predictive Analytics; SAS Institute, Inc.: Cary, NC, USA, 2013. [Google Scholar]
- Chen, V.Y.J.; Yang, T.C. SAS macro programs for geographically weighted generalized linear modeling with spatial point data: Applications to health research. Comp. Methods Progr. Biomed. 2012, 107, 262–273. [Google Scholar] [CrossRef] [PubMed]
- Zhen, Z.; Shao, L.; Zhang, L. Spatial hurdle models for predicting the number of children with lead poisoning. Int. J. Environ. Res. Public Health 2018, 15, 1792. [Google Scholar] [CrossRef] [PubMed]
- Bailey, T.C.; Gatrell, A.C. Interactive Spatial Data Analysis; Longman Higher Education: Edinburgh Gate, Harlow, UK, 1995; pp. 143–203. [Google Scholar]
- Chen, V.Y.J.; Wu, P.; Yang, T.; Su, H. Examining non-stationary effects of social determinants on cardiovascular mortality after cold surges in Taiwan. Sci. Total Environ. 2010, 408, 2042–2049. [Google Scholar] [CrossRef] [PubMed]


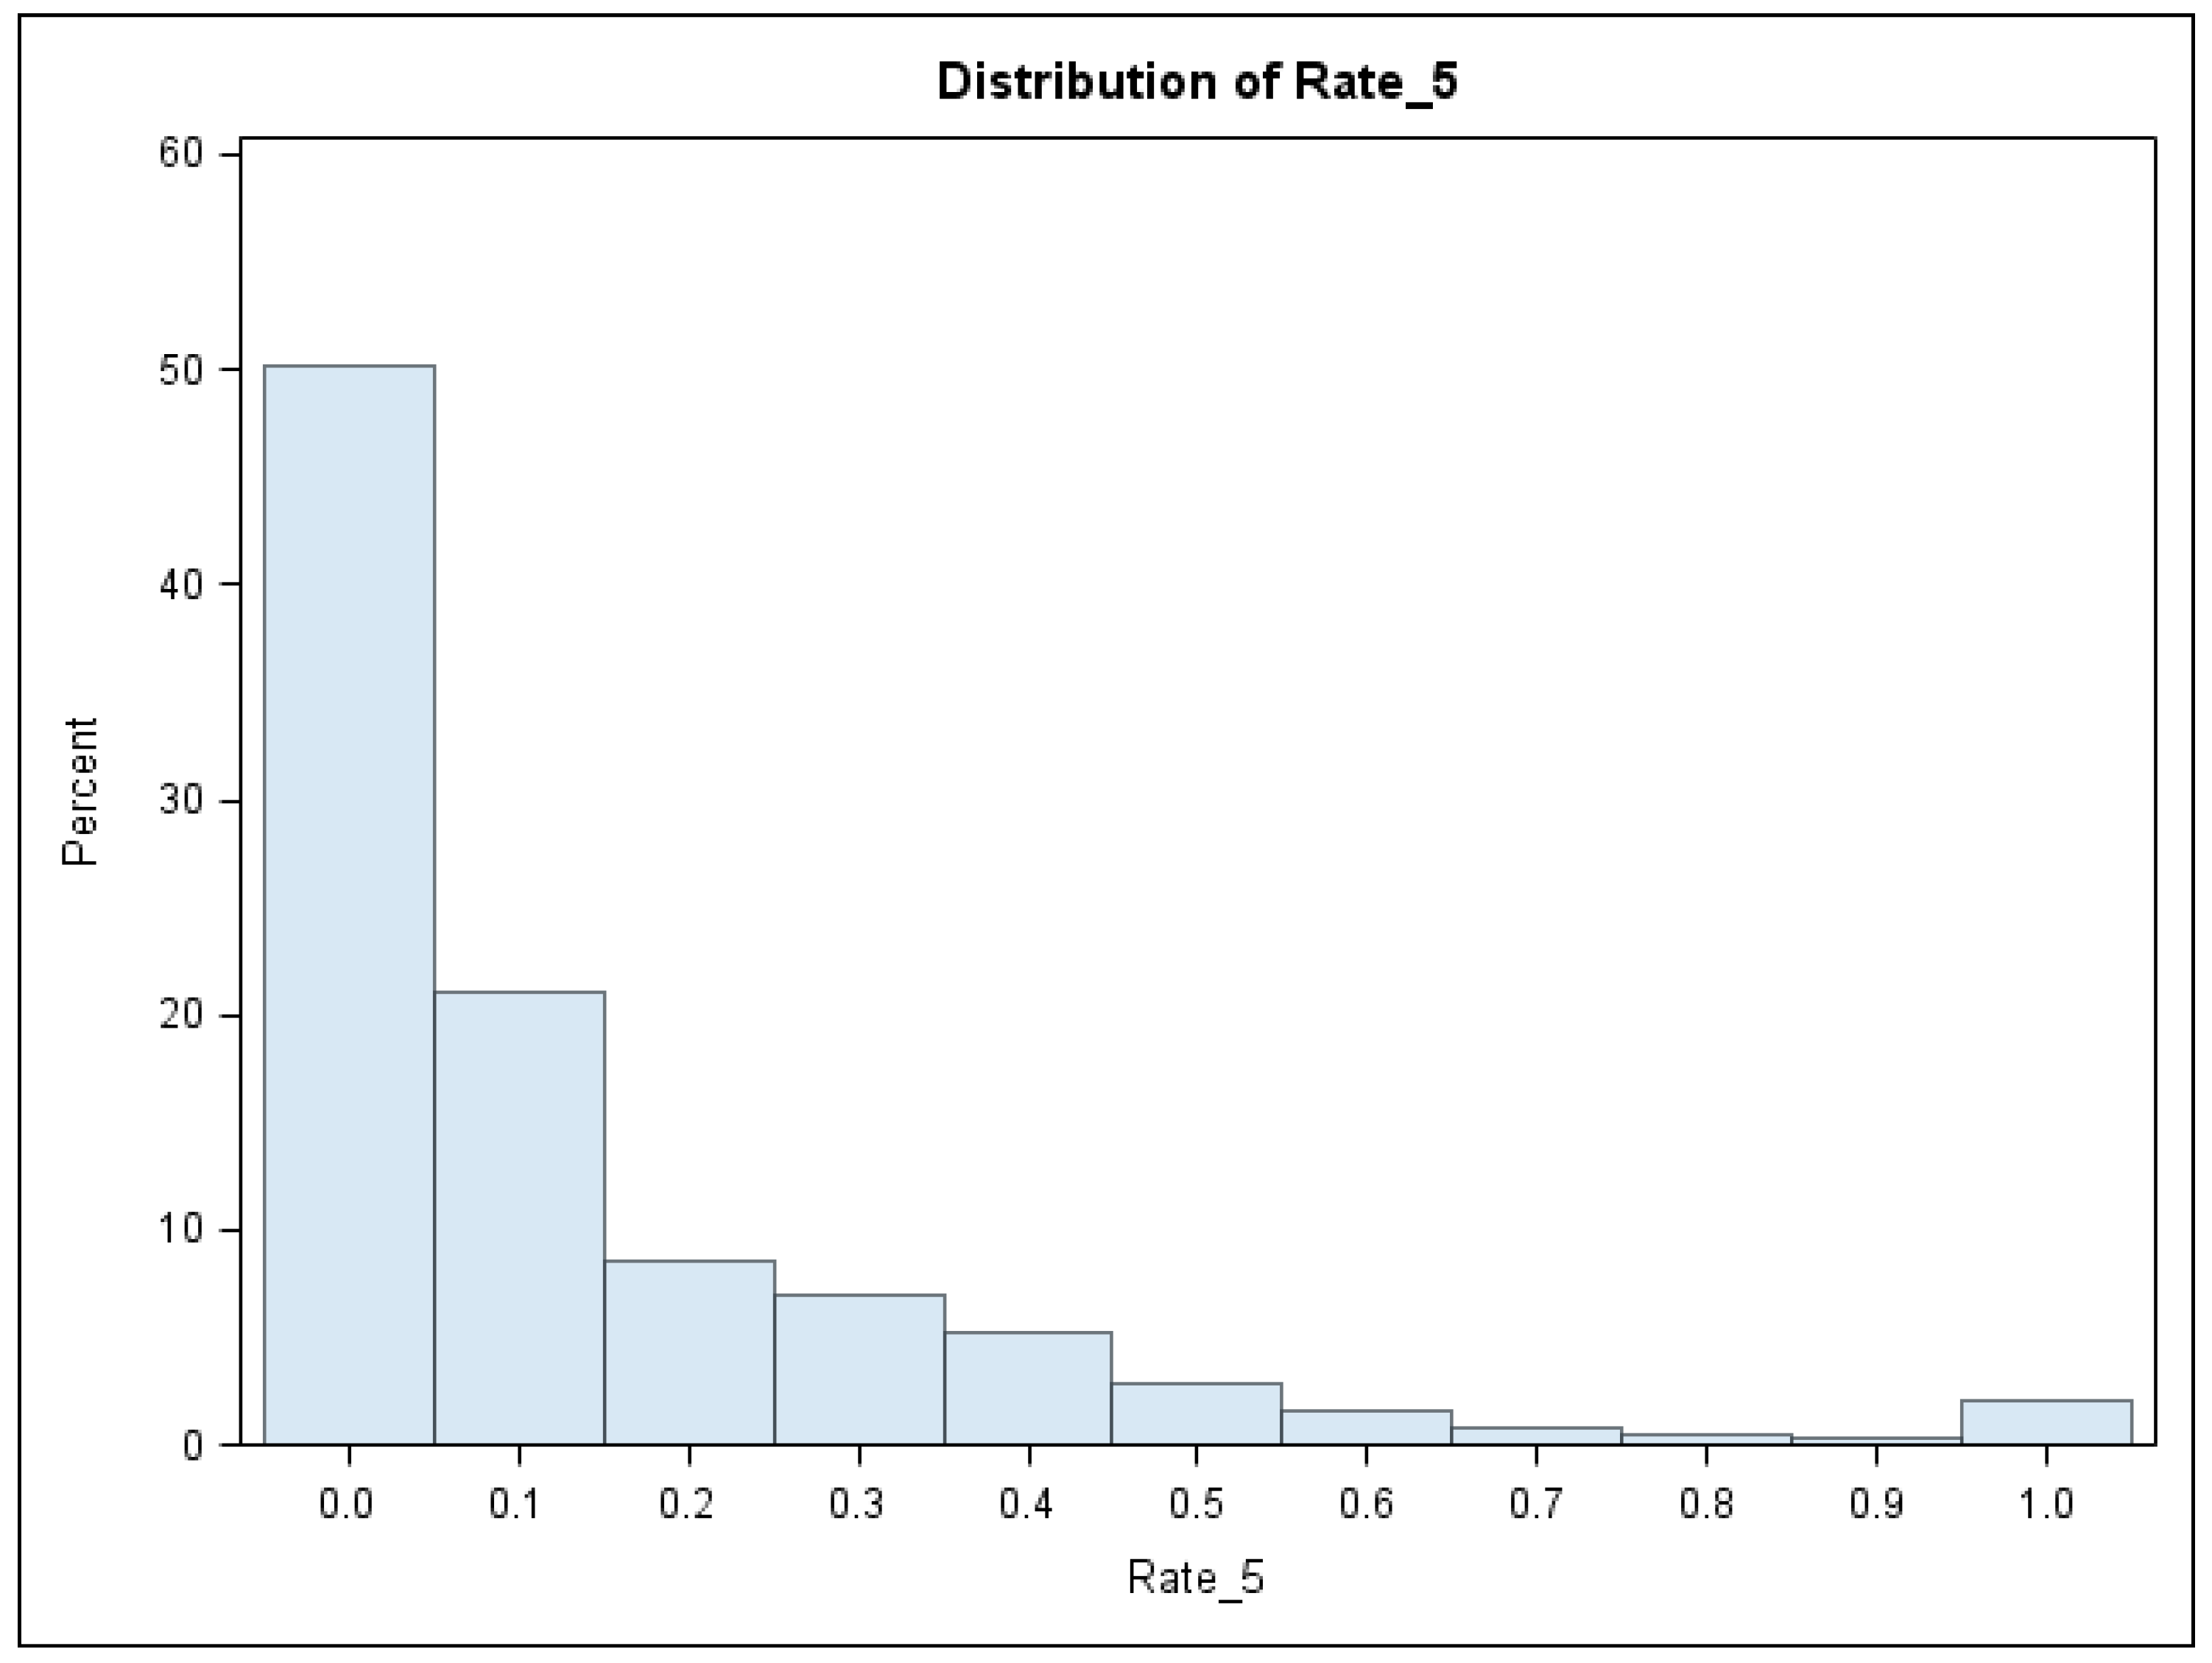
| Variable | Mean | Std Dev | Minimum | Maximum |
|---|---|---|---|---|
| Rate of BLL ≥ 5 µg/dL | 0.1375 | 0.2075 | 0.0 | 1.0 |
| Building Year | 1923 | 17.6 | 1860 | 1978 |
| Town Taxable Values (K$) | 58.445 | 23.815 | 14.000 | 230.106 |
| Soil Lead (ppm) | 185.8 | 112.5 | 10.03 | 840.8 |
| τ | 0.25 | 0.50 | 0.60 | 0.70 | 0.75 | 0.80 | 0.90 | 0.95 | 0.99 | 1.0 |
| ξ(τ) | 0.0 | 0.05 | 0.08 | 0.14 | 0.18 | 0.25 | 0.40 | 0.57 | 1.0 | 1.0 |
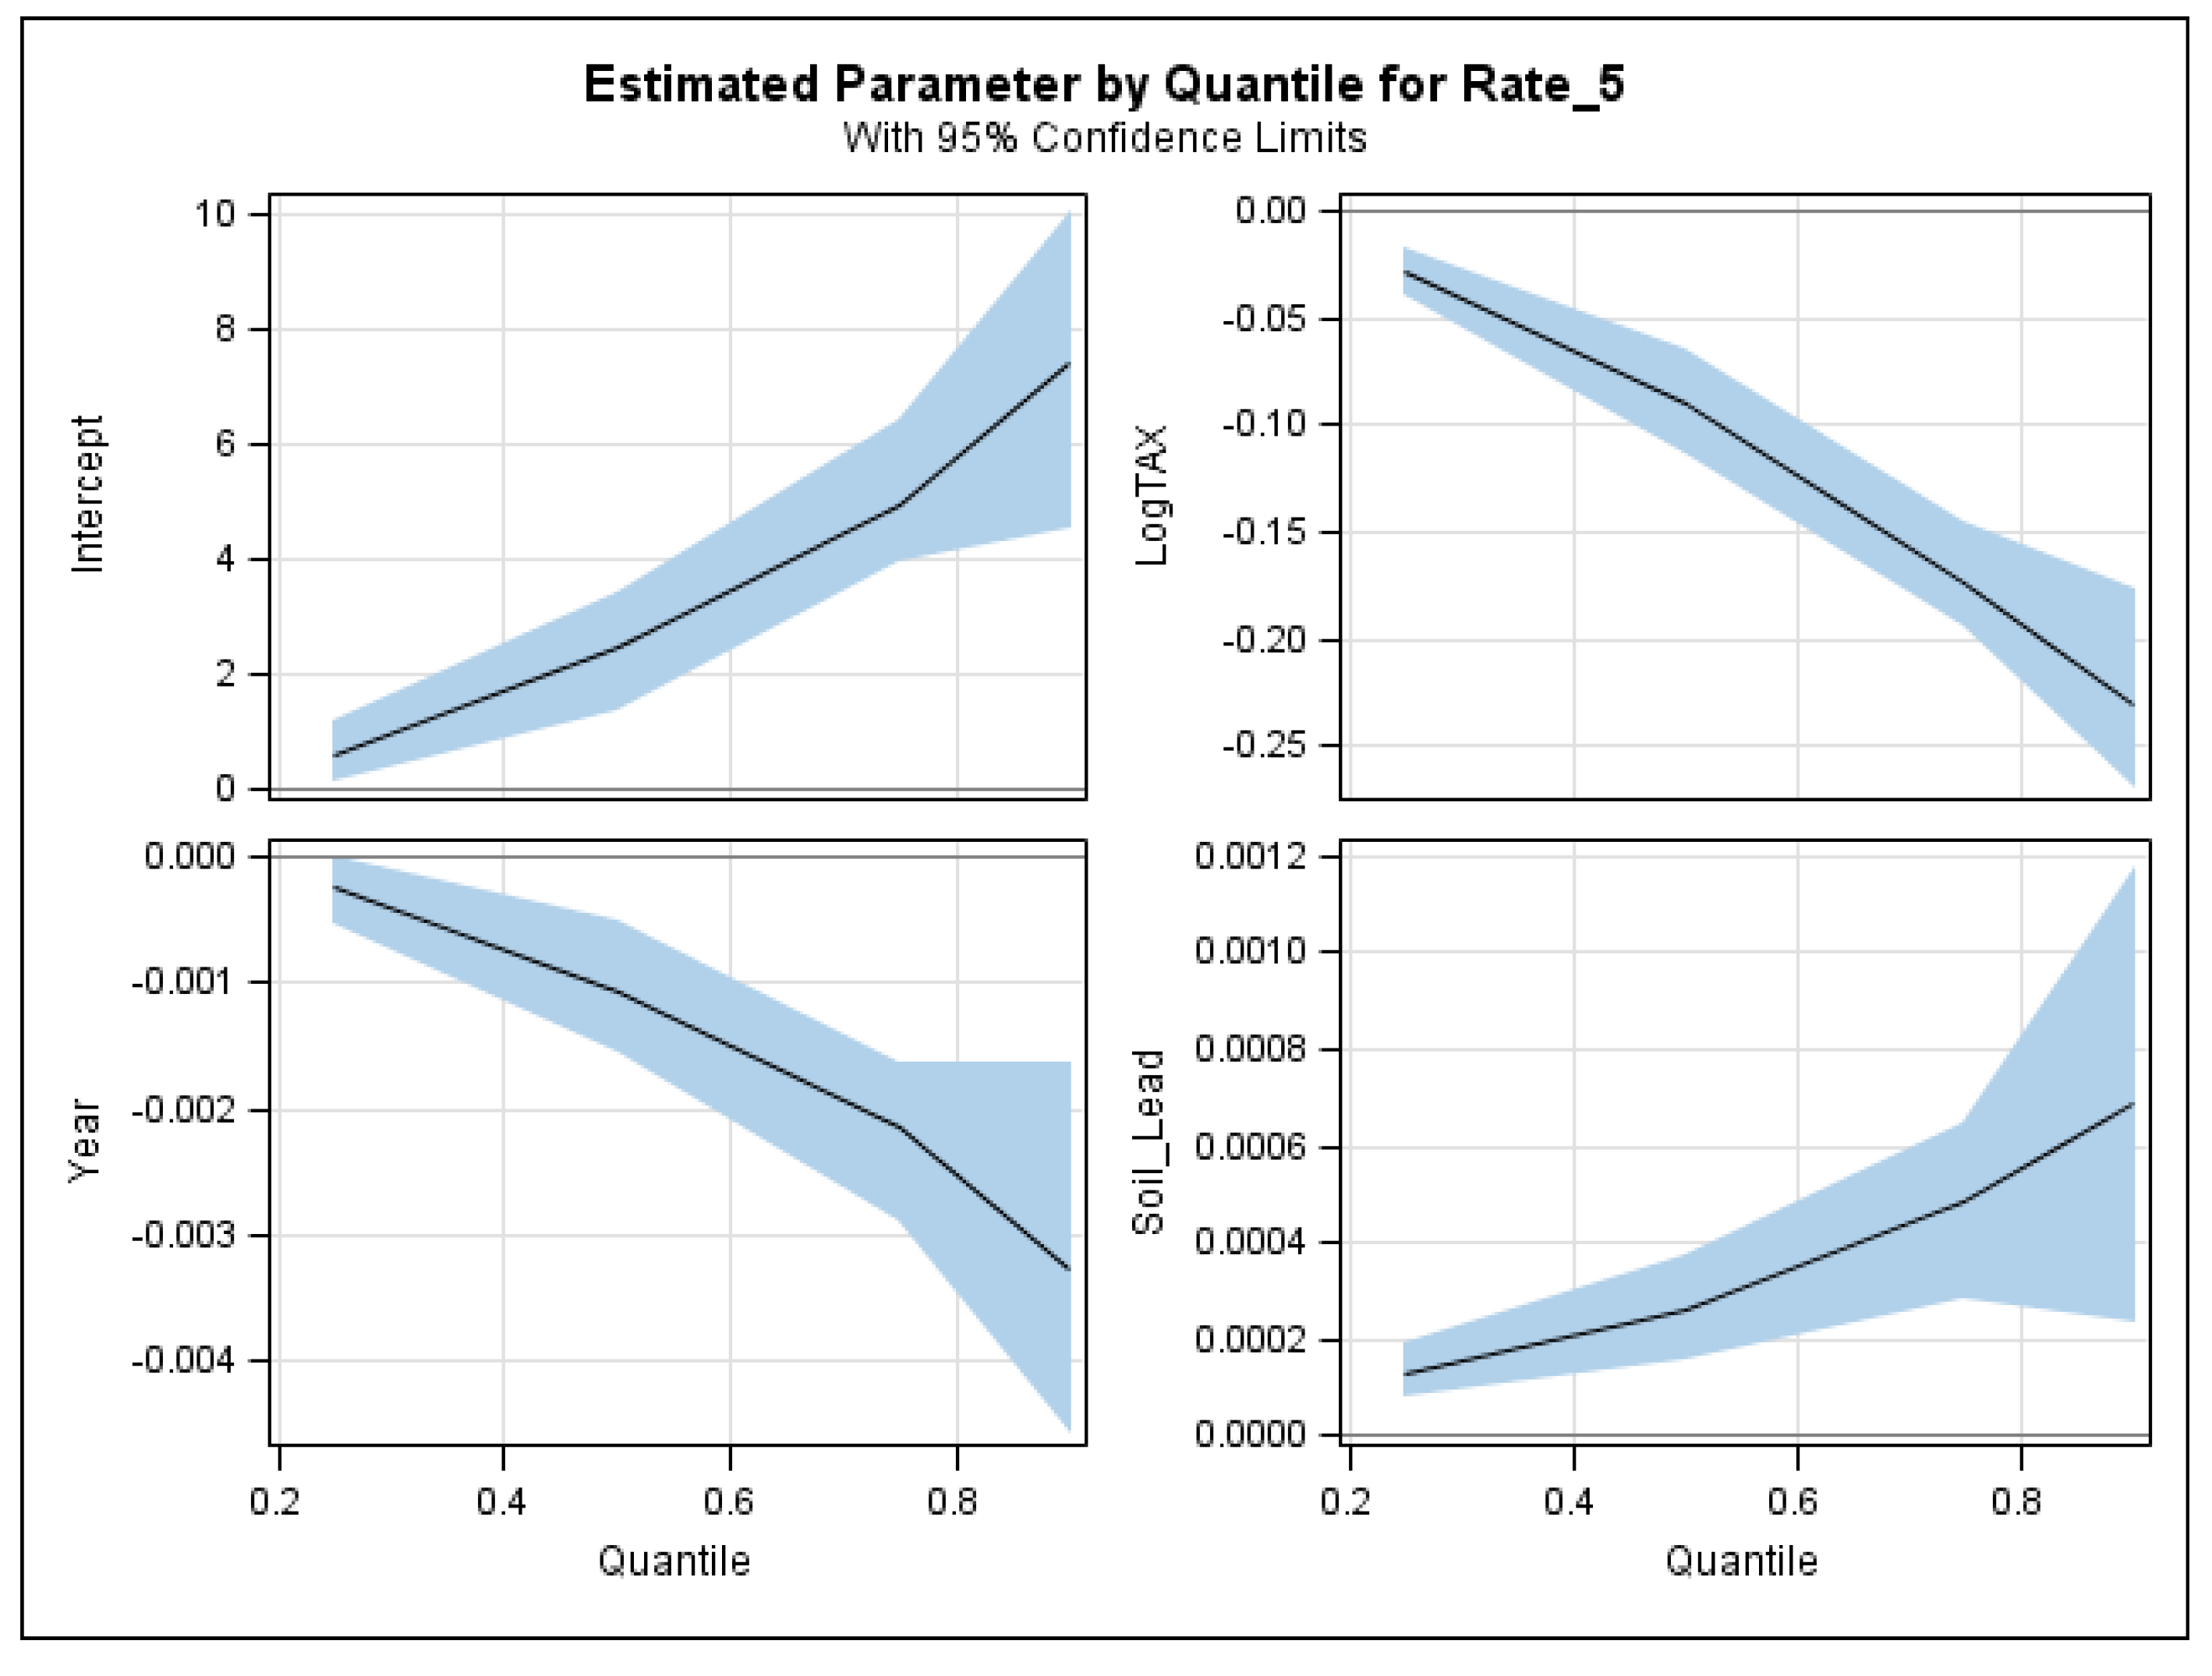
| Coefficient | Estimate | 95% Confidence Limits | p-Value | STB † | |
|---|---|---|---|---|---|
| τ = 0.25 | |||||
| Intercept | 0.5707 | −0.0234 | 1.1647 | 0.0597 | |
| Building Year | −0.0002 | −0.0005 | 0.0001 | 0.1119 | −0.0201 |
| Log Tax Values | −0.0288 | −0.0393 | −0.0183 | <0.0001 | −0.0502 |
| Soil Lead | 0.0001 | 0.0001 | 0.0002 | <0.0001 | 0.0688 |
| τ = 0.50 | |||||
| Intercept | 2.4739 | 1.3337 | 3.6141 | <0.001 | |
| Building Year | −0.0011 | −0.0017 | −0.0005 | 0.0002 | −0.0914 |
| Log Tax Values | −0.0905 | −0.1120 | −0.0689 | <0.001 | −0.1576 |
| Soil Lead | 0.0003 | 0.0002 | 0.0004 | <0.001 | 0.1411 |
| τ = 0.75 | |||||
| Intercept | 4.9176 | 3.6101 | 6.2251 | <0.0001 | |
| Building Year | −0.0021 | −0.0028 | −0.0015 | <0.0001 | −0.1813 |
| Log Tax Values | −0.1734 | −0.1954 | −0.1515 | <0.0001 | −0.3012 |
| Soil Lead | 0.0005 | 0.0004 | 0.0006 | <0.0001 | 0.2629 |
| τ = 0.90 | |||||
| Intercept | 7.4102 | 4.5054 | 10.3150 | <0.0001 | |
| Building Year | −0.0033 | −0.0047 | −0.0018 | <0.0001 | −0.2764 |
| Log Tax Values | −0.2303 | −0.2761 | −0.1844 | <0.0001 | −0.4011 |
| Soil Lead | 0.0007 | 0.0003 | 0.0011 | 0.0007 | 0.3715 |
| Test | Observed (BLL ≥ 5 µg/dL) | Residuals τ = 0.25 | Residuals τ = 0.50 | Residuals τ = 0.75 | Residuals τ = 0.90 |
|---|---|---|---|---|---|
| Moran’s Index | 0.0974 | 0.0782 | 0.045 | 0.02 | 0.0276 |
| Z-score | 69.10 | 55.56 | 32.20 | 14.61 | 19.91 |
| p-value | <0.0001 | <0.0001 | <0.0001 | <0.0001 | <0.0001 |
| Coefficient | Mean | Median | Min | Max | IQR | Ste † | Status |
|---|---|---|---|---|---|---|---|
| τ = 0.25 | |||||||
| Intercept | 0.5409 | 0.5996 | −0.8802 | 1.3253 | 0.7439 | 0.3028 | Nonstationary |
| Building Year | −0.00021 | −0.0002 | −0.0007 | 0.0006 | 0.0004 | 0.0001 | Nonstationary |
| Log Tax Values | −0.0315 | −0.0279 | −0.0879 | 0.0398 | 0.0453 | 0.0055 | Nonstationary |
| Soil Lead | 0.000095 | 0.0001 | −0.0001 | 0.0003 | 0.0000 | 0.0000 | Stationary |
| τ = 0.50 | |||||||
| Intercept | 2.3455 | 2.4911 | −0.9819 | 5.0047 | 1.7971 | 0.5812 | Nonstationary |
| Building Year | −0.001051 | −0.0011 | −0.0024 | 0.0006 | 0.0008 | 0.0003 | Nonstationary |
| Log Tax Values | −0.07374 | −0.0615 | −0.2094 | 0.0657 | 0.0959 | 0.0110 | Nonstationary |
| Soil Lead | 0.000176 | 0.0002 | −0.0001 | 0.0005 | 0.0001 | 0.0000 | Nonstationary |
| τ = 0.75 | |||||||
| Intercept | 3.7948 | 4.1557 | −4.4179 | 8.8531 | 3.5624 | 0.6665 | Nonstationary |
| Building Year | −0.001703 | −0.0018 | −0.0043 | 0.0022 | 0.0002 | 0.0003 | Nonstationary |
| Log Tax Values | −0.1102 | −0.0975 | −0.2993 | 0.0994 | 0.1244 | 0.0112 | Nonstationary |
| Soil Lead | 0.000299 | 0.0003 | −0.0003 | 0.0006 | 0.002 | 0.0001 | Nonstationary |
| τ = 0.90 | |||||||
| Intercept | 4.0228 | 3.6329 | −10.0867 | 12.0888 | 6.2613 | 1.4808 | Nonstationary |
| Building Year | −0.001726 | −0.0014 | −0.0059 | 0.03699 | 0.0033 | 0.0008 | Nonstationary |
| Log Tax Values | −0.1406 | −0.1413 | −0.3871 | 0.1247 | 0.1589 | 0.0204 | Nonstationary |
| Soil Lead | 0.000444 | 0.0004 | −0.0006 | 0.1342 | 0.0003 | 0.0002 | Stationary |
© 2018 by the authors. Licensee MDPI, Basel, Switzerland. This article is an open access article distributed under the terms and conditions of the Creative Commons Attribution (CC BY) license (http://creativecommons.org/licenses/by/4.0/).
Share and Cite
Zhen, Z.; Cao, Q.; Shao, L.; Zhang, L. Global and Geographically Weighted Quantile Regression for Modeling the Incident Rate of Children’s Lead Poisoning in Syracuse, NY, USA. Int. J. Environ. Res. Public Health 2018, 15, 2300. https://doi.org/10.3390/ijerph15102300
Zhen Z, Cao Q, Shao L, Zhang L. Global and Geographically Weighted Quantile Regression for Modeling the Incident Rate of Children’s Lead Poisoning in Syracuse, NY, USA. International Journal of Environmental Research and Public Health. 2018; 15(10):2300. https://doi.org/10.3390/ijerph15102300
Chicago/Turabian StyleZhen, Zhen, Qianqian Cao, Liyang Shao, and Lianjun Zhang. 2018. "Global and Geographically Weighted Quantile Regression for Modeling the Incident Rate of Children’s Lead Poisoning in Syracuse, NY, USA" International Journal of Environmental Research and Public Health 15, no. 10: 2300. https://doi.org/10.3390/ijerph15102300
APA StyleZhen, Z., Cao, Q., Shao, L., & Zhang, L. (2018). Global and Geographically Weighted Quantile Regression for Modeling the Incident Rate of Children’s Lead Poisoning in Syracuse, NY, USA. International Journal of Environmental Research and Public Health, 15(10), 2300. https://doi.org/10.3390/ijerph15102300