Cognitive Load Changes during Music Listening and its Implication in Earcon Design in Public Environments: An fNIRS Study

Abstract
1. Introduction
2. Materials and Methods
2.1. Participants
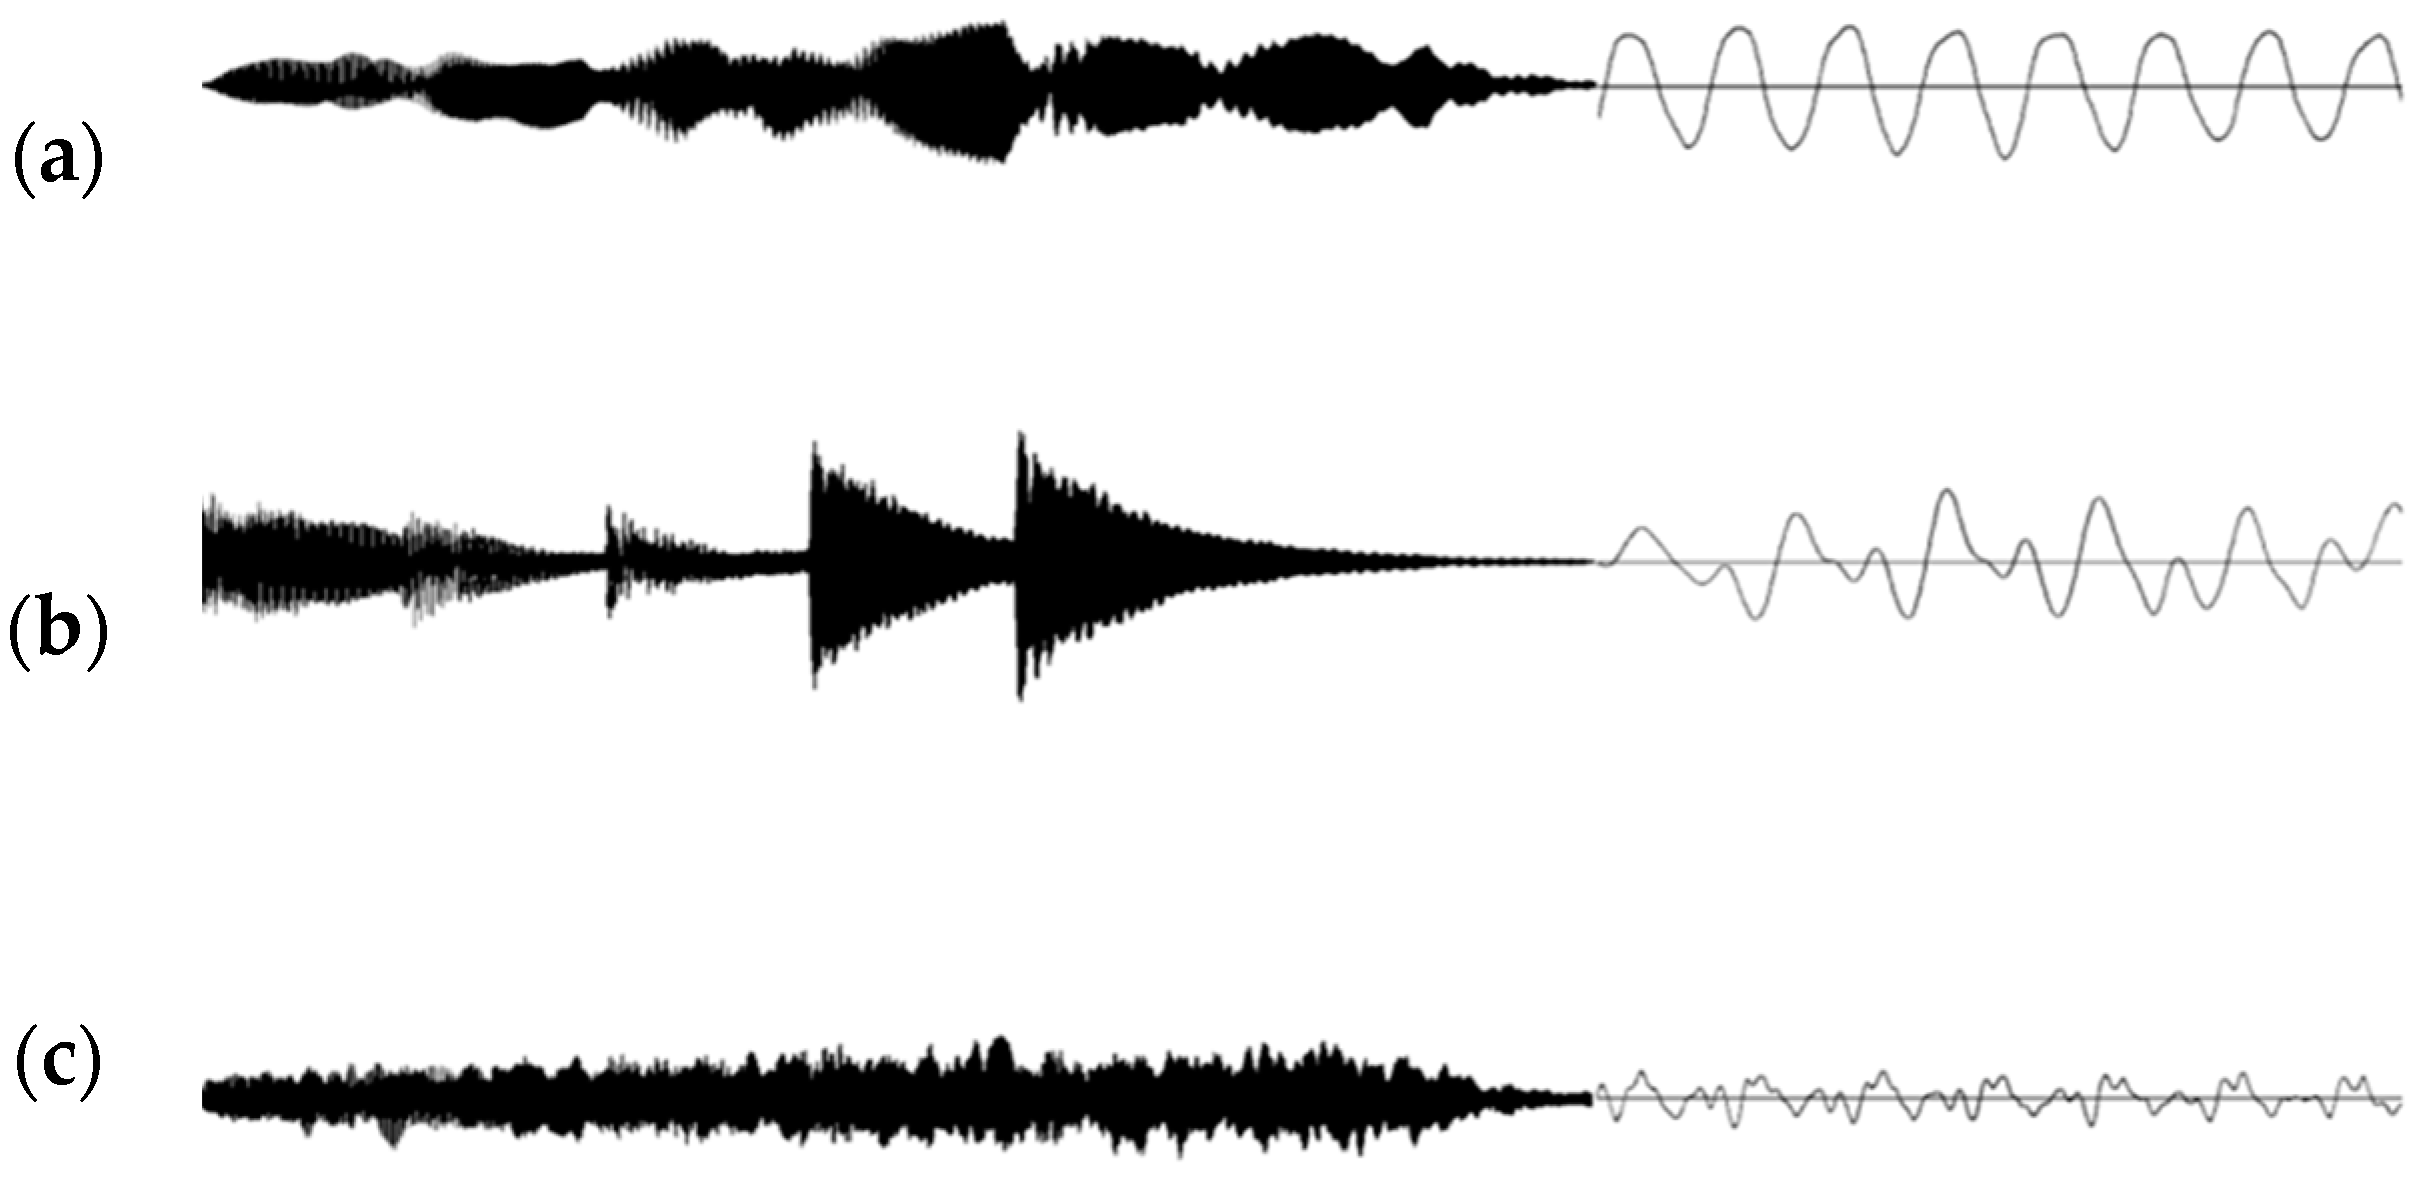
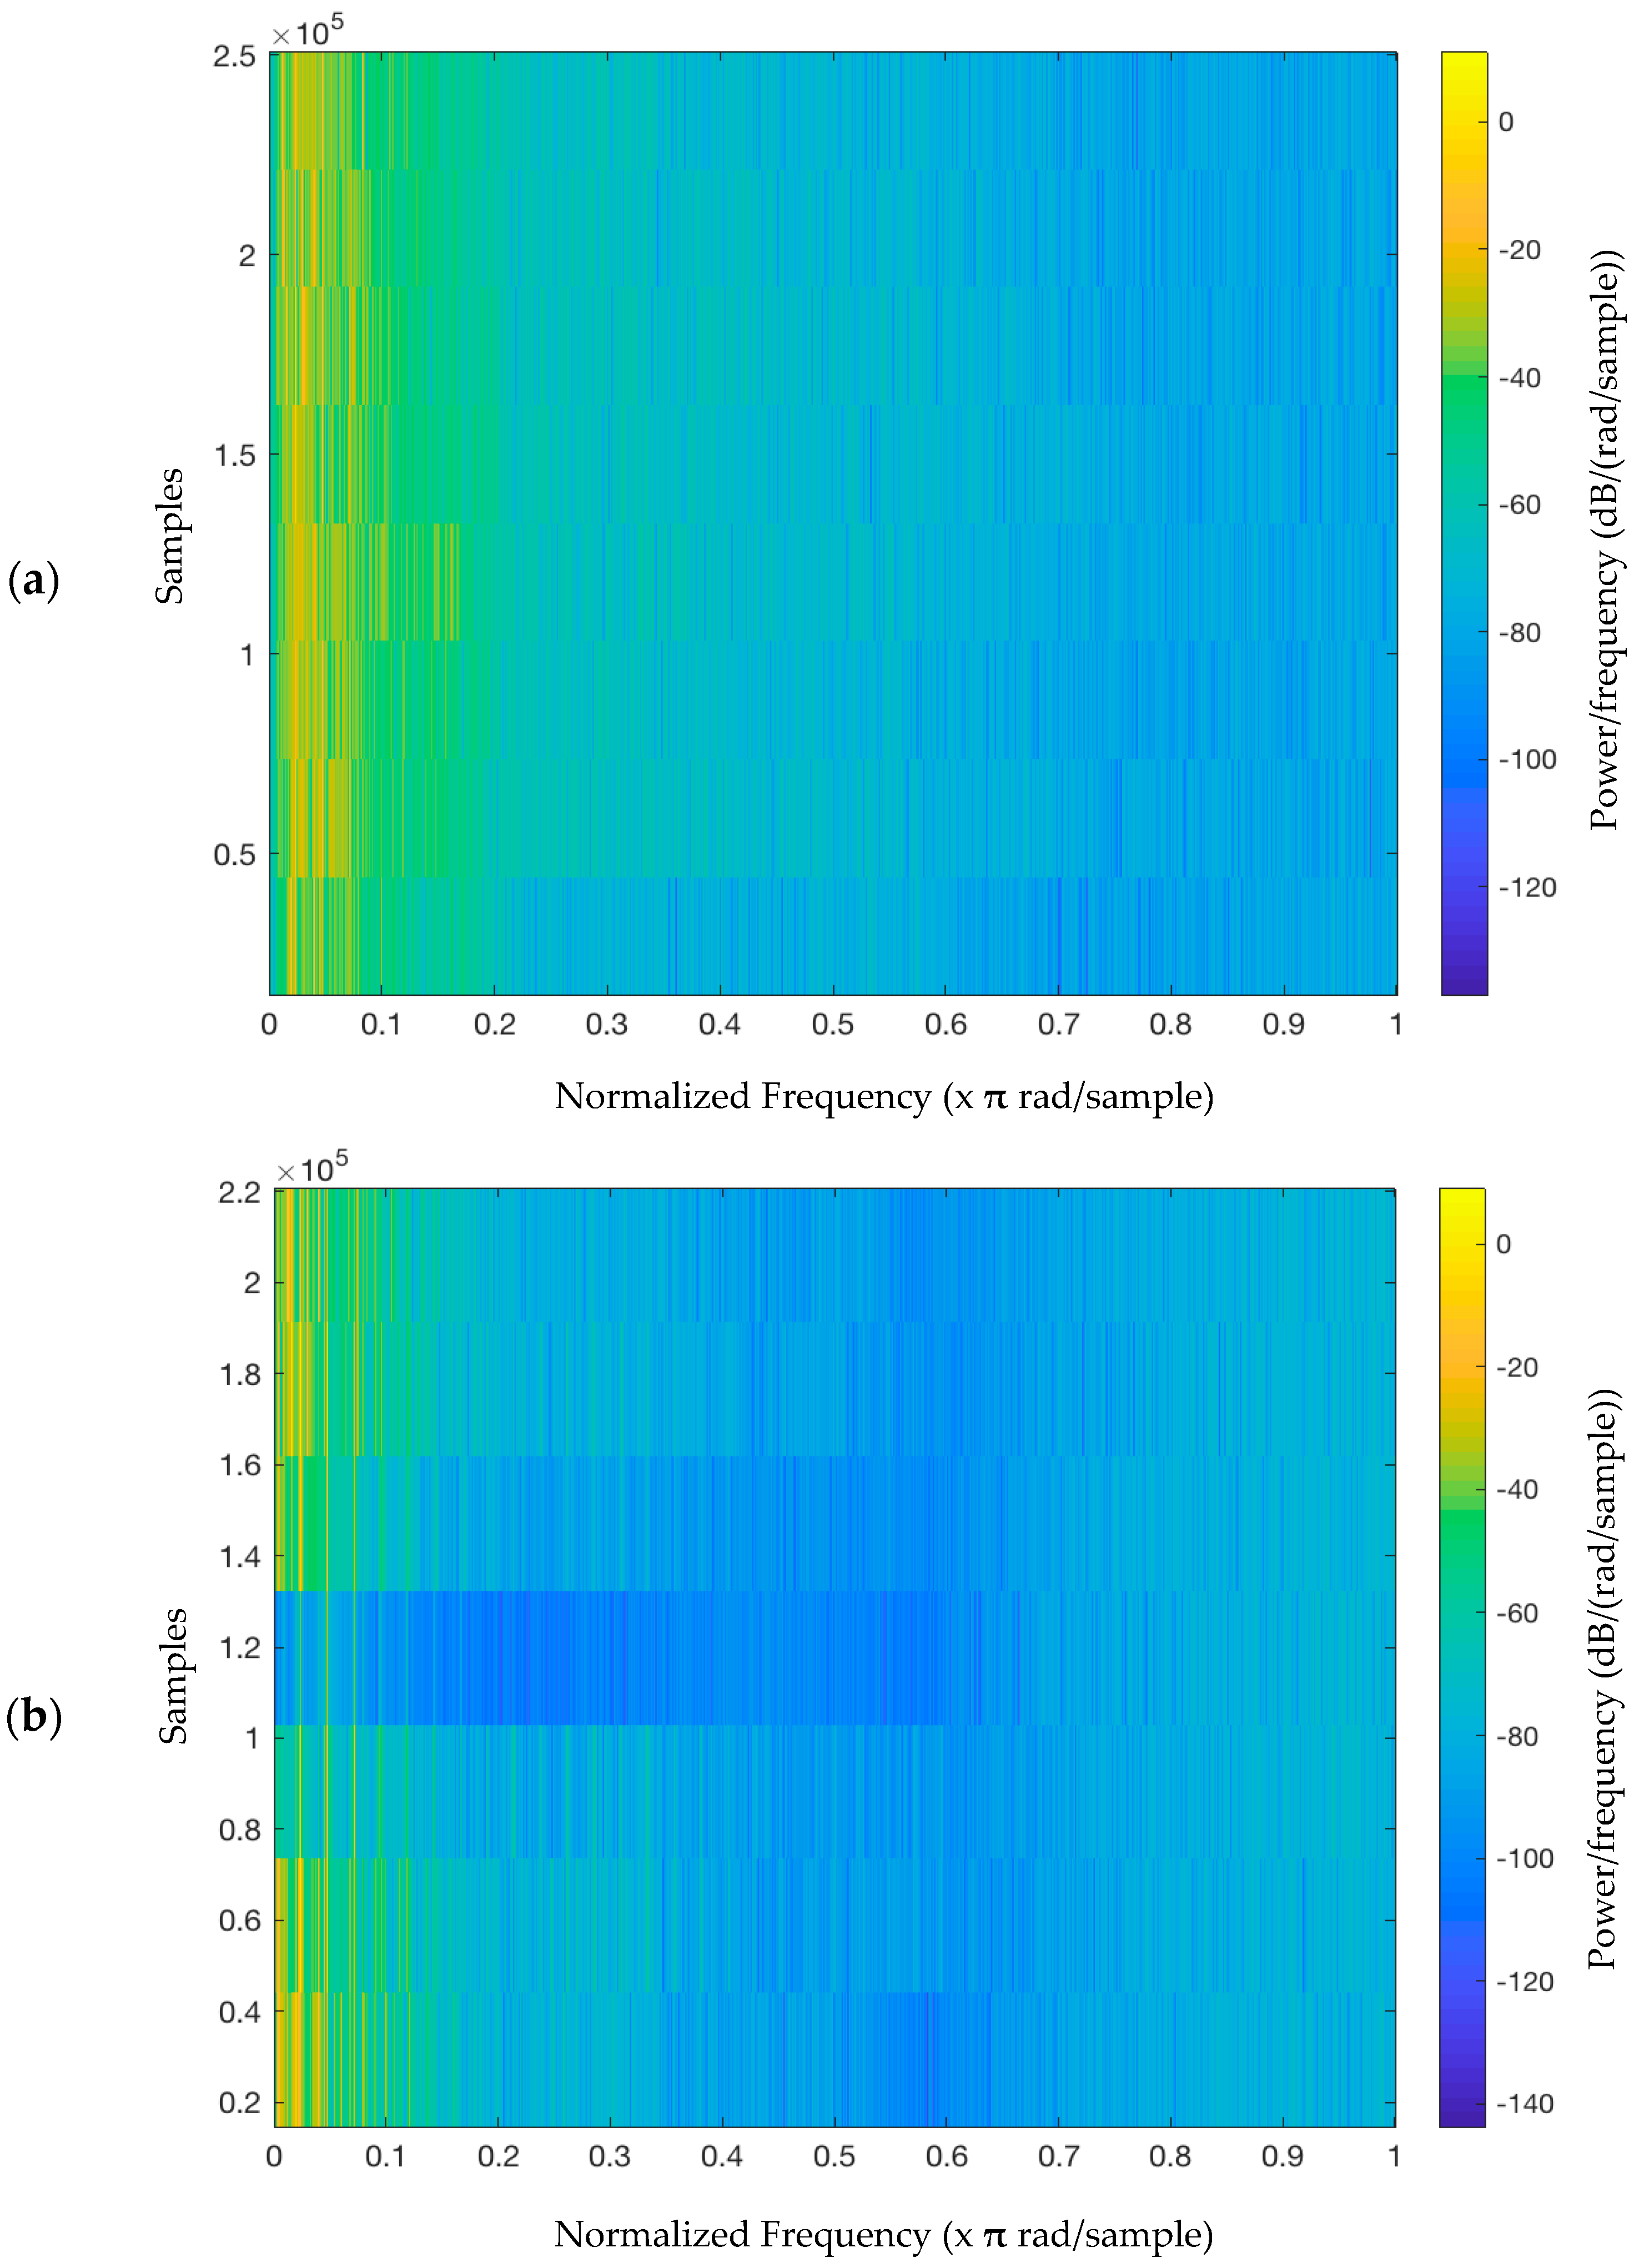
2.2. Music Stimuli
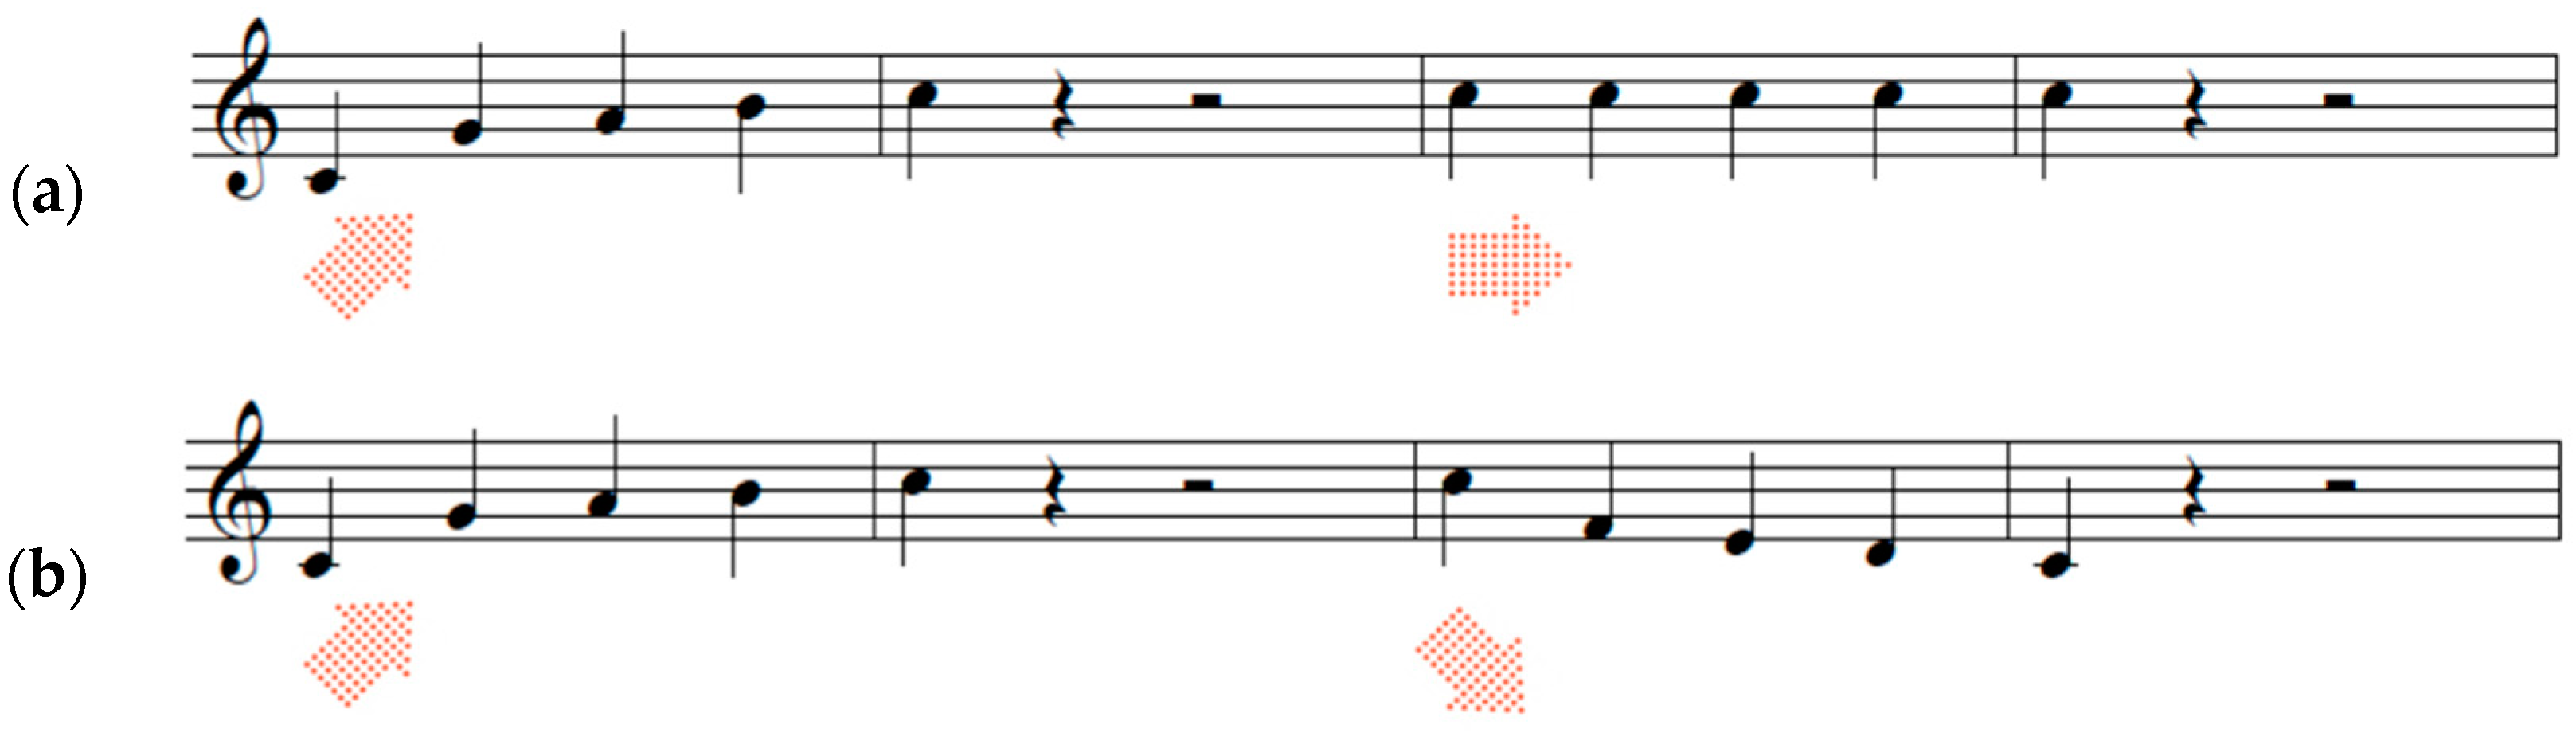
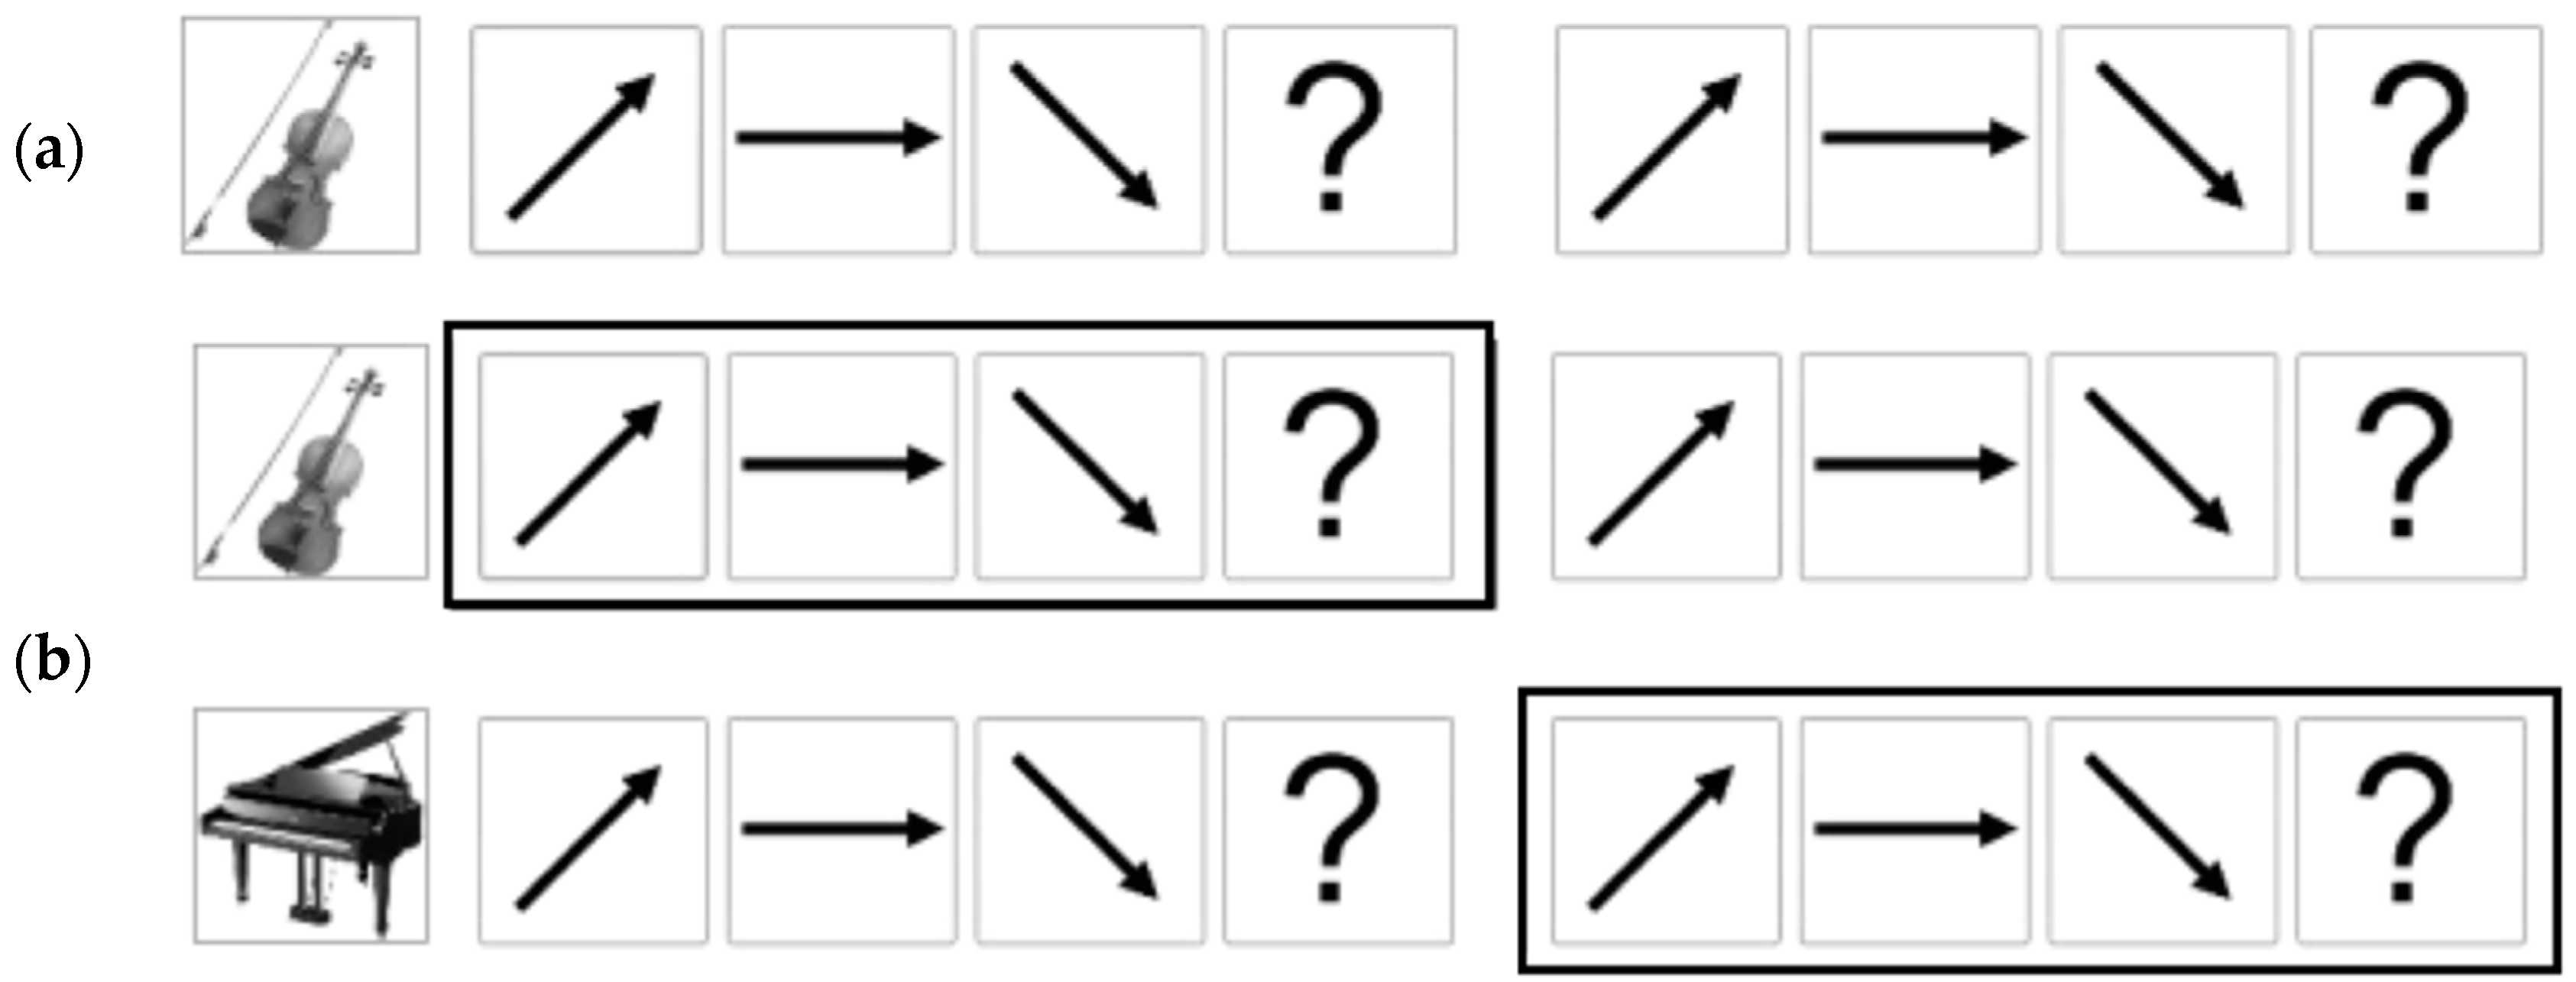
2.3. Contour Identification Task
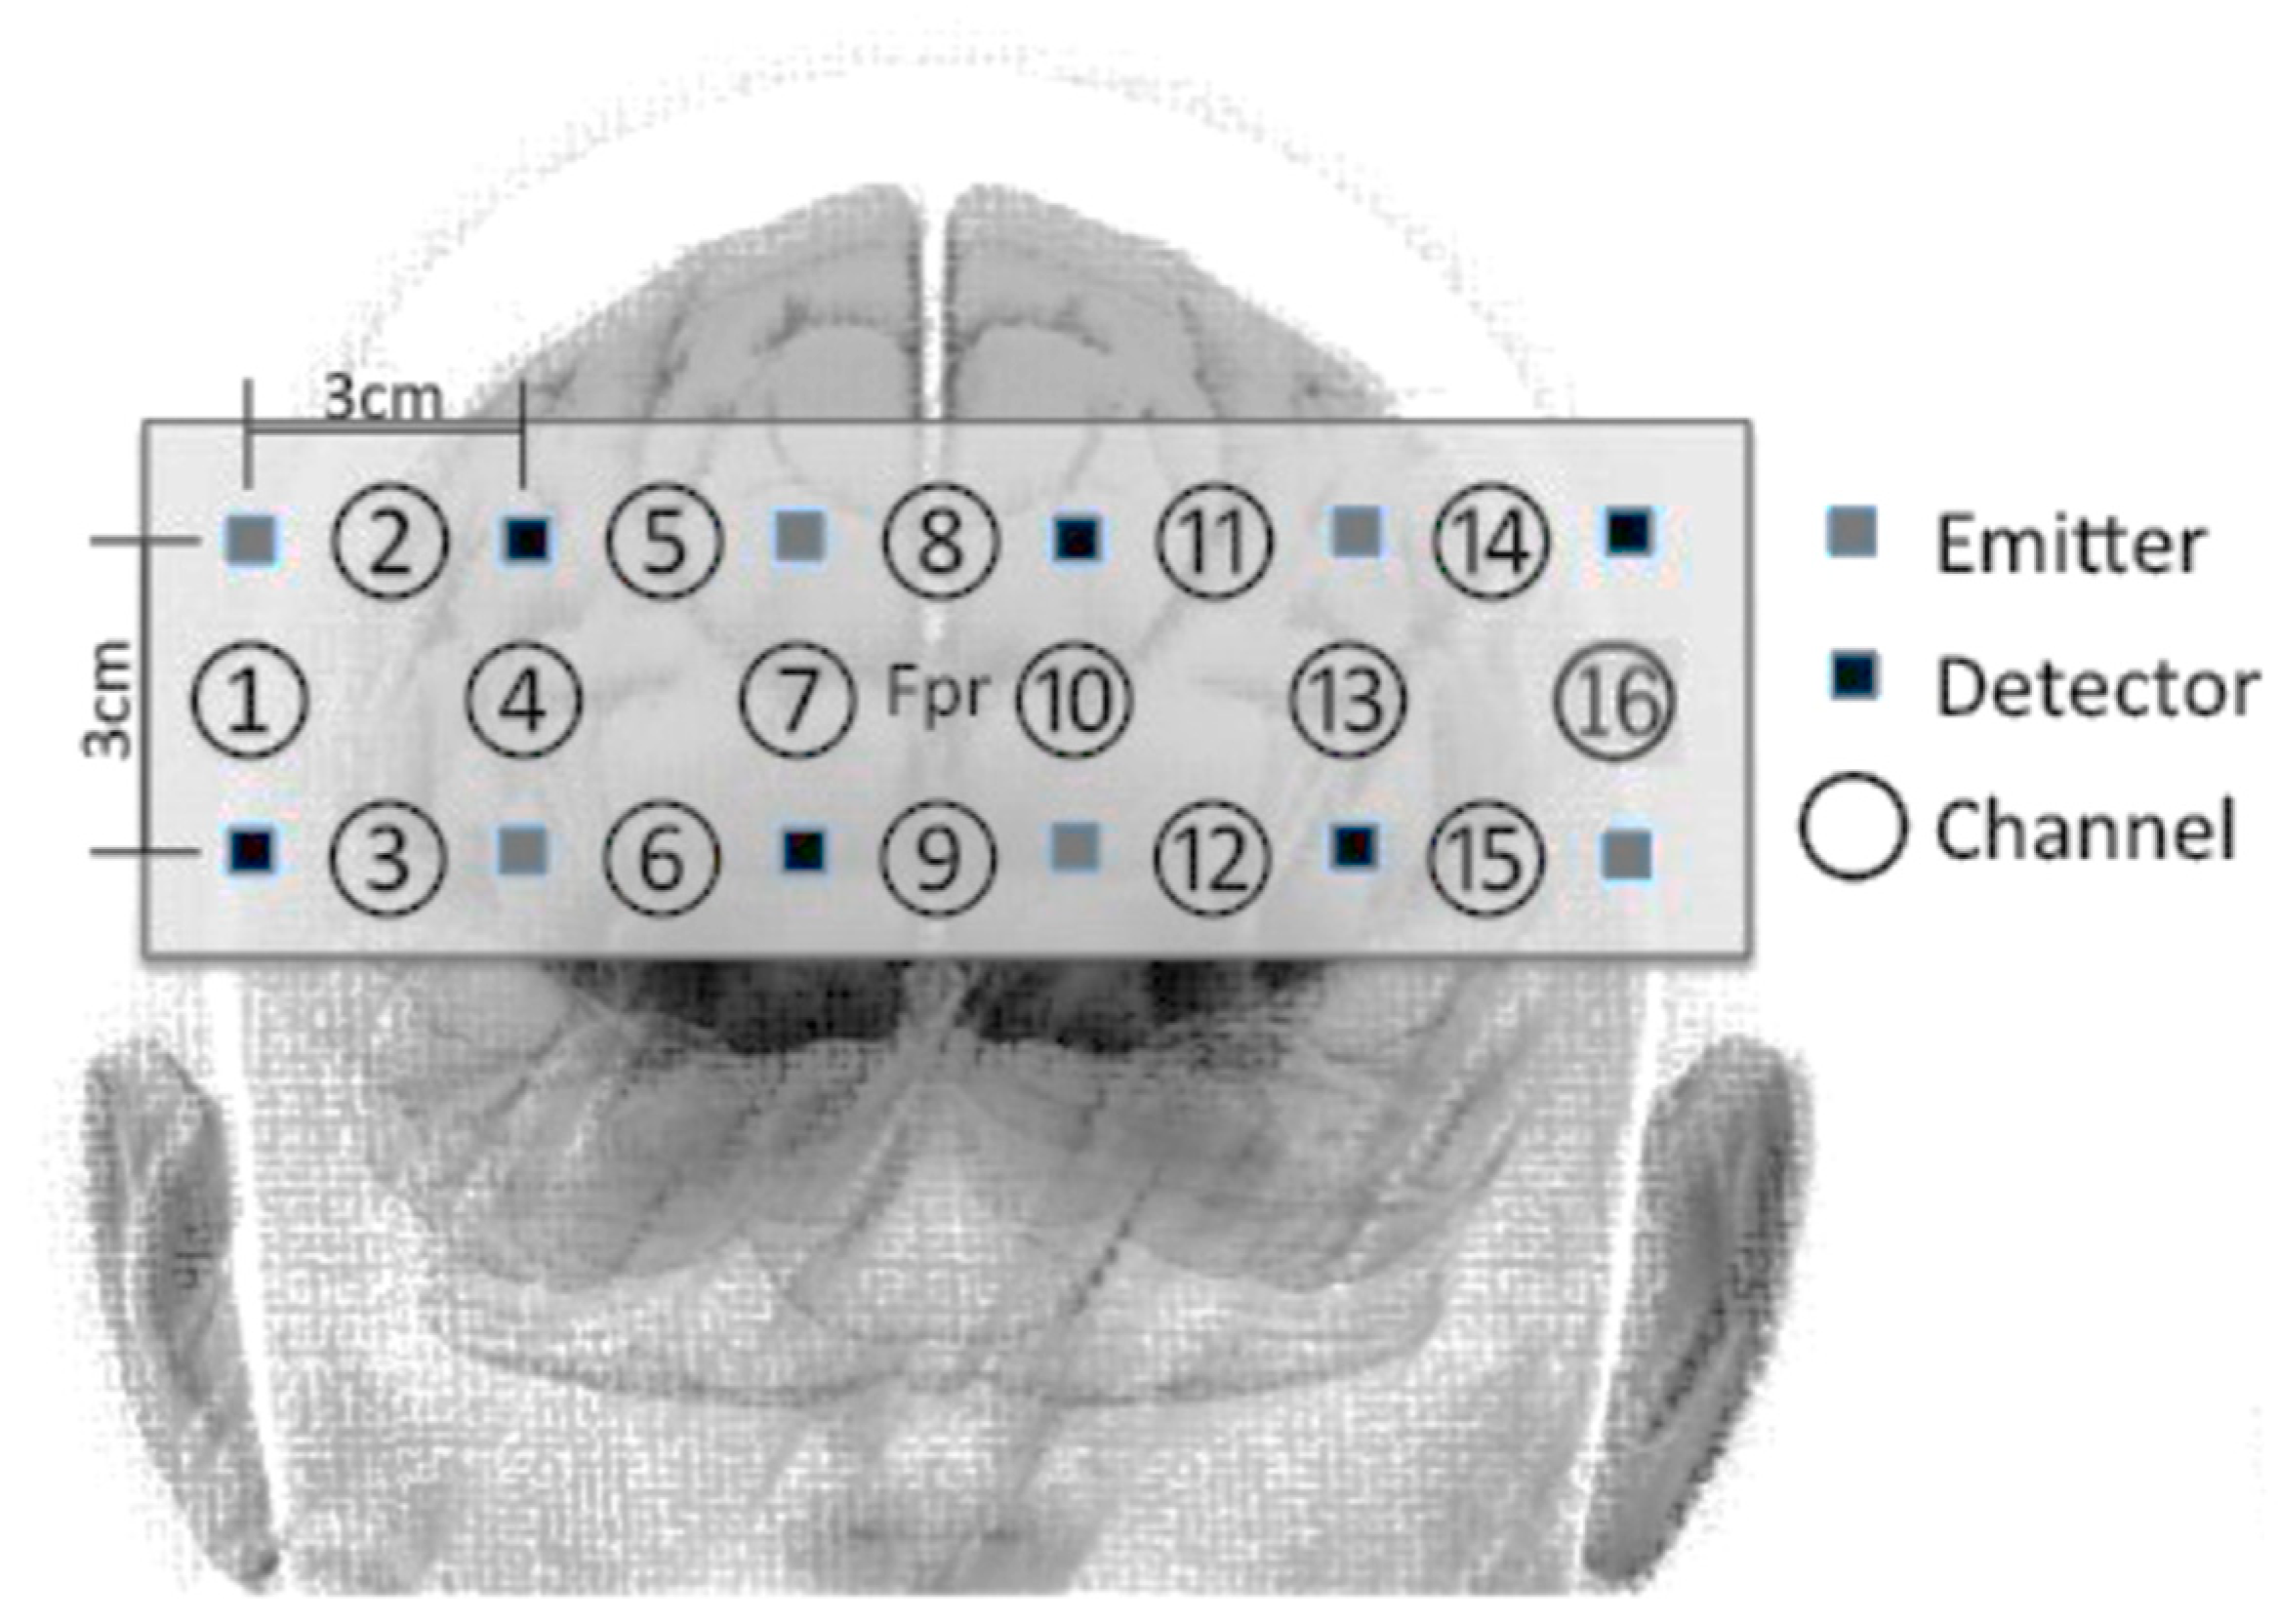
2.4. fNIRS Data Acquisition and Pre-Processing
2.5. Procedure
2.6. Statistical Analysis
3. Results
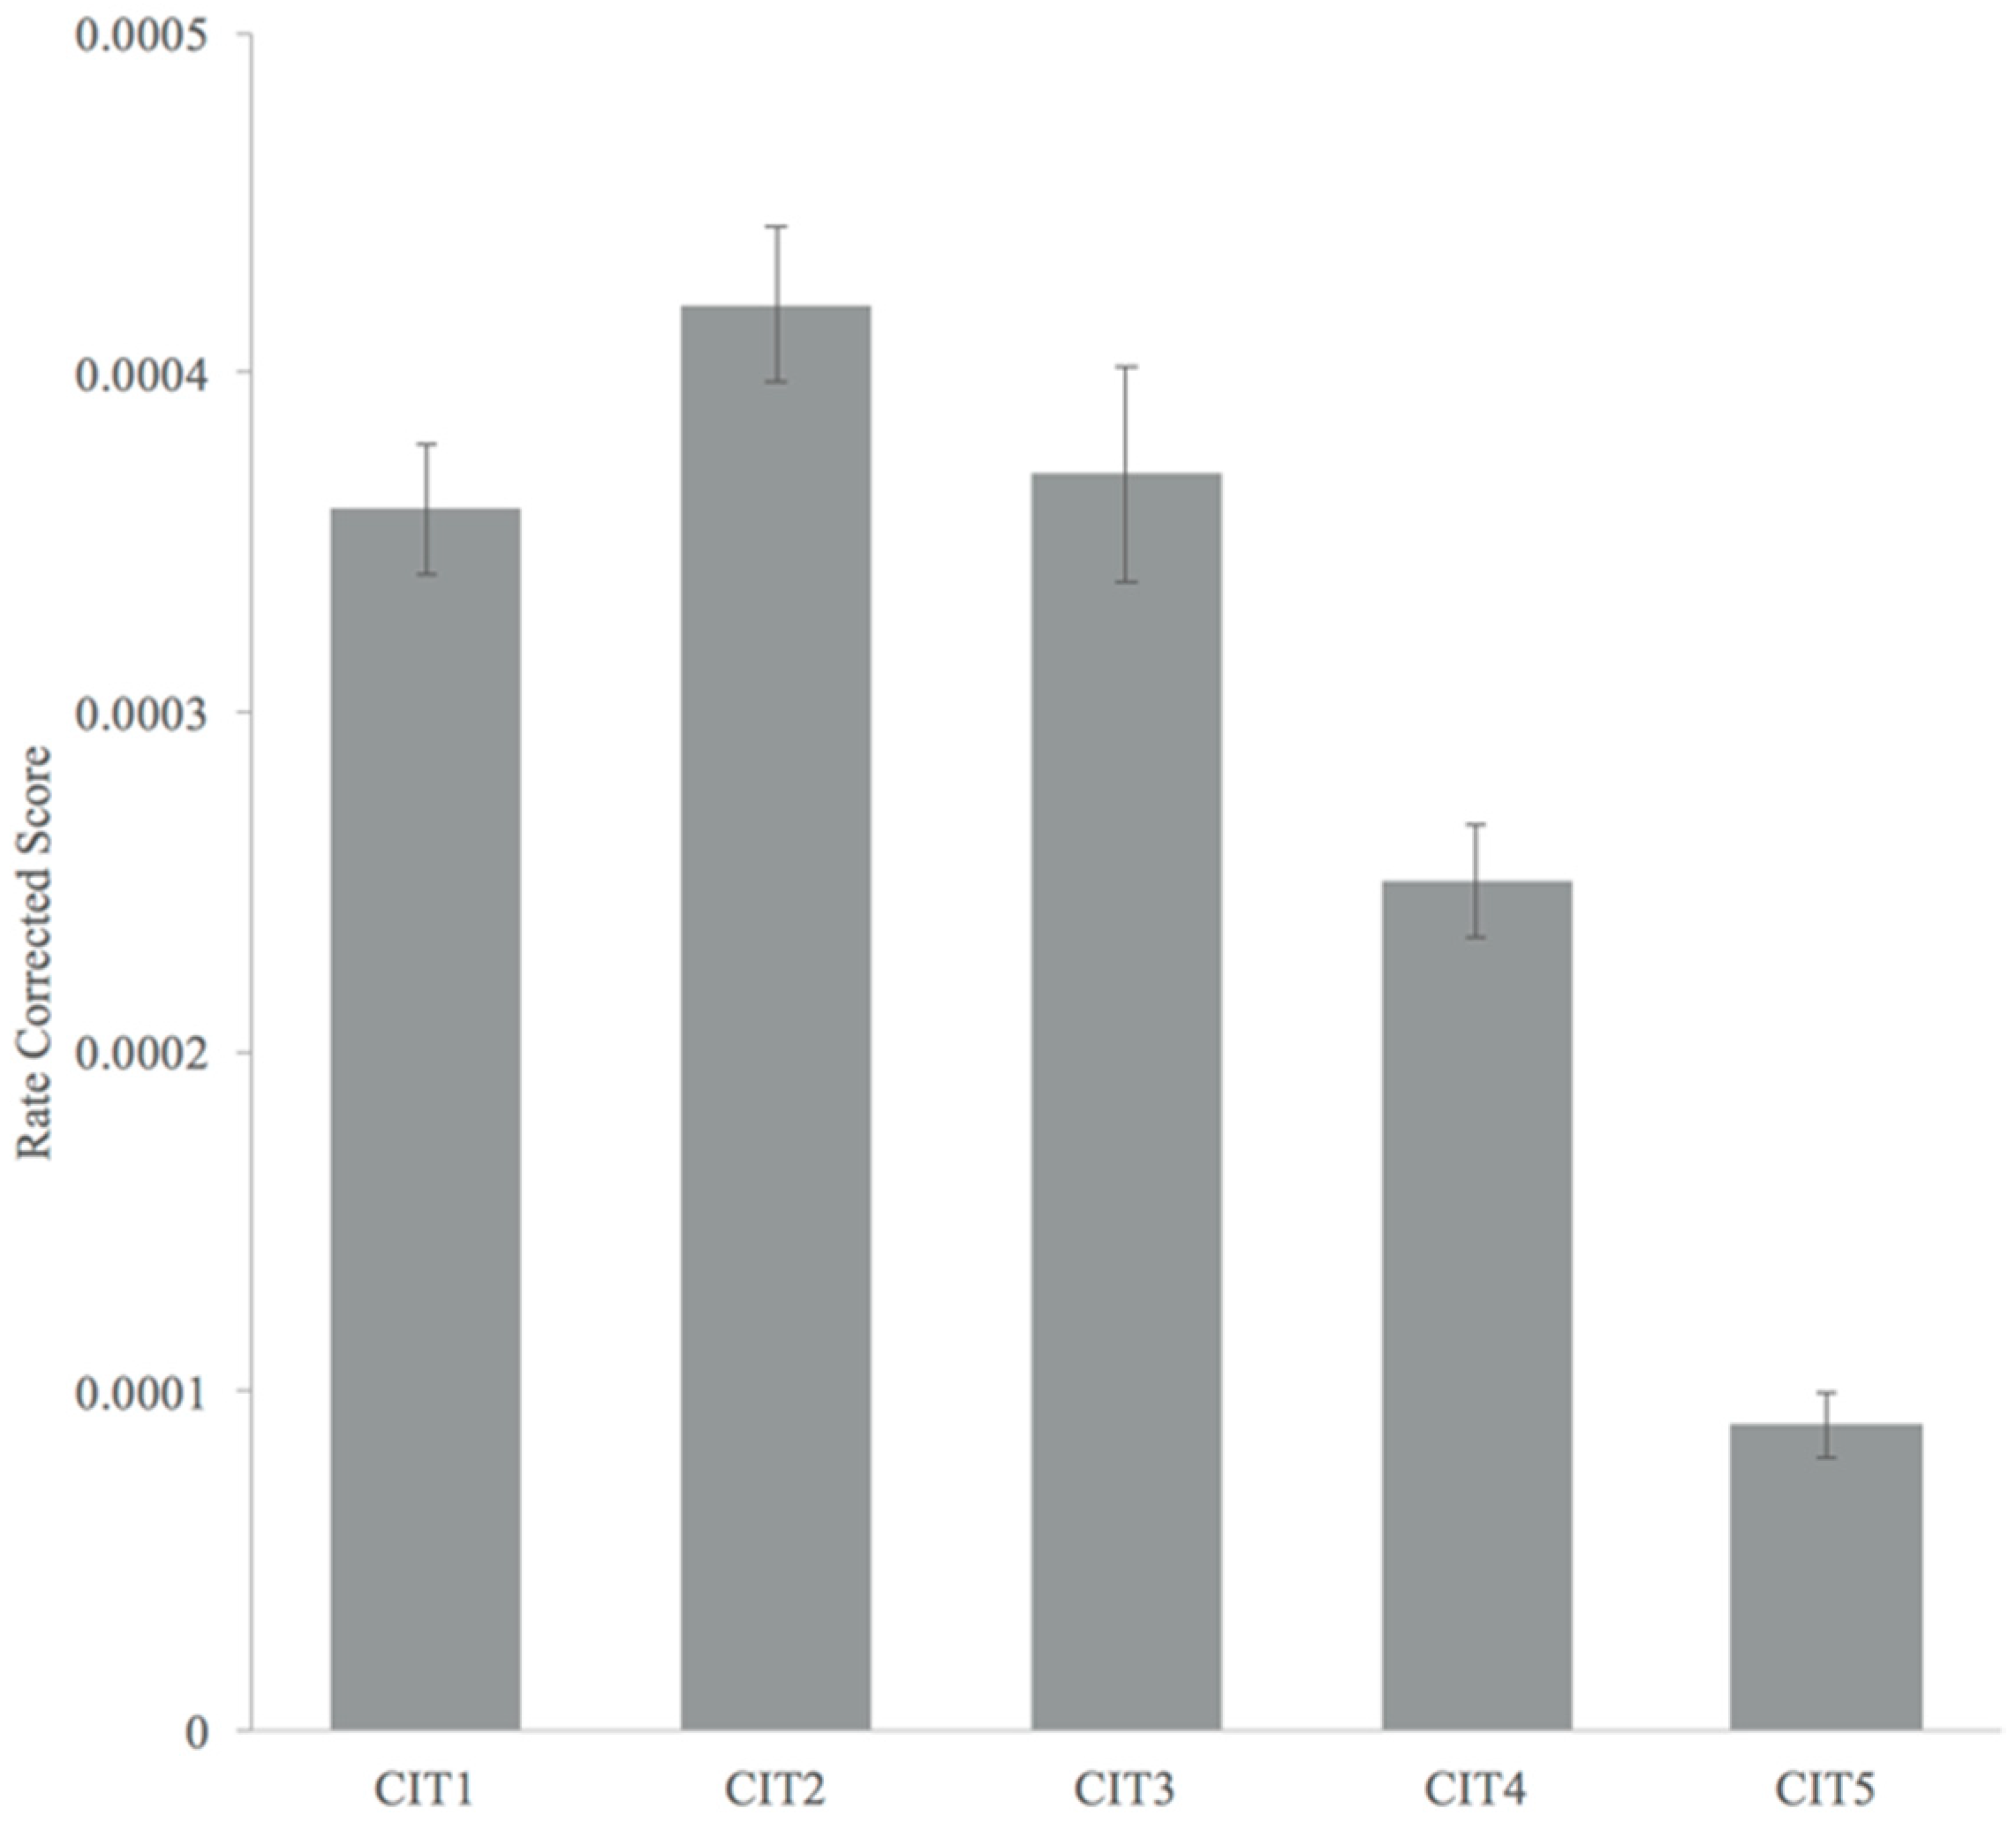
3.1. Accuracy and Response Time
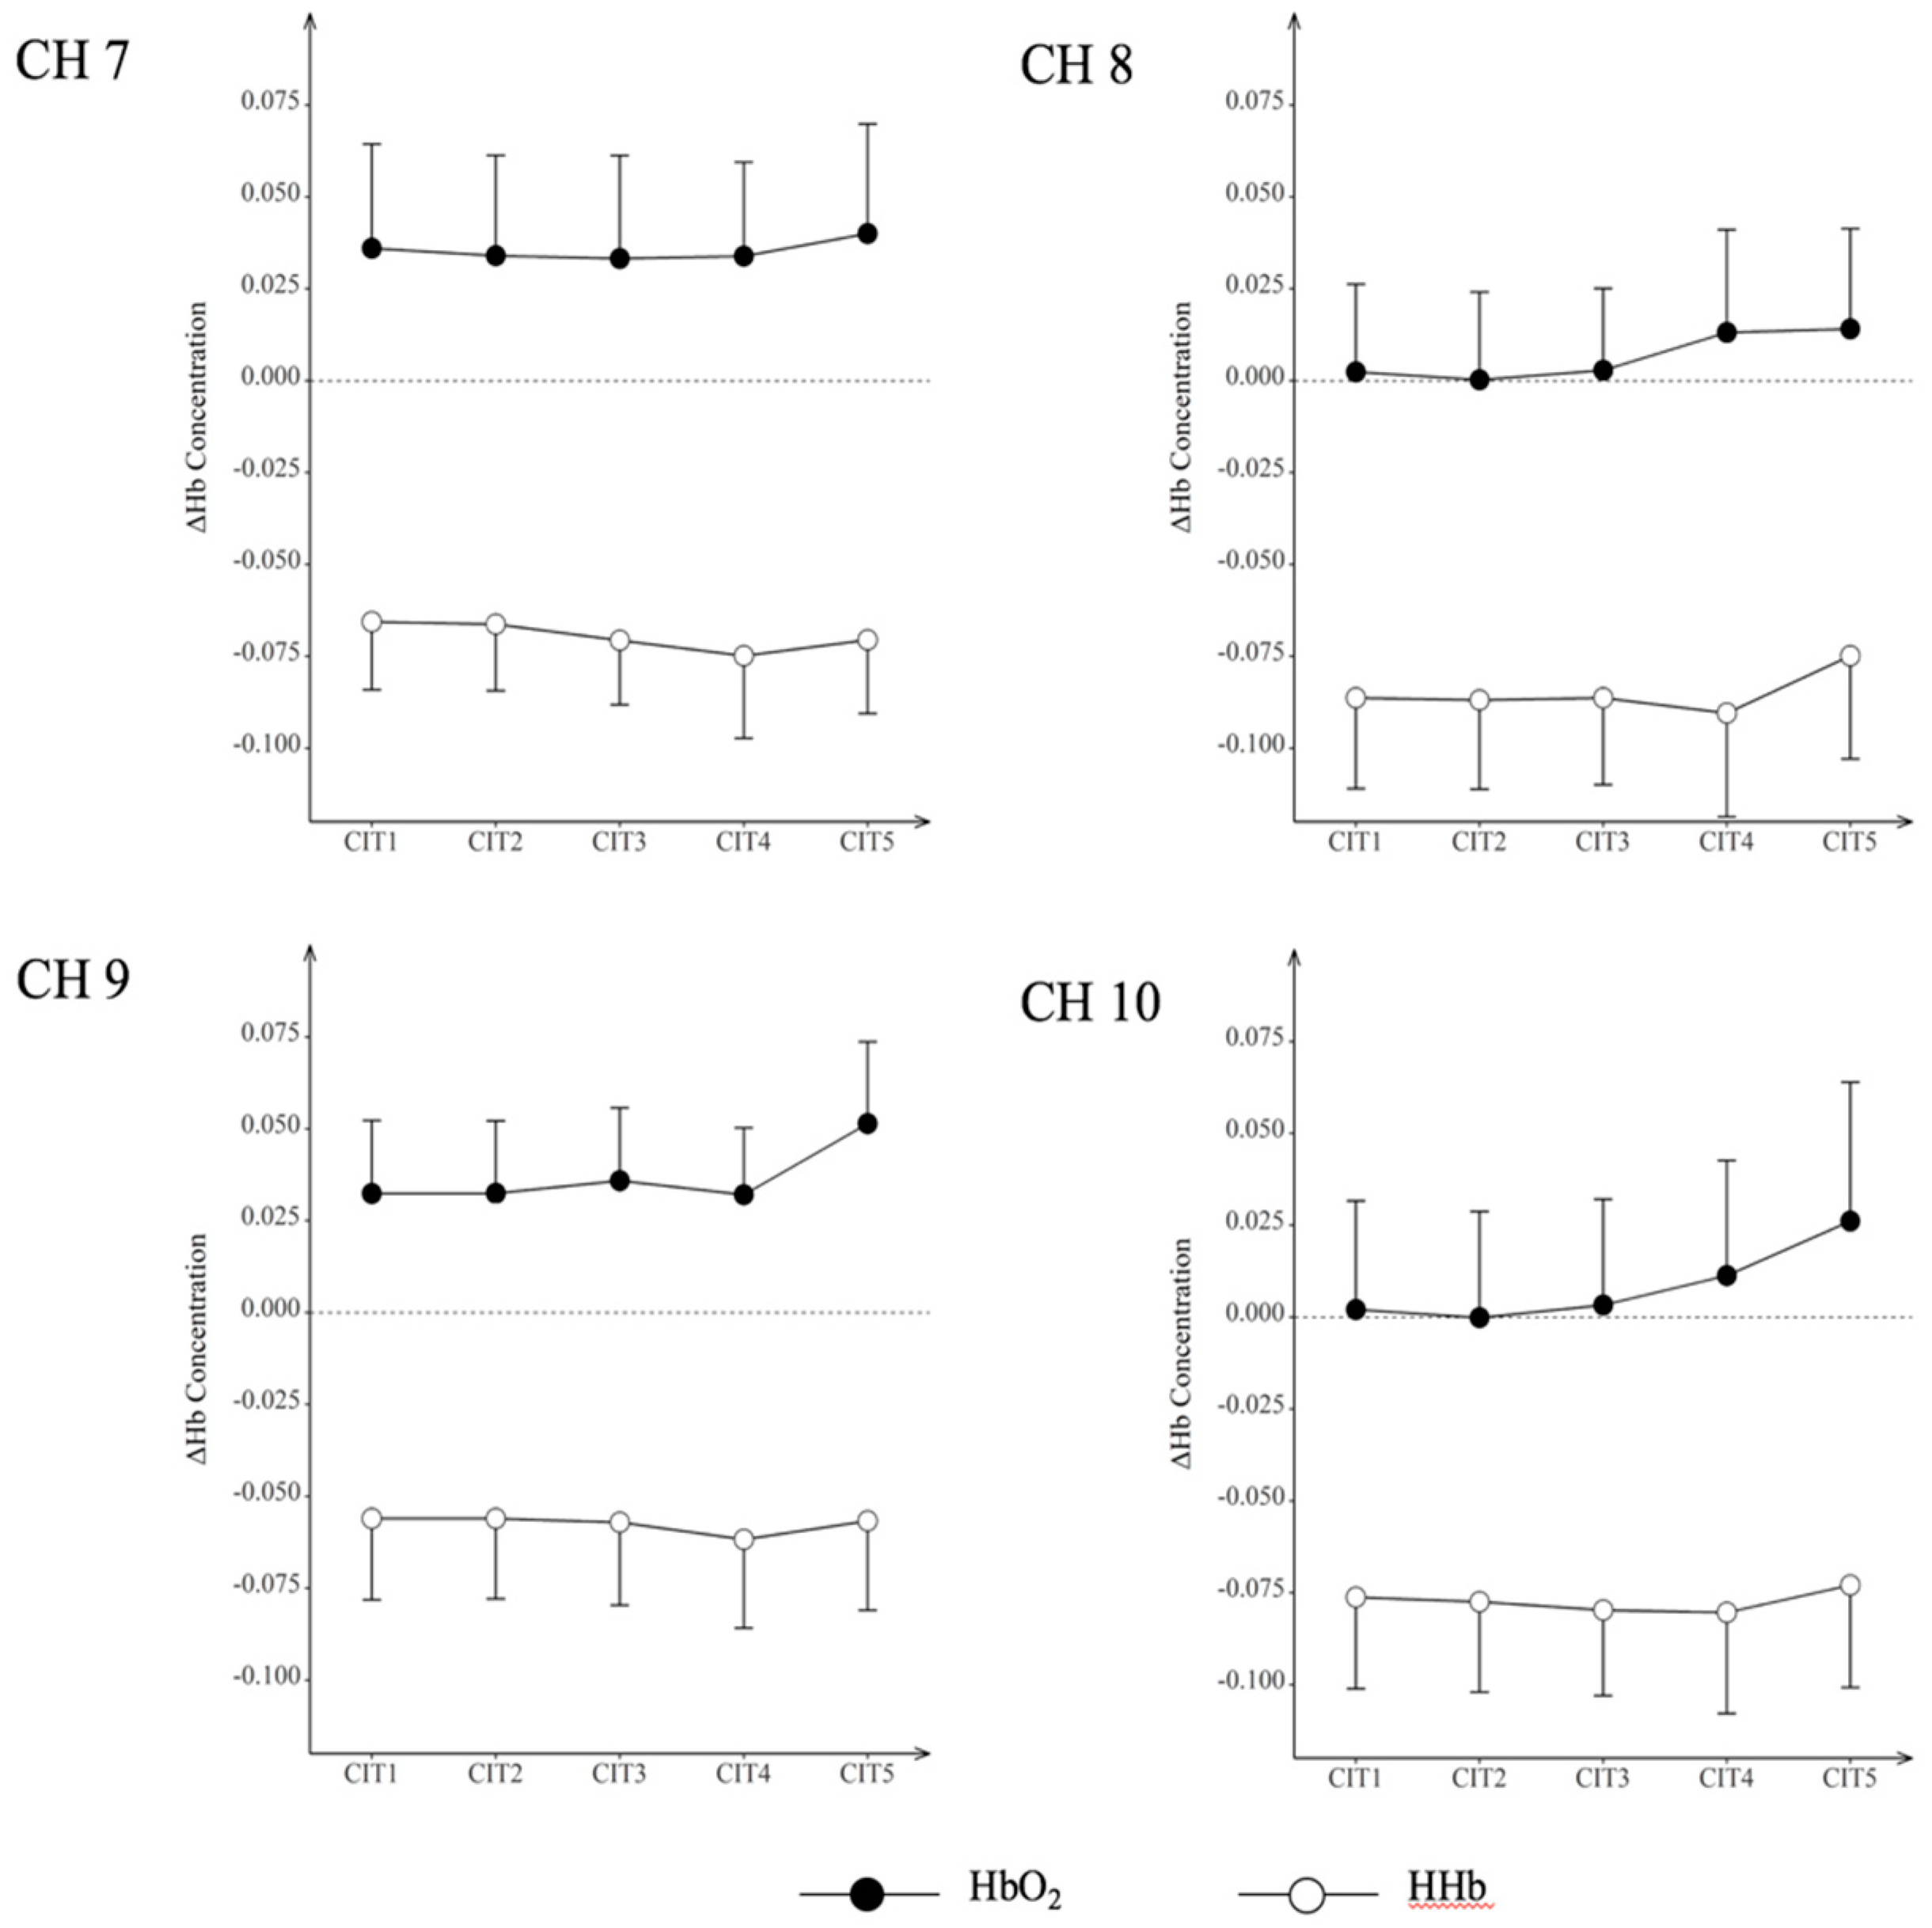
3.2. Hemodynamic Responses
4. Discussion
4.1. Lessons from Behavioral and Hemodynamic Findings
4.2. Lessons from Additional Analyses on Directional Congruence and Timbre Similarity
4.3. Implications for Auditory Earcon Design in Public Environments
5. Conclusions
Author Contributions
Funding
Conflicts of Interest
References
- Brewster, S.A. Providing a structured method for integrating non-speech audio into human-computer interfaces. Hum.-Comput. Interact. 1994, 277. [Google Scholar]
- McGookin, D.K.; Brewster, S.A. Understanding concurrent earcons: Applying auditory scene analysis principles to concurrent earcon recognition. ACM Trans. Appl. Percept. 2004, 1, 130–155. [Google Scholar] [CrossRef]
- Blattner, M.M.; Sumikawa, D.A.; Greenberg, R.M. Earcons and icons: Their structure and common design principles. Hum.-Comput. Interact. 1989, 4, 11–44. [Google Scholar] [CrossRef]
- Sanders, M.S.; McCormick, E.J. Human Factors in Engineering and Design; McGraw-Hill: New York, NY, USA, 1998; ISBN 0-07-112826-3. [Google Scholar]
- Kirschner, P.A. Cognitive load theory implications of cognitive load theory design-learning. Learn. Instr. 2002, 12, 1–10. [Google Scholar] [CrossRef]
- Oviatt, S. Human-centered design meets cognitive load theory. In Proceedings of the 14th Annual ACM International Conference on Multimedia-MULTIMEDIA ’06, Santa Barbara, CA, USA, 23–27 October 2006; p. 871. [Google Scholar]
- Königschulte, A. Sound as effective design feature in multimedia learning-benefits and drawbacks from a cognitive load theory perspective. In Proceedings of the 12th International Conference on Cognition and Exploratory Learning in the Digital Age (CELDA), Greater Dublin, Ireland, 24–26 October 2015; pp. 75–83. [Google Scholar]
- Hermann, T.; Hunt, A.; Neuhoff, J.G. The Sonification Handbook; Logos Publishing House: Berlin, Germany, 2011; ISBN 9783832528195. [Google Scholar]
- Wogalter, M.S.; Conzola, V.C.; Smith-Jackson, T.L. Research-based guidelines for warning design and evaluation. Appl. Ergon. 2002, 33, 219–230. [Google Scholar] [CrossRef]
- Edworthy, J. The design and implementation of non-verbal auditory warnings. Appl. Ergon. 1994, 25, 202–210. [Google Scholar] [CrossRef]
- Edworthy, J. Designing effective alarm sounds. Biomed. Instrum. Technol. 2011, 45, 290–294. [Google Scholar] [CrossRef] [PubMed]
- Fritz, J.B.; Elhilali, M.; David, S.V.; Shamma, S.A. Auditory attention-focusing the searchlight on sound. Curr. Opin. Neurobiol. 2007, 17, 437–455. [Google Scholar] [CrossRef] [PubMed]
- Stevens, C.; Brennan, D.; Petocz, A.; Howell, C. Designing informative warning signals: Effects of indicator type, modality, and task demand on recognition speed and accuracy. Adv. Cogn. Psychol. 2009, 5, 84–90. [Google Scholar] [CrossRef] [PubMed]
- Edworthy, J.; Hellier, E. Alarms and human behaviour: Implications for medical alarms. Br. J. Anaesth. 2006, 97, 12–17. [Google Scholar] [CrossRef] [PubMed]
- Peres, S.C.; Best, V.; Brock, D.; Shinn-Cunningham, B.; Frauenberger, C.; Hermann, T.; Neuhoff, J.G.; Nickerson, L.V.; Stockman, T. Auditory Interfaces. In HCI Beyond the GUI. Design for Haptic, Speech, Olfactory and Other Nontraditional Interfaces; Kortum, P., Ed.; Morgan Kaufman: Burlington, MA, USA, 2008; pp. 147–195. ISBN 978-0-12-374017-5. [Google Scholar]
- Fagerlonn, J. Informative auditory warning signals: A review of published material within the HCI and Auditory Display communities. In Proceedings of the 39th Nordic Ergonomics Society Conference, Lysekil, Sweden, 1–3 October 2007; pp. 1–3. [Google Scholar]
- Graham, R. Use of auditory icons as emergency warnings: Evaluation within a vehicle collision avoidance application. Ergonomics 1999, 42, 1233–1248. [Google Scholar] [CrossRef] [PubMed]
- Nilsson, D.; Frantzich, H. Design of Voice Alarms—The benefit of mentioning fire and the use of a synthetic voice. In Pedestrian and Evacuation Dynamics; Springer: Berlin, Heidelberg, 2008; pp. 135–144. ISBN 9783642045035. [Google Scholar]
- Pressnitzer, D.; Sayles, M.; Micheyl, C.; Winter, I.M. Perceptual Organization of Sound Begins in the Auditory Periphery. Curr. Biol. 2008, 18, 1124–1128. [Google Scholar] [CrossRef] [PubMed]
- Alain, C.; Arnott, S.R.; Picton, T.W. Bottom–up and top–down influences on auditory scene analysis: Evidence from event-related brain potentials. J. Exp. Psychol. Hum. Percept. Perform. 2001, 27, 1072. [Google Scholar] [CrossRef] [PubMed]
- Mirsky, A.F.; Anthony, B.J.; Duncan, C.C.; Ahearn, M.B.; Kellam, S.G. Analysis of the elements of attention: A neuropsychological approach. Neuropsychol. Rev. 1991, 2, 109–145. [Google Scholar] [CrossRef] [PubMed]
- Ocasio, W. Attention to attention. Organ. Sci. 2011, 22, 1286–1296. [Google Scholar] [CrossRef]
- Posner, M.I.; Petersen, S.E. The attention system of the human brain. Annu. Rev. Neurosci. 1990, 13, 25–42. [Google Scholar] [CrossRef] [PubMed]
- Petersen, S.E.; Posner, M.I. The attention system of the human brain: 20 Years After. Annu. Rev. Neurosci. 2012, 35, 73–89. [Google Scholar] [CrossRef] [PubMed]
- Cohen, R.A. The Neuropsychology of Attention; Springer: Boston, MA, USA, 2014; ISBN 9780387726397. [Google Scholar]
- Broadbent, D.E. The role of auditory localization in attention and memory span. J. Exp. Psychol. 1954, 47, 191–196. [Google Scholar] [CrossRef] [PubMed]
- Kim, S. The cocktail party effect. Am. Acad. Neurol. 2013, 9, 13. [Google Scholar] [CrossRef]
- Bronkhorst, A.W. The cocktail-party problem revisited: Early processing and selection of multi-talker speech. Atten. Percept. Psychophys. 2015, 77, 1465–1487. [Google Scholar] [CrossRef] [PubMed]
- Lavie, N. Distracted and confused? Selective attention under load. Trends Cogn. Sci. 2005, 9, 75–82. [Google Scholar] [CrossRef] [PubMed]
- Lavie, N.; De Fockert, J. The role of working memory in attentional capture. Psychon. Bull. Rev. 2005, 12, 669–674. [Google Scholar] [CrossRef] [PubMed]
- Lavie, N. Attention, distraction, and cognitive control under load. Curr. Dir. Psychol. Sci. 2010, 19, 143–148. [Google Scholar] [CrossRef]
- Ayres, P.; Paas, F. Cognitive load theory: New directions and challenges. Appl. Cogn. Psychol. 2012, 26, 827–832. [Google Scholar] [CrossRef]
- Botvinick, M.M.; Cohen, J.D.; Carter, C.S. Conflict monitoring and anterior cingulate cortex: An update. Trends Cogn. Sci. 2004, 8, 539–546. [Google Scholar] [CrossRef] [PubMed]
- Gruber, O.; Goschke, T. Executive control emerging from dynamic interactions between brain systems mediating language, working memory and attentional processes. Acta Psychol. (Amst). 2004, 115, 105–121. [Google Scholar] [CrossRef] [PubMed]
- Miller, E.K.; Cohen, J.D. An integrative theory of prefrontal cortex function. Annu. Rev. Neurosci. 2001, 24, 167–202. [Google Scholar] [CrossRef] [PubMed]
- Holmqvist, K.; Nyström, M.; Andersson, R.; Dewhurst, R.; Jarodzka, H.; Van de Weijer, J. Eye Tracking: A Comprehensive Guide to Methods and Measures; Oxford University Press: Oxford, UK, 2011; ISBN 9780198738596. [Google Scholar]
- Oviatt, S.; Coulston, R.; Lunsford, R. When do we interact multimodally? Cognitive load and multimodal communication patterns. In Proceedings of the 6th Annual ACM International Conference on Multimodal Interfaces, State College, PA, USA, 13–15 October 2004; p. 129. [Google Scholar]
- Paletta, L.; Wagner, V.; Kallus, W.; Schrom-Feiertag, H.; Schwarz, M.; Pszeida, M.; Ladstätter, S.; Matyus, T. Human factor modeling from wearable sensed data for evacuation based simulation scenarios. In Proceedings of the 5th International Conference on Applied Human Factors and Ergonomics (AHFE 2014), Krakow, Poland, 19–23 July 2014. [Google Scholar]
- Barreto, A.B.; Jacko, J.A.; Hugh, P. Impact of spatial auditory feedback on the efficiency of iconic human-computer interfaces under conditions of visual impairment. Comput. Human Behav. 2007, 23, 1211–1231. [Google Scholar] [CrossRef]
- Marston, J.R.; Loomis, J.M.; Klatzky, R.L.; Golledge, R.G.; Smith, E.L. Evaluation of spatial displays for navigation without sight. ACM Trans. Appl. Percept. 2006, 3, 110–124. [Google Scholar] [CrossRef]
- Singh, D. Spatial auditory based interaction model for driver assistance system. World Appl. Sci. J. 2012, 20, 560–564. [Google Scholar] [CrossRef]
- Roginska, A.; Childs, E.; Johnson, M.K. Monitoring real-time data: A sonification approach. In Proceedings of the 12th International Conference on Auditory Display (ICAD2006), London, UK, 20–23 June 2006. [Google Scholar]
- Levinson, J. The Oxford Handbook of Aesthetics; Oxford University Press: Oxford, UK, 2009; ISBN 9780191577239. [Google Scholar]
- Choi, I.; Wang, L.; Bharadwaj, H.; Shinn-Cunningham, B. Individual differences in attentional modulation of cortical responses correlate with selective attention performance. Hear. Res. 2014, 314, 10–19. [Google Scholar] [CrossRef] [PubMed]
- Bigand, E.; McAdams, S.; Forêt, S. Divided attention in music. Int. J. Psychol. 2000, 35, 270–278. [Google Scholar] [CrossRef]
- Liljedahl, M.; Fagerlönn, J. Methods for sound design: A review and implications for research and practice. In Proceedings of the 5th Audio Mostly Conference: A Conference on Interaction with Sound, Piteå, Sweden, 15–17 September 2010; ACM: New York, NY, USA; pp. 1–8. [Google Scholar]
- Hodges, D.; Sebald, D.C. Music in the Human Experience: An Introduction to Music Psychology; Routledge: Abingdon-on-Thames, UK, 2010; ISBN 0203834976. [Google Scholar]
- National Fire Protection Association. Standard on Disaster/Emergency Management and business Continuity Programs; National Fire Protection Association: Quincy, MA, USA, 2013; ISBN 978-145590648-2. [Google Scholar]
- Bukowski, R.; Moore, W.D. Fire Alarm Signaling Systems; National Fire Protection Association: Quincy, MA, USA, 1994; ISBN 978-0877653998. [Google Scholar]
- Allen, E.J.; Oxenham, A.J. Symmetric interactions and interference between pitch and timbre. J. Acoust. Soc. Am. 2014, 135, 1371–1379. [Google Scholar] [CrossRef] [PubMed]
- Li, D.; Cowan, N.; Saults, J.S. Estimating working memory capacity for lists of nonverbal sounds. Atten. Percept. Psychophys. 2012, 75, 145–160. [Google Scholar] [CrossRef] [PubMed]
- Golubock, J.L.; Janata, P. Keeping timbre in mind: Working memory for complex sounds that can’t be verbalized. J. Exp. Psychol. Hum. Percept. Perform. 2013, 39, 399–412. [Google Scholar] [CrossRef] [PubMed]
- Pearce, M.T.; Wiggins, G.A. Auditory Expectation: The information dynamics of music perception and cognition. Top. Cogn. Sci. 2012, 4, 625–652. [Google Scholar] [CrossRef] [PubMed]
- Deutsch, D. Grouping Mechanisms in Music. In The Psychology of Music; Academic Press: San Diego, CA, USA, 2013; pp. 183–248. ISBN 9780123814609. [Google Scholar]
- Deutsch, D. The Processing of Pitch Combinations. In The Psychology of Music; Academic Press: San Diego, CA, USA, 2013; pp. 249–325. ISBN 9780123814609. [Google Scholar]
- Crawley, E.J.; Acker-Mills, B.E.; Pastore, R.E.; Weil, S. Change detection in multi-voice music: The role of musical structure, musical training, and task demands. J. Exp. Psychol. Hum. Percept. Perform. 2002, 28, 367. [Google Scholar] [CrossRef] [PubMed]
- Demorest, S.M.; Osterhout, L. ERP responses to cross-cultural melodic expectancy violations. Ann. N. Y. Acad. Sci. 2012, 1252, 152–157. [Google Scholar] [CrossRef] [PubMed]
- Macken, W.J.; Tremblay, S.; Houghton, R.J.; Nicholls, A.P.; Jones, D.M. Does auditory streaming require attention? Evidence from attentional selectivity in short-term memory. J. Exp. Psychol. Hum. Percept. Perform. 2003, 29, 43. [Google Scholar] [CrossRef] [PubMed]
- Snyder, J.S.; Alain, C.; Picton, T.W. Effects of attention on neuroelectric correlates of auditory stream segregation. J. Cogn. Neurosci. 2006, 18, 1–13. [Google Scholar] [CrossRef] [PubMed]
- Janata, P.; Tillmann, B.; Bharucha, J.J. Listening to polyphonic music recruits domain-general attention and working memory circuits. Cogn. Affect. Behav. Neurosci. 2002, 2, 121–140. [Google Scholar] [CrossRef] [PubMed]
- Lee, Y.-S.; Janata, P.; Frost, C.; Hanke, M.; Granger, R. Investigation of melodic contour processing in the brain using multivariate pattern-based fMRI. Neuroimage 2011, 57, 293–300. [Google Scholar] [CrossRef] [PubMed]
- Fujioka, T.; Trainor, L.J.; Ross, B.; Kakigi, R.; Pantev, C. Automatic encoding of polyphonic melodies in musicians and nonmusicians. J. Cogn. Neurosci. 2005, 17, 1578–1592. [Google Scholar] [CrossRef] [PubMed]
- Sawhney, N.; Schmandt, C. Nomadic radio: Speech and audio interaction for contextual messaging in nomadic environments. ACM Trans. Comput. Interact. 2000, 7, 353–383. [Google Scholar] [CrossRef]
- Gaver, W.W.; Smith, R.B.; O’Shea, T. Effective sounds in complex systems: The Arkola simulation. Proc. CHI 1991, 1991, 85–90. [Google Scholar] [CrossRef]
- Gaver, W.W. Auditory interfaces. In Handbook of Human-Computer Interaction (Second Edition); Helander, M.G., Landauer, T.K., Prabhu, P.V., Eds.; Elsvier: Amsterdam, The Netherlands, 1997; pp. 1003–1041. ISBN 978-0-444-81862-1. [Google Scholar]
- Jeong, E. Psychometric validation of a music-based attention assessment: Revised for patients with traumatic brain injury. J. Music Ther. 2013, 50, 66–92. [Google Scholar] [CrossRef] [PubMed]
- Jeong, E.; Lesiuk, T.L. Development and preliminary evaluation of a music-based attention assessment for patients with traumatic brain injury. J. Music Ther. 2011, 48, 551–572. [Google Scholar] [CrossRef] [PubMed]
- Laguë-Beauvais, M.; Brunet, J.; Gagnon, L.; Lesage, F.; Bherer, L. A fNIRS investigation of switching and inhibition during the modified Stroop task in younger and older adults. Neuroimage 2013, 64, 485–495. [Google Scholar] [CrossRef] [PubMed]
- Plakke, B.; Romanski, L.M. Auditory connections and functions of prefrontal cortex. Front. Neurosci. 2014, 8, 199. [Google Scholar] [CrossRef] [PubMed]
- McKendrick, R.; Ayaz, H.; Olmstead, R.; Parasuraman, R. Enhancing dual-task performance with verbal and spatial working memory training: Continuous monitoring of cerebral hemodynamics with NIRS. Neuroimage 2014, 85, 1014–1026. [Google Scholar] [CrossRef] [PubMed]
- Ogawa, Y.; Kotani, K.; Jimbo, Y. Relationship between working memory performance and neural activation measured using near-infrared spectroscopy. Brain Behav. 2014, 4, 544–551. [Google Scholar] [CrossRef] [PubMed]
- Fishburn, F.A.; Norr, M.E.; Medvedev, A.V.; Vaidya, C.J. Sensitivity of fNIRS to cognitive state and load. Front. Hum. Neurosci. 2014, 8, 76. [Google Scholar] [CrossRef] [PubMed]
- Rustichini, A. Decision-making and neuroeconomics. In Encyclopedia of Neuroscience; Squire, L.R., Ed.; Elsevier: New York, NY, USA, 2010; pp. 323–328. ISBN 9780080450469. [Google Scholar]
- Agostini, G.; Longari, M.; Pollastri, E. Musical instrument timbres classification with spectral features. EURASIP J. Appl. Signal Process. 2003, 2003, 5–14. [Google Scholar] [CrossRef]
- Jeong, E.; Ryu, H. Melodic contour identification reflects the cognitive threshold of aging. Front. Aging Neurosci. 2016, 8. [Google Scholar] [CrossRef] [PubMed]
- Peck, E.M.M.; Yuksel, B.F.; Ottley, A.; Jacob, R.J.K.; Chang, R. Using fNIRS brain sensing to evaluate information visualization interfaces. In Proceedings of the SIGCHI Conference on Human Factors in Computing Systems, Paris, France, 27 April–2 May 2013; ACM: New York, NY, USA; pp. 473–482. [Google Scholar]
- Yasumura, A.; Inagaki, M.; Hiraki, K. Relationship between neural activity and executive function: An NIRS study. ISRN Neurosci. 2014, 2014. [Google Scholar] [CrossRef] [PubMed]
- Akgul Sankur, B.; Akin, A.C.B. Spectral analysis of event-related hemodynamic responses in functional near infrared spectroscopy. J. Comput. Neurosci. 2005, 18, 67–83. [Google Scholar] [CrossRef] [PubMed]
- Bauernfeind, G.; Scherer, R.; Pfurtscheller, G.; Neuper, C. Single-trial classification of antagonistic oxyhemoglobin responses during mental arithmetic. Med. Biol. Eng. Comput. 2011, 49, 979–984. [Google Scholar] [CrossRef] [PubMed]
- Morren, G.; Wolf, M.; Lemmerling, P.; Wolf, U.; Choi, J.H.; Gratton, E.; De Lathauwer, L.; Van Huffel, S. Detection of fast neuronal signals in the motor cortex from functional near infrared spectroscopy measurements using independent component analysis. Med. Biol. Eng. Comput. 2004, 42, 92–99. [Google Scholar] [CrossRef] [PubMed]
- Herff, C.; Heger, D.; Putze, F.; Hennrich, J.; Fortmann, O.; Schultz, T. Classification of mental tasks in the prefrontal cortex using fNIRS. Conf. Proc. IEEE Eng. Med. Biol. Soc. 2013, 2013, 2160–2163. [Google Scholar] [CrossRef] [PubMed]
- Woltz, D.J.; Was, C.A. Availability of related long-term memory during and after attention focus in working memory. Mem. Cognit. 2006, 34, 668–684. [Google Scholar] [CrossRef] [PubMed]
- Vandierendonck, A. A comparison of methods to combine speed and accuracy measures of performance: A rejoinder on the binning procedure. Behav. Res. Methods 2017, 49, 653–673. [Google Scholar] [CrossRef] [PubMed]
- Trainor, L.J.; Marie, C.; Bruce, I.C.; Bidelman, G.M. Explaining the high voice superiority effect in polyphonic music: Evidence from cortical evoked potentials and peripheral auditory models. Hear. Res. 2014, 308, 60–70. [Google Scholar] [CrossRef] [PubMed]
- Trainor, L.J.; McDonald, K.L.; Alain, C. Automatic and controlled processing of melodic contour and interval information measured by electrical brain activity. J. Cogn. Neurosci. 2002, 14, 430–442. [Google Scholar] [CrossRef] [PubMed]
- Hugenschmidt, C.E.; Peiffer, A.M.; McCoy, T.P.; Hayasaka, S.; Laurienti, P.J. Preservation of crossmodal selective attention in healthy aging. Exp. Brain Res. 2009, 198, 273–285. [Google Scholar] [CrossRef] [PubMed]
- Couperus, J.W. Perceptual Load Influences Selective Attention across Development. Dev. Psychol. 2011, 47, 1431–1439. [Google Scholar] [CrossRef] [PubMed]
- Quigley, C.; Müller, M.M. Feature-selective attention in healthy old age: A selective decline in selective attention? J. Neurosci. 2014, 34, 2471–2476. [Google Scholar] [CrossRef] [PubMed]
- Hill, K.T.; Miller, L.M. Auditory attentional control and selection during cocktail party listening. Cereb. Cortex 2010, 20, 583–590. [Google Scholar] [CrossRef] [PubMed]
- Gallun, F.J.; Mason, C.R.; Kidd, G. Task-dependent costs in processing two simultaneous auditory stimuli. Percept. Psychophys. 2007, 69, 757–771. [Google Scholar] [CrossRef] [PubMed]
- Shinn-Cunningham, B.G.; Ihlefeld, A. Selective and divided attention: extracting information from simultaneous sound sources. In Proceedings of the 10the Meeting of the International Conference on Auditory Display, Sydney, Astralia, 6–9 July 2004; pp. 1–8. [Google Scholar]
- Azouvi, P.; Couillet, J.; Leclercq, M.; Martin, Y.; Asloun, S.; Rousseaux, M. Divided attention and mental effort after severe traumatic brain injury. Neuropsychologia 2004, 42, 1260–1268. [Google Scholar] [CrossRef] [PubMed]
- Blanchet, S.; Paradis-Giroux, A.-A.; Pépin, M.; McKerral, M. Impact of divided attention during verbal learning in young adults following mild traumatic brain injury. Brain Inj. 2009, 23, 111–122. [Google Scholar] [CrossRef] [PubMed]
- Cui, X.; Bray, S.; Reiss, A.L. Functional near infrared spectroscopy (NIRS) signal improvement based on negative correlation between oxygenated and deoxygenated hemoglobin dynamics. Neuroimage 2010, 49, 3039–3046. [Google Scholar] [CrossRef] [PubMed]
- Matsukawa, K.; Ishii, K.; Liang, N.; Endo, K.; Ohtani, R.; Nakamoto, T.; Wakasugi, R.; Kadowaki, A.; Komine, H. Increased oxygenation of the cerebral prefrontal cortex prior to the onset of voluntary exercise in humans. J. Appl. Physiol. 2015. [Google Scholar] [CrossRef] [PubMed]
- Jeong, E.; Kwon, G.H.; So, J. Exploring the taxonomy and associative link between emotion and function for robot sound design. In Proceedings of the 2017 14th International Conference on Ubiquitous Robots and Ambient Intelligence, Jeju, Korea, 28 June–1 July 2017. [Google Scholar]
- Krumhansl, C.L. Why is musical timbre so hard to understand. Struct. Percept. Electroacoust. Sound Music 1989, 9, 43–53. [Google Scholar]
- Krumhansl, C.L. Cognitive Foundations of Musical Pitch; Oxford University Press: Oxford, UK, 2010; ISBN 978-0195148367. [Google Scholar]
- Lakatos, S. A common perceptual space for harmonic and percussive timbres. Percept. Psychophys. 2000, 62, 1426–1439. [Google Scholar] [CrossRef] [PubMed]
- Schröter, H.; Ulrich, R.; Miller, J. Effects of redundant auditory stimuli on reaction time. Psychon. Bull. Rev. 2007, 14, 39–44. [Google Scholar] [CrossRef] [PubMed]
- Galvin, J.J., III; Fu, Q.-J.; Oba, S.I. Effect of a competing instrument on melodic contour identification by cochlear implant users. J. Acoust. Soc. Am. 2009, 125, EL98–EL103. [Google Scholar] [CrossRef] [PubMed]
- Baker, J.M.; Liu, N.; Cui, X.; Vrticka, P.; Saggar, M.; Hosseini, S.M.H.; Reiss, A.L. Sex differences in neural and behavioral signatures of cooperation revealed by fNIRS hyperscanning. Sci. Rep. 2016, 6, 26492. [Google Scholar] [CrossRef] [PubMed]
- Li, T.; Luo, Q.; Gong, H. Gender-specific hemodynamics in prefrontal cortex during a verbal working memory task by near-infrared spectroscopy. Behav. Brain Res. 2010, 209, 148–153. [Google Scholar] [CrossRef] [PubMed]
- Yang, H.; Zhou, Z.; Liu, Y.; Ruan, Z.; Gong, H.; Luo, Q.; Lu, Z. Gender difference in hemodynamic responses of prefrontal area to emotional stress by near-infrared spectroscopy. Behav. Brain Res. 2007, 178, 172–176. [Google Scholar] [CrossRef] [PubMed]
- Fastl, H.; Zwicker, E. Psychoacoustics: Facts and Models; Springer: Berlin/Heidelberg, Germany, 2007; ISBN 978-3-540-23159-2. [Google Scholar]
- Moriguchi, Y.; Hiraki, K. Prefrontal cortex and executive function in young children: A review of NIRS studies. Front. Hum. Neurosci. 2013, 7, 867. [Google Scholar] [CrossRef] [PubMed]
- Sato, H.; Yahata, N.; Funane, T.; Takizawa, R.; Katura, T.; Atsumori, H.; Nishimura, Y.; Kinoshita, A.; Kiguchi, M.; Koizumi, H. A NIRS–fMRI investigation of prefrontal cortex activity during a working memory task. Neuroimage 2013, 83, 158–173. [Google Scholar] [CrossRef] [PubMed]


| CIT | Target | Distractor | Given Task | Cognitive Load |
|---|---|---|---|---|
| 1 | Melodic contour | None | Focus | Low High |
| 2 | Melodic contour | Environmental sounds | Focus | |
| 3 | Melodic contour | Target-like contours | Select | |
| 4 | Melodic contour | Target-like contours | Shift | |
| 5 | Melodic contour | Target-like contours | Divide |
| CITs | Characteristics | Accuracy | Reaction Time (ms) | ||
|---|---|---|---|---|---|
| Mean | SD | Mean | SD | ||
| 1 | Focused identification task | 0.97 | 0.11 | 2895 | 842 |
| 2 | Focused identification task against noise | 0.96 | 0.11 | 2489 | 785 |
| 3 | Selective identification task | 0.92 | 0.11 | 2998 | 1443 |
| 4 | Alternating identification task | 0.89 | 0.12 | 3906 | 902 |
| 5 | Divided identification task | 0.67 | 0.17 | 7825 | 2292 |
| CIT | Oxy/Deoxygenation | CH7 | CH8 | CH9 | CH10 | ||||
|---|---|---|---|---|---|---|---|---|---|
| M | SD | M | SD | M | SD | M | SD | ||
| 1 | HbO2 | 0.036 | 0.028 | 0.002 | 0.024 | 0.032 | 0.020 | 0.002 | 0.030 |
| HHb | −0.066 | 0.019 | −0.086 | 0.025 | −0.056 | 0.022 | −0.076 | 0.025 | |
| 2 | HbO2 | 0.034 | 0.027 | 0.000 | 0.024 | 0.032 | 0.02 | 0.000 | 0.029 |
| HHb | −0.066 | 0.018 | −0.087 | 0.024 | −0.056 | 0.022 | −0.077 | 0.025 | |
| 3 | HbO2 | 0.033 | 0.028 | 0.003 | 0.022 | 0.036 | 0.02 | 0.003 | 0.029 |
| HHb | −0.071 | 0.018 | −0.086 | 0.024 | −0.057 | 0.023 | −0.080 | 0.023 | |
| 4 | HbO2 | 0.034 | 0.026 | 0.013 | 0.028 | 0.032 | 0.018 | 0.011 | 0.031 |
| HHb | −0.075 | 0.022 | −0.090 | 0.028 | −0.062 | 0.024 | −0.080 | 0.028 | |
| 5 | HbO2 | 0.04 | 0.03 | 0.014 | 0.027 | 0.051 | 0.022 | 0.026 | 0.038 |
| HHb | −0.071 | 0.020 | −0.075 | 0.028 | −0.057 | 0.024 | −0.073 | 0.028 | |
| Timbre Similarity | Direction Congruence | Number of Items | Mean | SD |
|---|---|---|---|---|
| Similar | Congruent | 27 | 1.00 | 0.00 |
| Incongruent | 176 | 0.84 | 0.37 | |
| Dissimilar | Congruent | 69 | 0.97 | 0.17 |
| Incongruent | 340 | 0.95 | 0.21 |
© 2018 by the authors. Licensee MDPI, Basel, Switzerland. This article is an open access article distributed under the terms and conditions of the Creative Commons Attribution (CC BY) license (http://creativecommons.org/licenses/by/4.0/).
Share and Cite
Jeong, E.; Ryu, H.; Jo, G.; Kim, J. Cognitive Load Changes during Music Listening and its Implication in Earcon Design in Public Environments: An fNIRS Study. Int. J. Environ. Res. Public Health 2018, 15, 2075. https://doi.org/10.3390/ijerph15102075
Jeong E, Ryu H, Jo G, Kim J. Cognitive Load Changes during Music Listening and its Implication in Earcon Design in Public Environments: An fNIRS Study. International Journal of Environmental Research and Public Health. 2018; 15(10):2075. https://doi.org/10.3390/ijerph15102075
Chicago/Turabian StyleJeong, Eunju, Hokyoung Ryu, Geonsang Jo, and Jaehyeok Kim. 2018. "Cognitive Load Changes during Music Listening and its Implication in Earcon Design in Public Environments: An fNIRS Study" International Journal of Environmental Research and Public Health 15, no. 10: 2075. https://doi.org/10.3390/ijerph15102075
APA StyleJeong, E., Ryu, H., Jo, G., & Kim, J. (2018). Cognitive Load Changes during Music Listening and its Implication in Earcon Design in Public Environments: An fNIRS Study. International Journal of Environmental Research and Public Health, 15(10), 2075. https://doi.org/10.3390/ijerph15102075