Spatio-Temporal Distribution of Vector-Host Contact (VHC) Ratios and Ecological Niche Modeling of the West Nile Virus Mosquito Vector, Culex quinquefasciatus, in the City of New Orleans, LA, USA

 , ,
, ,
Abstract
:1. Introduction
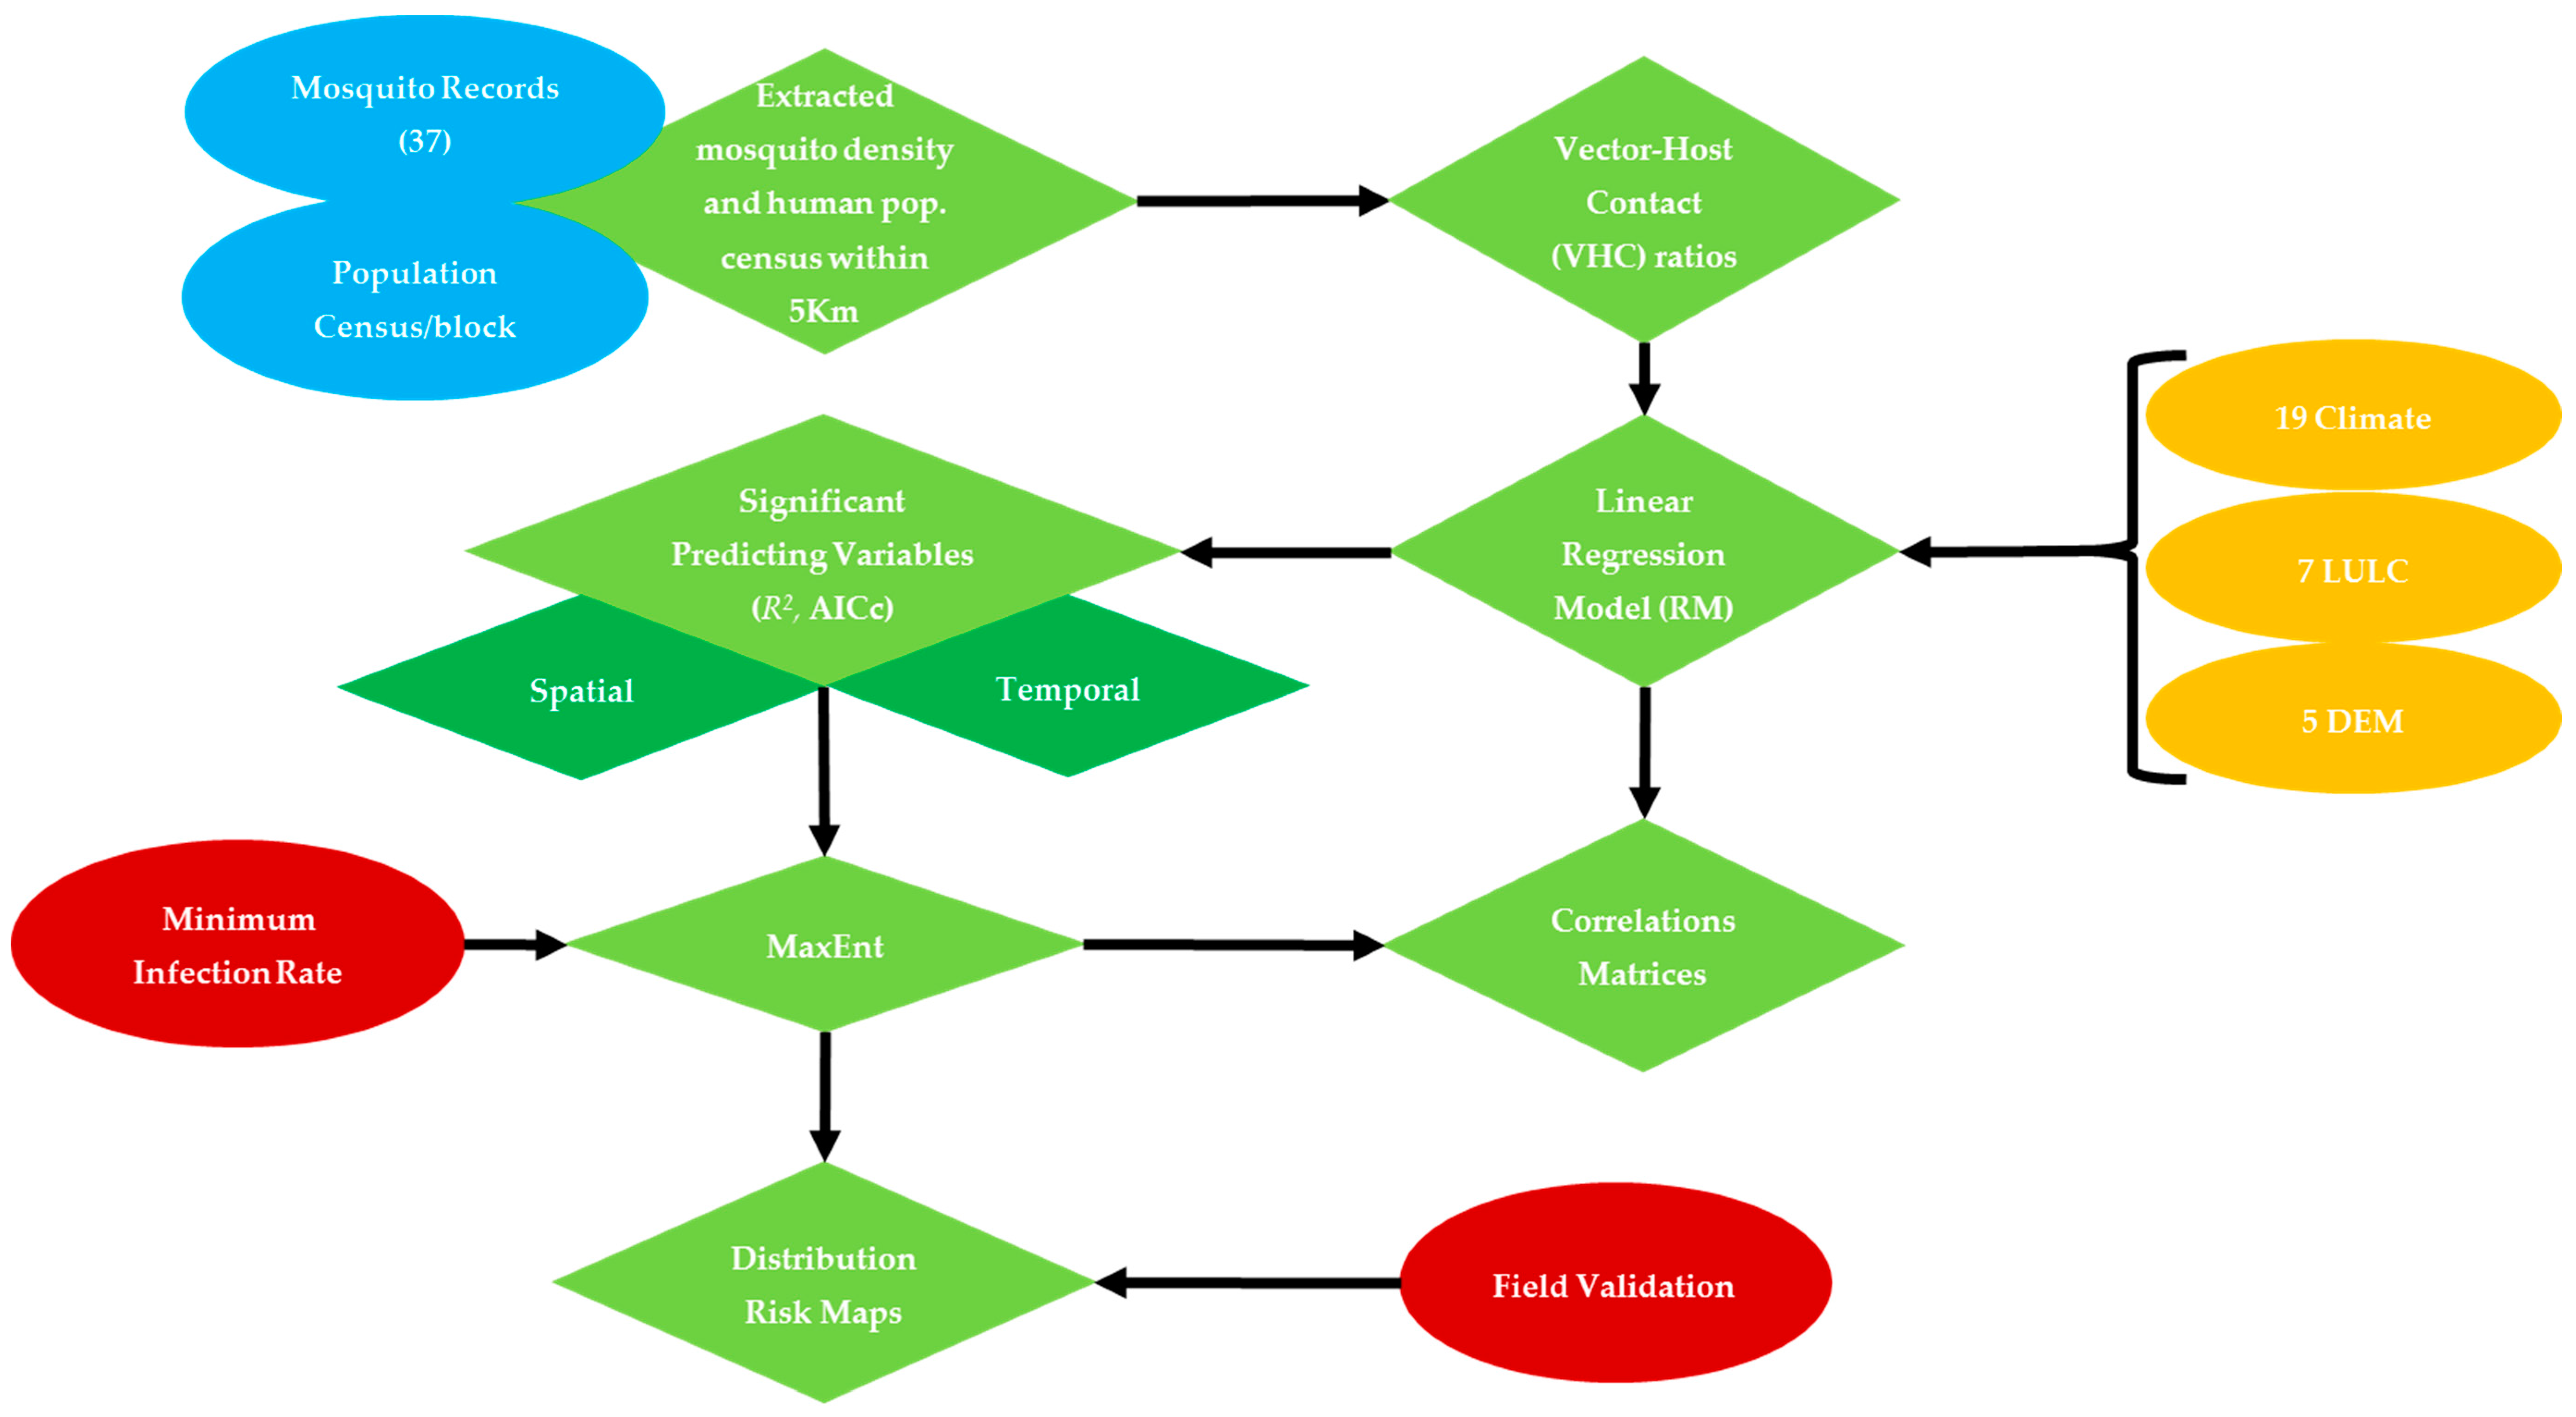
2. Materials and Methods
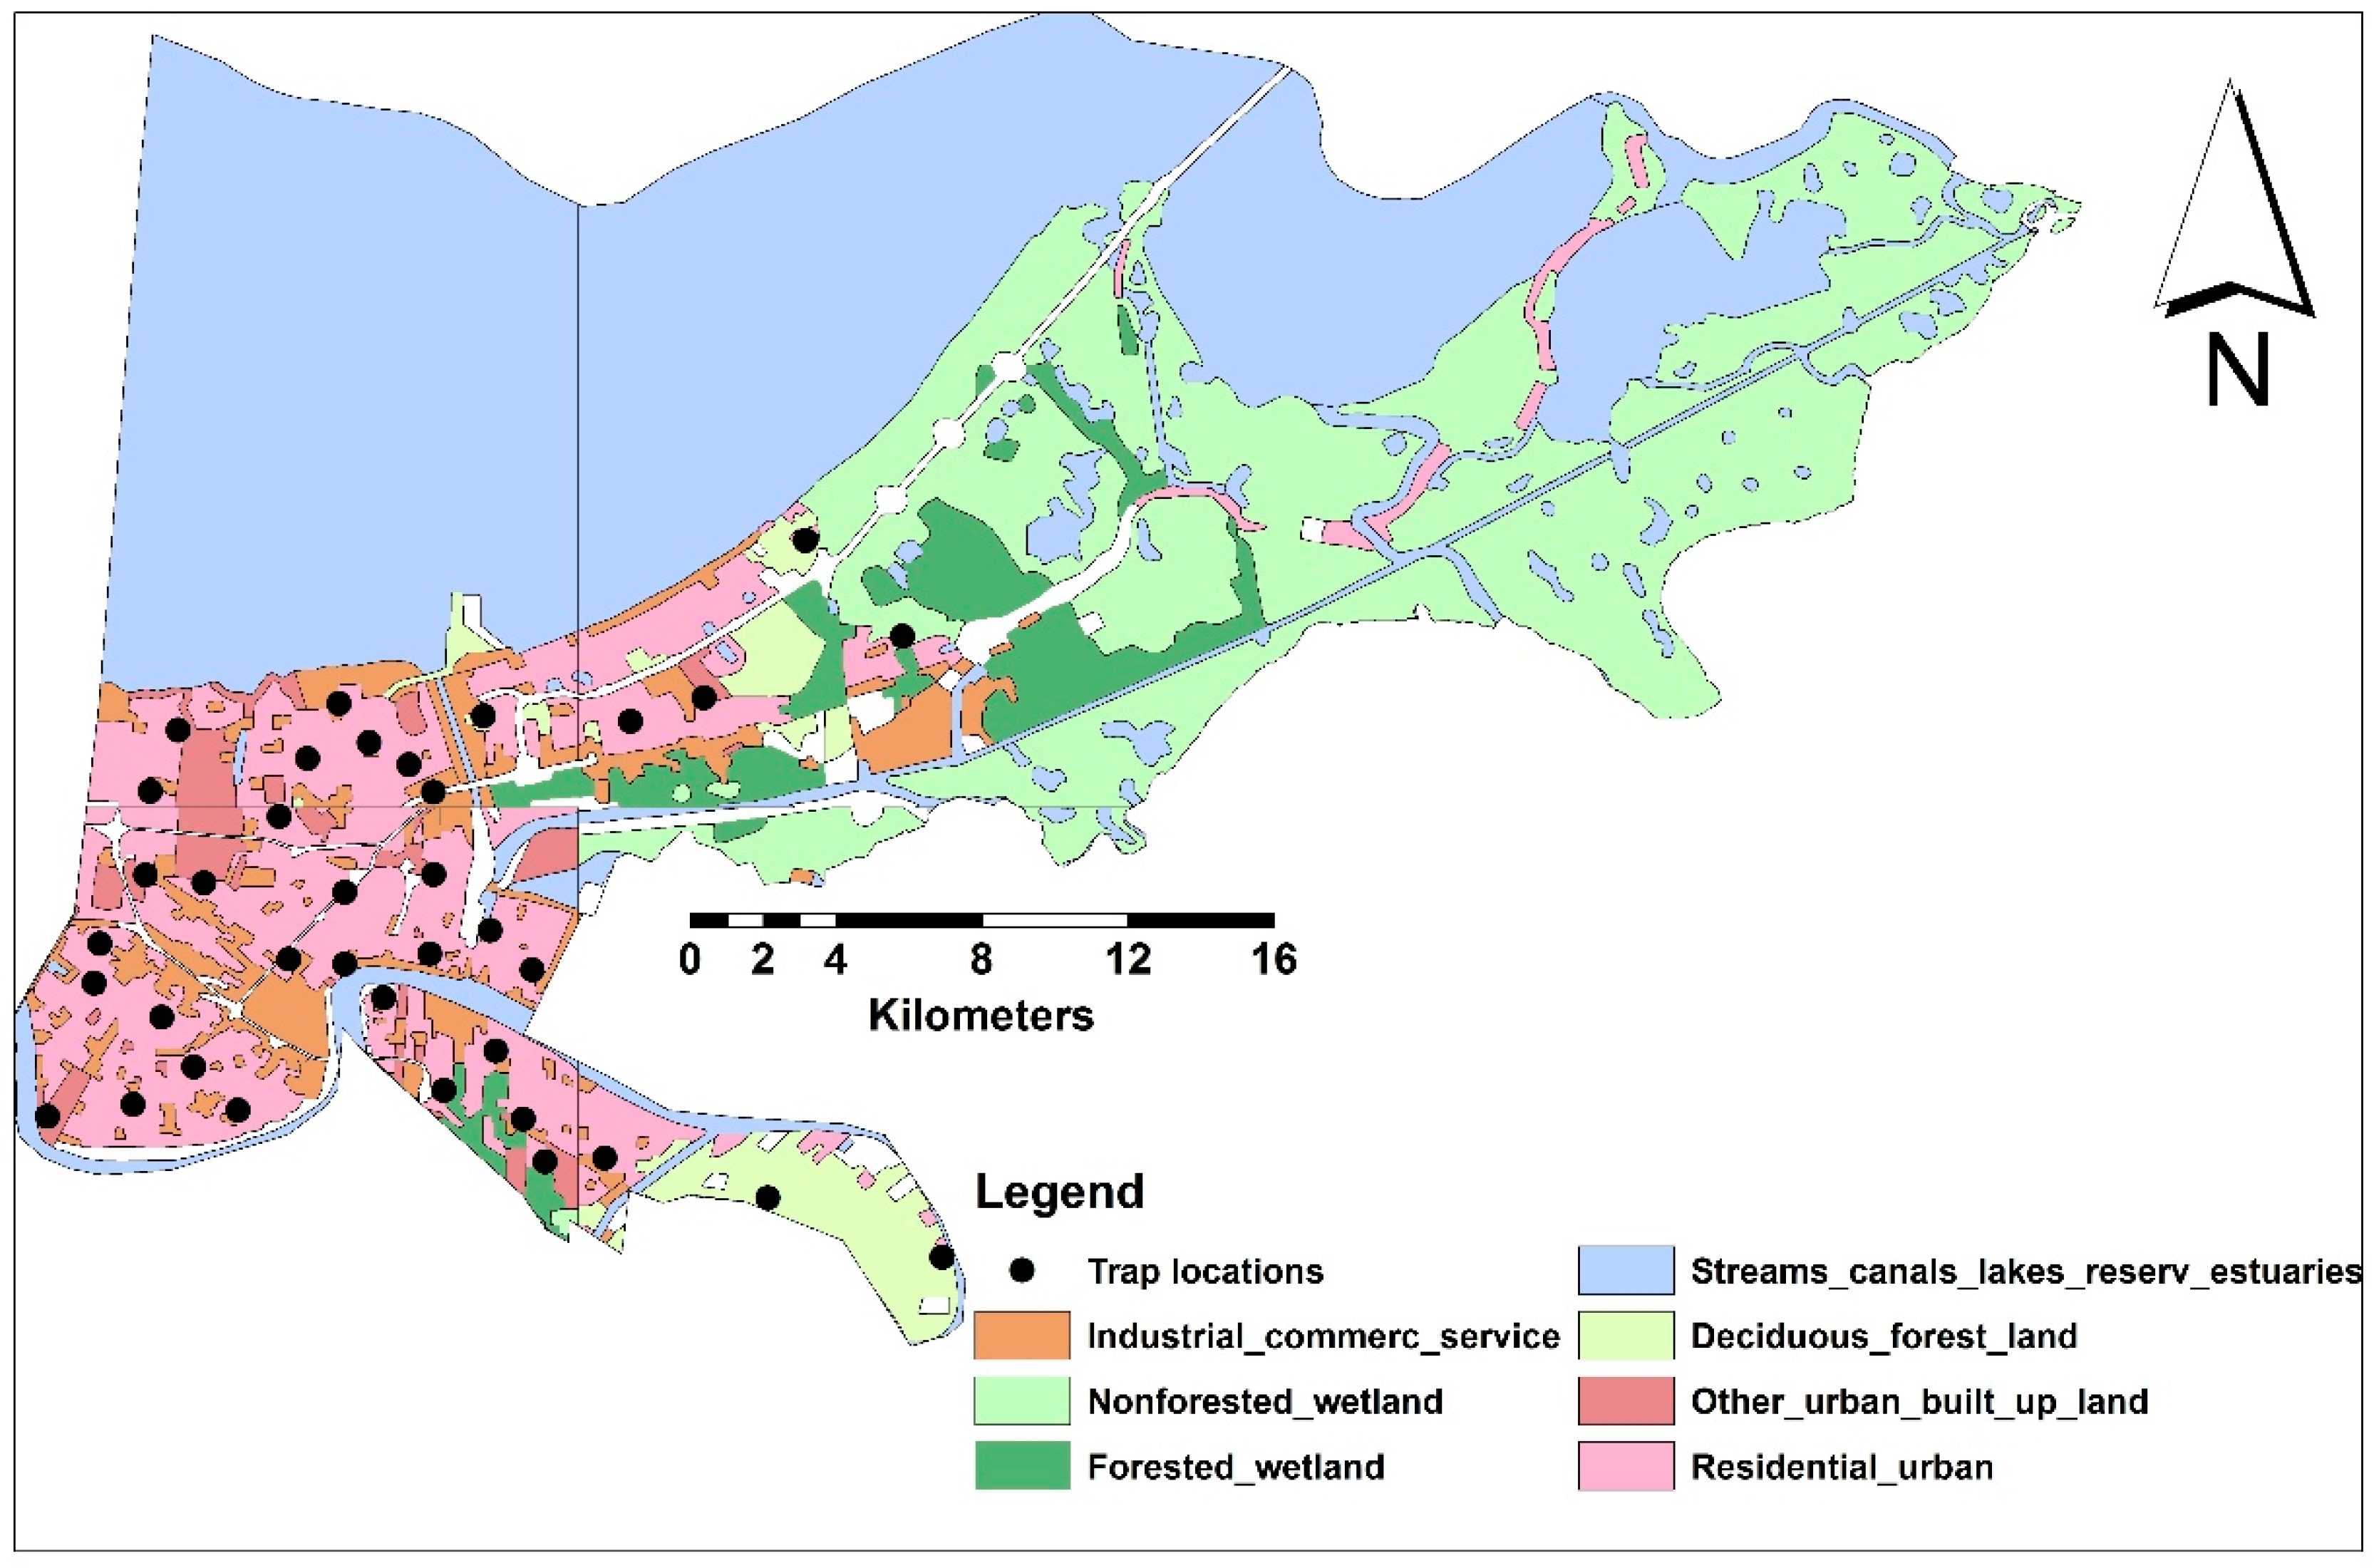
2.1. Study Area
2.2. Data Layers
2.2.1. Mosquito Sampling and Socioeconomic Data
2.2.2. Bioclimatic Data
2.2.3. Land Use-Land Cover Data (LULC)
2.3. Variables Selection
2.4. Habitat Suitability Modeling of WNV Vector
2.5. Model Validation
3. Results
3.1. Variables Selection
3.1.1. Spatial Analysis
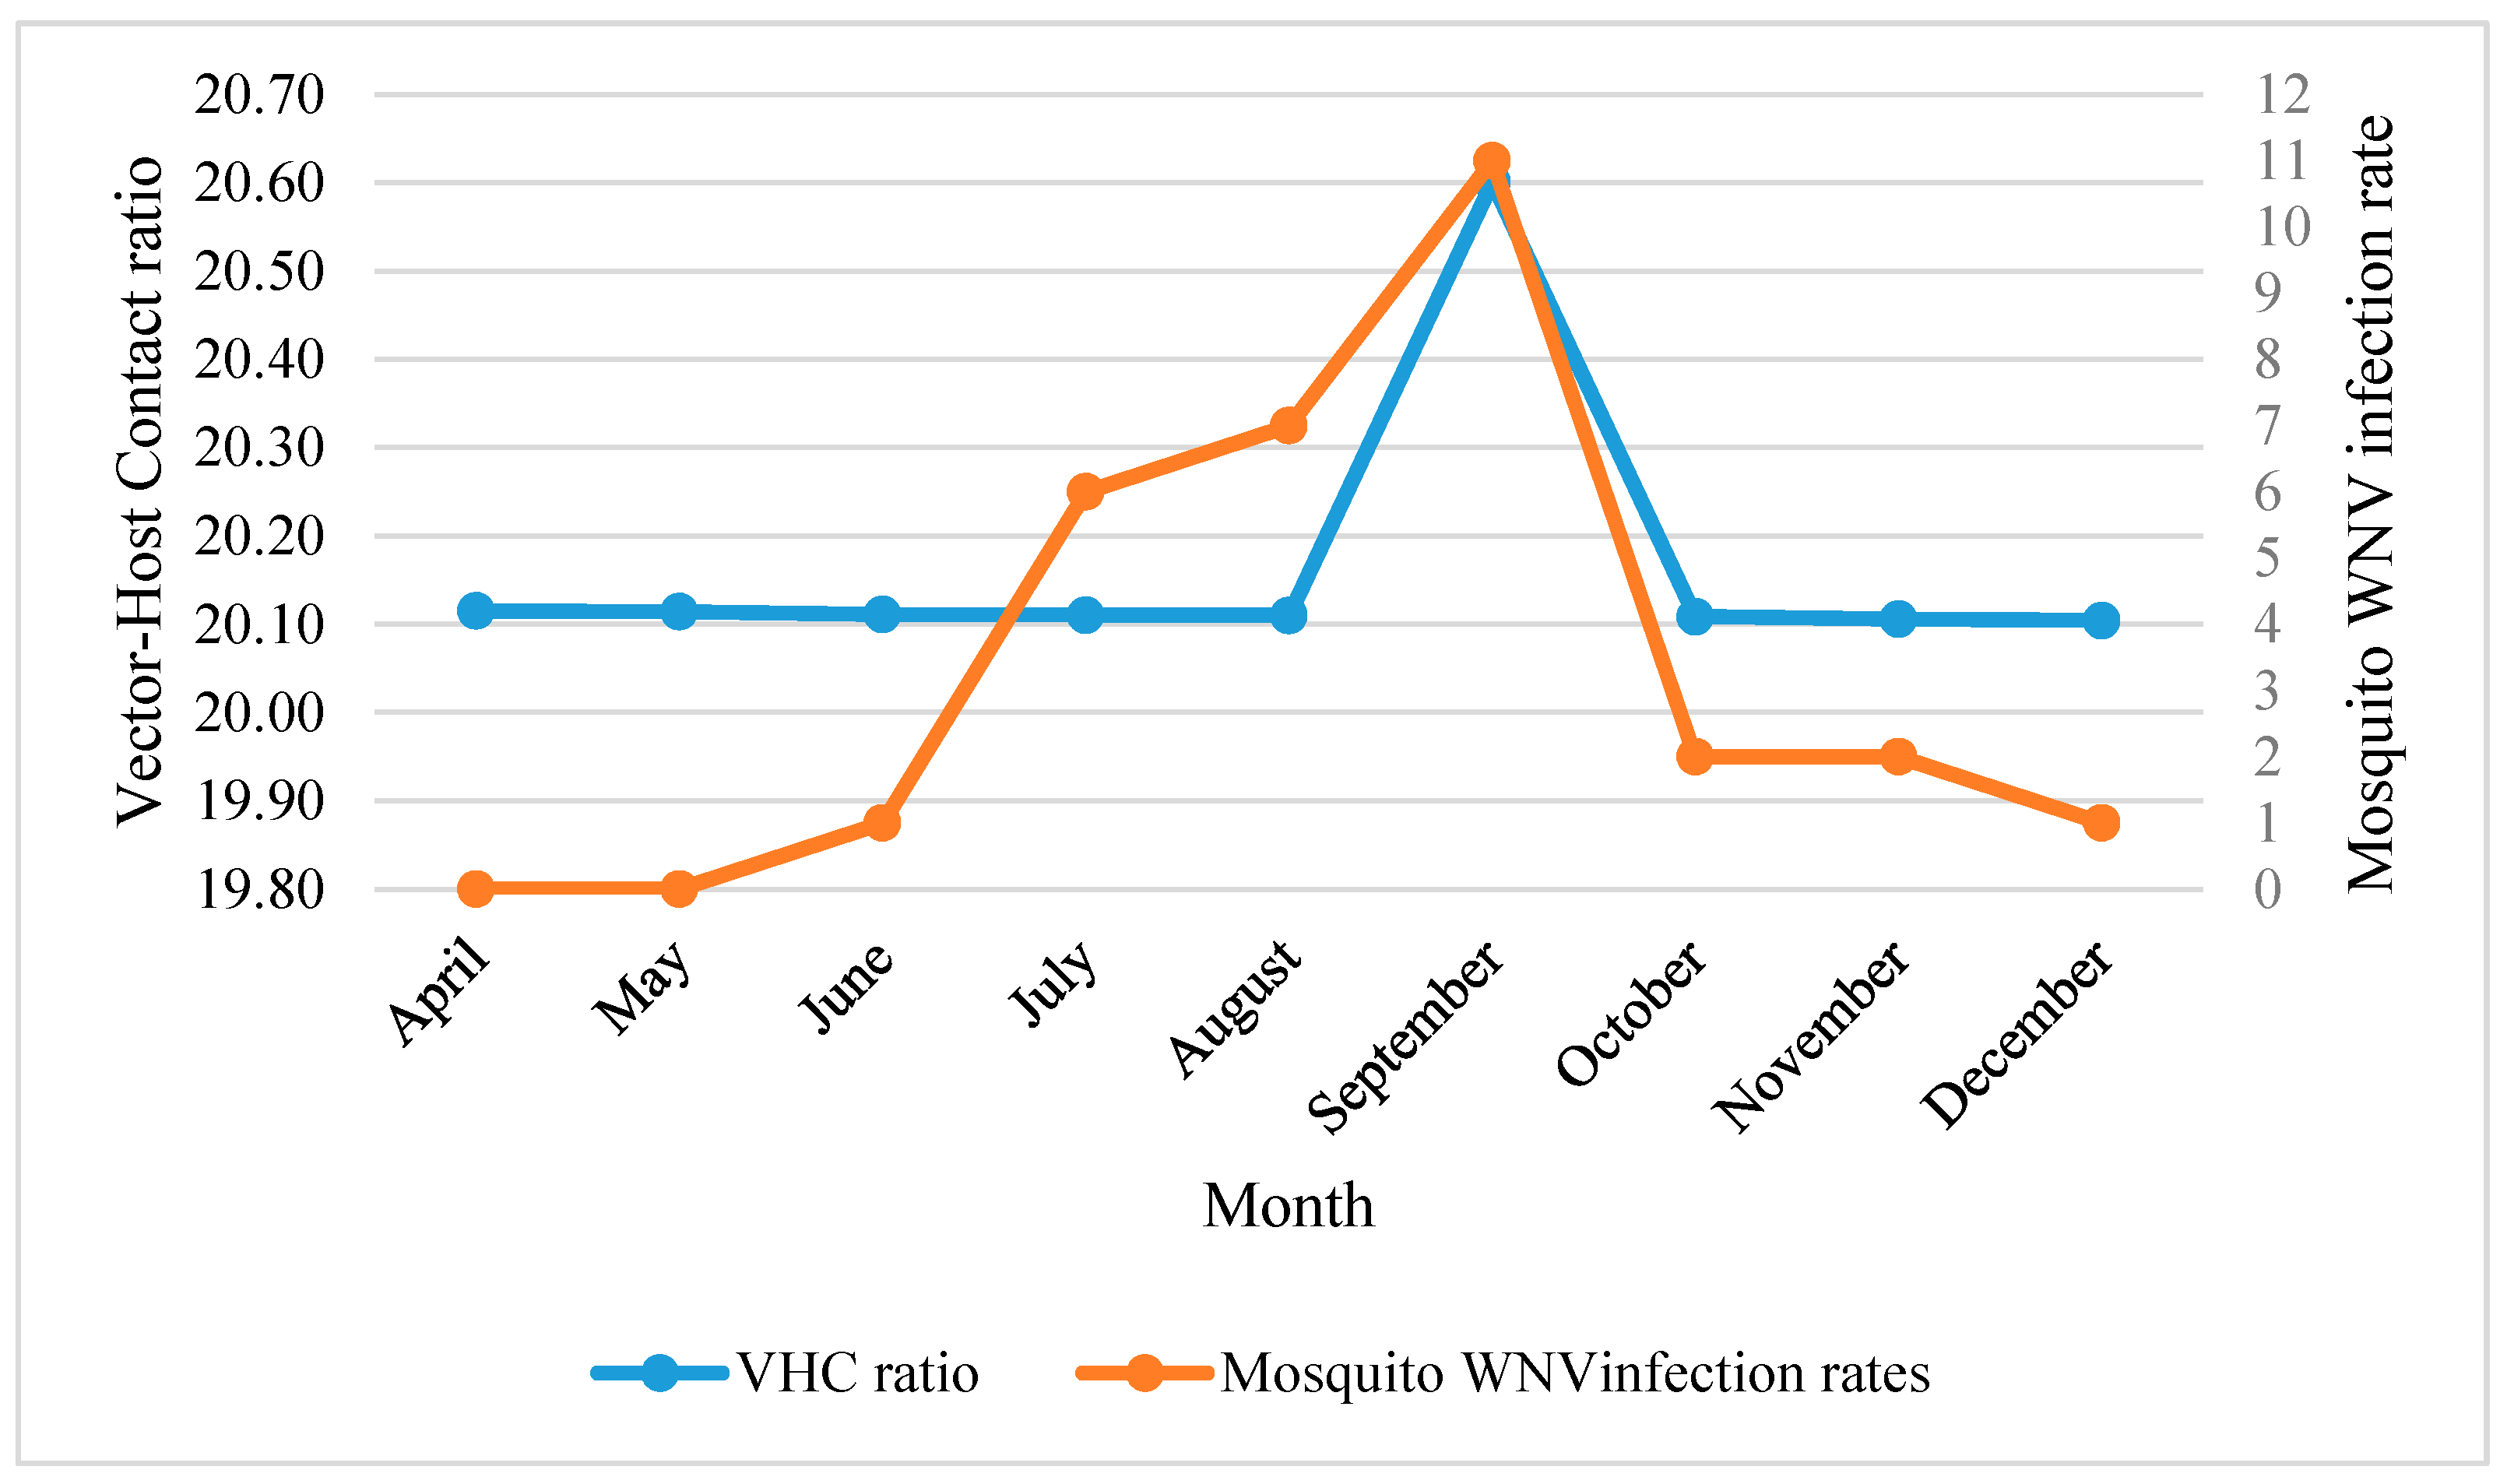
3.1.2. Temporal Analysis
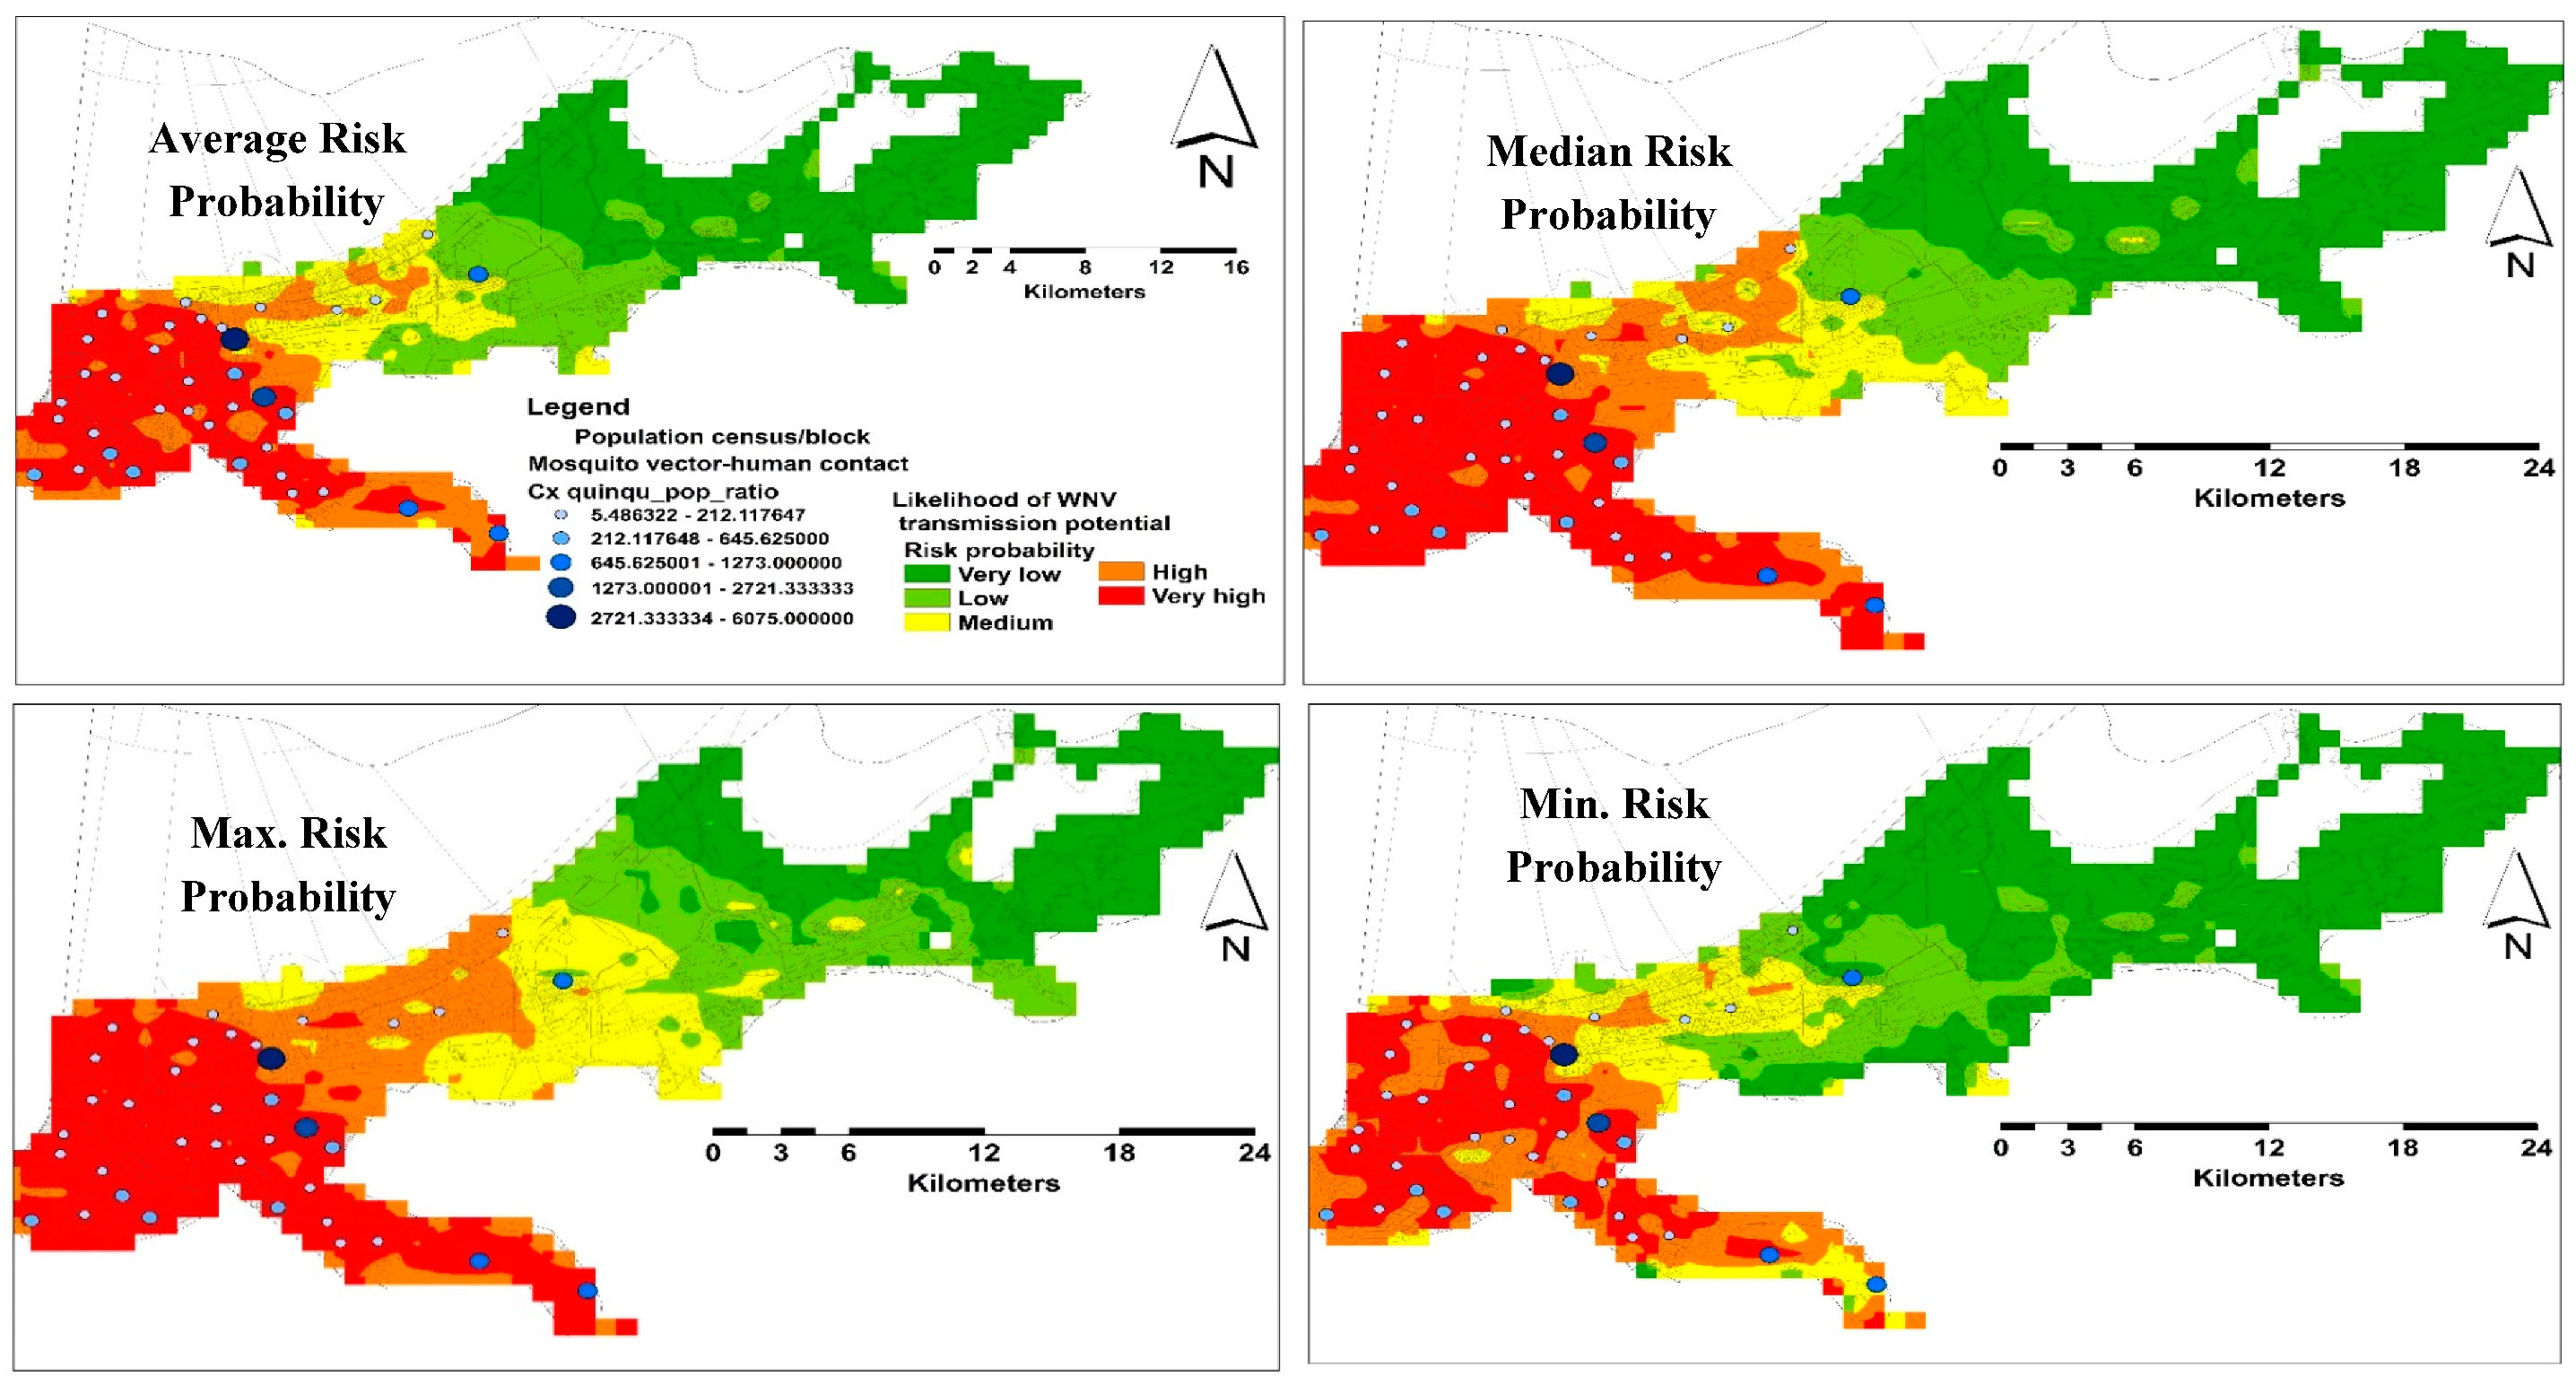
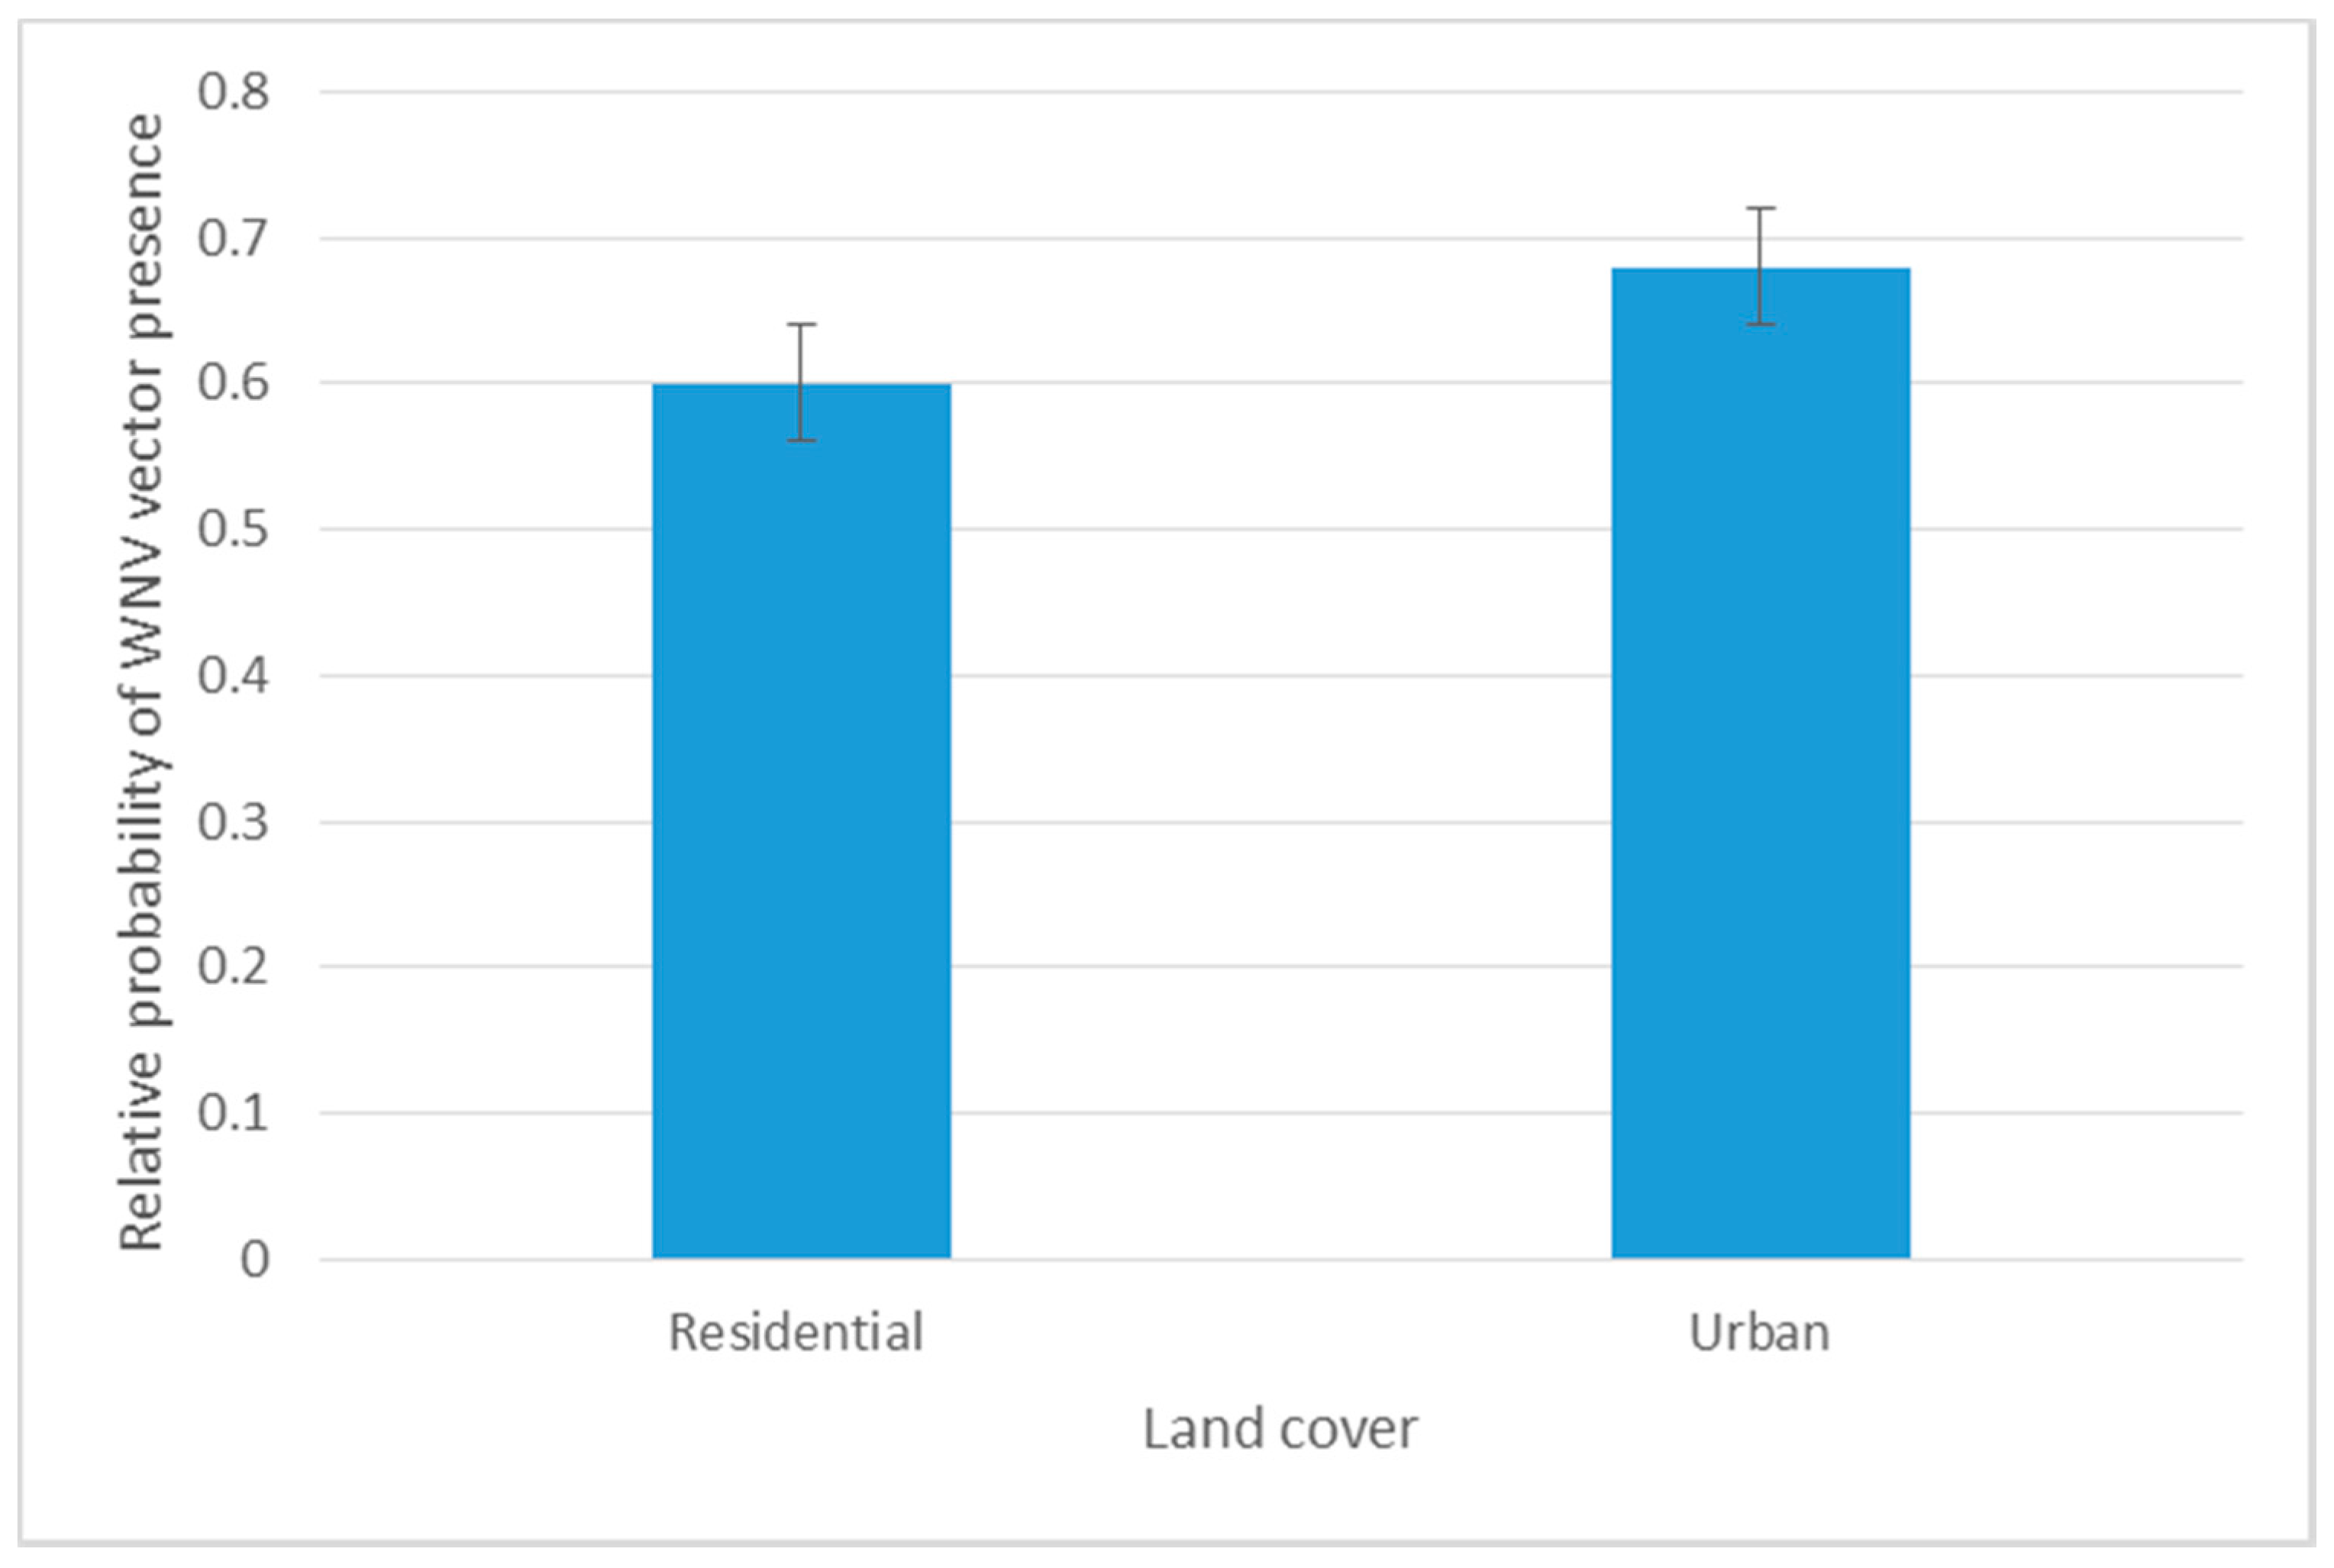
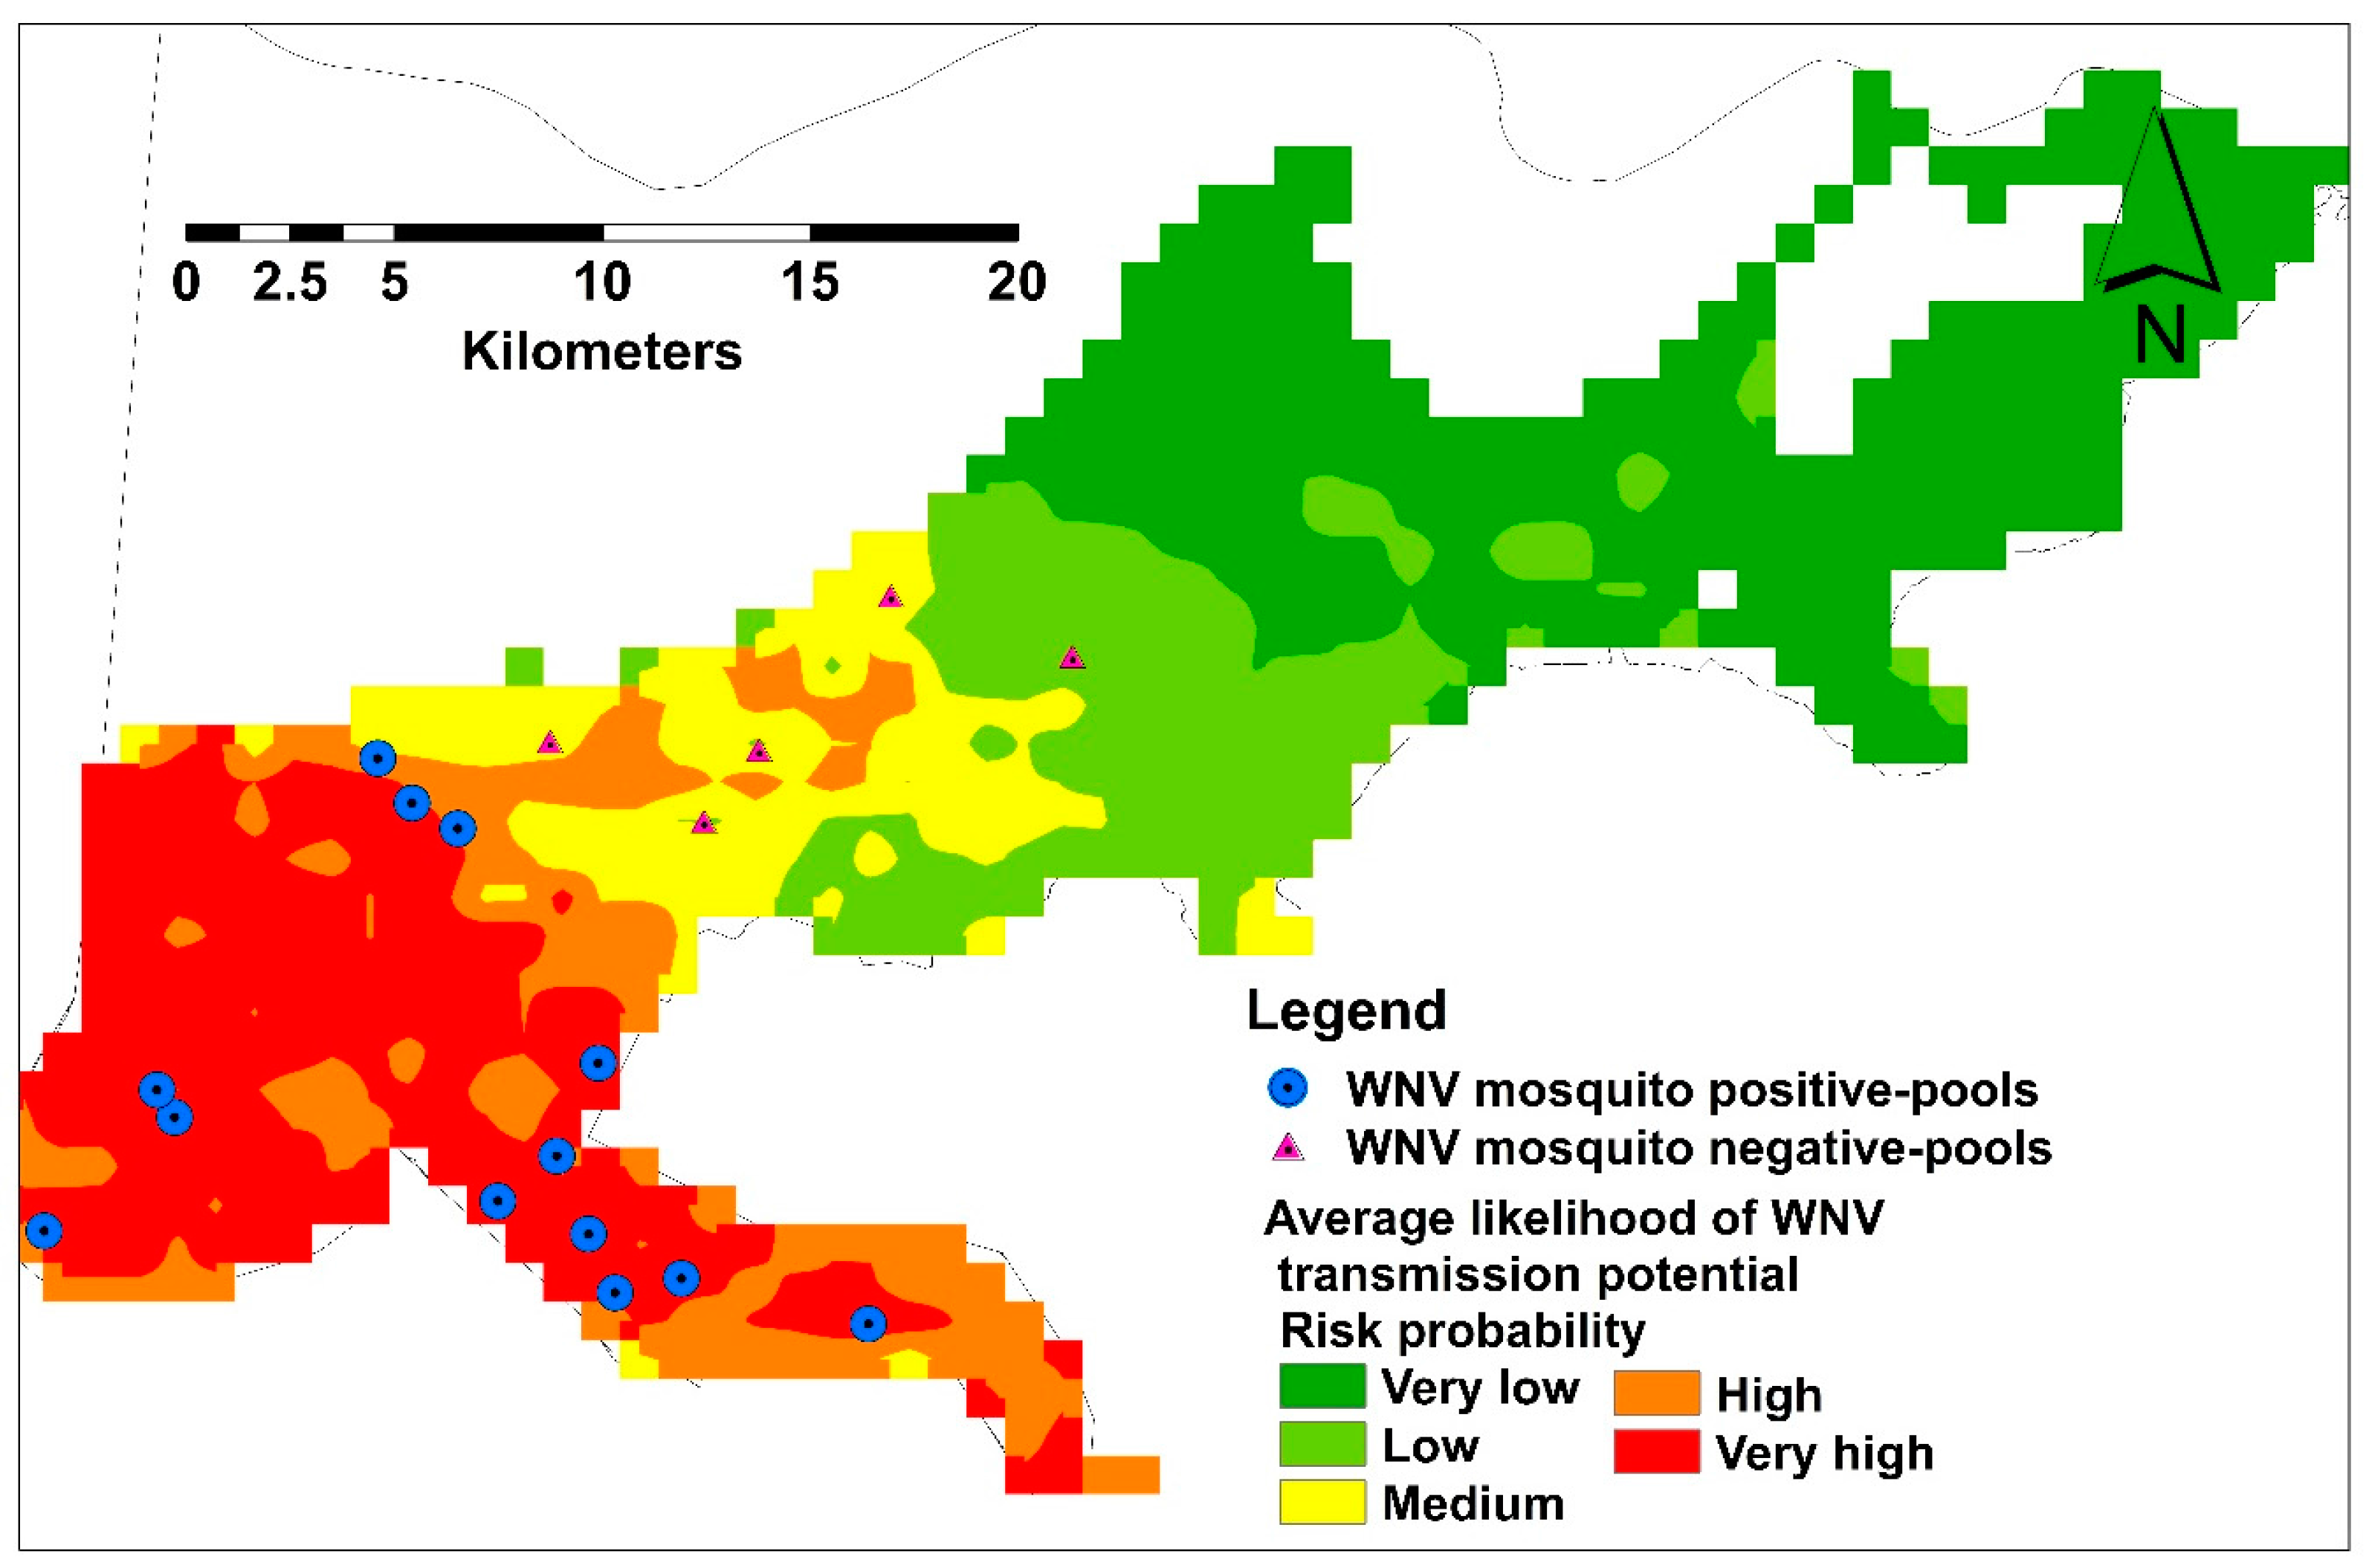
3.2. Habitat Suitability Modeling of West Nile Virus Vector
Spatial and Temporal Analysis
3.3. Model Validation
4. Discussion
5. Conclusions
Acknowledgments
Author Contributions
Conflicts of Interest
References
- Centers for Disease Control and Prevention. Guidelines for surveillance, prevention and control of West Nile virus infection—United States. MMWR Morb. Mortal. Wkly. Rep. 2000, 49, 25–28. [Google Scholar]
- Steele, K.E.; Linn, M.J.; Schoepp, R.J.; Komar, N.; Geisbert, T.W.; Manduca, R.M.; Calle, P.P.; Raphael, B.L.; Clippinger, T.L.; Larsen, T.; et al. Pathology of fatal west Nile virus infections in native and exotic birds during the 1999 outbreak in New York City, New York. Vet. Pathol. 2000, 37, 208–224. [Google Scholar] [CrossRef] [PubMed]
- Campbell, G.L.; Marfin, A.A.; Lanciotti, R.S.; Gubler, D.J. West Nile virus. Lancet Inf. Dis. 2002, 2, 519–529. [Google Scholar] [CrossRef]
- Balsamo, G.; Michaels, S.; Sokol, T.; Lees, K.; Mehta, M.; Straif-Bourgeois, S.; Hall, S.; Krishna, N.; Talati, G.; Ratard, R. West nile epidemic in Louisiana in 2002. Ochsner J. 2003, 5, 13–15. [Google Scholar] [PubMed]
- Godsey, M.S.; Nasci, R.; Savage, H.M.; Aspen, S.; King, R.; Powers, A.M.; Burkhalter, K.; Colton, L.; Charnetzky, D.; Lasater, S.; et al. West Nile virus—Infected mosquitoes, Louisiana, 2002. Emerg. Infect. Dis. 2005, 11, 1399–1404. [Google Scholar] [CrossRef] [PubMed]
- Palmisano, C.T.; Taylor, V.; Caillouet, K.; Byrd, B.; Wesson, D.M. Impact of west Nile virus outbreak upon St. tammany parish mosquito abatement district. J. Am. Mosq. Control Assoc. 2005, 21, 33–38. [Google Scholar] [CrossRef]
- Nasci, R.S.; White, D.J.; Stirling, H.; Oliver, J.; Daniels, T.J.; Falco, R.C.; Campbell, S.; Crans, W.J.; Savage, H.M.; Lanciotti, R.S.; et al. West Nile virus isolates from mosquitoes in New York and New Jersey, 1999. Emerg. Infect. Dis. 2001, 7, 626–630. [Google Scholar] [CrossRef] [PubMed]
- Andreadis, T.G.; Anderson, J.F.; Vossbrinck, C.R. Mosquito surveillance for West Nile virus in Connecticut, 2000: Isolation from Culex pipiens, Cx. restuans, Cx. salinarius and Culiseta melanura. Emerg. Infect. Dis. 2001, 7, 670–674. [Google Scholar] [CrossRef] [PubMed]
- Bernard, K.A.; Maffei, J.G.; Jones, S.A.; Kauffman, E.B.; Ebel, G.; Dupuis, A.P.; Ngo, K.A.; Nicholas, D.C.; Young, D.M.; Shi, P.Y.; et al. West Nile virus infection in birds and mosquitoes, New York State, 2000. Emerg. Infect. Dis. 2001, 7, 679–685. [Google Scholar] [CrossRef] [PubMed]
- Andreadis, T.G.; Anderson, J.F.; Vossbrinck, C.R.; Main, A.J. Epidemiology of west Nile virus in connecticut: A five-year analysis of mosquito data 1999–2003. Vector-Borne Zoonotic Dis. 2004, 4, 360–378. [Google Scholar] [CrossRef] [PubMed]
- Reisen, W.; Lothrop, H.; Chiles, R.; Madon, M.; Cossen, C.; Woods, L.; Husted, S.; Kramer, V.; Edman, J. West Nile virus in California. Emerg. Infect. Dis. 2004, 10, 1369–1378. [Google Scholar] [CrossRef] [PubMed]
- Gleiser, R.M.; Mackay, A.J.; Roy, A.; Yates, M.M.; Vaeth, R.H.; Faget, G.M.; Folsom, A.E.; Augustine, W.F.; Wells, R.A.; Perich, M.J. West Nile virus surveillance in East Baton Rouge Parish, Louisiana. J. Am. Mosq. Control Assoc. 2007, 23, 29–36. [Google Scholar] [CrossRef]
- Mackay, A.J.; Roy, A.; Yates, M.M.; Foil, L.D. West Nile virus detection in mosquitoes in East Baton Rouge Parish, Louisiana, from November 2002 to October 2004. J. Am. Mosq. Control Assoc. 2008, 24, 28–35. [Google Scholar] [CrossRef] [PubMed]
- Mackay, A.J.; Kramer, W.L.; Meece, J.K.; Brumfield, R.T.; Foil, L.D. Host feeding patterns of culex mosquitoes (Diptera: Culicidae) in East Baton Rouge Parish, Louisiana. J. Med. Entomol. 2010, 47, 238–248. [Google Scholar] [CrossRef] [PubMed]
- Day, J.F. Predicitng St. louis encephalitis virus epidemics: Lessons from recent, and not so recent, outbreaks. Ann. Rev. Entomol. 2001, 46, 111–138. [Google Scholar] [CrossRef] [PubMed]
- Shaman, J.; Stieglitz, M.; Stark, C.; Le Blancq, S.; Cane, M. Using a dynamic hydrology model to predict mosquito abundances in flood and swamp water. Emerg. Infect. Dis. 2002, 8, 6–13. [Google Scholar] [CrossRef] [PubMed]
- Brown, H.; Diuk-Wasser, M.; Andreadis, T.; Fish, D. Remotely-sensed vegetation indices identify mosquito clusters of West Nile virus vectors in an urban landscape in the Northeastern United States. Vector Borne Zoonotic Dis. 2008, 8, 197–206. [Google Scholar] [CrossRef] [PubMed]
- Brown, H.E.; Childs, J.E.; Diuk-Wasser, M.A.; Fish, D. Ecological factors associated with West Nile Virus transmission, Northeastern United States. Emerg. Infect. Dis. 2008, 14, 1539–1545. [Google Scholar] [CrossRef] [PubMed]
- DeGroote, J.P.; Sugumaran, R.; Brend, S.M.; Tucker, B.J.; Bartholomay, L.C. Landscape, demographic, entomological, and climatic associations with human disease incidence of West Nile virus in the State of Iowa, USA. Int. J. Health Geog. 2008, 7, 19. [Google Scholar] [CrossRef] [PubMed]
- Day, J.F.; Shaman, J. Using hydrologic conditions to track the risk of focal and epidemic arboviral transmission in Peninsular Florida. J. Med. Entomol. 2008, 45, 458–469. [Google Scholar] [CrossRef] [PubMed]
- Shaman, J.; Day, J.F.; Stieglitz, M. Drought-induced amplification of Saint Louis encephalitis virus, Florida. Emerg. Infect. Dis. 2002, 8, 575–580. [Google Scholar] [CrossRef] [PubMed]
- Shaman, J.; Day, J.F.; Stieglitz, M. St. Louis encephalitis virus in wild birds during the 1990 South Florida epidemic: The importance of drought, wetting conditions, and the emergence of Culex nigripalpus (Diptera: Culicidae) to arboviral amplification and transmission. J. Med. Entomol. 2003, 40, 547–554. [Google Scholar] [CrossRef] [PubMed]
- Naish, S.; Mengersen, K.; Hu, W.; Tong, S. Forecasting the future risk of Barmah forest virus disease under climate change scenarios in Queensland, Australia. PLoS ONE 2013, 8, e62843. [Google Scholar] [CrossRef] [PubMed]
- Sallam, M.F.; Lippi, C.; Xue, R.-D. Spatial analysis of arbovirus transmisson in St. Johns County, Florida. Tech. Bull. Fla. Mosq. Control Assoc. 2016, 10, 18–29. [Google Scholar]
- Sallam, M.F.; Xue, R.D.; Pereira, R.M.; Koehler, P.G. Ecological niche modeling of mosquito vectors of West Nile virus in St. John’s County, Florida, USA. Parasit Vectors 2016, 9, 371. [Google Scholar] [CrossRef] [PubMed]
- Rogers, D.; Randolph, S. The global spread of malaria in a future, warmer world. Science 2000, 289, 1763–1766. [Google Scholar] [PubMed]
- Sallam, M.F.; Michaels, S.R.; Riegel, C.; Tian, Y.; Pereira, R.M.; Koehler, P.G. Habitat suitability model and risk assessment of Zika Virus mosquito vectors in city of New Orleans, LA, USA. Parasite Vector, 2017; in preparation. [Google Scholar]
- Darsie, R.F.; Ward, R.A. Identification and Geographical Distribution of the Mosquitos of North America, North of Mexico; University Press of Florida: Gainesville, FL, USA, 2005. [Google Scholar]
- Nayar, J.K.; Sauerman, D.M., Jr. A comparative study of flight performance and fuel utilization as a function of age in females of Florida mosquitoes. J. Insect Physiol. 1973, 19, 1977–1988. [Google Scholar] [CrossRef]
- IPCC. Climate Change 2007: The Physical Science Basis. In Contribution of Working Group I to the Fourth Assessment Report of the Intergovernmental Panel on Climate Change; Solomon, S., Qin, D., Manning, M., Chen, Z., Marquis, M., Averyt, K.B., Tignor, M., Miller, H.L., Eds.; Cambridge University Press: Cambridge, UK, 2007. [Google Scholar]
- Lewis, J.A.; Zipperer, W.C.; Ernstson, H.; Bernik, B.; Hazen, R.; Elmqvist, T.; Blum, M.J. Disparate socioecological responses to disturbance in New Orleans following hurricane katrina. Ecospheres 2017. in review. [Google Scholar]
- Sallam, M.F.; Ahmed, A.M.A.; Abdel-Dayem, M.S.; Abdullah, M.A.R. Ecological niche modeling and land cover risk areas for rift valley fever vector, Culex tritaeniorhynchus Giles in Jazan, Saudi Arabia. PLoS ONE 2013, 8, e65786. [Google Scholar] [CrossRef] [PubMed]
- Gorsevski, P.V.; Gessler, P.; Foltz, R.B. Spatial prediction of landslide hazard using discriminant analysis and GIS. In Proceedings of the GIS in the Rockies 2000 Conference and Workshop Applications for the 21st Century, Denver, CO, USA, 25–27 September 2000. [Google Scholar]
- Mushinzimana, E.; Munga, S.; Minakawa, N.; Li, L.; Feng, C.C.; Bian, L.; Kitron, U.; Schmidt, C.; Beck, L.; Zhou, G.; et al. Landscape determinants and remote sensing of anopheline mosquito larval habitats in the Western Kenya highlands. Malar J. 2006, 5, 13. [Google Scholar] [CrossRef] [PubMed]
- Nmor, J.C.; Sunahara, T.; Goto, K.; Futami, K.; Sonye, G.; Akweywa, P.; Dida, G.; Minakawa, N. Topographic models for predicting malaria vector breeding habitats: Potential tools for vector control managers. Parasit Vectors 2013, 6, 14. [Google Scholar] [CrossRef] [PubMed]
- Burkett-Cadena, N.D.; McClure, C.J.W.; Estep, L.K.; Eubanks, M.D. Hosts or habitats: What drives the spatial distribution of mosquitoes? Ecosphere 2013, 4, 1–16. [Google Scholar] [CrossRef]
- Gu, W.; Müller, G.; Schlein, Y.; Novak, R.J.; Beier, J.C. Natural plant sugar sources of Anopheles mosquitoes strongly impact malaria transmission potential. PLoS ONE 2011, 6, e15996. [Google Scholar] [CrossRef] [PubMed]
- Andersson, I.H.; Jaenson, T.G.T. Nectar feeding by mosquitoes in Sweden, with special reference to Culex. pipiens and Cx. torrentium. Med. Vet. Entomol. 1987, 1, 59–64. [Google Scholar] [CrossRef] [PubMed]
- Foster, W.A. Mosquito sugar feeding and reproductive energetics. Ann. Rev. Entomol. 1995, 40, 443–474. [Google Scholar] [CrossRef] [PubMed]
- Caillouet, K.A.; Riggan, A.E.; Bulluck, L.P.; Carlson, J.C.; Sabo, R.T. Nesting bird “host funnel” increases mosquito-bird contact rate. J. Med. Entomol. 2013, 50, 462–466. [Google Scholar] [CrossRef] [PubMed]
- Burkett-Cadena, N.D.; Ligon, R.A.; Liu, M.; Hassan, H.K.; Hill, G.E.; Eubanks, M.D.; Unnasch, T.R. Vector-host interactions in avian nests: Do mosquitoes prefer nestlings over adults? Am. J. Trop. Med. Hyg. 2010, 83, 395–399. [Google Scholar] [CrossRef] [PubMed]
- Price, C.V.; Nakagaki, N.; Hitt, K.J.; Clawges, R.C. Enhanced Historical Land-Use and Land-Cover Data Sets of the U.S. Geological Survey; US USGS (United States Geological Survey): Reston, VA, USA, 2006.
- SAS. 2013. Available online: https://www.sas.com/en_us/home.html (accessed on 7 August 2017).
- Akaike, H. Information theory and an extension of the maximum likelihood principle. In Proceedings of the International Symposium on Information Theory, Tsahkadsor, Armenia, 2–8 September 1971; Petrov, B.N., Csáki, F., Eds.; Akadémiai Kiadó: Budapest, Hungary, 1973; pp. 267–281. [Google Scholar]
- Burnham, K.P.; Anderson, D.R. Model Selection and Multimodel Inference: A Practical Information-Theoretic Approach, 2nd ed.; Springer: New York, NY, USA; ISBN 0-387-95364-7-2002.
- Giraud, C. Introduction to High-Dimensional Statistics; CRC Press: Boca Raton, FL, USA, 2015. [Google Scholar]
- Snipes, M.; Taylor, D.C. Model selection and Akaike Information Criteria: An example from wine ratings and prices. Wine Econ. Policy 2014, 3, 3–9. [Google Scholar] [CrossRef]
- Phillips, S.J.; Anderson, R.P.; Schapire, R.E. Maximum entropy modeling of species geographic distributions. Ecol. Model. 2006, 190, 231–259. [Google Scholar] [CrossRef]
- Phillips, S.; Dudik, M.; Schapire, R. A maximum entropy approach to species distribution modeling. In Proceedings of the 21st International Conference on Machine Learning, Banff, AB, Canada, 4–8 July 2004; ACM Press: New York, NY, USA, 2004. [Google Scholar]
- Phillips, S.; Dudik, M. Modeling of species distributions with Maxent: New extensions and a comprehensive evaluation. Ecography 2008, 31, 161–175. [Google Scholar] [CrossRef]
- Zhou, G.; Munga, S.; Minakawa, N.; Githeko, A.; Yan, G. Spatial relationship between adult malaria vector abundance and environmental factors in Western Kenya highlands. Am. J. Trop. Med. Hyg. 2007, 77, 29–35. [Google Scholar] [PubMed]
- Phillips, S.J.; Dudík, M.; Elith, J.; Graham, C.H.; Lehmann, A.; Leathwick, J.; Ferrier, S. Sample selection bias and presence-only distribution models: Implications for background and pseudo-absence data. Ecol. Appl. 2009, 19, 181–197. [Google Scholar] [CrossRef] [PubMed]
- DeMeillon, B. Studies on insects of medical importance in South Africa. South. Afr. Inst. Med. Res. 1934, 35, 249–308. [Google Scholar]
- Godsey, M.S.; King, R.J.; Burkhalter, K.; Delorey, M.; Colton, L.; Charnetzky, D.; Sutherland, G.; Ezenwa, V.O.; Wilson, L.A.; Coffey, M.; et al. Ecology of potential west Nile virus vectors in Southeastern Louisiana: Enzootic transmission in the relative absence of Culex Quinquefasciatus. Am. J. Trop. Med. Hyg. 2013, 88, 986–996. [Google Scholar] [CrossRef] [PubMed]
- Kilpatrick, A.M.; Daszak, P.; Jones, M.J.; Marra, P.P.; Kramer, L.D. Host heterogeneity dominates West Nile virus transmission. Proc. Biol. Sci. 2006, 273, 2327–2333. [Google Scholar] [CrossRef] [PubMed]
- Molaei, G.; Andreadis, T.G.; Armstrong, P.M.; Bueno, R.; Dennett, J.A.; Real, S.V.; Sargent, C.; Bala, A.; Randle, Y.; Guzman, H.; et al. Host feeding pattern of Culex quinquefasciatus (Diptera: Culicidae) and its role in transmission of West Nile virus in Harris County, Texas. Am. J. Trop. Med. Hyg. 2007, 77, 73–81. [Google Scholar] [PubMed]
- Turell, M.J.; Spring, A.R.; Miller, M.K.; Cannon, C.E. Effect of holding conditions on the detection of West Nile viral RNA by reverse transcriptase-polymerase chain reaction from mosquito (Diptera: Culicidae) pools. J. Med. Entomol. 2002, 39, 1–3. [Google Scholar] [CrossRef]
- Hamer, G.L.; Walker, E.D.; Brawn, J.D.; Loss, S.R.; Ruiz, M.O.; Goldberg, T.L.; Schotthoefer, A.M.; Brown, W.M.; Wheeler, E.; Kitron, U.D. Rapid amplification of West Nile Virus: The role of hatch-year birds. Vector-Borne Zoonotic Dis. 2008, 8, 57–68. [Google Scholar] [CrossRef] [PubMed]
- Pranty, B.; Gibbons, R.; Dunn, J.L.; Breedlove, R.; Lyon, C. A Birder’s Guide to Louisiana; American Birding Association: Delaware City, DE, USA, 2008. [Google Scholar]
- Ruiz, M.O.; Walker, E.D.; Foster, E.S.; Haramis, L.D.; Kitron, U.D. Association of West Nile virus illness and urban landscapes in Chicago and Detroit. Int. J. Health Geogr. 2007, 6. [Google Scholar] [CrossRef] [PubMed]
- Rochlin, I.; Turbow, D.; Gomez, F.; Ninivaggi, D.V.; Campbell, S.R. Predictive mapping of human risk for West Nile Virus (WNV) based on environmental and socioeconomic factors. PLoS ONE 2011, 6, e23280. [Google Scholar] [CrossRef] [PubMed]
- Gibbs, S.E.J.; Wimberly, M.C.; Madden, M.; Masour, J.; Yabsley, M.J.; Stallnecht, D.E. Factors affecting the geographic distribution of West Nile virus in Georgia, USA: 2002–2004. Vector Borne Zoonotic Dis. 2006, 6, 73–82. [Google Scholar] [CrossRef] [PubMed]
- Lord, C.C.; Day, J.F. Simulation studies of St. Louis encephalitis and West Nile Viruses: The impact of bird mortality. Vector Borne Zoonotic Dis. 2001, 1, 317–329. [Google Scholar] [CrossRef] [PubMed]


| Variable | Variable Name | Data Source | Units |
|---|---|---|---|
| Alt | Elevation in meters | WorldClim 1 | Meter |
| Aspect | Aspect ratio | Generated 2 | Degrees |
| Bio01 | Annual Mean Temperature | WorldClim 1 | Degree Celsius |
| Bio02 | Mean Diurnal Range (Mean of monthly (max temp − min temp)) | WorldClim 1 | Degree Celsius |
| Bio03 | Isothermality (BIO2/BIO7) (* 100) | WorldClim 1 | Dimensionless |
| Bio04 | Temperature Seasonality (standard deviation * 100) | WorldClim 1 | Degree Celsius |
| Bio05 | Max Temperature of Warmest Month | WorldClim 1 | Degree Celsius |
| Bio06 | Min Temperature of Coldest Month | WorldClim 1 | Degree Celsius |
| Bio07 | Temperature Annual Range (BIO5-BIO6) | WorldClim 1 | Degree Celsius |
| Bio08 | Mean Temperature of Wettest Quarter | WorldClim 1 | Degree Celsius |
| Bio09 | Mean Temperature of Driest Quarter | WorldClim 1 | Degree Celsius |
| Bio10 | Mean Temperature of Warmest Quarter | WorldClim 1 | Millimeter |
| Bio11 | Mean Temperature of Coldest Quarter | WorldClim 1 | Millimeter |
| Bio12 | Annual Precipitation | WorldClim 1 | Millimeter |
| Bio13 | Precipitation of Wettest Month | WorldClim 1 | Millimeter |
| Bio14 | Precipitation of Driest Month | WorldClim 1 | Millimeter |
| Bio15 | Precipitation Seasonality (Coefficient of Variation) | WorldClim 1 | Fraction |
| Bio16 | Precipitation of Wettest Quarter | WorldClim 1 | Millimeter |
| Bio17 | Precipitation of Driest Quarter | WorldClim 1 | Millimeter |
| Bio18 | Precipitation of Warmest Quarter | WorldClim 1 | Millimeter |
| Bio19 | Precipitation of Coldest Quarter | WorldClim 1 | Millimeter |
| Curvature | Curvature | Generated 2 | Degrees |
| DFL | Deciduous forest land | USGS 3 | Integer values |
| FW | Forested wetland | USGS 3 | Integer values |
| Hill shade | Hill shade | Generated 2 | Degrees |
| ICS | Industrial and commercial services | USGS 3 | Integer values |
| NFWL | Non-forested wetland | USGS 3 | Integer values |
| OUBL | Other urban and build-up land | USGS 3 | Integer values |
| Population census | Population census per block | NOLA 5 | No. household/block |
| RU | Residential and urban settings | USGS 3 | Integer values |
| SCLRE | Streams, canals, lakes, reservoirs and estuaries | USGS 3 | Integer values |
| Slope | Slope | Generated 2 | Degrees |
| TD | Tree density | Lewis et al. 4 | No. trees/area |
| LULC Class | Area % LULC Class | No. Traps/Class |
|---|---|---|
| Deciduous forest | 7.18 | 2 |
| Forested wetland | 8.01 | 2 |
| Industrial and commercial services | 9.56 | 4 |
| Non forested wetland | 7.72 | 1 |
| Other urban and built-up land | 4.61 | 3 |
| Residential-Urban | 28.29 | 25 |
| Streams, canals, lakes, reservoirs and estuaries | 24.93 | 0 |
| Model | Variables | Test AUC | R2 | AICc |
|---|---|---|---|---|
| Spatial Model | Bio 1, 2, 4, 6, 7, 11, 13, 17, 18, NFWL, RU, TD | 0.71 | 0.82 | 505.01 |
| April | Bio 11, 12, 14, 15, 8 | 0.77 | 0.75 | 79.05 |
| May | Alt, Bio 8, 11, 12, 14, 15, NFWL | 0.74 | 0.85 | 71.53 |
| June | Alt, Bio 11, 14, 2, 8, OUBL | 0.73 | 0.81 | 80.57 |
| July | bio14, 15, 8, 9, OUBL | 0.77 | 0.83 | 73.28 |
| August | bio11, 12, ,15, 8, 9, OUBL, RU | 0.8 | 0.93 | 60.67 |
| September | Bio 8, 11, 12 | 0.79 | 0.58 | 88.26 |
| October | Bio 1, 8, 12 | 0.75 | 0.55 | 81.30 |
| November | Bio 2, 8 | 0.78 | 0.52 | 84.34 |
| December | Bio 8, 12 | 0.71 | 0.42 | 80.95 |
| Variable | Linear Regression Analysis | % Contribution (Jackknife’s Test) | |||
|---|---|---|---|---|---|
| Coefficient | R2 | p | AICc | ||
| Bio 1 | 3.08 | 0.65 | 8 | 635.73 ** | 1.1 |
| Bio 11 | 4.74 | 0.46 | 4 | 722.22 ** | 8.8 |
| Bio 13 | 0.77 | 0.79 | 10 | 532.48 ** | 0.1 |
| Bio 17 | -0.24 | 0.08 | 2 | 834.61 * | 0.1 |
| Bio 18 | -0.25 | 0.73 | 9 | 579.02 ** | 37.2 |
| Bio 2 | -0.83 | 0.81 | 12 | 514.95 * | 0.2 |
| Bio 4 | 0.07 | 0.11 | 3 | 828.82 ** | 1.6 |
| Bio 6 | -2.99 | 0.49 | 5 | 711.32 * | 0.1 |
| Bio 7 | -1.74 | 0.57 | 6 | 676.71 * | 0.3 |
| NFWL | 1.91 | 0.82 | 13 | 505.01 | 28.9 |
| RU | -1.24 | 0.60 | 7 | 662.57 ** | 20.9 |
| TD | 0.60 | 0.80 | 11 | 523.11 ** | 0.7 |
| Month | Linear Regression Model | % Contribution (Jackknife’s Test) | ||||
|---|---|---|---|---|---|---|
| Variable | Coefficient | R2 | p | AICc | ||
| April | Bio 11 | 1.5671996 | 0.7468 | 6 | 79.0541 | 73.6 |
| Bio 12 | −0.1904792 | 0.6252 | 5 | 83.8586 ** | 1.7 | |
| Bio 14 | 0.580292 | 0.4581 | 3 | 85.311 * | 0.8 | |
| Bio 15 | 0.9505776 | 0.5683 | 4 | 83.3859 * | 1.9 | |
| Bio 8 | 1.549815 | 0.292 | 2 | 88.5009 ** | 21.9 | |
| May | Alt | 0.2054192 | 0.6929 | 5 | 74.2539 * | 2.2 |
| Bio 11 | 1.2170901 | 0.8465 | 8 | 71.5334 | 51.1 | |
| Bio 12 | −0.1428952 | 0.7531 | 7 | 77.6814 ** | 1.7 | |
| Bio 14 | −0.0756836 | 0.5338 | 3 | 77.4397 * | 0.9 | |
| Bio 15 | 0.8079636 | 0.6232 | 4 | 75.555 ** | 1.2 | |
| Bio 8 | 1.9098991 | 0.3773 | 2 | 81.4792 ** | 15.4 | |
| NFWL | 1.6682811 | 0.726 | 6 | 75.5791 ** | 27.6 | |
| June | Alt | 0.2648213 | 0.8139 | 7 | 80.5656 | 1.6 |
| Bio11 | 1.0789617 | 0.7693 | 6 | 81.1173 ** | 57.9 | |
| Bio14 | −1.0029246 | 0.5241 | 3 | 87.6001 ** | 1.1 | |
| Bio2 | 1.4828419 | 0.5889 | 4 | 87.3124 ** | 0.5 | |
| Bio8 | 2.3433611 | 0.2854 | 2 | 94.4485 ** | 38.8 | |
| OUBL | 1.5141391 | 0.6708 | 5 | 85.5914 ** | 0.1 | |
| July | Bio14 | −0.6971647 | 0.5415 | 3 | 86.6717 ** | 2.1 |
| Bio15 | 1.5743201 | 0.7435 | 5 | 79.5723 ** | 1.5 | |
| Bio 8 | 2.4390573 | 0.3209 | 2 | 93.1952 ** | 31 | |
| Bio 9 | −0.6412268 | 0.8334 | 6 | 73.2771 | 65.3 | |
| OUBL | 1.9151789 | 0.6321 | 4 | 84.6186 ** | 0.1 | |
| August | Bio 11 | 1.0996856 | 0.8687 | 6 | 65.7127 ** | 35.1 |
| Bio12 | −0.0854343 | 0.6302 | 4 | 82.893 ** | 1.2 | |
| Bio15 | 1.5403677 | 0.8289 | 5 | 68.006 ** | 0.3 | |
| Bio8 | 1.8883324 | 0.1999 | 2 | 95.2837 ** | 9.7 | |
| Bio9 | −0.7676054 | 0.9091 | 7 | 61.4863 * | 16.1 | |
| OUBL | 2.9633858 | 0.4018 | 3 | 91.2107 ** | 1.3 | |
| RU | 0.2968421 | 0.9294 | 8 | 60.6681 | 36.3 | |
| September | Bio 8 | −0.1073224 | 0.2915 | 2 | 95.6155 ** | 10.1 |
| Bio 11 | 0.9622917 | 0.5849 | 4 | 88.2612 | 88.5 | |
| Bio 12 | −0.1073224 | 0.4927 | 3 | 90.1222 ** | 1.4 | |
| October | Bio 1 | 1.2929084 | 0.5465 | 4 | 81.2964 | 56.6 |
| Bio 8 | 1.431466 | 0.1947 | 2 | 89.6387 ** | 37.7 | |
| Bio 12 | −0.0983597 | 0.4436 | 3 | 83.2546 ** | 5.7 | |
| November | Bio 2 | 0.9214511 | 0.5155 | 3 | 84.3401 | 0.1 |
| Bio 8 | 1.6743075 | 0.2768 | 2 | 91.4944 ** | 99.9 | |
| December | Bio 8 | 1.591142 | 0.1993 | 2 | 85.9884 ** | 84.9 |
| Bio 12 | −0.0493324 | 0.4161 | 3 | 80.9488 | 15.1 | |
© 2017 by the authors. Licensee MDPI, Basel, Switzerland. This article is an open access article distributed under the terms and conditions of the Creative Commons Attribution (CC BY) license (http://creativecommons.org/licenses/by/4.0/).
Share and Cite
Sallam, M.F.; Michaels, S.R.; Riegel, C.; Pereira, R.M.; Zipperer, W.; Lockaby, B.G.; Koehler, P.G. Spatio-Temporal Distribution of Vector-Host Contact (VHC) Ratios and Ecological Niche Modeling of the West Nile Virus Mosquito Vector, Culex quinquefasciatus, in the City of New Orleans, LA, USA. Int. J. Environ. Res. Public Health 2017, 14, 892. https://doi.org/10.3390/ijerph14080892
Sallam MF, Michaels SR, Riegel C, Pereira RM, Zipperer W, Lockaby BG, Koehler PG. Spatio-Temporal Distribution of Vector-Host Contact (VHC) Ratios and Ecological Niche Modeling of the West Nile Virus Mosquito Vector, Culex quinquefasciatus, in the City of New Orleans, LA, USA. International Journal of Environmental Research and Public Health. 2017; 14(8):892. https://doi.org/10.3390/ijerph14080892
Chicago/Turabian StyleSallam, Mohamed F., Sarah R. Michaels, Claudia Riegel, Roberto M. Pereira, Wayne Zipperer, B. Graeme Lockaby, and Philip G. Koehler. 2017. "Spatio-Temporal Distribution of Vector-Host Contact (VHC) Ratios and Ecological Niche Modeling of the West Nile Virus Mosquito Vector, Culex quinquefasciatus, in the City of New Orleans, LA, USA" International Journal of Environmental Research and Public Health 14, no. 8: 892. https://doi.org/10.3390/ijerph14080892
APA StyleSallam, M. F., Michaels, S. R., Riegel, C., Pereira, R. M., Zipperer, W., Lockaby, B. G., & Koehler, P. G. (2017). Spatio-Temporal Distribution of Vector-Host Contact (VHC) Ratios and Ecological Niche Modeling of the West Nile Virus Mosquito Vector, Culex quinquefasciatus, in the City of New Orleans, LA, USA. International Journal of Environmental Research and Public Health, 14(8), 892. https://doi.org/10.3390/ijerph14080892