Post-Disaster Food and Nutrition from Urban Agriculture: A Self-Sufficiency Analysis of Nerima Ward, Tokyo


Abstract
:1. Introduction
2. Materials and Methods
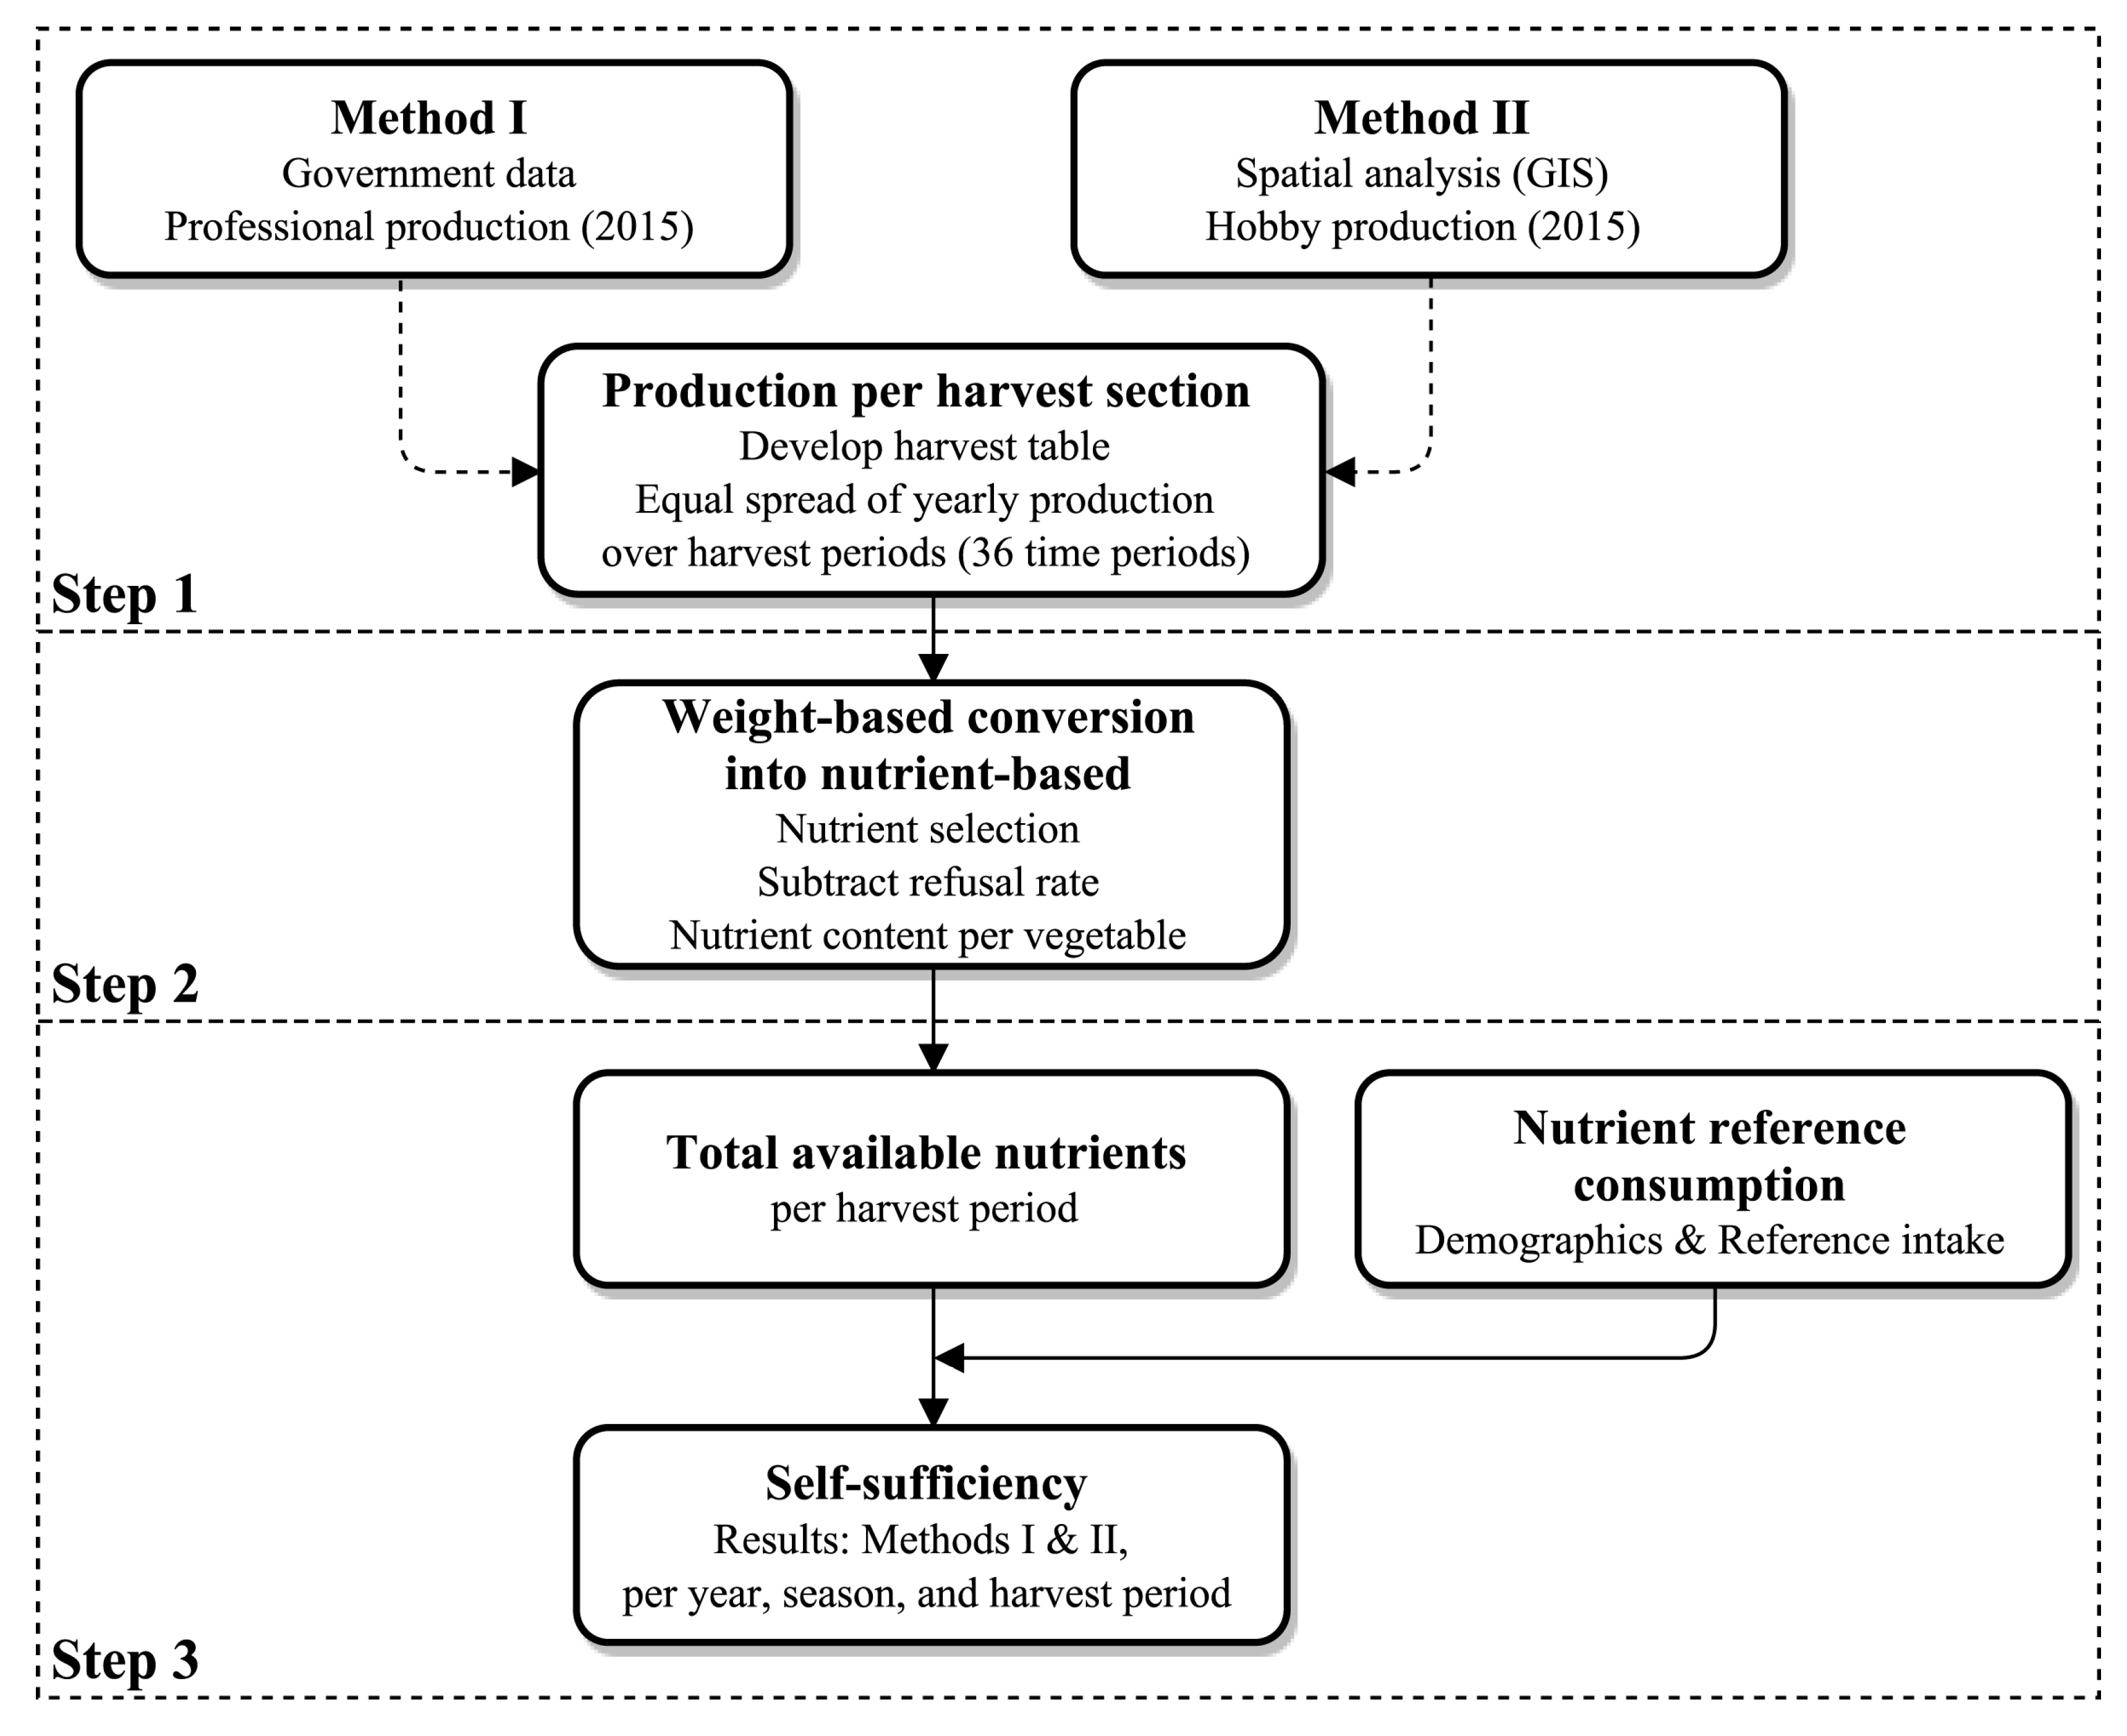
2.1. Study Design
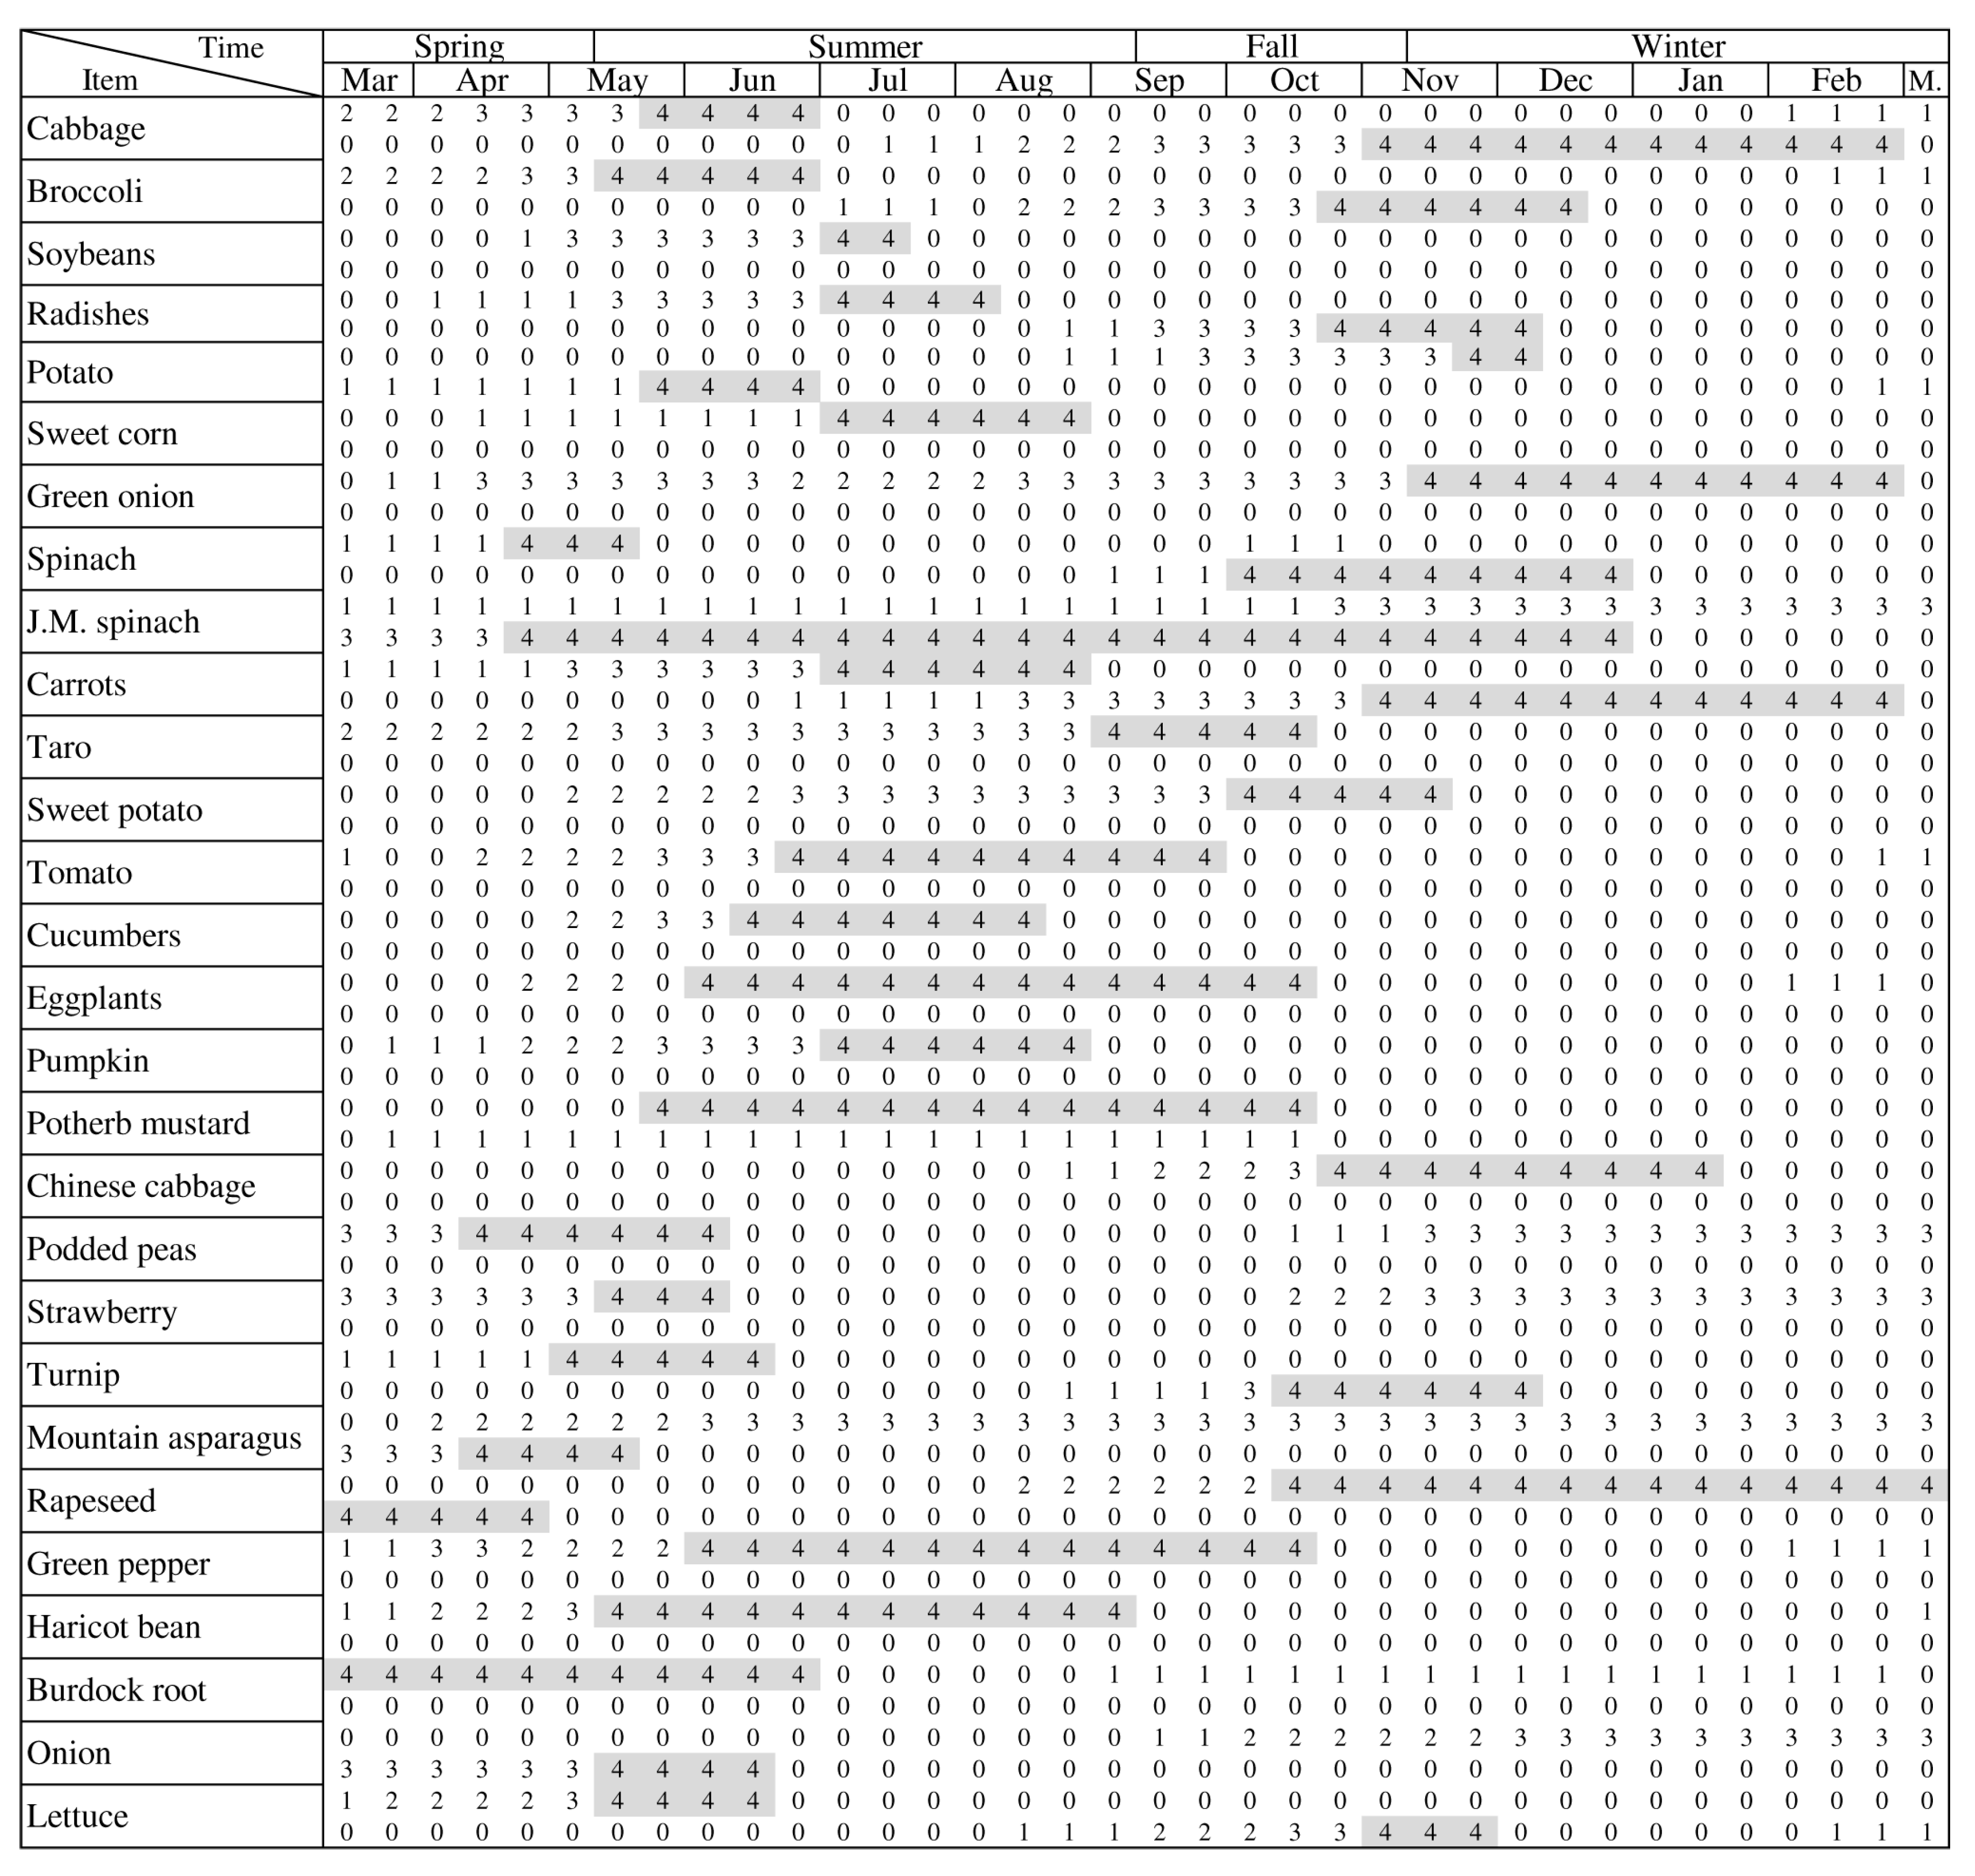
2.2. Step 1: Production of Vegetables Throughout the Year
2.2.1. Method I
2.2.2. Method II
2.3. Step 2: Conversion of Vegetable Weights to Nutrients
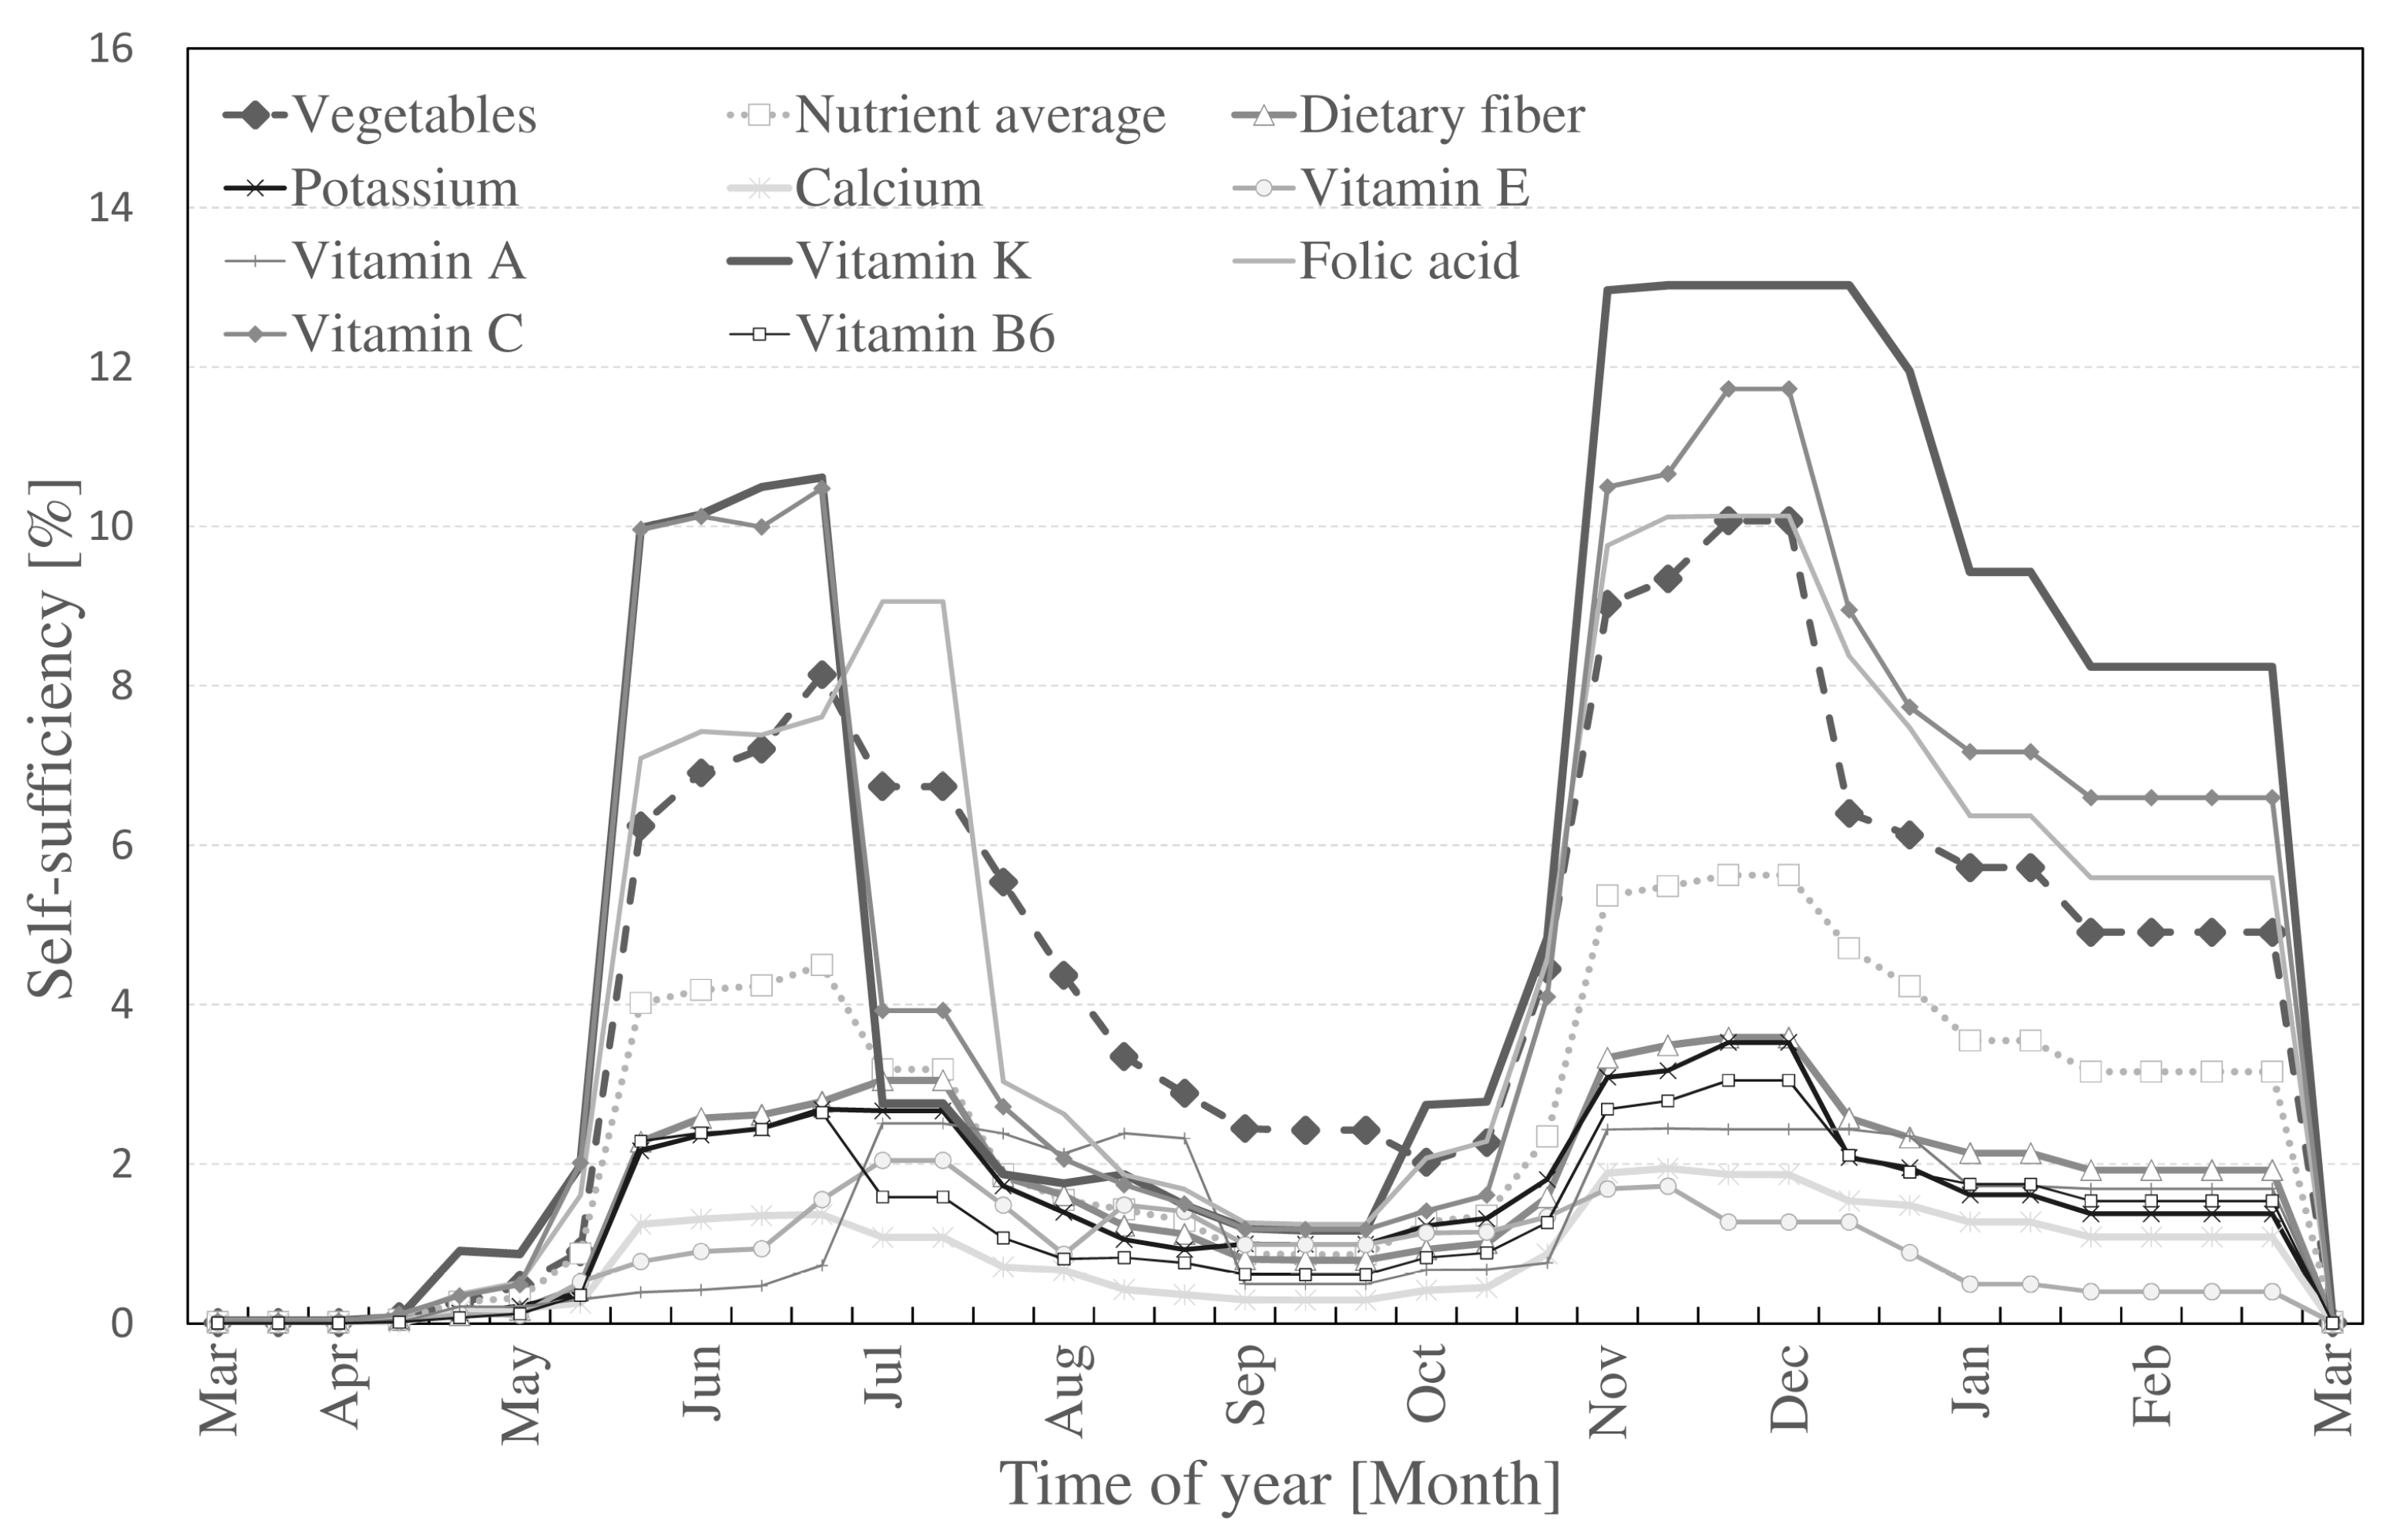
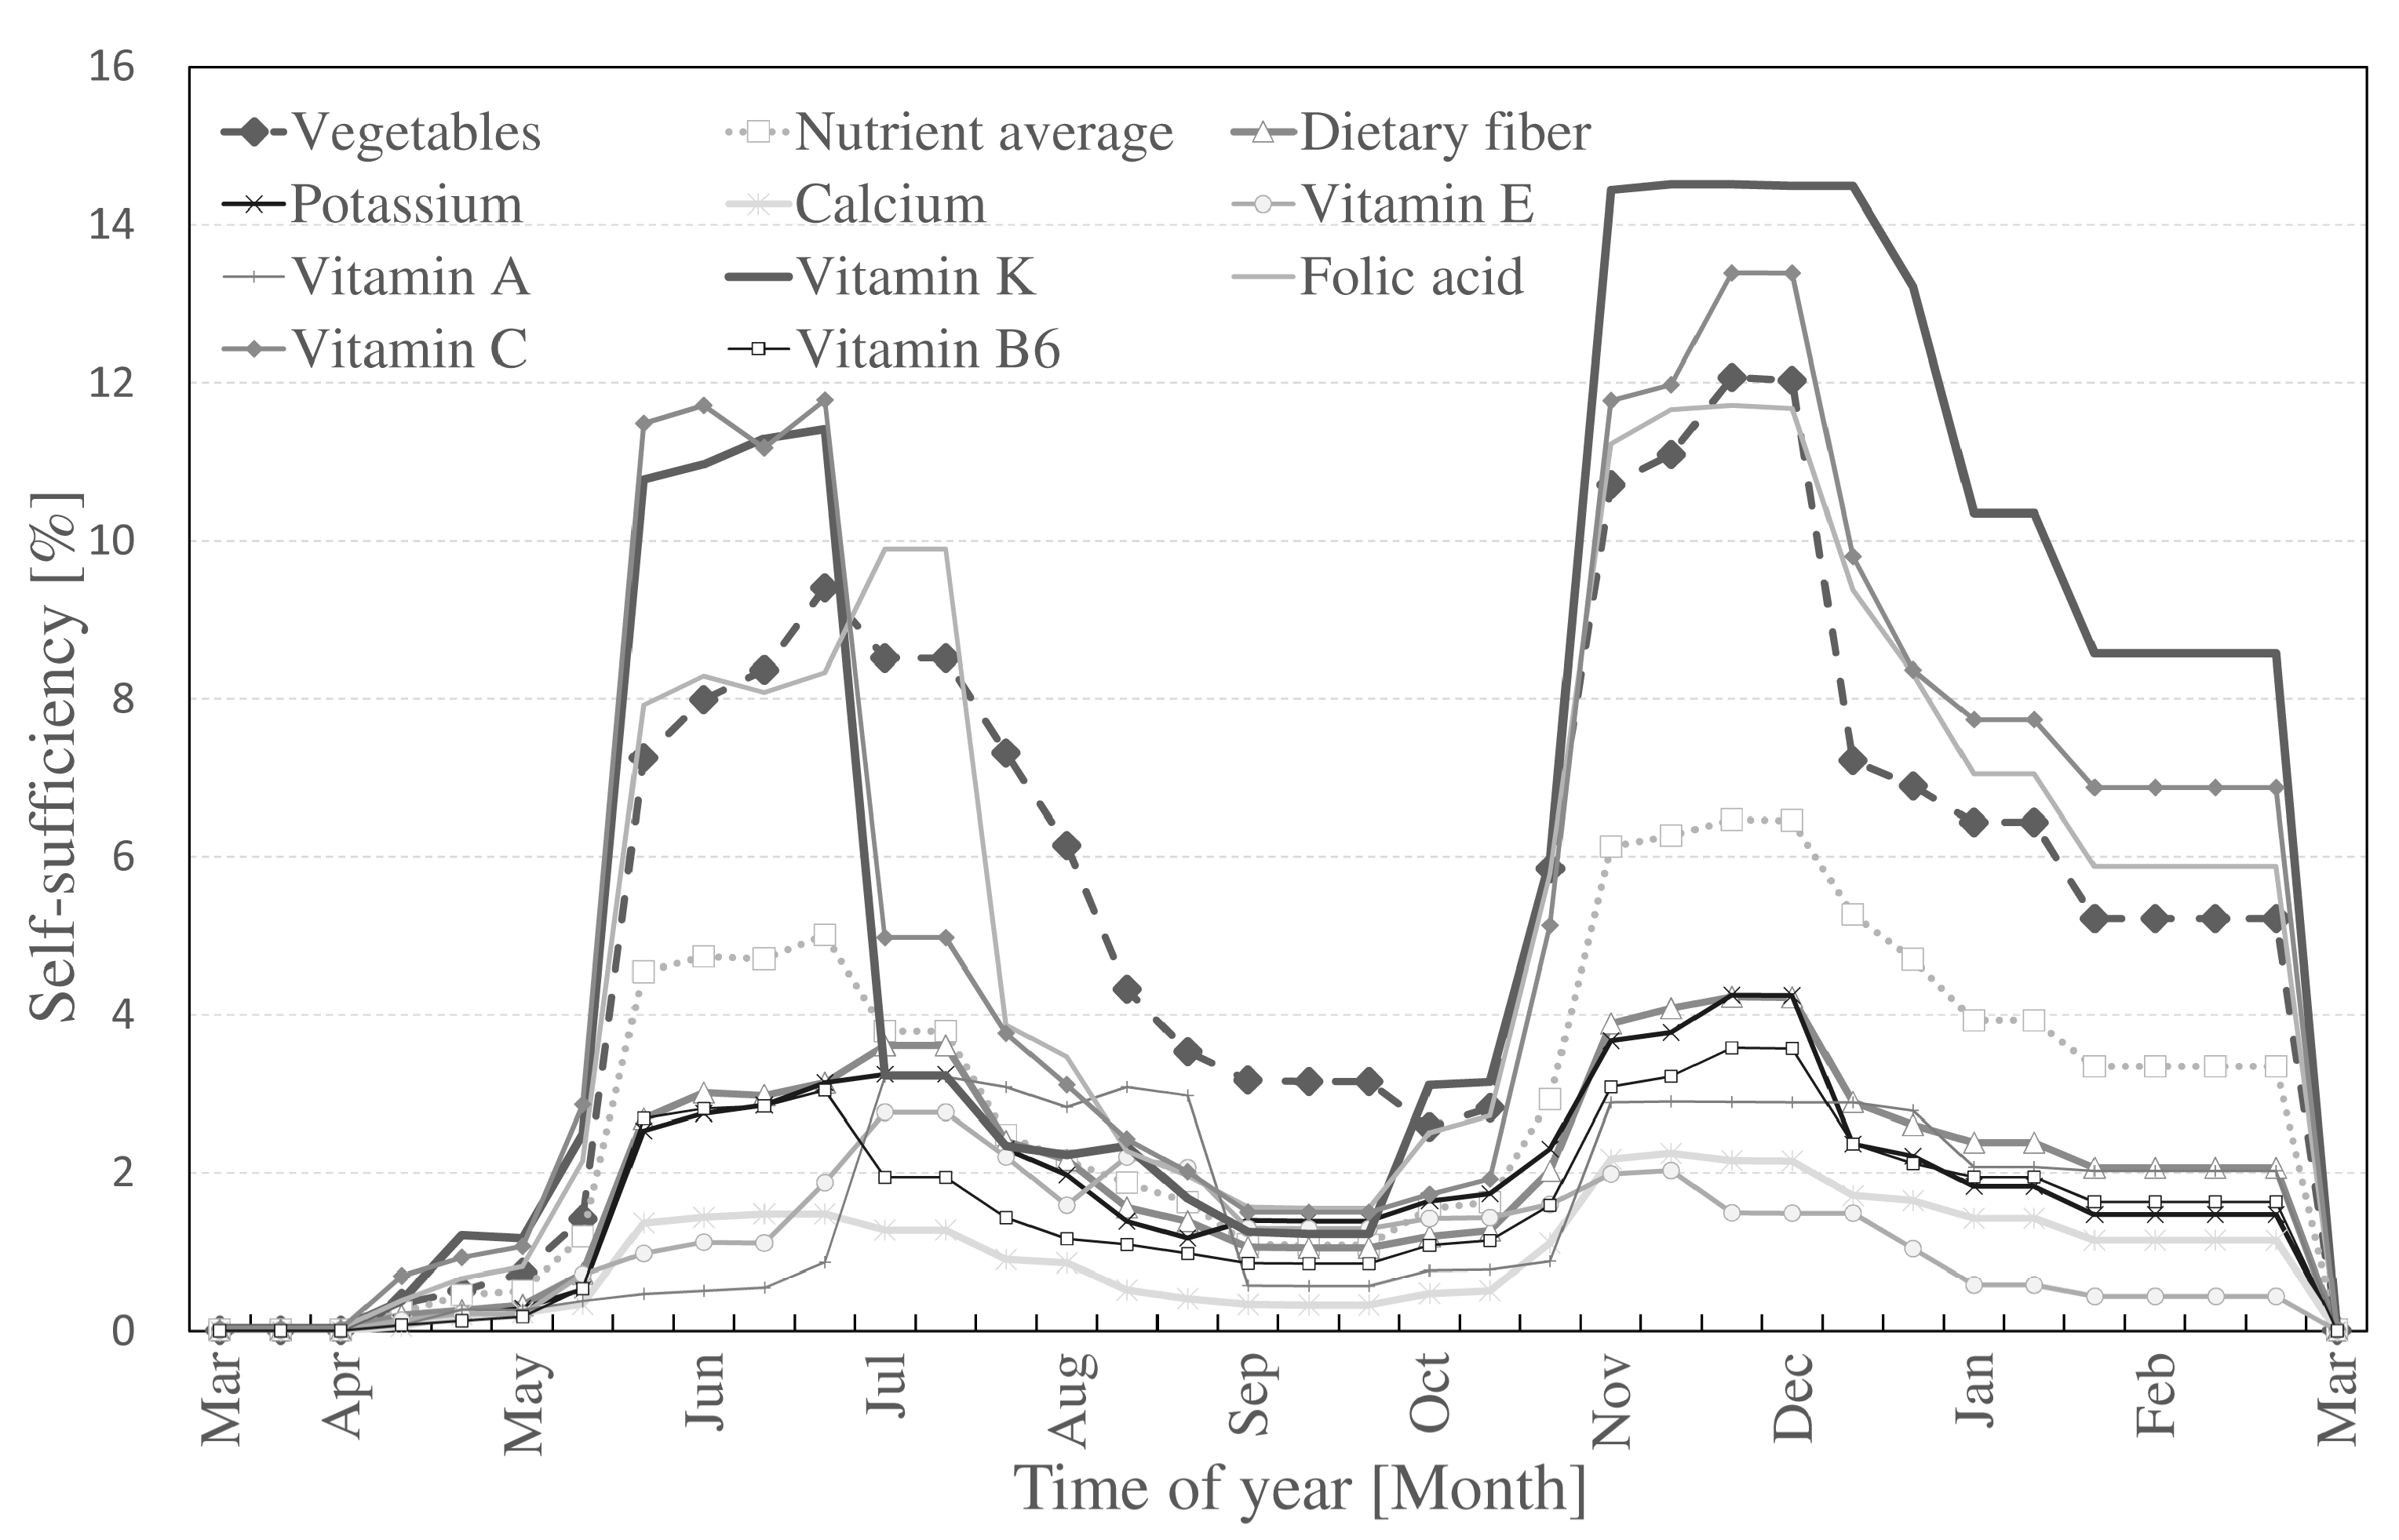
2.4. Step 3: Self-Sufficiency
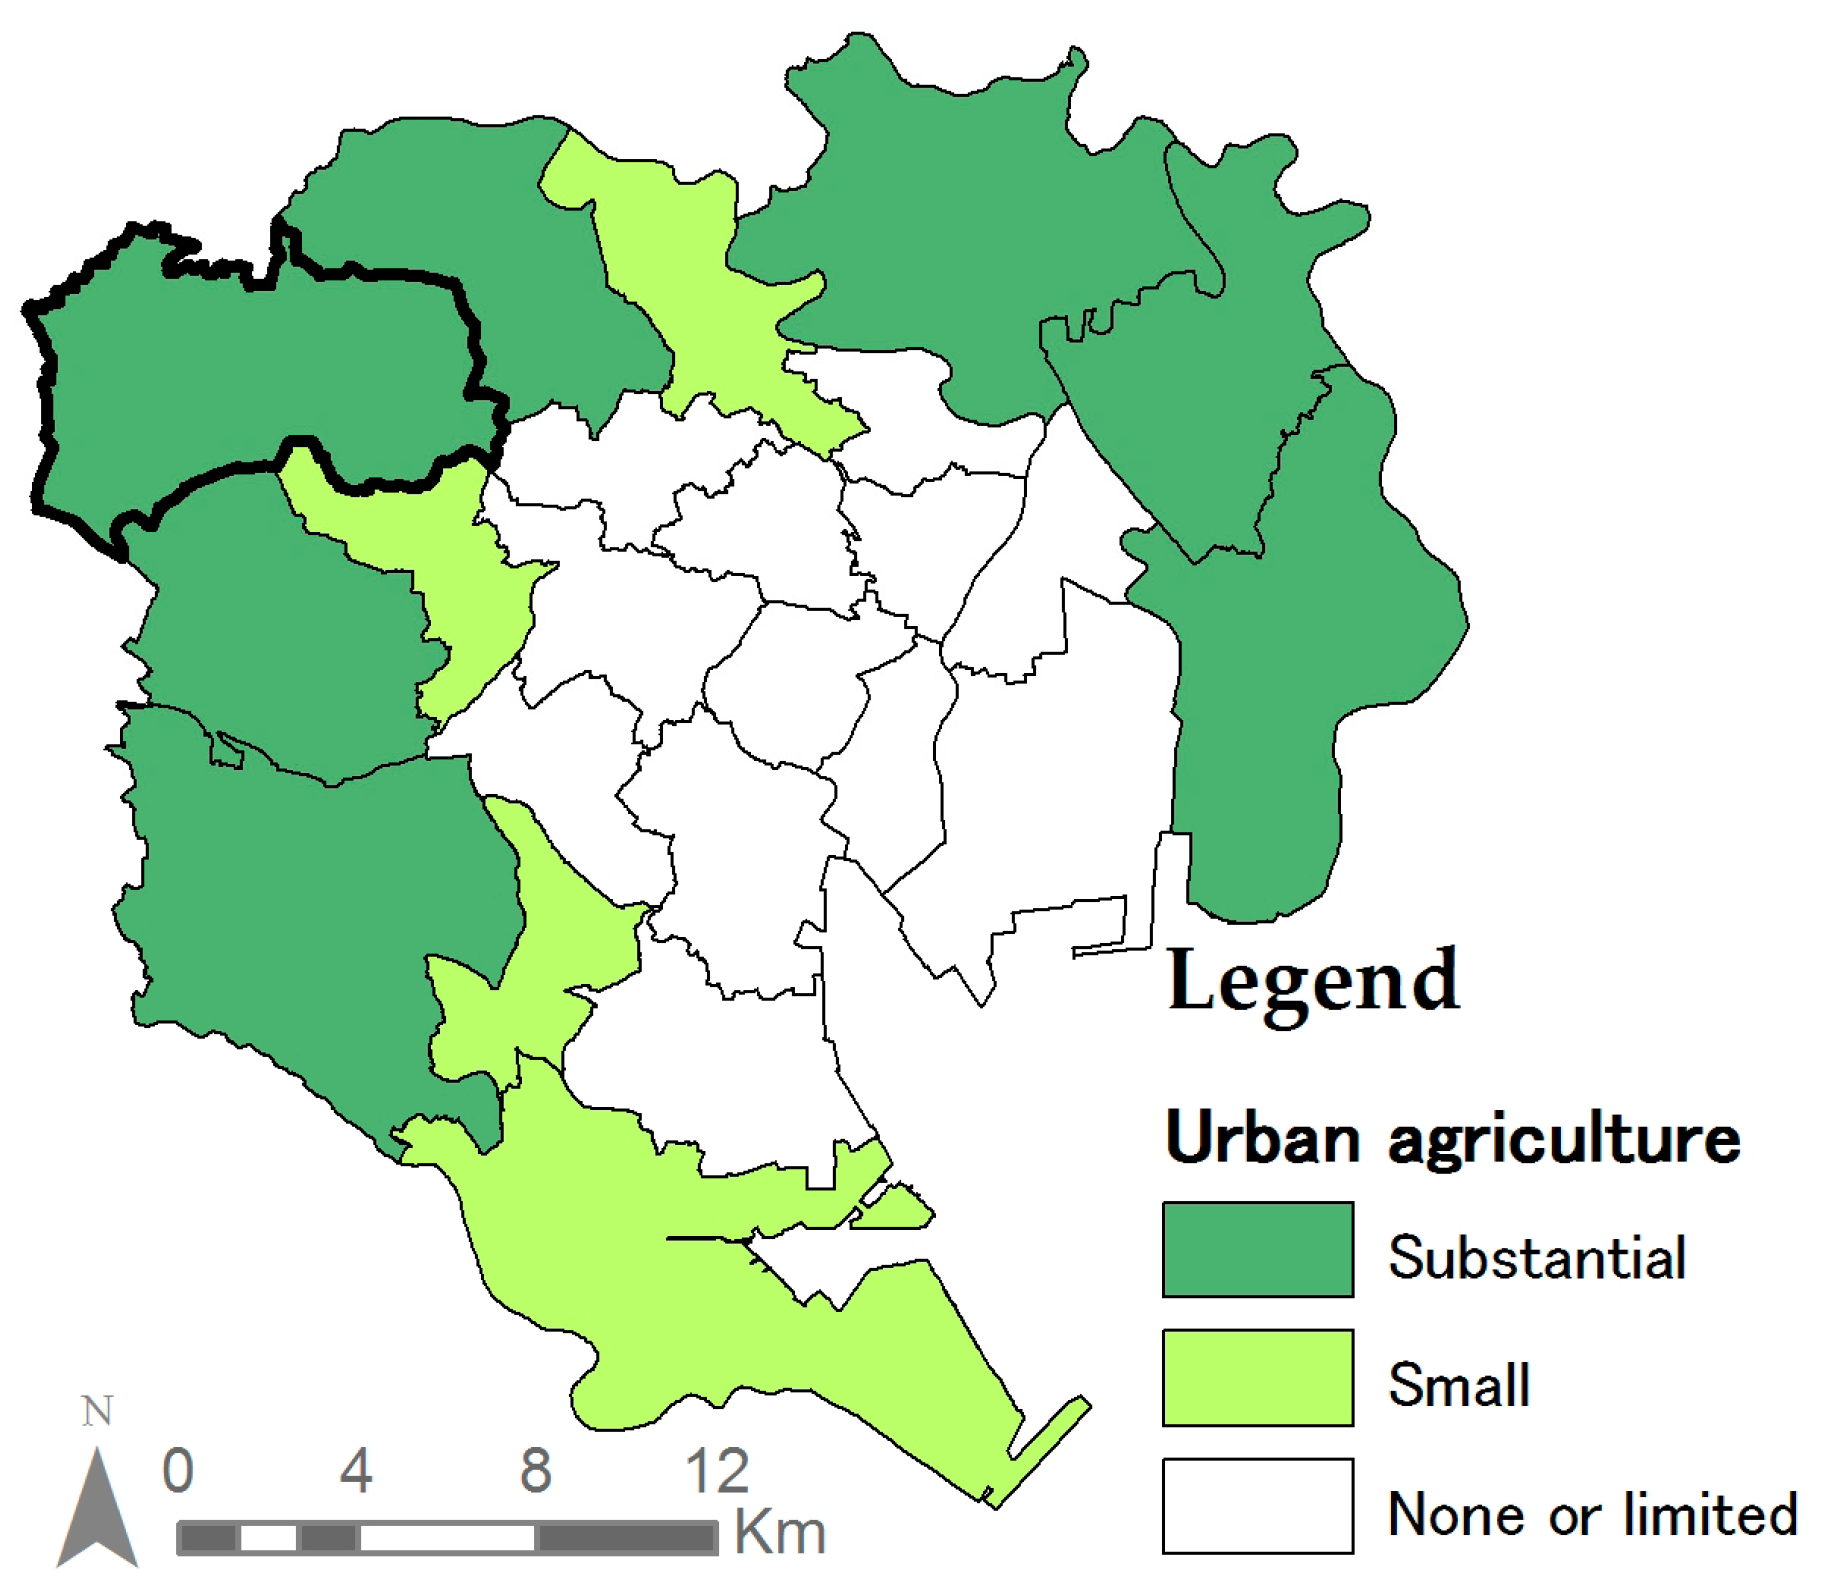
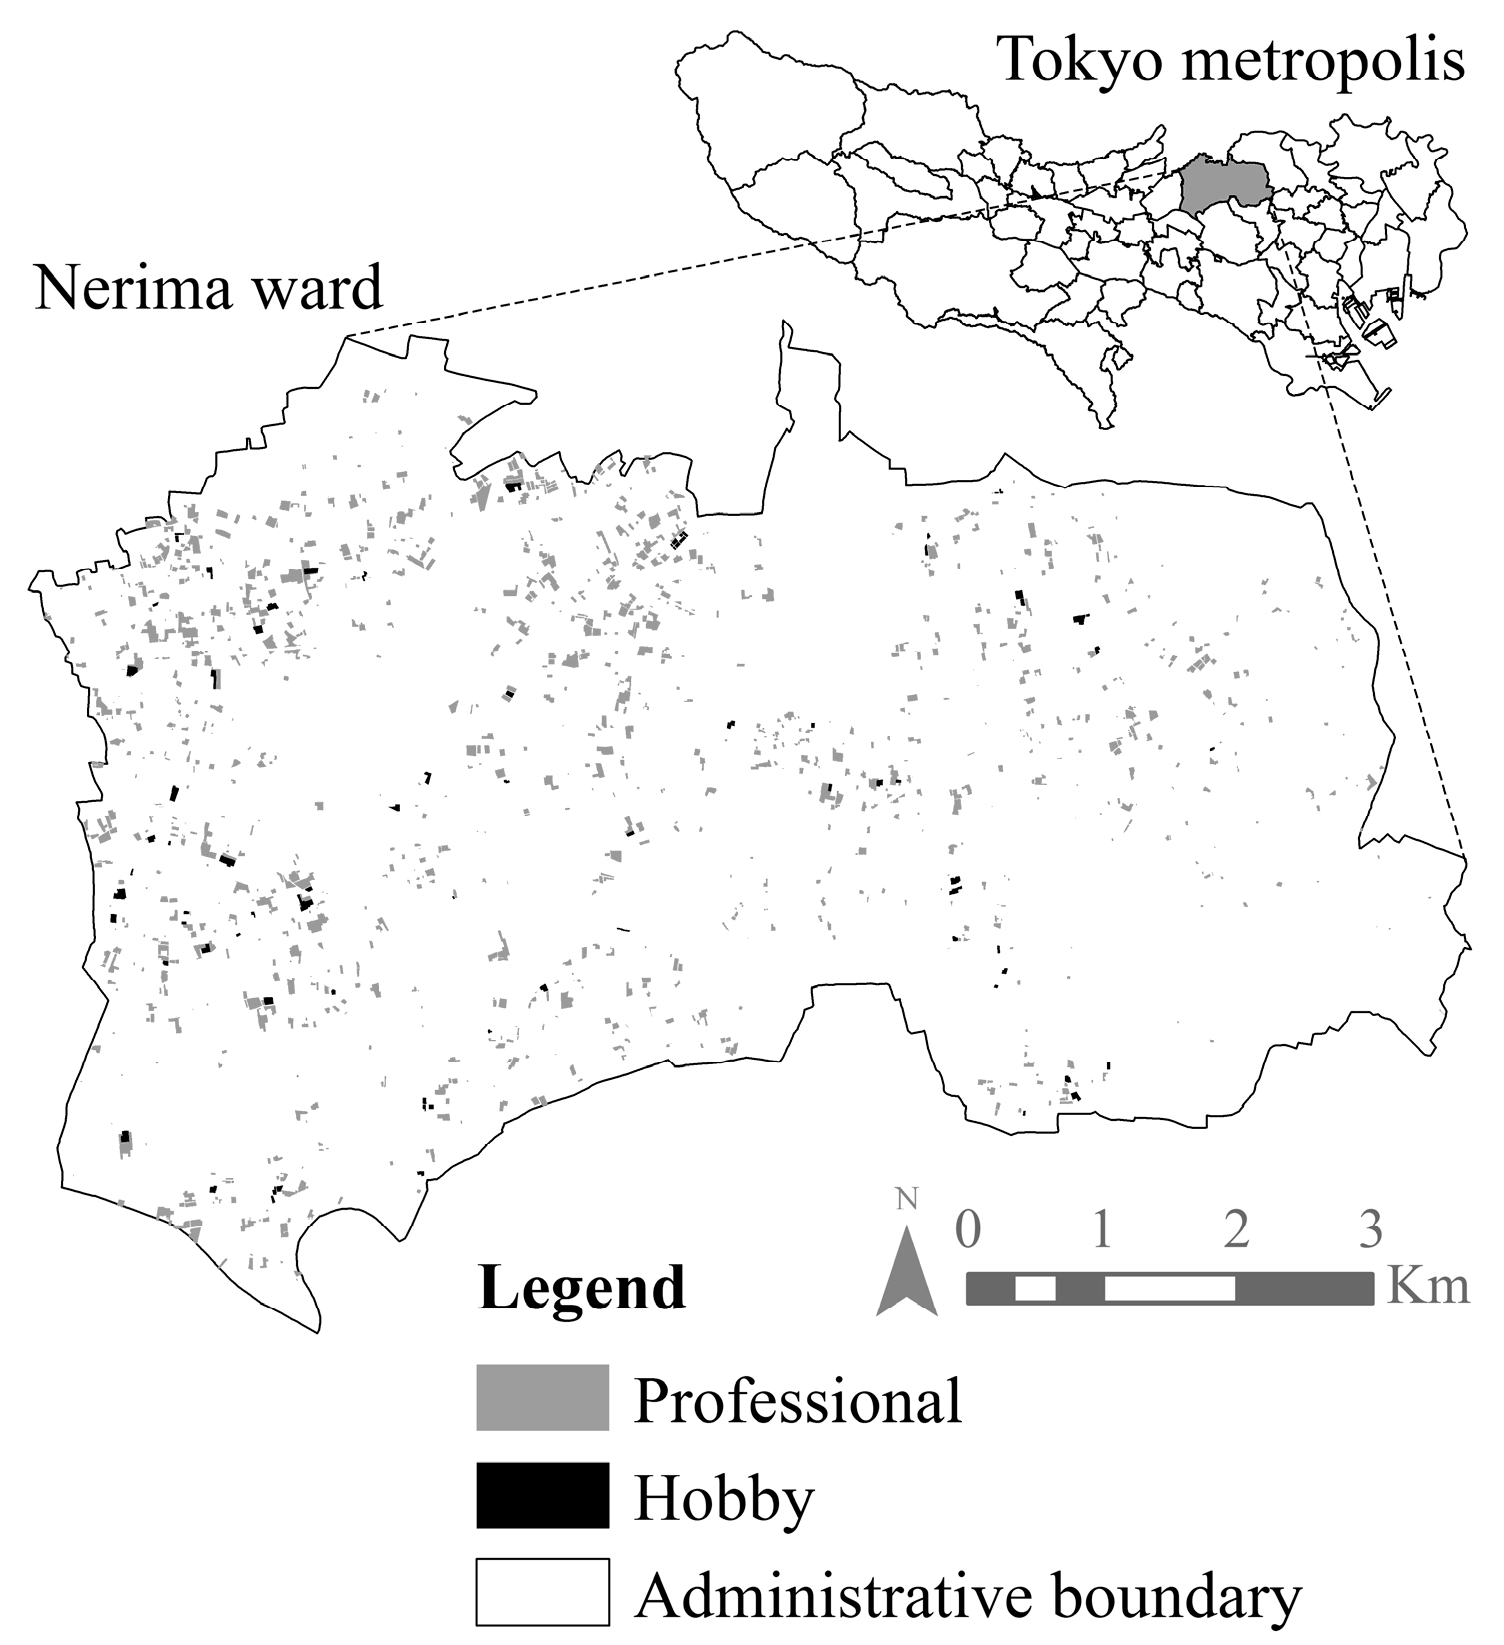
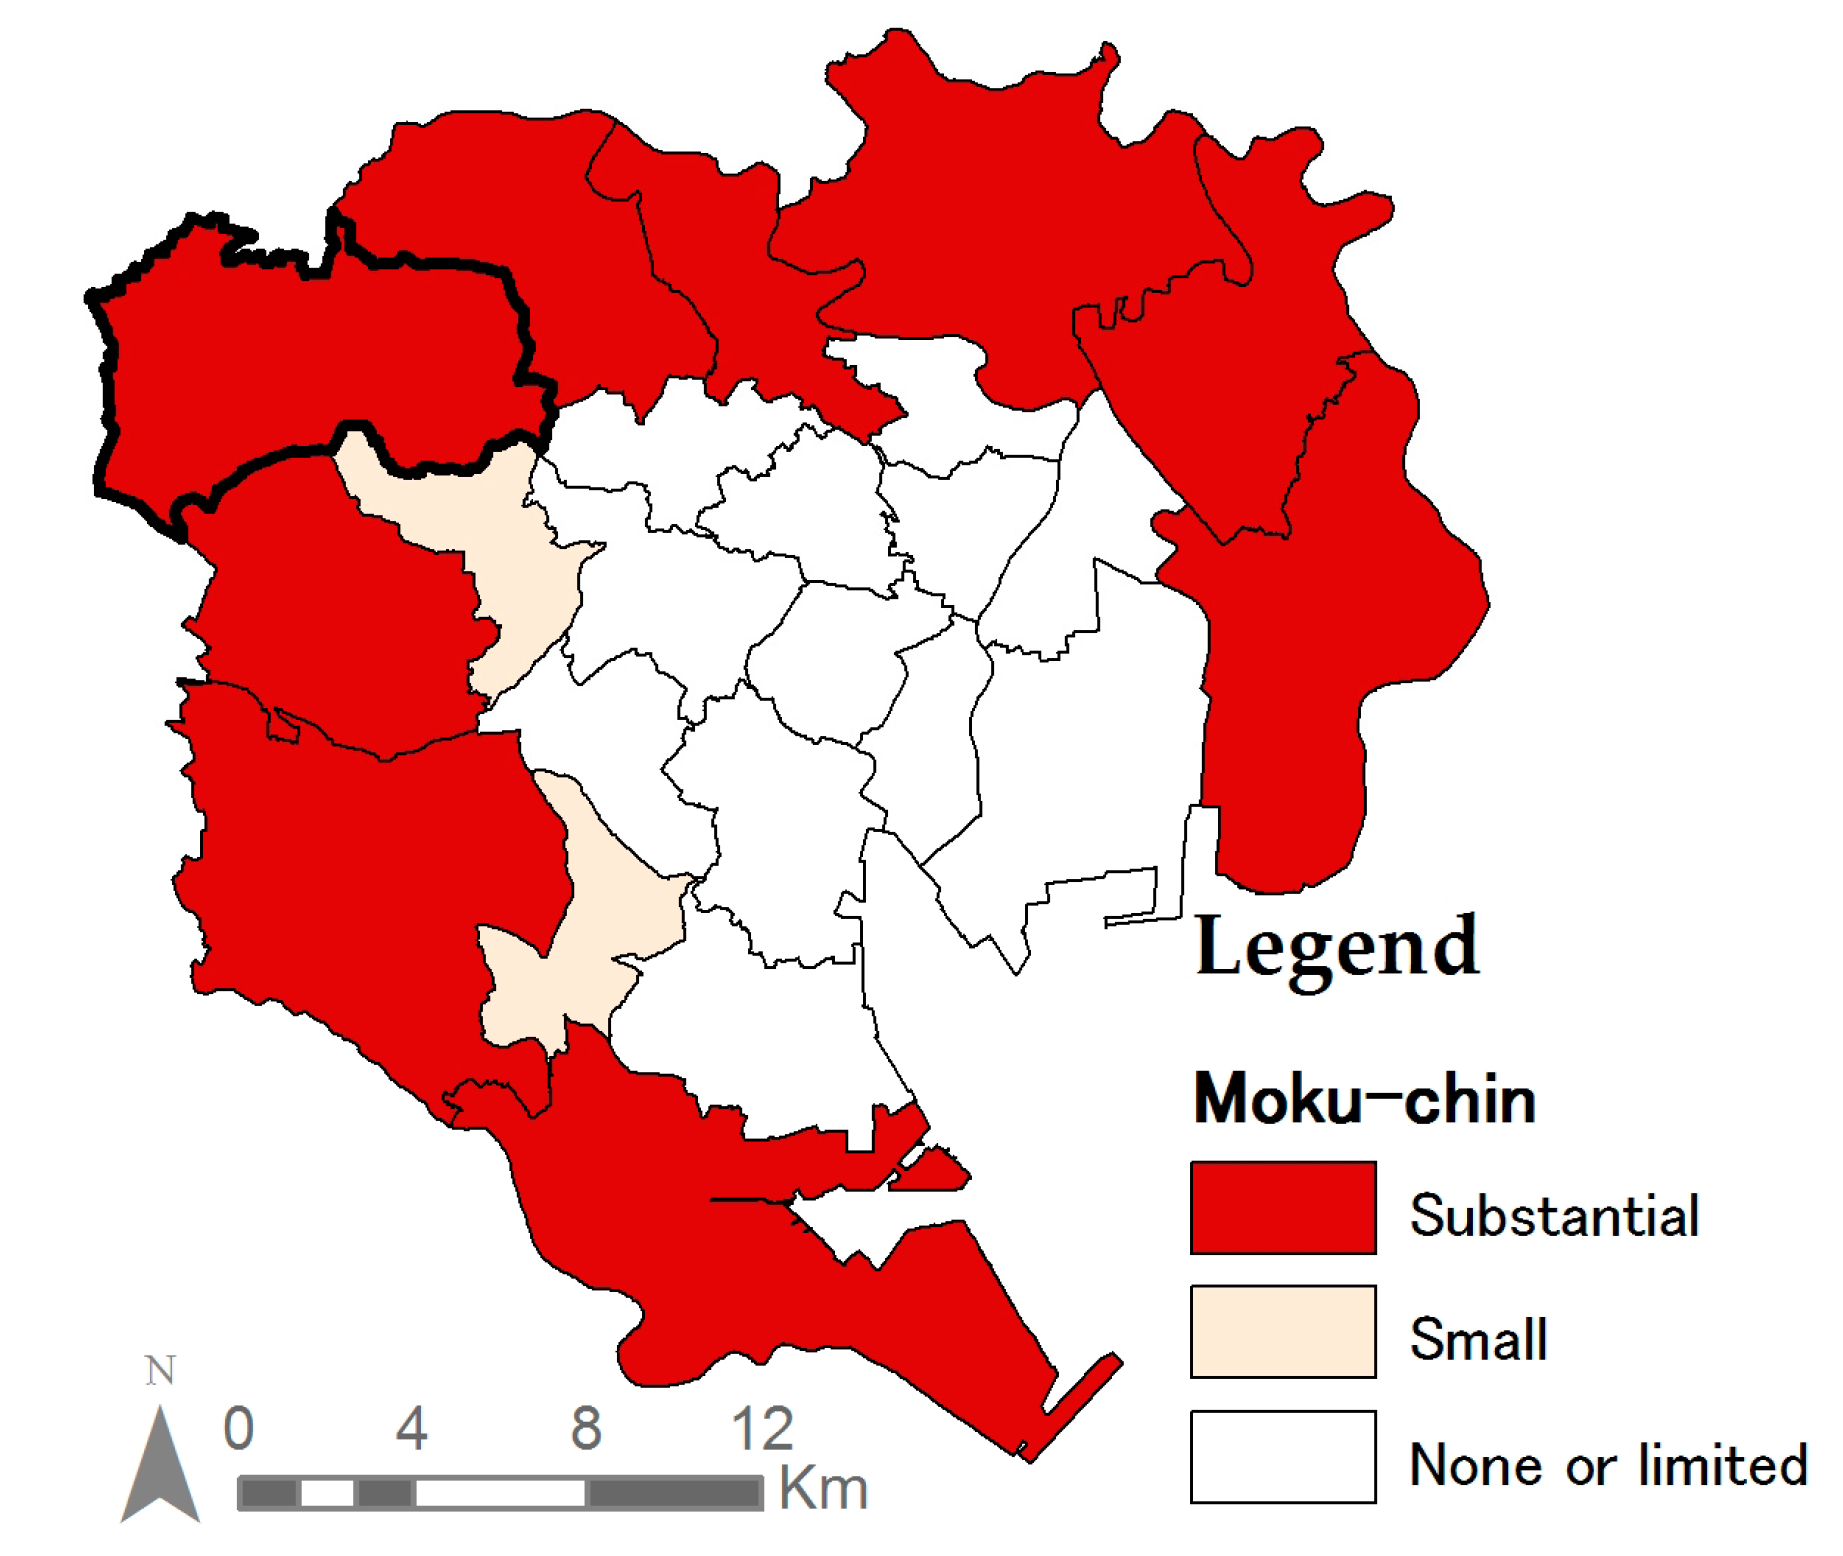
2.5. Setting
2.6. Subjects
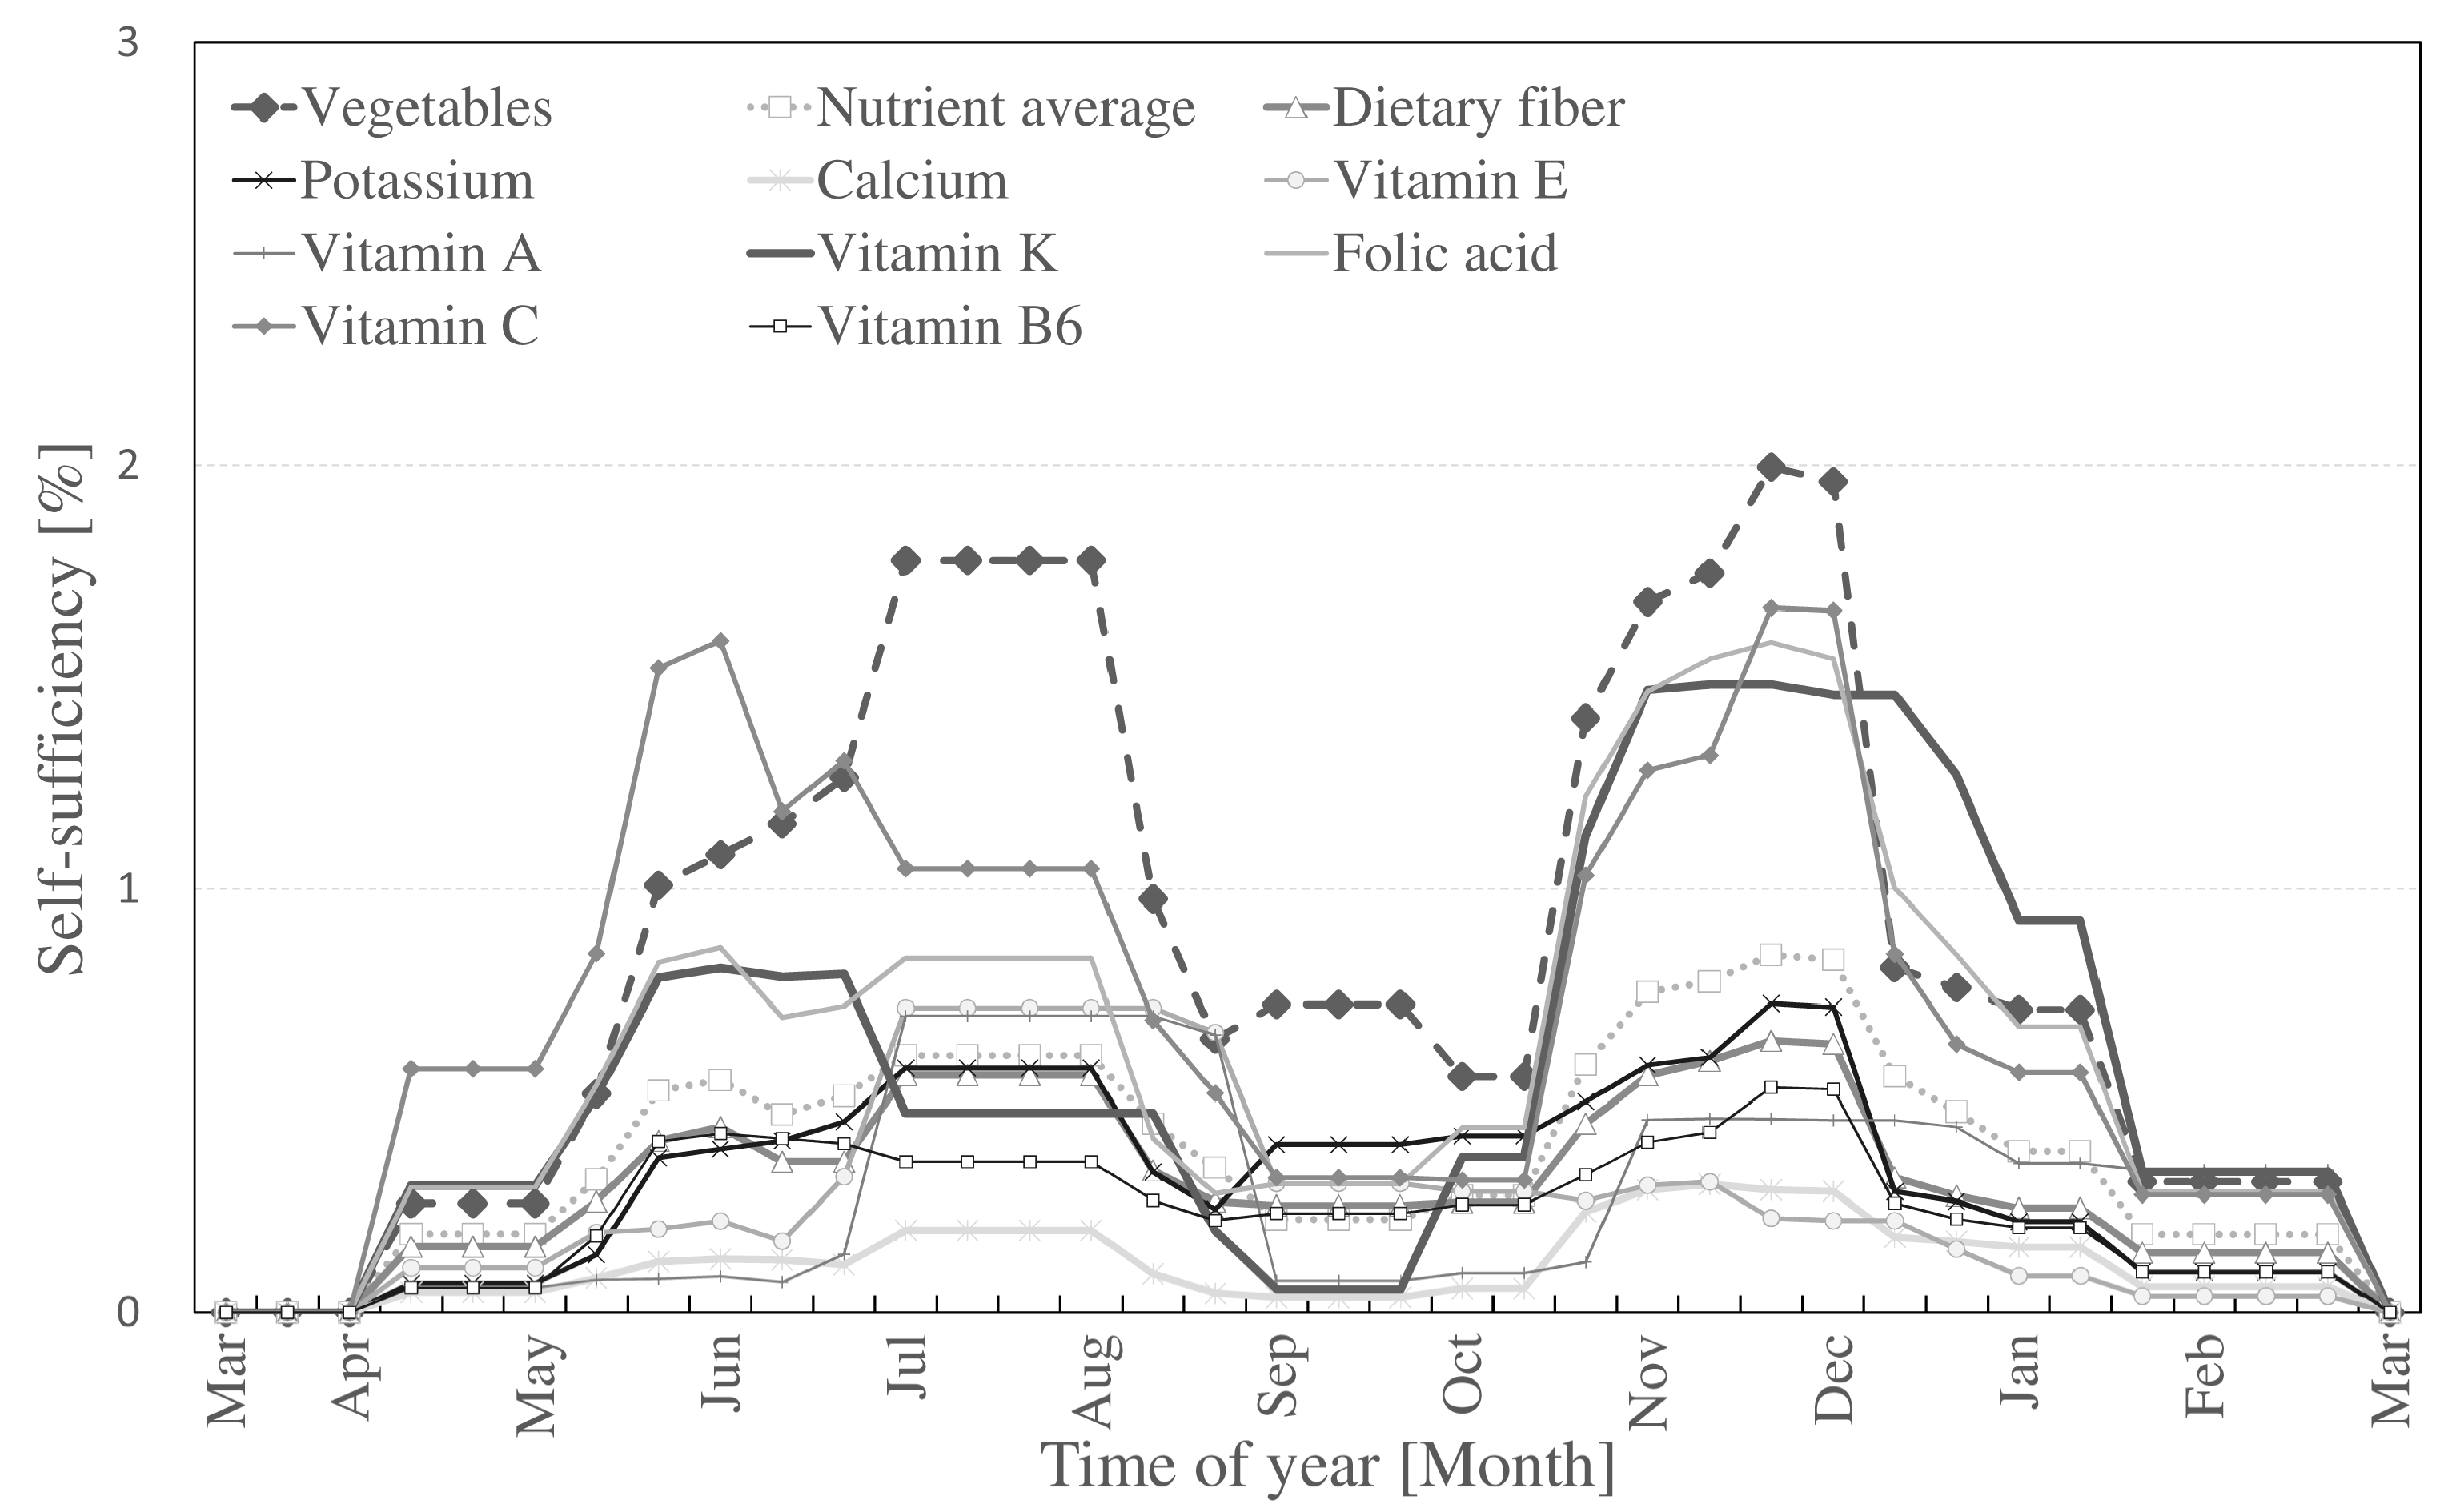
3. Results
4. Discussion
4.1. Comparison with other Case Studies and Contextualization of the Results
4.2. Impact and Target of Nutritional Self-Sufficiency for Post-Disaster Situations
4.3. Role of Urban Agriculture in Disasters
4.4. Limitations and Future Work
5. Conclusions
Acknowledgments
Author Contributions
Conflicts of Interest
References
- World Health Organization. Food and Nutrition Needs in Emergencies; World Health Organization: Geneva, Switzerland, 2004. Available online: http://apps.who.int/iris/bitstream/10665/68660/1/a83743.pdf (accessed on 3 March 2017).
- Nakazawa, T.; Beppu, S. Shifting from Emergency Food to Disaster Preparation Food to Help Disaster Survivors. In Science and Technology Trends; National Institute of Science and Technology Policy: Tokyo, Japan, 2012; pp. 36–52. [Google Scholar]
- Bassett, L. Promoting Nutrition Security in Haiti: An Assesment of Pre- and Post Earthquake Conditions and Recommendations for the Way Forward; The World Bank: Washington, DC, USA, 2010; p. 80. [Google Scholar]
- Centers for Disease Control and Prevention. Assessment of Health-Related Needs After Tsunami and Earthquake—Three Districts, Aceh Province, Indonesia. Morb. Mortal. Wkly. Rep. 2006, 55, 93–97. [Google Scholar]
- Tsuboyama-Kasaoka, N.; Purba, M.B. Nutrition and earthquakes: Experience and recommendations. Asia Pac. J. Clin. Nutr. 2014, 23, 505–513. [Google Scholar] [PubMed]
- UNICEF. Nepal Earthquake Humanitarian Situation Report: Three Months Review; UNICEF: Kathmandu, Nepal, 2015. Available online: https://www.unicef.org/appeals/files/UNICEF_Nepal_Humanitarian_Three_Month_Interactive_Situation_Report_25_July_2015.pdf (accessed on 1 March 2017).
- Inoue, T.; Nakao, A.; Kuboyama, K.; Hashimoto, A.; Masutani, M.; Ueda, T.; Kotani, J. Gastrointestinal symptoms and food/nutrition concerns after the great East Japan earthquake in March 2011: Survey of evacuees in a temporary shelter. Prehosp Disaster Med. 2014, 29, 303–306. [Google Scholar] [CrossRef] [PubMed]
- Nozue, M.; Ishikawa-Takata, K.; Sarukura, N.; Sako, K.; Tsuboyama-Kasaoka, N. Stockpiles and food availability in feeding facilities after the Great East Japan Earthquake. Asia Pac. J. Clin. Nutr. 2014, 23, 321–330. [Google Scholar] [PubMed]
- Tsuboyama-Kasaoka, N.; Hoshi, Y.; Onodera, K.; Mizuno, S.; Sako, K. What factors were important for dietary improvement in emergency shelters after the Great East Japan Earthquake? Asia Pac. J. Clin. Nutr. 2014, 23, 159–166. [Google Scholar] [PubMed]
- Amagai, T.; Ichimaru, S.; Tai, M.; Ejiri, Y.; Muto, A. Nutrition in the Great East Japan Earthquake Disaster. Nutr. Clin. Pract. 2014, 29, 585–594. [Google Scholar] [CrossRef] [PubMed]
- Aoki, T.; Takahashi, J.; Fukumoto, Y.; Yasuda, S.; Ito, K.; Miyata, S.; Shinozaki, T.; Inoue, K.; Yagi, T.; Komaru, T.; et al. Effect of the Great East Japan Earthquake on cardiovascular diseases—report from the 10 hospitals in the disaster area. Circ. J. 2013, 77, 490–493. [Google Scholar] [CrossRef] [PubMed]
- Padayatty, S.J.; Katz, A.; Wang, Y.; Eck, P.; Kwon, O.; Lee, J.-H.; Chen, S.; Corpe, C.; Dutta, A.; Dutta, S.K.; et al. Vitamin C as an antioxidant: Evaluation of its role in disease prevention. J. Am. Coll. Nutr. 2003, 22, 18–35. [Google Scholar] [CrossRef] [PubMed]
- Slavin, J.L.; Lloyd, B. Health benefits of fruits and vegetables. Adv. Nutr. 2012, 3, 506–516. [Google Scholar] [CrossRef] [PubMed]
- Food, Agriculture and Cities: Challenges of Food and Nutrition Security, Agriculture and Ecosystem Management in an Urbanizing World. Available online: http://www.fao.org/fileadmin/templates/FCIT/PDF/FoodAgriCities_Oct2011.pdf (accessed on 1 March 2017).
- Mougoet, L.J.A. Urban Agriculture: Definition, Precense, Potentials and Risks. In Growing Cities, Growing Food: Urban Agriculture on the Policy Agenda; Bakker, N., Dubbeling, M., Gündel, S., Sabel-Koschella, U., de Zeeuw, H., Eds.; Deutsche Stiftung für Internationale Entwicklung: Feldafing, Germany, 2000; pp. 1–42. [Google Scholar]
- Drescher, A. The Integration of Urban Agriculture into Urban Planning—An Analysis of the Current Status and Constraints 2001. Available online: http://areeweb.polito.it/didattica/UPWARD/dwd/agricolture/dreschler.pdf (accessed on 5 May 2017).
- Brown, K.H.; Jameton, A.L. Public Health Implications of Urban Agriculture. J. Public Health Policy 2000, 21, 20–39. [Google Scholar] [CrossRef] [PubMed]
- Rydin, Y.; Bleahu, A.; Davies, M.; Davila, J.D.; Friel, S.; di Grandis, G.; Groce, N.; Hallal, P.C.; Hamilton, I.G.; Howden-Chapman, P.; et al. Shaping Cities for Health: The complexities of planning urban environments in the 21st century. Lancet 2012, 379, 2079–2108. [Google Scholar] [CrossRef]
- Wilkins, J.L.; Farrell, T.J.; Rangarajan, A. Linking vegetable preferences, health and local food systems through community-supported agriculture. Public Health Nutr. 2015, 18, 2392–2401. [Google Scholar] [CrossRef] [PubMed]
- Wesener, A. Temporary urbanism and urban sustainability after a natural disaster: Transitional community-initiated open spaces in Christchurch, New Zealand. J. Urban. 2015, 8, 406–422. [Google Scholar] [CrossRef]
- Warren, E.; Hawkesworth, S.; Knai, C. Investigating the association between urban agriculture and food security, dietary diversity, and nutritional status: A systematic literature review. Food Policy 2015, 53, 54–66. [Google Scholar] [CrossRef]
- Sioen, G.B.; Terada, T.; Yokohari, M. Neighborhood self-sufficiency in Tokyo: How much can hobby farms contribute? In Growing in Cities; Tappert, S., Ed.; University of Applied Sciences: Basel, Switzerland, 2016; pp. 440–453. [Google Scholar]
- Grewal, S.S.; Grewal, P.S. Can cities become self-reliant in food? Cities 2011, 29, 1–11. [Google Scholar] [CrossRef]
- Rodríguez-Rodríguez, D.; Kain, J.H.; Haase, D.; Baró, F.; Kaczorowska, A. Urban self-sufficiency through optimised ecosystem service demand. A utopian perspective from European cities. Futures 2015, 70, 13–23. [Google Scholar] [CrossRef]
- Omari, C.K. Politics and policies of food self-sufficiency in Tanzania. Soc. Sci. Med. 1986, 22, 769–774. [Google Scholar] [CrossRef]
- Altay, N.; Green, W.G. OR/MS research in disaster operations management. Eur. J. Oper. Res. 2006, 175, 475–493. [Google Scholar] [CrossRef]
- Tahara, S.; Shioyama, S.; Kurita, H.; Terada, T. A quantitative assessment of agricultural production from allotment gardens. J. Jpn. Ins. Landsc. Arch. 2011, 74, 685–688. [Google Scholar] [CrossRef]
- Shiraishi, B.M. The Preservation and Use of Scarce Agricultural Land in Suburban Areas 2001. pp. 18–27. Available online: http://www.nli-research.co.jp/files/topics/51294_ext_18_en_0.pdf (accessed on 15 January 2017).
- MacNair, E. The Garden City Handbook: How to Create and Protect Community Gardens in Greater Victoria; University of Victoria: Victoria, BC, Canada, 2002. [Google Scholar]
- Tokyo Metropolitan Government. Tokyo Metropolitan Agricultural Products Production Survey Results; TMG: Tokyo, Japan, 2015. (In Japanese)
- Nerima Ward Citizen Farm. Available online: http://www.city.nerima.tokyo.jp/kusei/nogyo/hureai/noen/shiminnoen2013.html (accessed on 10 August 2016).
- Nerima Ward Agricultural Experience Farm. Available online: https://www.city.nerima.tokyo.jp/kusei/nogyo/hureai/taikennoen.html (accessed on 10 August 2016).
- Tokyo Metropolitan Government Land Use Data, Tokyo 2015; Planning Section—Tokyo Metropolitan Government: Tokyo, Japan, 2016. (In Japanese)
- Satoshi, F. Fujita Satoshi No Saien Start Book: Akifuyu & Haru Jyunbi Hen; NHK Publishing, Inc.: Tokyo, Japan, 2009. (In Japanese) [Google Scholar]
- Ministry of health Labour and Welfare of Japan. Outline of National Health and Nutrition Survey 2014; Ministry of health Labour and Welfare of Japan: Kasumigaseki, Japan, 2015.
- Kagawa, Y. Tables of Food Composition, 7th ed.; Kagawa, Y., Ed.; Kagawa Nutrition University Publishing Division: Sakado, Japan, 2016. [Google Scholar]
- Ministry of Health Labour and Welfare. Overview of Dietary Reference Intakes for Japanese (2015); Ministry of Health Labour and Welfare: Tokyo, Japan, 2015; Volume 21.
- Statistics Bureau of Japan Ministry of Internal Affairs and Communications. 2015 Population Census: Basic Complete Tabulation on Population and Households. Available online: http://www.e-stat.go.jp/SG1/estat/GL38020103.do?_toGL38020103_&tclassID=000001077438&cycleCode=0&requestSender=estat (accessed on 1 December 2016).
- Morita, A.; Yoshiike, N.; Takimoto, H.; Tsubota-Utsugi, M.; Kodama, H.; Shimizu, T.; Sugiyama, T.; Tabata, I.; Tamai, H.; Tsutsumi, C.; et al. Dietary Reference Intakes for Japanese 2010: Lifestage. J. Nutr. Sci. Vitaminol. 2013, 59, S103–S109. [Google Scholar] [CrossRef]
- Tokyo Metropolitan Government Department of Welfare and Health Bureau Total fertility rate in Tokyo (1993–2015). Available online: http://www.fukushihoken.metro.tokyo.jp/kiban/chosa_tokei/jinkodotaitokei/kushityosonbetsu.html (accessed on 23 June 2017).
- Ministry of Health Labour and Welfare of Japan. Health Japan 21 (The second term): Analysis and Assesment Project. List of Target. Available online: http://www.mhlw.go.jp/seisakunitsuite/bunya/kenkou_iryou/kenkou/kenkounippon21/en/kenkounippon21/mokuhyou05.html (accessed on 1 February 2017).
- Shiraishi, Y. Tokai No Hyagusho Desu [I’m an Urban Farmer]; Commons: Tokyo, Japan, 2001. (In Japanese) [Google Scholar]
- Yokohari, M.; Amati, M. Nature in the city, city in the nature: Case studies of the restoration of urban nature in Tokyo, Japan and Toronto, Canada. Landsc. Ecol. Eng. 2005, 1, 53–59. [Google Scholar] [CrossRef]
- Nerima Ward. Appealing Urban Agriculture in Our Community: Agriculture in Nerima; Nishinaka, K., Ed.; Kinseisha Co., Ltd.: Nerima, Tokyo, Japan, 2010; p. 40. [Google Scholar]
- Yagasaki, N.; Nakamura, Y. Protection of Urban Farming and Farmland in Tokyo. In Local Environmental Movements: A comparative Study of the United States & Japan; Pradyumna, P.K., Unryu, S., Eds.; The University Press of Kentucky: Tokyo, Japan, 2008; pp. 131–144. [Google Scholar]
- Sorensen, A. The Making of Urban Japan Cities and Planning from Edo to the Twenty-First Century; Routledge: London, UK; New York, NY, USA, 2002; pp. 475–524. [Google Scholar]
- Kurita, H.; Yokohari, M.; Bolthouse, J. The potential of intra-regional supply and demand of agricultural products in an urban fringe area: A case study of the Kanto Plain, Japan. Geogr. Tidsskr. Dan. J. Geogr. 2009, 109, 147–159. [Google Scholar] [CrossRef]
- Yagasaki, N.; Nakamura, Y. The Role of Local Groups in the Protection of Urban Farming and Farmland in Tokyo. In Local Environmental Movements; Pradyumna, K., Unryu, S., Eds.; University Press of Kentucky: Lexington, KY, USA, 2008; p. 303. [Google Scholar]
- Statistics Bureau of Japan Ministry of Internal Affairs and Communications. Regional Statistics Database. Available online: http://www.e-stat.go.jp/SG1/chiiki/Welcome.do?lang=02 (accessed on 30 November 2016).
- United States Census bureau Population, Housing Units, Area, and Density: 2000—State—Place and (in Selected States) County Subdivision more Information Census 2000 Summary. Available online: https://factfinder.census.gov/bkmk/table/1.0/en/DEC/10_SF1/GCTPH1.ST10?slice=GEO~0400000US39 (accessed on 23 June 2017).
- Tsubota, K. Urban Agriculture in Asia: Lessons from Japanese Experience; Food and Fertilizer Technology Center: Taipei, Taiwan, 2007; p. 18. [Google Scholar]
- Tokyo Metropolitan Government. Tokyo Metropolitan Government Disaster Prevention Guide Book; Tokyo Metropolitan Government: Tokyo, Japan, 2016.
- Sorensen, A. Uneven Geographies of Vulnerability. In Planning Asian Cities: Risks and Resilience; Hamnett, S., Forbes, D., Eds.; Routledge: New York, NY, USA, 2011; pp. 41–66. [Google Scholar]
- Gudzune, K.A.; Welsh, C.; Lane, E.; Chissell, Z.; Anderson Steeves, E.; Gittelsohn, J. Increasing access to fresh produce by pairing urban farms with corner stores: A case study in a low-income urban setting. Public Health Nutr. 2015, 18, 1–5. [Google Scholar] [CrossRef] [PubMed]
- Anderson, J.W.; Baird, P.; Davis, R.H.; Ferreri, S.; Knudtson, M.; Koraym, A.; Waters, V.; Williams, C.L. Health benefits of dietary fiber. Nutr. Rev. 2009, 67, 188–205. [Google Scholar] [CrossRef] [PubMed]
- Okuda, T.; Hirai, K.; Masuda, T.; Yamaguchi, H.; Yasuharu, T.; Fumiko, T.; Miyano, M. Survey of health status among victims of the great Hanshin-Awaji earthquake living in evacuation centers. J. Jpn. Soc. Physiol. Anthropol. 1996, 1, 101–107. (In Japanese) [Google Scholar]
- Suzuki, Y.; Tsutsumi, A.; Fukasawa, M.; Honma, H.; Someya, T.; Kim, Y. Prevalence of mental disorders and suicidal thoughts among community-dwelling elderly adults 3 years after the Niigata-Chuetsu earthquake. J. Epidemiol. 2011, 21, 144–150. [Google Scholar] [CrossRef] [PubMed]
- El Ansari, W.; Adetunji, H.; Oskrochi, R. Food and mental health: Relationship between food and perceived stress and depressive symptoms among university students in the United Kingdom. Cent. Eur. J. Med. 2014, 22, 90–97. [Google Scholar]
- Sorensen, A. Land readjustment and metropolitan growth: An examination of suburban land development and urban sprawl in the Tokyo metropolitan area. Prog. Plan. 2000, 53, 217–330. [Google Scholar] [CrossRef]
- Rumm-Kreuter, D.; Demmel, I. Comparison of Vitamin Losses in Vegetables Due to Various Cooking Methods. J. Nutr. Sci. Vitaminol. 1990, 36, 7–15. [Google Scholar] [CrossRef]
- Clapp, J. Food self-sufficiency: Making sense of it, and when it makes sense. Food Policy 2017, 66, 88–96. [Google Scholar] [CrossRef]
- Yokohari, M.; Bolthouse, J. Planning for the slow lane: The need to restore working greenspaces in maturing contexts. Landsc. Urban Plan. 2011, 100, 421–424. [Google Scholar] [CrossRef]


| No. | Land Use Type | Indicator [kg/m2] |
|---|---|---|
| 1 | Allotment | 4.16 |
| 2 | Experience | 6.91 |
| Age Group | Total | Male | Female |
|---|---|---|---|
| 0–5 months * | 2935 | 1497 | 1438 |
| 6–11 months * | 2935 | 1497 | 1438 |
| 1–2 years | 11,543 | 5906 | 5637 |
| 3–5 years | 16,930 | 8720 | 8210 |
| 6–7 years | 11,381 | 5888 | 5493 |
| 8–9 years | 11,046 | 5732 | 5314 |
| 10–11 years | 11,221 | 5717 | 5504 |
| 12–14 years | 18,115 | 9370 | 8745 |
| 15–17 years | 18,642 | 9559 | 9083 |
| 18–29 years | 101,874 | 49,695 | 52,179 |
| 30–49 years | 225,450 | 113,735 | 111,715 |
| 50–69 years | 168,816 | 84,328 | 84,488 |
| 70+ years | 116,008 | 47,393 | 68,615 |
| Unknown ** | 4814 | 2572 | 2242 |
| Total | 721,709 | 349,037 | 367,858 |
| No. | Vegetable Item | Harvest [t] [30] | Refuse [%] [36] | Harvest [periods] | Harvest per Period [t] |
|---|---|---|---|---|---|
| 1 | Cabbage | 1973.00 | 15% | 16 | 104.82 |
| 2 | Radishes | 557.00 | 10% | 9 | 55.7 |
| 3 | Tomato | 307.00 | 3% | 10 | 29.78 |
| 4 | Eggplant | 255.00 | 10% | 14 | 16.39 |
| 5 | Carrot | 217.00 | 3% | 18 | 11.69 |
| 6 | Potato | 211.00 | 10% | 6 | 31.65 |
| 7 | Chinese cabbage | 198.00 | 6% | 9 | 20.68 |
| 8 | Broccoli | 153.00 | 50% | 11 | 6.95 |
| 9 | Green onion | 147.00 | 40% | 11 | 8.02 |
| 10 | Japanese mustard spinach | 119.00 | 15% | 25 | 4.05 |
| 11 | Soybeans | 111.00 | 45% | 2 | 30.53 |
| 12 | Spinach | 86.00 | 10% | 12 | 6.45 |
| 13 | Cucumbers | 84.00 | 2% | 7 | 11.76 |
| 14 | Sweet corn | 76.00 | 50% | 6 | 6.33 |
| 15 | Turnip | 73.00 | 9% | 11 | 6.04 |
| 16 | Sweet potato | 72.00 | 9% | 5 | 13.10 |
| 17 | Taro | 61.00 | 15% | 5 | 10.37 |
| 18 | Pumpkin | 24.00 | 10% | 6 | 3.60 |
| 19 | Strawberry | 10.00 | 2% | 3 | 3.27 |
| 20 | Green pepper | 10.00 | 15% | 14 | 0.61 |
| 21 | Potherb mustard | 8.00 | 15% | 15 | 0.45 |
| 22 | Podded peas | 6.00 | 9% | 6 | 0.91 |
| 23 | Mountain asparagus | 6.00 | 35% | 4 | 0.98 |
| 24 | Haricot beans | 6.00 | 3% | 12 | 0.49 |
| 25 | Rapeseed | 3.00 | 0% | 20 | 0.15 |
| 26 | Burdock root | 3.00 | 10% | 18 | 0.15 |
| Total | 4776.00 | 384.91 | |||
| No. | Vegetable Item | Harvest [t] | Refuse [%] [36] | Harvest [periods] | Harvest per Period [t] |
|---|---|---|---|---|---|
| 1 | Radishes | 203.39 | 10% | 9 | 20.34 |
| 2 | Chinese cabbage | 99.20 | 6% | 9 | 10.36 |
| 3 | Tomato | 83.88 | 3% | 10 | 8.14 |
| 4 | Cabbage | 69.08 | 15% | 16 | 3.67 |
| 5 | Cucumbers | 60.08 | 2% | 7 | 8.41 |
| 6 | Potato | 58.96 | 10% | 6 | 8.84 |
| 7 | Taro | 50.08 | 15% | 5 | 8.51 |
| 8 | Carrots | 44.95 | 3% | 18 | 2.42 |
| 9 | Podded peas | 43.13 | 9% | 6 | 6.54 |
| 10 | Green onion | 31.85 | 40% | 11 | 1.74 |
| 11 | Pumpkin | 26.74 | 10% | 6 | 4.01 |
| 12 | Broccoli | 26.64 | 50% | 11 | 1.21 |
| 13 | Eggplants | 20.90 | 10% | 14 | 1.34 |
| 14 | Onion | 19.14 | 6% | 4 | 4.50 |
| 15 | Spinach | 17.43 | 10% | 12 | 1.31 |
| 16 | Sweet potato | 13.63 | 9% | 5 | 2.48 |
| 17 | Green pepper | 8.33 | 15% | 14 | 0.51 |
| 18 | Lettuce | 6.28 | 2% | 7 | 0.88 |
| Total | 883.70 | 95.21 | |||
| Name | Required [kg] | Available [kg] | Self-Sufficiency [%] | |||
|---|---|---|---|---|---|---|
| Method: I | II | I | II | I & II | ||
| Vegetables in weight | 91,583,336.00 | 4,776,000.00 | 883,701.00 | 5.21 | 0.96 | 6.18 |
| Dietary fiber | 4,552,058.45 | 75,493.58 | 13,801.21 | 1.66 | 0.30 | 1.96 |
| Potassium | 686,243.03 | 10,338.25 | 2160.88 | 1.51 | 0.31 | 1.82 |
| Calcium | 171,473.72 | 1441.21 | 196.97 | 0.84 | 0.11 | 0.96 |
| Vitamin C | 24,565.73 | 1174.72 | 176.10 | 4.78 | 0.72 | 5.50 |
| Vitamin E | 1566.47 | 13.73 | 3.98 | 0.88 | 0.25 | 1.13 |
| Vitamin B6 | 321.67 | 4.20 | 0.77 | 1.30 | 0.24 | 1.54 |
| Vitamin A | 190.11 | 2.39 | 0.53 | 1.26 | 0.28 | 1.54 |
| Folic acid | 58.34 | 2.65 | 0.36 | 4.54 | 0.61 | 5.15 |
| Vitamin K | 37.03 | 2.06 | 0.22 | 5.57 | 0.58 | 6.15 |
| Nutrient average | 2.48 | 0.38 | 2.86 | |||
| Name | Method I [%] | Method II [%] | ||||||
|---|---|---|---|---|---|---|---|---|
| Spring | Summer | Fall | Winter | Spring | Summer | Fall | Winter | |
| Vegetables in weight | 0.11 | 2.60 | 2.01 | 3.78 | 0.09 | 0.48 | 0.39 | 0.42 |
| Dietary fiber | 0.06 | 1.95 | 1.40 | 2.29 | 0.08 | 0.41 | 0.34 | 0.29 |
| Potassium | 0.07 | 1.79 | 1.57 | 1.91 | 0.03 | 0.42 | 0.45 | 0.28 |
| Calcium | 0.06 | 0.84 | 0.70 | 1.30 | 0.02 | 0.13 | 0.12 | 0.15 |
| Vitamin E | 0.05 | 1.25 | 1.21 | 0.75 | 0.05 | 0.47 | 0.29 | 0.12 |
| Vitamin A | 0.07 | 1.42 | 0.92 | 1.86 | 0.03 | 0.39 | 0.15 | 0.36 |
| Vitamin K | 0.33 | 4.74 | 4.27 | 9.66 | 0.15 | 0.53 | 0.57 | 0.86 |
| Folic acid | 0.18 | 4.98 | 3.53 | 6.78 | 0.15 | 0.67 | 0.69 | 0.75 |
| Vitamin C | 0.17 | 4.97 | 3.33 | 7.63 | 0.29 | 1.01 | 0.60 | 0.70 |
| Vitamin B6 | 0.04 | 1.45 | 1.15 | 1.88 | 0.03 | 0.33 | 0.28 | 0.23 |
| Nutrient average | 0.11 | 2.60 | 2.01 | 3.78 | 0.09 | 0.48 | 0.39 | 0.42 |
© 2017 by the authors. Licensee MDPI, Basel, Switzerland. This article is an open access article distributed under the terms and conditions of the Creative Commons Attribution (CC BY) license (http://creativecommons.org/licenses/by/4.0/).
Share and Cite
Sioen, G.B.; Sekiyama, M.; Terada, T.; Yokohari, M. Post-Disaster Food and Nutrition from Urban Agriculture: A Self-Sufficiency Analysis of Nerima Ward, Tokyo. Int. J. Environ. Res. Public Health 2017, 14, 748. https://doi.org/10.3390/ijerph14070748
Sioen GB, Sekiyama M, Terada T, Yokohari M. Post-Disaster Food and Nutrition from Urban Agriculture: A Self-Sufficiency Analysis of Nerima Ward, Tokyo. International Journal of Environmental Research and Public Health. 2017; 14(7):748. https://doi.org/10.3390/ijerph14070748
Chicago/Turabian StyleSioen, Giles Bruno, Makiko Sekiyama, Toru Terada, and Makoto Yokohari. 2017. "Post-Disaster Food and Nutrition from Urban Agriculture: A Self-Sufficiency Analysis of Nerima Ward, Tokyo" International Journal of Environmental Research and Public Health 14, no. 7: 748. https://doi.org/10.3390/ijerph14070748
APA StyleSioen, G. B., Sekiyama, M., Terada, T., & Yokohari, M. (2017). Post-Disaster Food and Nutrition from Urban Agriculture: A Self-Sufficiency Analysis of Nerima Ward, Tokyo. International Journal of Environmental Research and Public Health, 14(7), 748. https://doi.org/10.3390/ijerph14070748