Spatio-Temporal Analysis of Suicide-Related Emergency Calls


Abstract
:1. Introduction
2. Materials and Methods
2.1. Emergency Police Calls in Valencia City
2.2. Spatial Disease Mapping
2.3. Spatio-Temporal Disease Mapping: Annual Data
2.4. Spatio-Temporal Disease Mapping: Quarterly Data
2.5. Statistical Inference
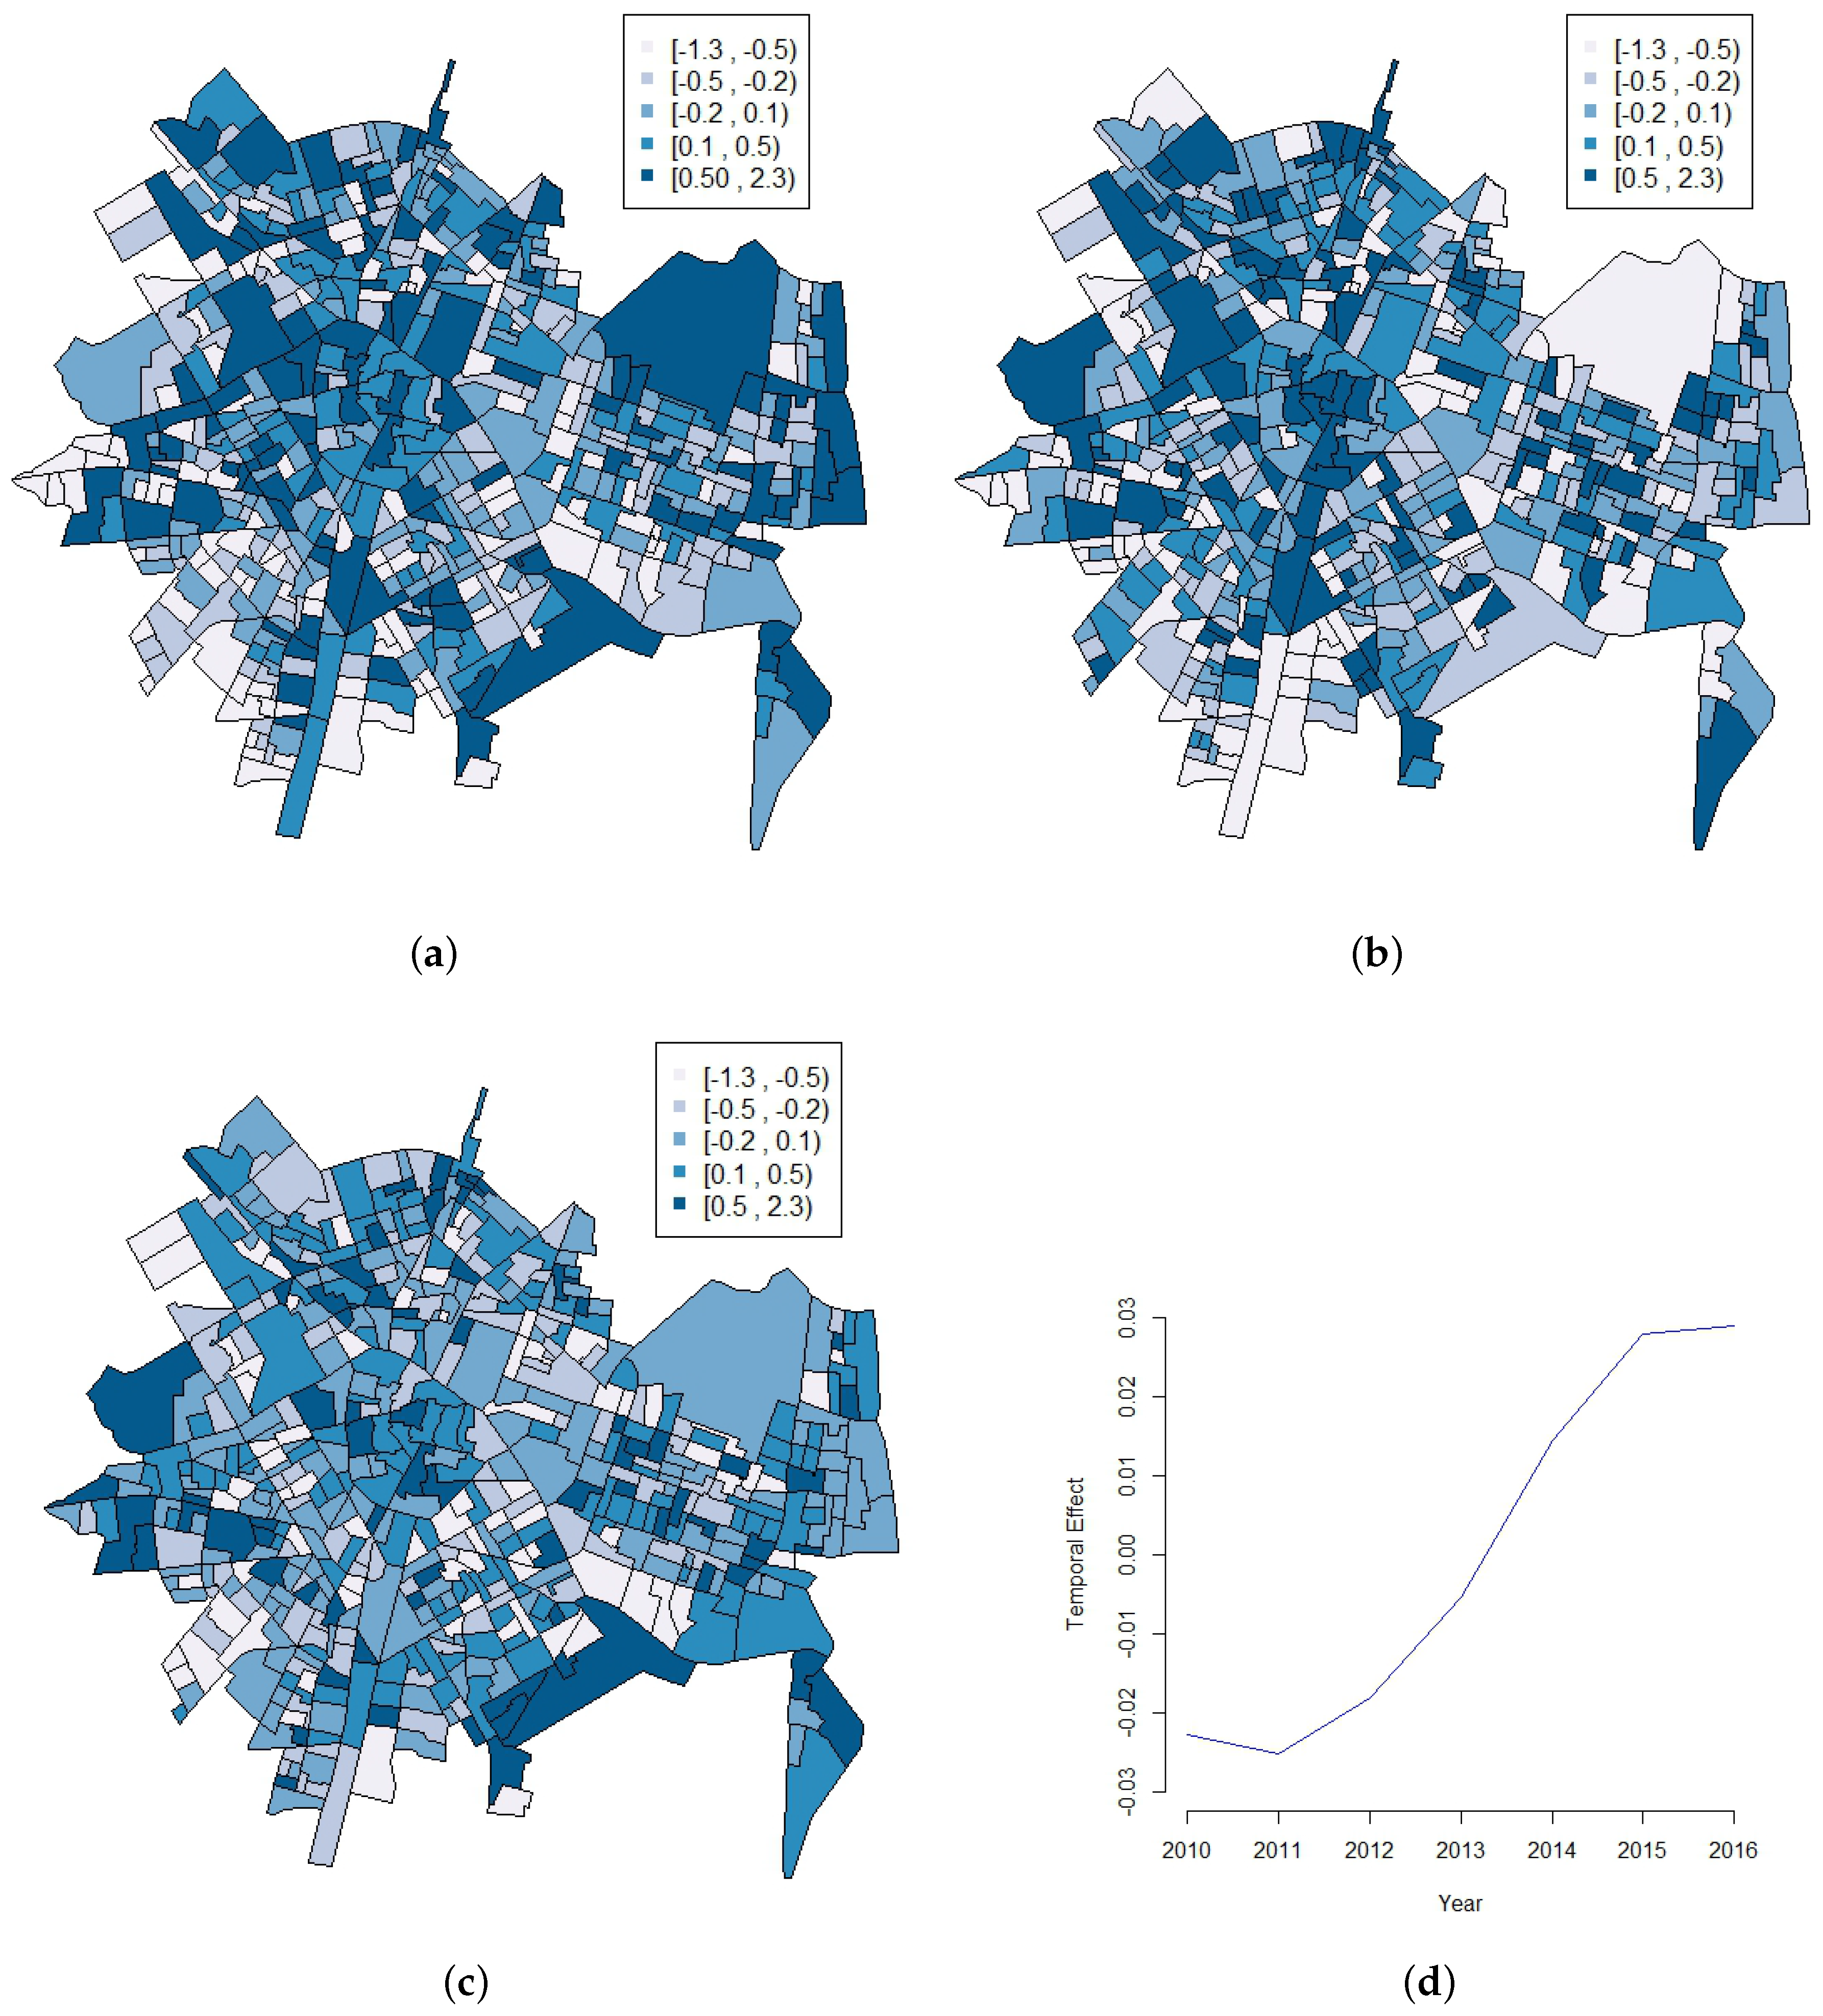
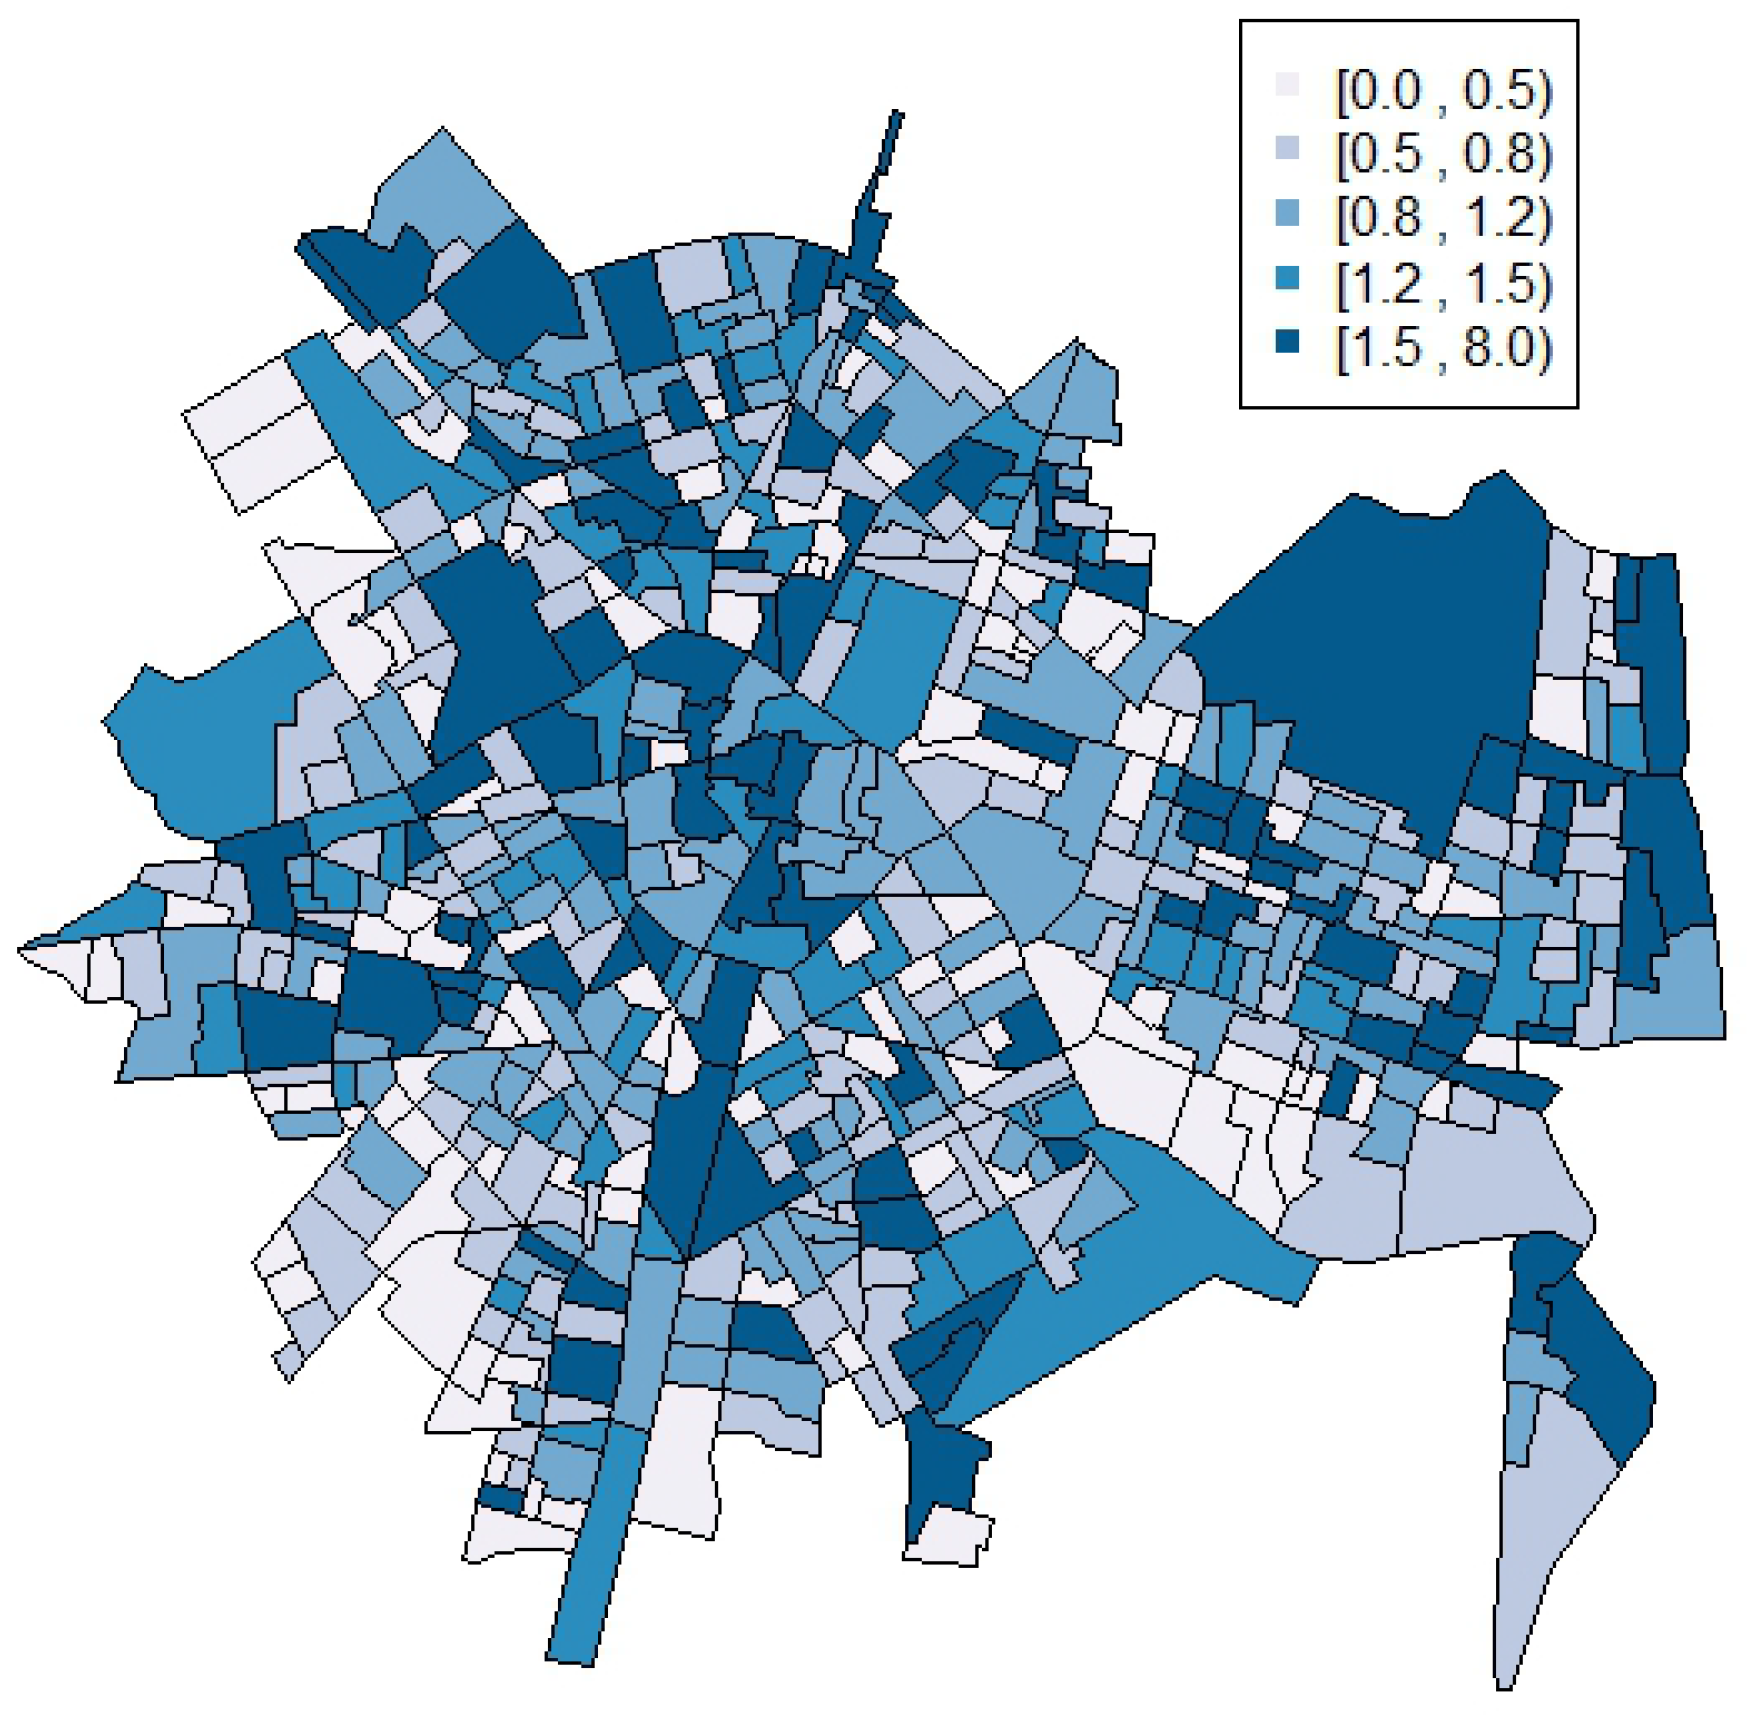
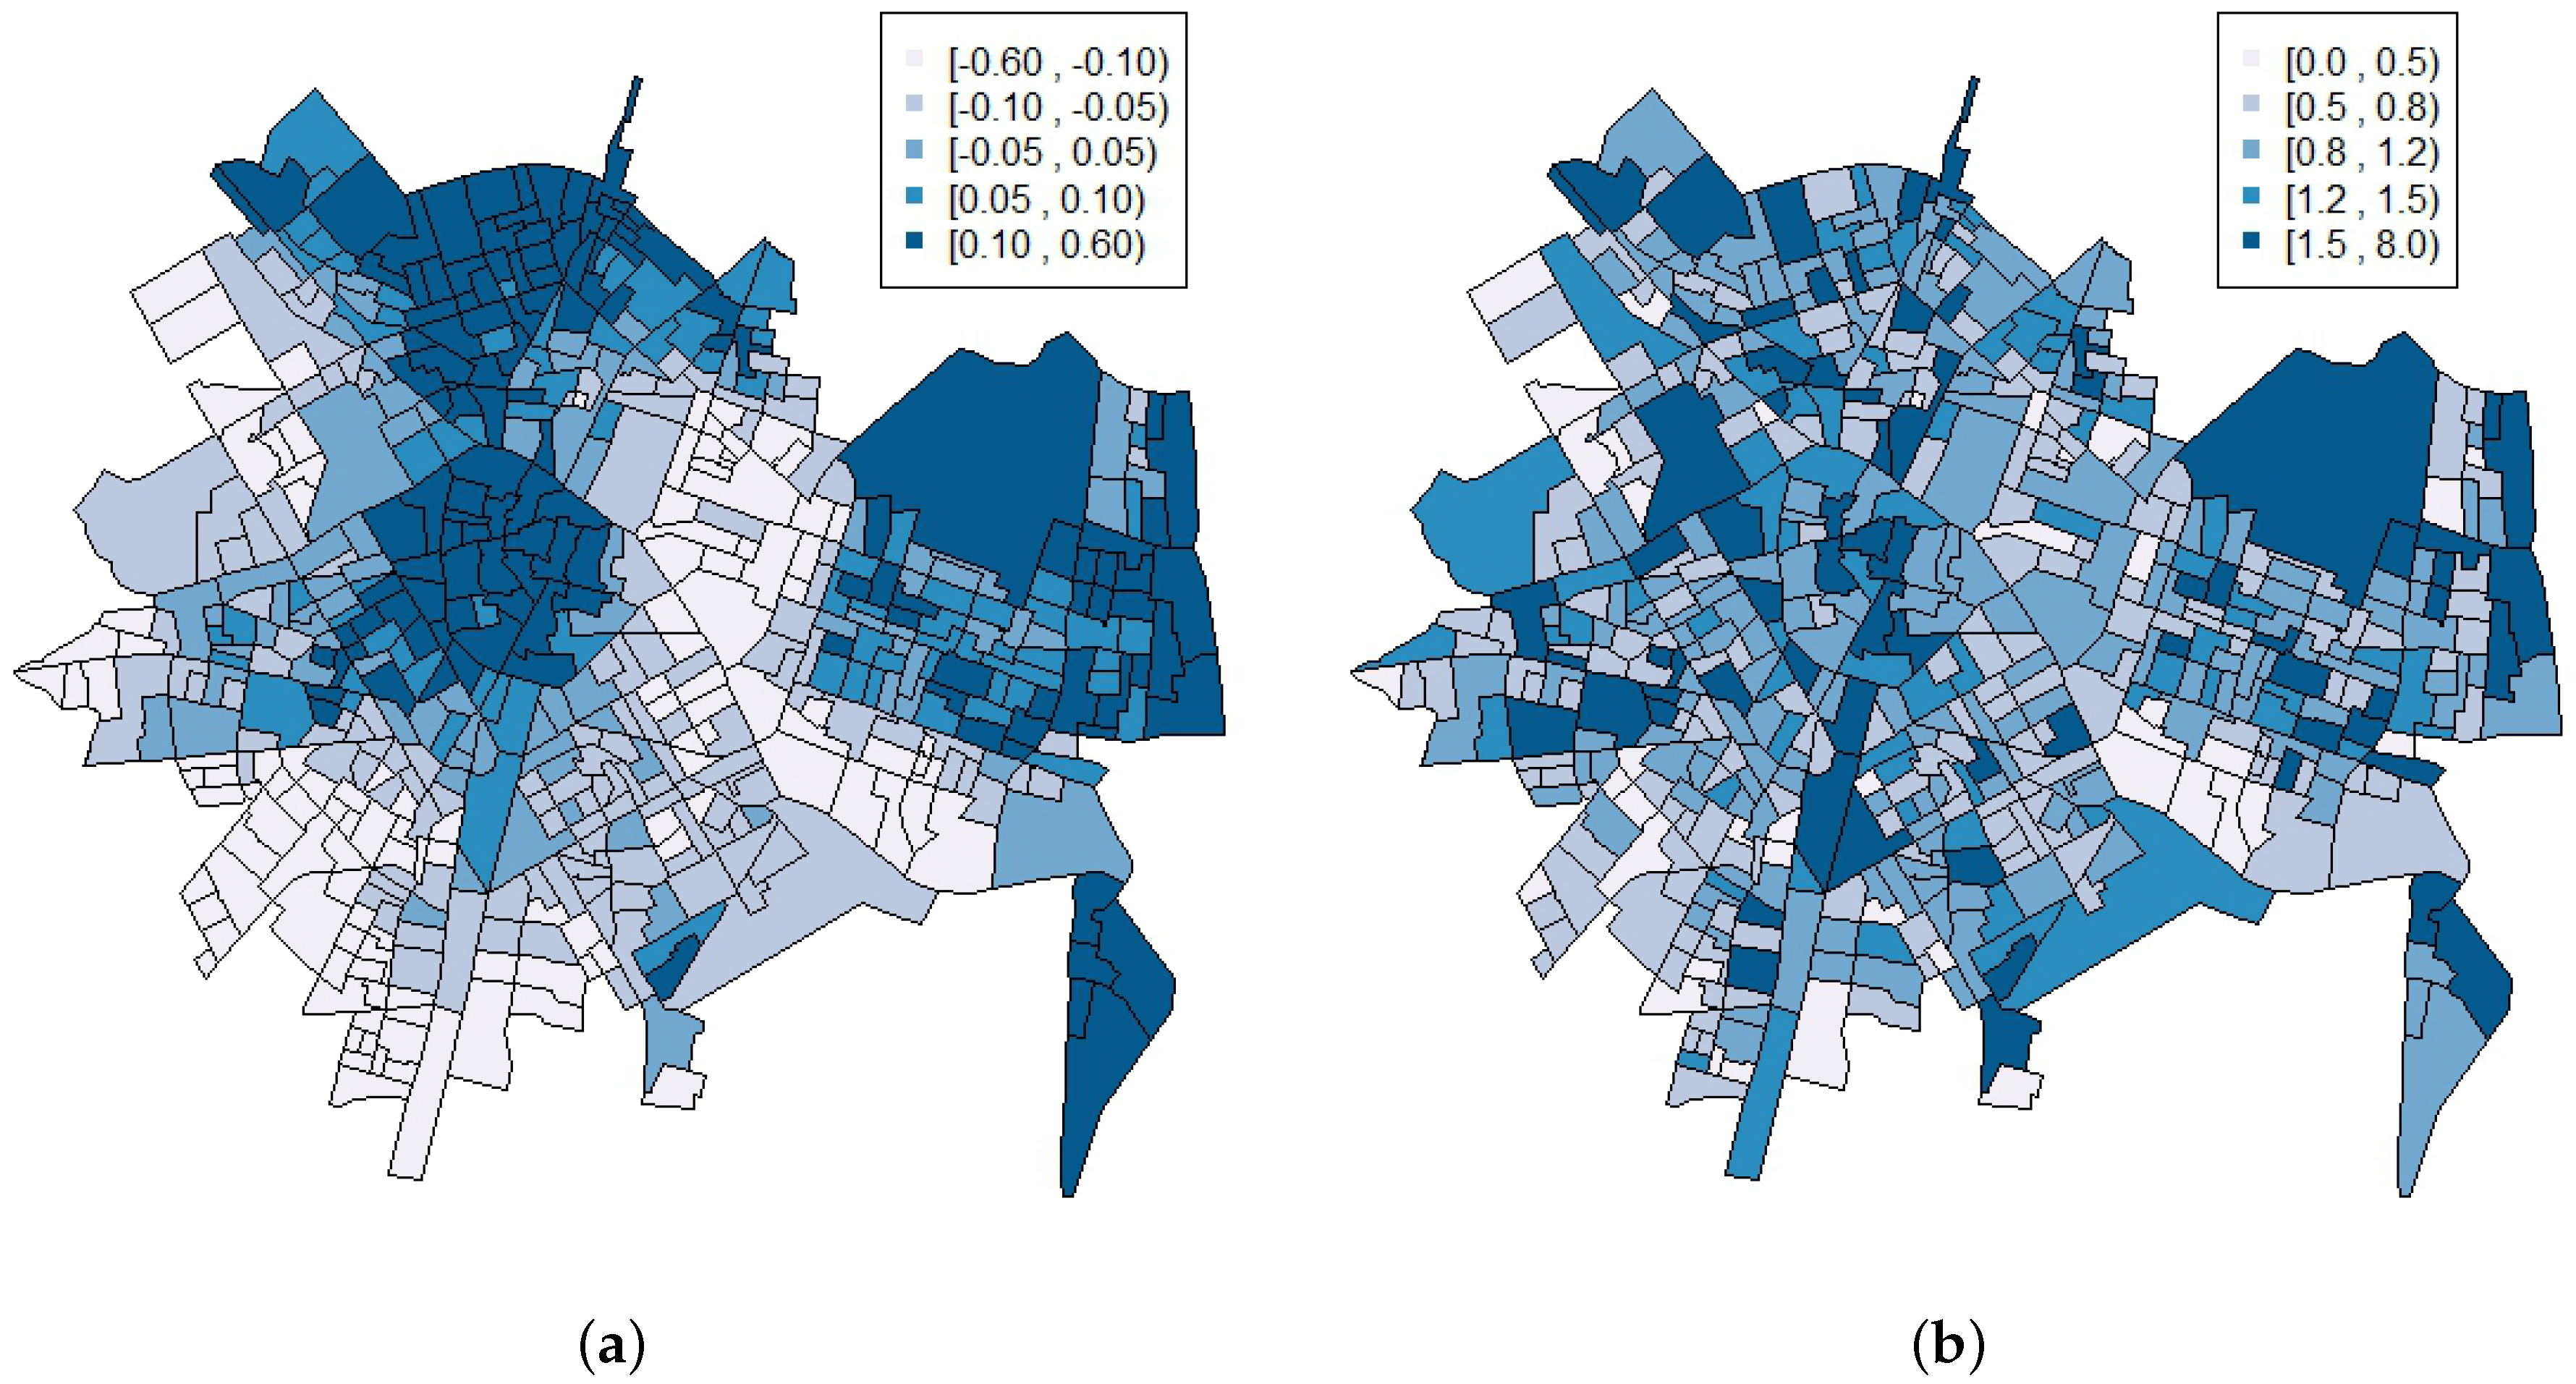
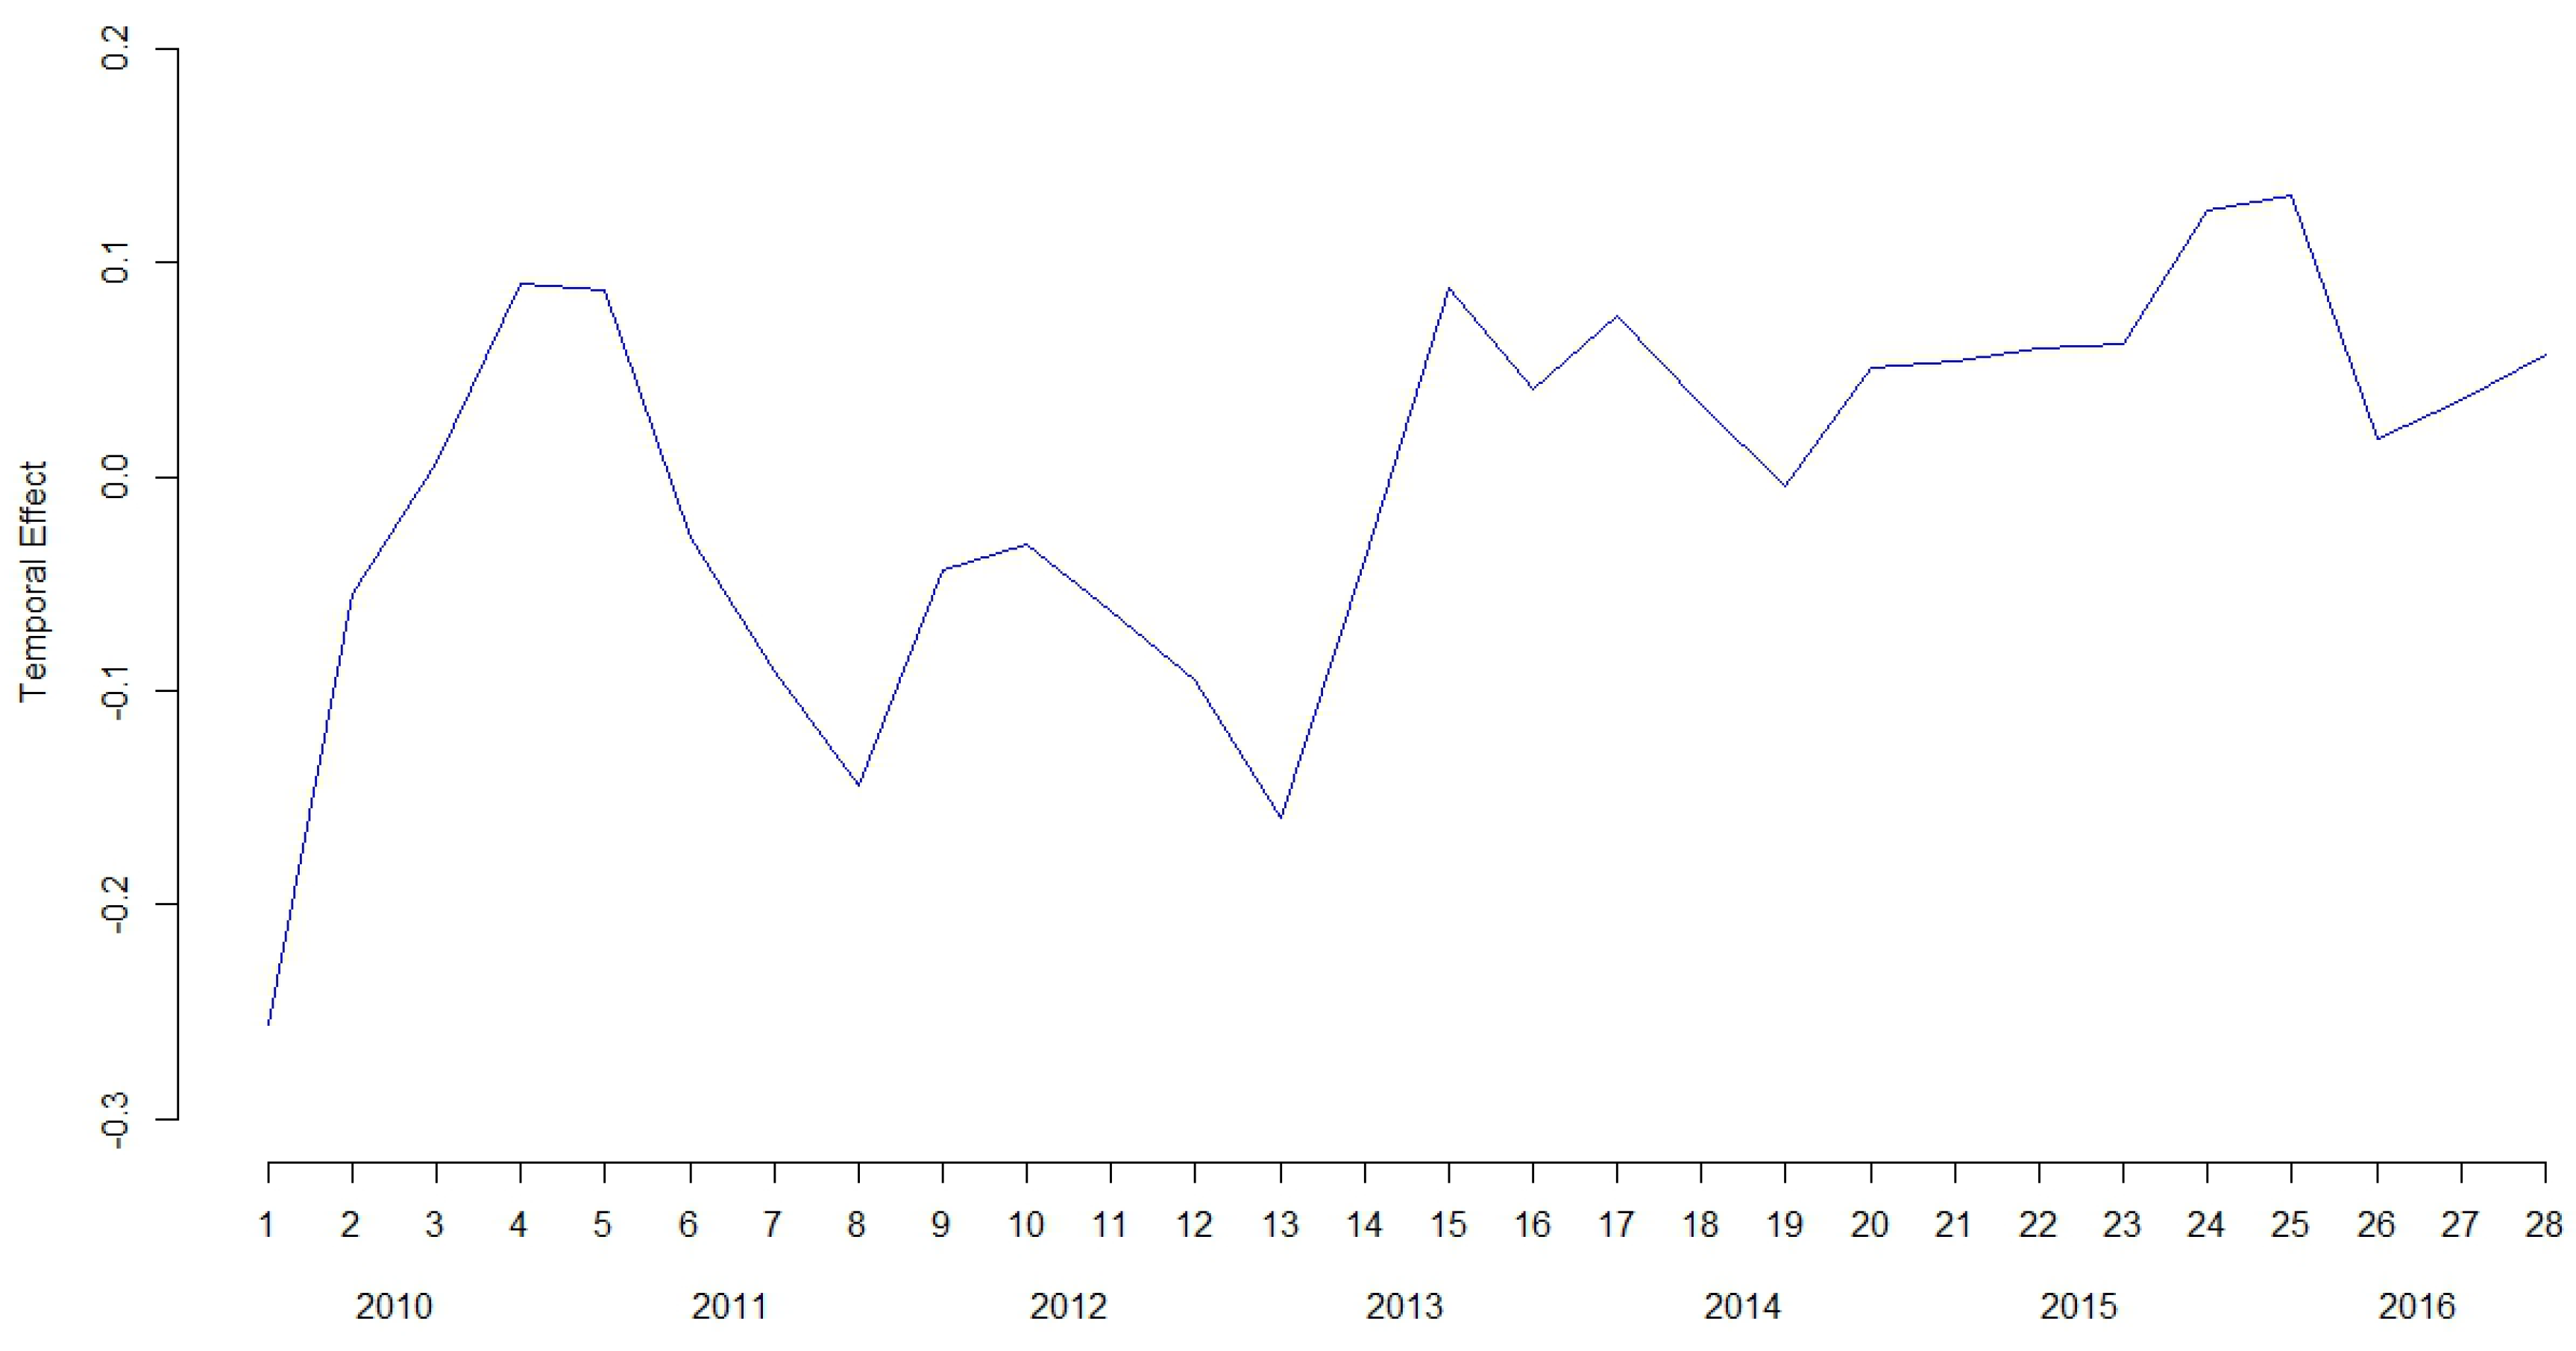
3. Results
4. Discussion
5. Conclusions
Supplementary Materials
Acknowledgments
Author Contributions
Conflicts of Interest
References
- Hawton, K.; van Heerlingen, K. Suicide. Lancet 2009, 373, 1372–1381. [Google Scholar] [CrossRef]
- World Health Organization. Monitoring Health for the Sustainable Development Goals; World Health Organization: Geneva, Switzerland, 2016. [Google Scholar]
- Instituto Nacional de Estadística. INEbase, Defunciones Según la Causa de Muerte 2015. Available online: http://www.ine.es/dynt3/inebase/index.htm?padre=1171 (accessed on 22 June 2017).
- Carcach, C. A spatio-temporal analysis of suicide in El Salvador. BMC Public Health 2017, 17, 339–349. [Google Scholar] [CrossRef] [PubMed]
- Congdon, P. Bayesian models for spatial incidence: A case study of suicide using the BUGS program. Health Place 1997, 3, 229–247. [Google Scholar] [CrossRef]
- Congdon, P. Explaining the spatial pattern of suicide and self-harm rates: A case study of East and South East England. Appl. Spat. Anal. 2009, 4, 23–43. [Google Scholar] [CrossRef]
- Hempstead, K. The geography of self-injury: Spatial patterns in attempted and completed suicide. Soc. Sci. Med. 2006, 62, 3186–3196. [Google Scholar] [CrossRef] [PubMed]
- Hsu, C.; Chang, S.; Lee, E.S.T.; Yip, P.S.F. Geography of suicide in Hong Kong: Spatial patterning, and socioeconomic correlates and inequalities. Soc. Sci. Med. 2015, 130, 193–203. [Google Scholar] [CrossRef] [PubMed]
- Johnson, A.M.; Woodside, J.M.; Johnson, A.; Pollack, J.M. Spatial patterns and neighborhood characteristics of overall suicide clusters in Florida from 2001 to 2010. Am. J. Prev. Med. 2017, 52, e1–e7. [Google Scholar] [CrossRef] [PubMed]
- Joo, Y. Spatiotemporal study of elderly suicide in Korea by age cohort. Public Health 2017, 142, 144–151. [Google Scholar] [CrossRef] [PubMed]
- Lam, V.C.; Kinney, J.B.; Bell, L.S. Geospatial analysis of suicidal bridge jumping in the Metro Vancouver Regional District from 2006 to 2014. J. Forensic Legal Med. 2017, 47, 1–8. [Google Scholar] [CrossRef] [PubMed]
- Santana, P.; Costa, C.; Cardoso, G.; Loureiro, A.; Ferrão, J. Suicide in Portugal: Spatial determinants in a context of economic crisis. Health Place 2015, 35, 85–94. [Google Scholar] [CrossRef] [PubMed]
- Yoon, T.; Noh, M.; Han, J.; Jung-Choi, K.; Khang, Y. Deprivation and suicide mortality across 424 neighborhoods in Seoul, South Korea: A Bayesian spatial analysis. Int. J. Public Health 2015, 60, 969–976. [Google Scholar] [CrossRef] [PubMed]
- Woo, J.; Okusaga, O.; Postolache, T.T. Seasonality of suicidal behavior. Int. J. Environ. Res. Public Health 2012, 9, 531–547. [Google Scholar] [CrossRef] [PubMed]
- Santurtún, M.; Santurtún, A.; Zarrabeitia, M.T. Does the environment affect suicide rates in Spain? A spatiotemporal analysis. Rev. Psiquiatr. Salud Ment. 2017, in press. [Google Scholar]
- Silveira, M.L.; Wexler, L.; Chamberlain, J.; Money, K.; Spencer, R.M.C.; Reich, N.G.; Bertone-Johnson, E.R. Seasonality of suicide behavior in Northwest Alaska: 1990–2009. Public Health 2016, 137, 35–43. [Google Scholar] [CrossRef] [PubMed]
- Christodoulou, C.; Douzenis, A.; Papadopoulos, F.C.; Papadopoulou, A.; Bouras, G.; Gournellis, R.; Lykouras, L. Suicide and seasonality. Acta Psychiatr. Scand. 2011, 125, 127–146. [Google Scholar] [CrossRef] [PubMed]
- Yip, P.S.; Chao, A.; Chiu, C.W. Seasonal variation in suicides: Diminished or vanished. Experience from England and Wales, 1982–1996. Br. J. Psychiatry 2000, 177, 366–369. [Google Scholar] [CrossRef] [PubMed]
- Bernardinelli, L.; Clayton, D.; Pascutto, C.; Montomoli, C.; Ghislandi, M.; Songini, M. Bayesian analysis of space-time variation in disease risk. Stat. Med. 1995, 14, 2433–2443. [Google Scholar] [CrossRef] [PubMed]
- Haining, R.; Law, J.; Griffith, D. Modelling small area counts in the presence of overdispersion and spatial autocorrelation. Comput. Stat. Data Anal. 2009, 53, 2923–2937. [Google Scholar] [CrossRef]
- Waller, L.A.; Gotway, C.A. Applied Spatial Statistics for Public Health Data; John Wiley and Sons: Hoboken, NJ, USA, 2004. [Google Scholar]
- López-Quílez, A.; Muñoz, F. Review of Spatio-Temporal Models for Disease Mapping; Universitat de València: Valencia, Spain, 2009; Available online: http://www.uv.es/~famarmu/doc/Euroheis2-report.pdf (accessed on 22 June 2017).
- Chang, S.; Sterne, J.A.C.; Wheeler, B.W.; Lu, T.; Lin, J.; Gunnell, D. Geography of suicide in Taiwan: Spatial patterning and socioeconomic correlates. Healt Place 2011, 17, 641–650. [Google Scholar] [CrossRef] [PubMed]
- Congdon, P. Monitoring suicide mortality: A Bayesian approach. Eur. J. Popul. 2000, 16, 251–284. [Google Scholar] [CrossRef]
- Congdon, P. Assessing the impact of socioeconomic variables on small area variations in suicide outcomes in England. Int. J. Environ. Res. Public Health 2013, 10, 158–177. [Google Scholar] [CrossRef] [PubMed]
- Macente, L.B.; Zandonade, E. Spatial distribution of suicide incidence rates in municipalities in the state of Espírito Santo (Brazil), 2003–2007: Spatial analysis to identify risk areas. Rev. Bras. Psiquiatr. 2012, 34, 261–269. [Google Scholar] [CrossRef] [PubMed]
- Qi, X.; Hu, W.; Mengersen, K.; Tong, S. Socio-environmental drivers and suicide in Australia: Bayesian spatial analysis. BMC Public Health 2014, 14, 681–690. [Google Scholar] [CrossRef] [PubMed]
- Rostami, M.; Jalilan, A.; Ghasemi, S.; Kamali, A. Suicide mortality risk in Kermanshah province, Iran: A county-level spatial analysis. Epidemiol. Biostat. Public Health 2016, 13, e11829. [Google Scholar]
- Anderson, C.; Ryan, L.M. A Comparison of Spatio-Temporal Disease Mapping Approaches Including an Application to Ischaemic Heart Disease in New South Wales, Australia. Int. J. Environ. Res. Public Health 2017, 14, 146. [Google Scholar] [CrossRef] [PubMed]
- Martínez-Beneito, M.A.; López-Quílez, A.; Botella-Rocamora, P. An autoregressive approach to spatio-temporal disease mapping. Stat. Med. 2008, 27, 2874–2889. [Google Scholar] [CrossRef] [PubMed]
- Klinger, D.A.; Bridges, G.S. Measurement error in calls-for-service as an indicator of crime. Criminology 1997, 35, 705–726. [Google Scholar] [CrossRef]
- Luan, H.; Quick, M.; Law, J. Analyzing local spatio-temporal patterns of police calls-for-service using Bayesian integrated nested Laplace approximation. Int. J. Geo-Inf. 2016, 5, 162–177. [Google Scholar] [CrossRef]
- Warner, B.D.; Pierce, G.L. Reexamining social disorganization theory using calls to the police as a measure of crime. Criminology 1993, 31, 493–517. [Google Scholar] [CrossRef]
- Congdon, P. Suicide and parasuicide in London: A small-area study. Urban Stud. 1996, 1, 137–158. [Google Scholar] [CrossRef]
- Congdon, P. The spatial pattern of suicide in the US in relation to deprivation, fragmentation and rurality. Urban Stud. 2011, 48, 2101–2122. [Google Scholar] [CrossRef] [PubMed]
- Besag, J.; York, J.; Mollie, A. Bayesian image restoration with two applications in spatial statistics. Ann. Inst. Stat. Math. 1991, 43, 1–59. [Google Scholar] [CrossRef]
- Liu, Y.; Lund, R.B.; Nordone, S.K.; Yabsley, M.J.; McMahan, C.S. A Bayesian spatio-temporal model for forecasting the prevalence of antibodies to Ehrlichia species in domestic dogs within the contiguous United States. Parasit Vectors 2017, 10, 138. [Google Scholar] [CrossRef] [PubMed]
- Zurriaga, O.; Martínez-Beneito, M.A.; Botella-Rocamora, P.; López-Quílez, A.; Melchor, I.; Amador, A.; Vanaclocha, H.; Nolasco, A. Spatio-Temporal Atlas of Mortality in Comunitat Valenciana. 2010. Available online: http://www.geeitema.org/AtlasET/index.jsp?idioma=I (accessed on 22 June 2017).
- Gammerman, D.; Lopes, H.F. Monte Carlo Markov Chain: Stochastic Simulation for Bayesian Inference, 2nd ed.; Chapman and Hall: London, UK, 2006. [Google Scholar]
- Lunn, D.; Spiegelhalter, D.; Thomas, A.; Best, N. The BUGS project: Evolution, critique, and future directions. Stat. Med. 2009, 28, 3049–3067. [Google Scholar] [CrossRef] [PubMed]
- Gelman, A.; Carlin, J.B.; Stern, H.S.; Dunson, D.B.; Vehtari, A.; Rubin, D.B. Bayesian Data Analysis, 3rd ed.; Chapman and Hall/CRC: London, UK, 2014. [Google Scholar]
- Spiegelhalter, D.J.; Best, N.G.; Carlin, B.P.; Van der Linde, A. Bayesian measures of model complexity and fit. J. R. Stat. Soc. Ser. B Stat. Methodol. 2002, 64, 583–639. [Google Scholar] [CrossRef]
- Gracia, E.; López-Quílez, A.; Marco, M.; Lladosa, S.; Lila, M. The spatial epidemiology of intímate partner violence: Do neighborhoods matter? Am. J. Epidemiol. 2015, 182, 58–66. [Google Scholar] [CrossRef] [PubMed]
- Law, J.; Quick, M. Exploring links between juvenile offenders and social disorganization at a large map scale: A Bayesian spatial modeling approach. J. Geogr. Syst. 2013, 15, 89–113. [Google Scholar] [CrossRef]
- Law, J.; Quick, M.; Chan, P. Bayesian spatio-temporal modeling for analysing local patterns of crime over time at the small-area level. J. Quant. Criminol. 2014, 30, 57–78. [Google Scholar] [CrossRef]
- Sparks, C.S. Violent crime in San Antonio, Texas: An application of spatial epidemiological methods. Spat. Spatiotemporal Epidemiol. 2011, 2, 301–309. [Google Scholar] [CrossRef] [PubMed]
- Gracia, E.; López-Quílez, A.; Marco, M.; Lladosa, S.; Lila, M. Exploring neighborhood influences on small-area variations in intímate partner violence risk: A Bayesian random-effects modeling approach. Int. J. Environ. Res. Public Health 2014, 11, 866–882. [Google Scholar] [CrossRef] [PubMed]
- Marco, M.; Gracia, E.; López-Quílez, A. Linking neighborhood characteristics and drug-related police interventions: A Bayesian spatial analysis. ISPRS Int. J. Geo-Inf. 2017, 6, 65. [Google Scholar] [CrossRef]
- Bunley, I.H. Socioeconomic and spatial differentials in mortality and means of committing suicide in new South Wales, Australia, 1985–1991. Soc. Sci. Med. 1995, 41, 687–698. [Google Scholar] [CrossRef]
- Hawton, K.; Harriss, L.; Hodder, K.; Simkin, S.; Gunnell, D. The influence of the economic and social environment on deliberate self-harm and suicide: An ecological and person-based study. Psychol. Med. 2001, 31, 827–836. [Google Scholar] [CrossRef] [PubMed]
- Rehkopf, D.H.; Buka, S.L. The association between suicide and the socio-economic characteristics of geographical areas: A systematic review. Psychol. Med. 2006, 36, 145–157. [Google Scholar] [CrossRef] [PubMed]


| Statistic | Global (2010–2016) | 2010 | 2011 | 2012 | 2013 | 2014 | 2015 | 2016 |
|---|---|---|---|---|---|---|---|---|
| Counts of Suicide-Related Emergency Calls | ||||||||
| Total | 6537 | 709 | 824 | 781 | 968 | 1082 | 1126 | 1047 |
| Min. | 0 | 0 | 0 | 0 | 0 | 0 | 0 | 0 |
| Max. | 70 | 11 | 18 | 12 | 14 | 15 | 19 | 15 |
| Mean | 11.84 | 1.24 | 1.46 | 1.37 | 1.72 | 1.91 | 2.02 | 1.85 |
| Standardized Suicide-Related Emergency Calls Ratio | ||||||||
| Min. | 0.00 | 0.00 | 0.00 | 0.00 | 0.00 | 0.00 | 0.00 | 0.00 |
| Max. | 7.38 | 10.46 | 17.72 | 10.95 | 10.90 | 10.50 | 8.85 | 10.62 |
| Parameter | Mean | SD | Quantile 0.025 | Quantile 0.975 |
|---|---|---|---|---|
| −0.126 | 0.032 | −0.191 | −0.070 | |
| 0.355 | 0.093 | 0.181 | 0.534 | |
| 0.478 | 0.028 | 0.424 | 0.532 |
| Parameter | Mean | SD | Quantile 0.025 | Quantile 0.975 |
|---|---|---|---|---|
| −0.269 | 0.032 | −0.334 | −0.208 | |
| 0.272 | 0.058 | 0.159 | 0.384 | |
| 0.512 | 0.025 | 0.462 | 0.564 | |
| 0.034 | 0.029 | 0.002 | 0.105 | |
| 0.692 | 0.024 | 0.644 | 0.739 |
| Parameter | Mean | SD | Quantile 0.025 | Quantile 0.975 |
|---|---|---|---|---|
| −0.362 | 0.045 | −0.450 | −0.275 | |
| −0.122 | 0.057 | −0.230 | −0.008 | |
| 0.093 | 0.059 | −0.024 | 0.208 | |
| 0.118 | 0.053 | 0.016 | 0.227 | |
| 0.160 | 0.030 | 0.102 | 0.220 | |
| 0.359 | 0.019 | 0.323 | 0.398 | |
| 0.106 | 0.032 | 0.051 | 0.178 | |
| 0.903 | 0.009 | 0.885 | 0.919 |
© 2017 by the authors. Licensee MDPI, Basel, Switzerland. This article is an open access article distributed under the terms and conditions of the Creative Commons Attribution (CC BY) license (http://creativecommons.org/licenses/by/4.0/).
Share and Cite
Marco, M.; López-Quílez, A.; Conesa, D.; Gracia, E.; Lila, M. Spatio-Temporal Analysis of Suicide-Related Emergency Calls. Int. J. Environ. Res. Public Health 2017, 14, 735. https://doi.org/10.3390/ijerph14070735
Marco M, López-Quílez A, Conesa D, Gracia E, Lila M. Spatio-Temporal Analysis of Suicide-Related Emergency Calls. International Journal of Environmental Research and Public Health. 2017; 14(7):735. https://doi.org/10.3390/ijerph14070735
Chicago/Turabian StyleMarco, Miriam, Antonio López-Quílez, David Conesa, Enrique Gracia, and Marisol Lila. 2017. "Spatio-Temporal Analysis of Suicide-Related Emergency Calls" International Journal of Environmental Research and Public Health 14, no. 7: 735. https://doi.org/10.3390/ijerph14070735
APA StyleMarco, M., López-Quílez, A., Conesa, D., Gracia, E., & Lila, M. (2017). Spatio-Temporal Analysis of Suicide-Related Emergency Calls. International Journal of Environmental Research and Public Health, 14(7), 735. https://doi.org/10.3390/ijerph14070735