An Evaluation of the Proposed Worker Protection Standard with Respect to Pesticide Exposure and Parkinson’s Disease


Abstract
:1. Introduction
2. Methods
2.1. Deriving Benefits per Worker
2.2. Deriving the Probability Assessment in Terms of Odds Ratio (OR)
2.3. Deriving Total Benefits for All Agricultural Workers
2.4. Using Available Parameters for Solution
2.5. Estimating and Integrating the OR from a Meta-Analysis into the Total Benefits
3. Results and Discussion
3.1. Sensitivity Analysis 1: The Number of Affected Agricultural Workers
3.2. Sensitivity Analysis 2: The Probability of Being Diagnosed with PD
3.3. Sensitivity Analysis 3: The Monetary Value of Avoiding PD
3.4. Sensitivity Analysis 4: PD Onset Occurs Immediately
3.5. Discussion
4. Conclusions
Supplementary Materials
Supplementary File 1Author Contributions
Conflicts of Interest
Appendix A
References
- United States Environmental Protection Agency. EPA Updates Standards to Increase Safety and Protect the Health of America’s Farmworkers/Revised Standards Give Farmworkers Health Protections under the Law Similar to Those Already Afforded to Workers in Other Industries. Available online: https://yosemite.epa.gov/opa/admpress.nsf/bd4379a92ceceeac8525735900400c27/b18112371b9d3f8985257ece0057f07a!OpenDocument (accessed on 12 July 2016).
- United States Environmental Protection Agency, Office of Pesticide Programs. Revisions to the Worker Protection Standard. Available online: https://www.epa.gov/pesticide-worker-safety/revisions-worker-protection-standard (accessed on 12 July 2016).
- United States Environmental Protection Agency; Office of Pesticide Programs; Biological and Economic Analysis Division. Economic Analysis of the Agricultural Worker Protection Standard Revisions, RIN 2070-AJ22, Docket: EPA-HQ-OPP-2011-0184; United States Environmental Protection Agency: Washington, DC, USA, 2015.
- Brown, T.P.; Rumsby, P.C.; Capleton, A.C.; Rushton, L.; Levy, L.S. Pesticides and Parkinson’s disease—Is there a link? Environ. Health Perspect. 2006, 114, 156–164. [Google Scholar] [CrossRef] [PubMed]
- Richardson, J.R.; Shalat, S.L.; Buckley, B.; Winnik, B.; O’Suilleabhain, P.; Diaz-Arrastia, R.; Reisch, J.; German, D.C. Elevated serum pesticide levels and risk of Parkinson disease. Arch. Neurol. 2009, 66, 870–875. [Google Scholar] [CrossRef] [PubMed]
- Van der Mark, M.; Brouwer, M.; Kromhout, H.; Nijssen, P.; Huss, A.; Vermeulen, R. Is pesticide use related to Parkinson disease? Some clues to heterogeneity in study results. Environ. Health Perspect. 2012, 120, 340–347. [Google Scholar] [CrossRef] [PubMed]
- Moretto, A.; Colosio, C. The role of pesticide exposure in the genesis of Parkinson’s disease: Epidemiological studies and experimental data. Toxicology 2013, 307, 24–34. [Google Scholar] [CrossRef] [PubMed]
- United States Census Bureau. Population Clock. Available online: http://www.census.gov/popclock/ (accessed on 14 July 2016).
- Dams, J.; Bornschein, B.; Reese, J.P.; Conrads-Frank, A.; Oertel, W.H.; Siebert, U.; Dodel, R. Modelling the Cost Effectiveness of Treatments for Parkinson’s Disease: A Methodological Review. PharmacoEconomics 2011, 29, 1025–1049. [Google Scholar] [CrossRef] [PubMed]
- Dowding, C.H.; Shenton, C.L.; Salek, S.S. A review of the health-related quality of life and economic impact of Parkinson’s disease. Drugs Aging 2006, 23, 693–721. [Google Scholar] [CrossRef] [PubMed]
- Groenendaal, H.; Tarrants, M.L.; Armand, C. Treatment of advanced Parkinson’s disease in the United States: A cost-utility model. Clin. Drug Investig. 2010, 30, 789–798. [Google Scholar] [CrossRef] [PubMed]
- Tomaszewski, K.J.; Holloway, R.G. Deep brain stimulation in the treatment of Parkinson’s disease: A cost-effectiveness analysis. Neurology 2001, 57, 663–671. [Google Scholar] [CrossRef] [PubMed]
- Vossius, C.; Nilsen, O.B.; Larsen, J.P. Health state values during the first year of drug treatment in early-stage Parkinson’s disease. Drugs Aging 2009, 26, 973–980. [Google Scholar] [CrossRef] [PubMed]
- Chandra, A.; Jena, A.B.; Skinner, J.S. The pragmatist’s guide to comparative effectiveness research. J. Econ. Perspect. 2011, 25, 27–46. [Google Scholar] [CrossRef] [PubMed]
- O’Brien, J.A.; Ward, A.; Michels, S.L.; Tzivelekis, S.; Brandt, N.J. Economic burden associated with Parkinson disease in the United States. Drug Benefit Trends 2014, 21, 179. [Google Scholar]
- Whetten-Goldstein, K.; Sloan, F.; Kulas, E.; Cutson, T.; Schenkman, M. The burden of Parkinson’s disease on society, family, and the individual. J. Am. Geriatr. Soc. 1997, 45, 844–849. [Google Scholar] [CrossRef] [PubMed]
- Huse, D.M.; Schulman, K.; Orsini, L.; Castelli-Haley, J.; Kennedy, S.; Lenhart, G. Burden of illness in Parkinson’s disease. Mov. Disord. 2005, 20, 1449–1454. [Google Scholar] [CrossRef] [PubMed]
- McCrone, P.; Allcock, L.M.; Burn, D.J. Predicting the cost of Parkinson’s disease. Mov. Disord. 2007, 22, 804–812. [Google Scholar] [CrossRef] [PubMed]
- United States Department of Agriculture Economic Research Service. Farm Labor; Background. Available online: http://www.ers.usda.gov/topics/farm-economy/farm-labor/background.aspx (accessed on 4 January 2015).
- The Michael J. Fox Foundation for Parkinson’s Research. Parkinson’s Disease Causes. Available online: https://www.michaeljfox.org/understanding-parkinsons/living-with-pd/topic.php?causes (accessed on 14 July 2016).
- Jiménez-Jiménez, F.J.; Mateo, D.; Giménez-Roldán, S. Exposure to well water and pesticides in Parkinson’s disease: A case-control study in the Madrid area. Mov. Disord. 1992, 7, 149–152. [Google Scholar] [CrossRef] [PubMed]
- Semchuk, K.M.; Love, E.J.; Lee, R.G. Parkinson’s disease and exposure to agricultural work and pesticide chemicals. Neurology 1992, 42, 1328–1335. [Google Scholar] [CrossRef] [PubMed]
- Nuti, A.; Ceravolo, R.; Dell’Agnello, G.; Gambaccini, G.; Bellini, G.; Kiferle, L.; Rossi, C.; Logi, C.; Bonuccelli, U. Environmental factors and Parkinson’s disease: A case-control study in the Tuscany region of Italy. Parkinsonism Relat. Disord. 2004, 10, 481–485. [Google Scholar] [CrossRef] [PubMed]
- Frigerio, R.; Sanft, K.R.; Grossardt, B.R.; Peterson, B.J.; Elbaz, A.; Bower, J.H.; Ahlskog, J.E.; de Andrade, M.; Maraganore, D.M.; Rocca, W.A. Chemical exposures and Parkinson’s disease: A population-based case-control study. Mov. Disord. 2006, 21, 1688–1692. [Google Scholar] [CrossRef] [PubMed]
- Brighina, L.; Frigerio, R.; Rocca, W.A.; Maraganore, D.M.; Schneider, N.K.; Lesnick, T.G.; De Andrade, M.; Cunningham, J.M.; Farrer, M.J.; Lincoln, S.J.; et al. α-Synuclein, pesticides, and Parkinson disease: A case-control study. Neurology 2008, 70, 1461–1469. [Google Scholar] [CrossRef] [PubMed]
- Hancock, D.B.; Martin, E.R.; Mayhew, G.M.; Stajich, J.M.; Jewett, R.; Stacy, M.A.; Scott, B.L.; Vance, J.M.; Scott, W.K. Pesticide exposure and risk of Parkinson’s disease: A family-based case-control study. BMC Neurol. 2008, 8. [Google Scholar] [CrossRef] [PubMed]
- Elbaz, A.; Clavel, J.; Rathouz, P.J.; Moisan, F.; Galanaud, J.-P.; Delemotte, B.; Alpérovitch, A.; Tzourio, C. Professional exposure to pesticides and Parkinson disease. Ann. Neurol. 2009, 66, 494–504. [Google Scholar] [CrossRef] [PubMed]
- Xu, J.; Murphy, S.L.; Kochanek, K.D.; Bastian, B.A. Deaths: Final Data for 2013; National Vital Statistics Reports; National Center for Health Statistics: Hyattsville, MD, USA, 2016; Volume 64, Number 2.
- The Michael J. Fox Foundation for Parkinson’s Research. Parkinson’s Disease Prognosis. Available online: https://www.michaeljfox.org/understanding-parkinsons/living-with-pd/topic.php?prognosis&navid=prognosis (accessed on 14 July 2016).
- D’Amelio, M.; Ragonese, P.; Morgante, L.; Reggio, A.; Callari, G.; Salemi, G.; Savettieri, G. Long-term survival of Parkinson’s disease: A population-based study. J. Neurol. 2006, 253, 33–37. [Google Scholar] [CrossRef] [PubMed]
- The Michael J. Fox Foundation for Parkinson’s Disease Research. Parkinson’s Diagnosis Questions. Available online: https://www.michaeljfox.org/understanding-parkinsons/living-with-pd/topic.php?causes (accessed on 24 May 2014).
- Priyadarshi, A.; Khuder, S.A.; Schaub, E.A.; Shrivastava, S. A meta-analysis of Parkinson’s disease and exposure to pesticides. Neurotoxicology 2000, 21, 435–440. [Google Scholar] [PubMed]
- Priyadarshi, A.; Khuder, S.A.; Schaub, E.A.; Priyadarshi, S.S. Environmental risk factors and Parkinson’s disease: A metaanalysis. Environ. Res. 2001, 86, 122–127. [Google Scholar] [CrossRef] [PubMed]
- Van Maele-Fabry, G.; Hoet, P.; Vilain, F.; Lison, D. Occupational exposure to pesticides and Parkinson’s disease: A systematic review and meta-analysis of cohort studies. Environ. Int. 2012, 46, 30–43. [Google Scholar] [CrossRef] [PubMed]
- Allen, M.T.; Levy, L.S. Parkinson’s disease and pesticide exposure—A new assessment. Crit. Rev. Toxicol. 2013, 43, 515–534. [Google Scholar] [CrossRef] [PubMed]
- Pezzoli, G.; Cereda, E. Exposure to pesticides or solvents and risk of Parkinson disease. Neurology 2013, 80, 2035–2041. [Google Scholar] [CrossRef] [PubMed]
- Baldereschi, M.; Di Carlo, A.; Vanni, P.; Ghetti, A.; Carbonin, P.; Amaducci, L.; Inzitari, D. Lifestyle-related risk factors for Parkinson’s disease: A population-based study. Acta Neurol. Scand. 2003, 108, 239–244. [Google Scholar] [CrossRef] [PubMed]
- Baldi, I.; Cantagrel, A.; Lebailly, P.; Tison, F.; Dubroca, B.; Chrysostomec, V.; Dartigues, F.; Brochard, P. Association between Parkinson’s disease and exposure to pesticides in Southwestern France. Neuroepidemiology 2003, 22, 305–310. [Google Scholar] [CrossRef] [PubMed]
- Chan, D.K.Y.; Woo, J.; Ho, S.C.; Pang, C.P.; Law, L.K.; Ng, P.W.; Hung, W.T.; Kwok, T.; Hui, E.; Orr, K.; et al. Genetic and environmental risk factors for Parkinson’s disease in a Chinese population. J. Neurol. Neurosurg. Psychiatry 1998, 65, 781–784. [Google Scholar] [CrossRef] [PubMed]
- Costello, S.; Cockburn, M.; Bronstein, J.; Zhang, X.; Ritz, B. Parkinson’s disease and residential exposure to maneb and paraquat from agricultural applications in the Central Valley of California. Am. J. Epidemiol. 2009, 169, 919–926. [Google Scholar] [CrossRef] [PubMed]
- Gorell, J.M.; Johnson, C.C.; Rybicki, B.A.; Peterson, E.L.; Richardson, R.J. The risk of Parkinson’s disease with exposure to pesticides, farming, well water, and rural living. Neurology 1998, 50, 1346–1350. [Google Scholar] [CrossRef] [PubMed]
- Ritz, B.R.; Manthripragada, A.D.; Costello, S.; Lincoln, S.J.; Farrer, M.J.; Cockburn, M.; Bronstein, J. Dopamine transporter genetic variants and pesticides in Parkinson’s disease. Environ. Health Perspect. 2009, 117, 964–969. [Google Scholar] [CrossRef] [PubMed]
- Rugbjerg, K.; Harris, M.A.; Shen, H.; Marion, S.A.; Tsui, J.K.C.; Teschke, K. Pesticide exposure and risk of Parkinson’s disease—A population-based case-control study evaluating the potential for recall bias. Scand. J. Work Environ. Health 2011, 37, 427–436. [Google Scholar] [CrossRef] [PubMed]
- Steenland, K.; Wesseling, C.; Roman, N.; Quiros, I.; Juncos, J.L. Occupational pesticide exposure and screening tests for neurodegenerative disease among an elderly population in Costa Rica. Environ. Res. 2013, 120, 96–101. [Google Scholar] [CrossRef] [PubMed]
- Tanner, C.M.; Kamel, F.; Ross, G.W.; Hoppin, J.A.; Goldman, S.M.; Korell, M.; Marras, C.; Bhudhikanok, G.S.; Kasten, M.; Chade, A.R.; et al. Rotenone, paraquat, and Parkinson’s disease. Environ. Health Perspect. 2011, 119, 866–872. [Google Scholar] [CrossRef] [PubMed]
- Wang, A.; Costello, S.; Cockburn, M.; Zhang, X.; Bronstein, J.; Ritz, B. Parkinson’s disease risk from ambient exposure to pesticides. Eur. J. Epidemiol. 2011, 26, 547–555. [Google Scholar] [CrossRef] [PubMed]
- Dhillon, A.S.; Tarbutton, G.L.; Levin, J.L.; Plotkin, G.M.; Lowry, L.K.; Nalbone, J.T.; Shepherd, S. Pesticide/environmental exposures and Parkinson’s disease in East Texas. J. Agromed. 2008, 13, 37–48. [Google Scholar] [CrossRef] [PubMed]
- Dick, F.D.; Palma, G.D.; Ahmadi, A.; Scott, N.W.; Prescott, G.J.; Bennett, J.; Semple, S.; Dick, S.; Counsell, C.; Mozzoni, P.; et al. Environmental risk factors for Parkinson’s disease and Parkinsonism: The Geoparkinson Study. Occup. Environ. Med. 2007, 64, 666–672. [Google Scholar] [CrossRef] [PubMed]
- Firestone, J.A.; Smith-Weller, T.; Franklin, G.; Swanson, P.; Longstreth, W.T., Jr.; Checkoway, H. Pesticides and risk of Parkinson disease: A population-based case-control study. Arch. Neurol. 2005, 62, 91–95. [Google Scholar] [CrossRef] [PubMed]
- Fong, C.-S.; Wu, R.-M.; Shieh, J.-C.; Chao, Y.-T.; Fu, Y.-P.; Kuao, C.-L.; Cheng, C.-W. Pesticide exposure on southwestern Taiwanese with MnSOD and NQO1 polymorphisms is associated with increased risk of Parkinson’s disease. CCA Clin. Chim. Acta 2007, 378, 136–141. [Google Scholar] [CrossRef] [PubMed]
- Gatto, N.M.; Cockburn, M.; Bronstein, J.; Manthripragada, A.D.; Ritz, B. Well-water consumption and Parkinson’s disease in rural California. Environ. Health Perspect. 2009, 117, 1912–1918. [Google Scholar] [CrossRef] [PubMed]
- Hristina, V.D.; Sipetic, S.B.; Maksimovic, J.M.; Marinkovic, J.M.; Dzoljic, E.D.; Ratkov, I.S.; Kostic, V.S. Environmental factors and Parkinson’s disease: A case-control study in Belgrade, Serbia. Int. J. Neurosci. 2010, 120, 361–367. [Google Scholar] [CrossRef] [PubMed]
- Seidler, A.; Hellenbrand, W.; Robra, B.P.; Vieregge, P.; Nischan, P.; Joerg, J.; Oertel, W.H.; Ulm, G.; Schneider, E. Possible environmental, occupational, and other etiologic factors for Parkinson’s disease: A case-control study in Germany. Neurology 1996, 46, 1275–1284. [Google Scholar] [CrossRef] [PubMed]
- Cochran, W.G. The Combination of Estimates from Different Experiments. Biometrics 1954, 10, 101–129. [Google Scholar] [CrossRef]
- Higgins, J.P.T.; Thompson, S.G. Quantifying heterogeneity in a meta-analysis. Stat. Med. 2002, 21, 1539–1558. [Google Scholar] [CrossRef] [PubMed]

| Parameter | Value | Source | |
|---|---|---|---|
| 1. | QALYH | 0.810 | Vossius et al. [13] |
| 2. | QALYSPD | 0.667 | |
| 3. | V | $100,000 | Chandra et al. [14] |
| 4. | $12,491 + $9135 | O’Brien et al. [15] | |
| 5. | r | 3% | EPA ([3], Line 1220) |
| 6. | time = PD onset | t = 25 | Michael J. Fox Foundation for Parkinson’s Disease Research [20] and sources [21,22,23,24,25,26,27] |
| 7. | time = death | t = 45 | National Vital Statistics Reports (Table 7 in [28]) |
| 8. | EPA (Table 4.5-3 in [3]) | ||
| 9. | # Workers | 2 million | EPA ([3], Lines 68–71) |
| 10. | PSPD | 0.01 | Michael J. Fox Foundation [31] |
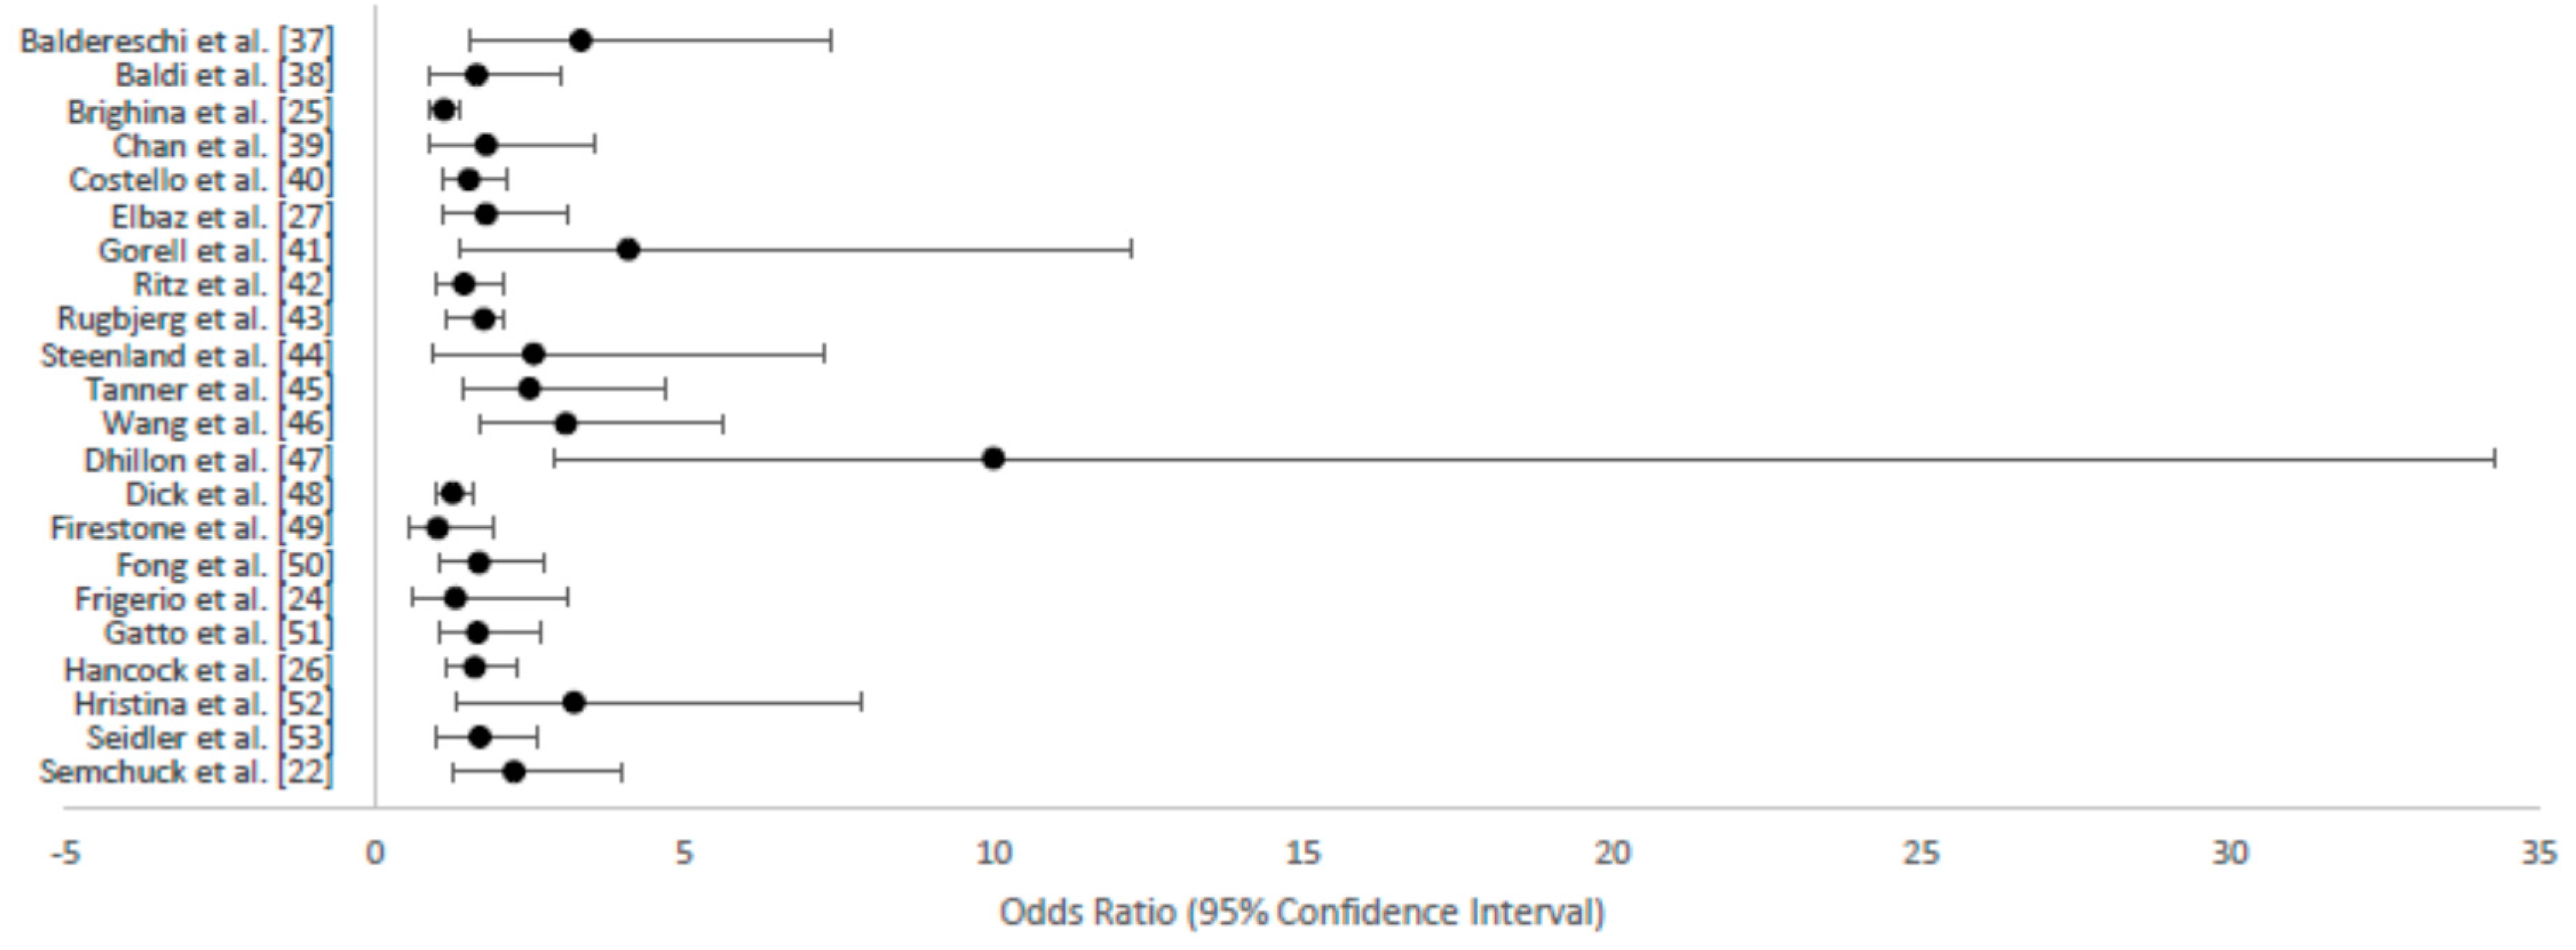
| Reference | Country | Cases (Exposed/Total) | Controls (Exposed/Total) | Odds Ratio | 95% CI |
|---|---|---|---|---|---|
| Studies that had samples of predominantly agricultural practices | |||||
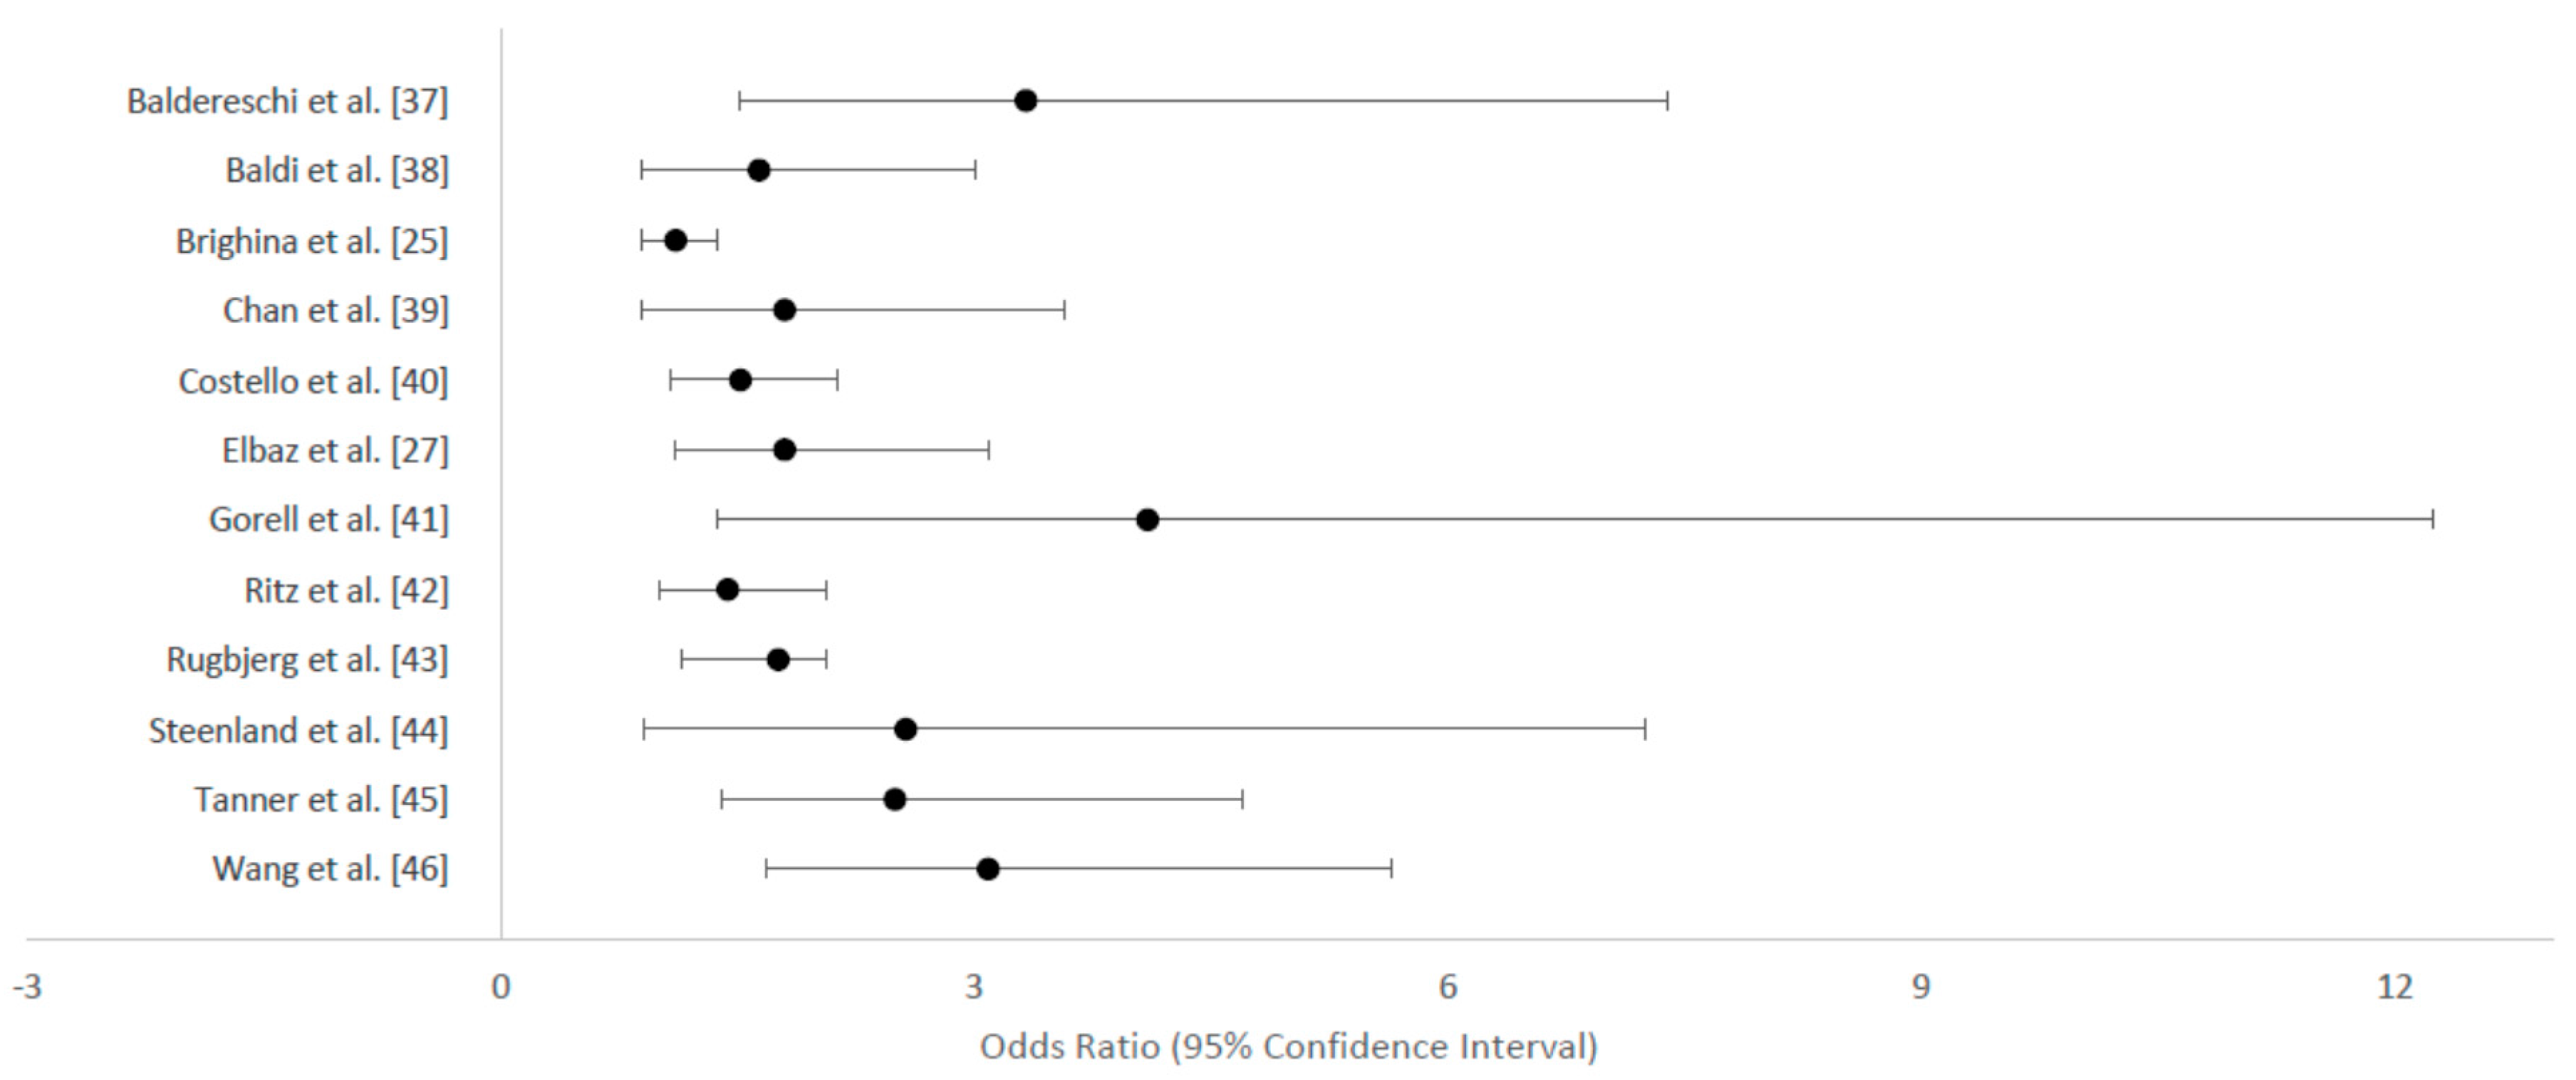
| Baldereschi et al. [37] | Italy | 7/113 | 82/4383 | 3.33 | 1.51–7.39 |
| Baldi et al. [38] | France | 19/84 | 38/252 | 1.64 | 0.89–3.01 |
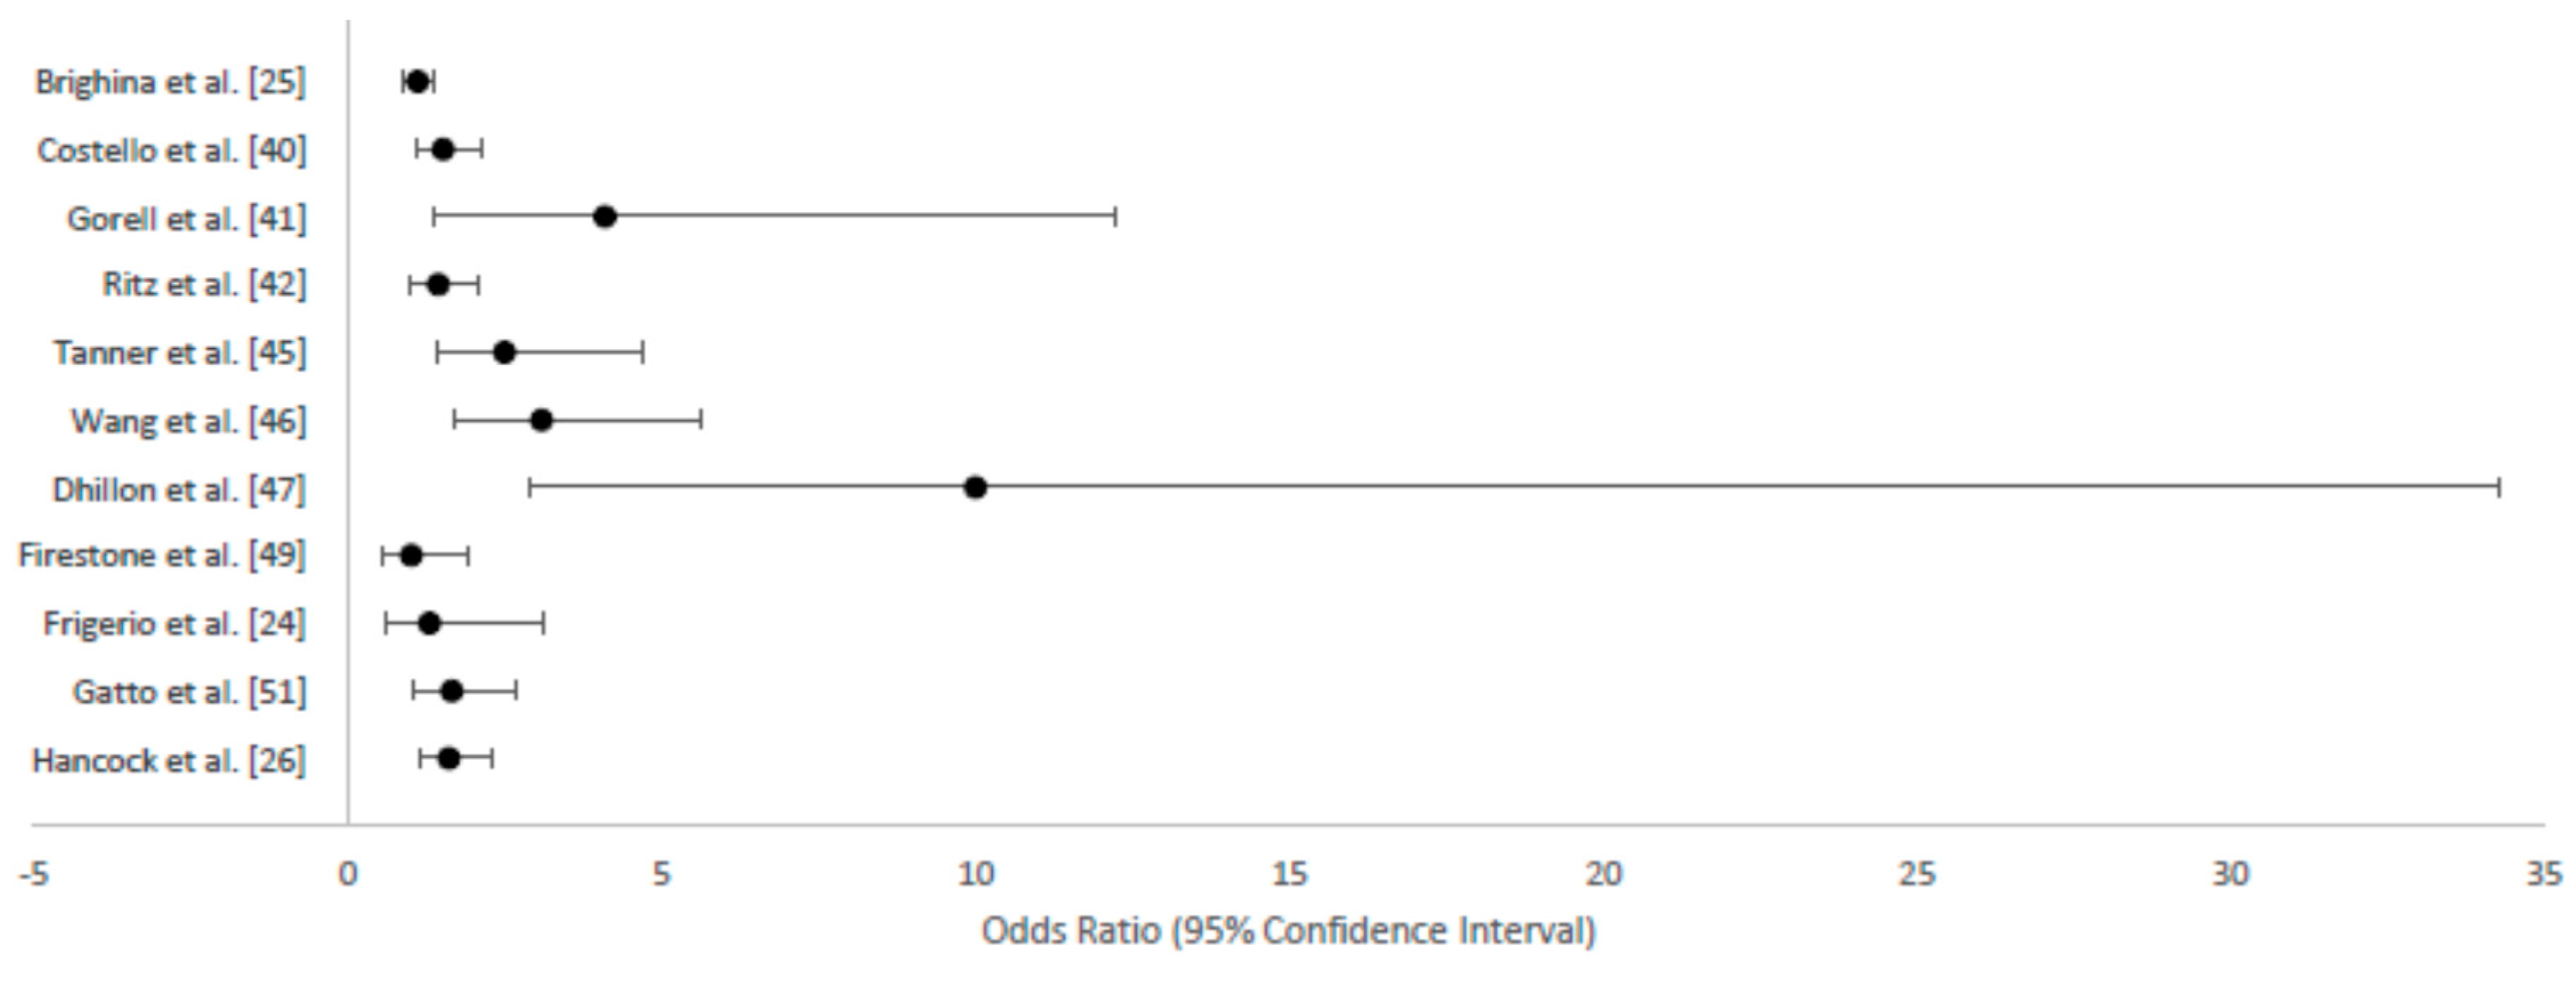
| Brighina et al. [25] | USA | 303/833 | 278/833 | 1.11 | 0.89–1.38 |
| Chan et al. [39] | Hong Kong | 19/215 | 16/313 | 1.80 | 0.90–3.58 |
| Costello et al. [40] | USA | 110/368 | 75/341 | 1.52 | 1.08–2.14 |
| Elbaz et al. [27] | France | 40/225 | 48/107 | 1.80 | 1.10–3.10 |
| Gorell et al. [41] | USA | NA/144 | NA/464 | 4.10 | 1.37–12.24 |
| Ritz et al. [42] | USA | 93/324 | 74/334 | 1.44 | 1.01–2.06 |
| Rugbjerg et al. [43] | Canada | 74/403 | 47/405 | 1.76 | 1.15–2.07 |
| Steenland et al. [44] | Costa Rica | NA | NA | 2.57 | 0.91–7.26 |
| Tanner et al. [45] | USA | 23/110 | 49/358 | 2.50 | 1.40–4.70 |
| Wang et al. [46] | USA | 46/362 | 18/341 | 3.09 | 1.69–5.64 |
| Other studies that met our inclusion criteria | |||||
| Dhillon et al. [47] | USA | 27/100 | 3.0/84 | 10.00 | 2.90–34.3 |
| Dick et al. [48] | Scotland, Sweden, Italy, Malta, Romania | NA/767 | NA/1989 | 1.25 | 0.97–1.61 |
| Firestone et al. [49] | USA | 19/156 | 28/241 | 1.01 | 0.53–1.92 |
| Fong et al. [50] | Taiwan | 85/153 | 66/155 | 1.68 | 1.03–2.76 |
| Frigerio et al. [24] | USA | 15/149 | 10/129 | 1.30 | 0.60–3.10 |
| Gatto et al. [51] | USA | 270/368 | 273/341 | 1.66 | 1.04–2.66 |
| Hancock et al. [26] | USA | 200/319 | 147/296 | 1.61 | 1.13–2.29 |
| Hristina et al. [52] | Serbia | 27/110 | 19/220 | 3.22 | 1.32–7.87 |
| Seidler et al. [53] | Germany | 59/380 | 44/379 | 1.70 | 1.00–2.60 |
| Semchuck et al. [22] | Canada | 32/130 | 30/260 | 2.25 | 1.27–3.99 |
| HeadlineMeta-Analysis | Cochran Q | I2 | Lower | Mean | Upper | |
|---|---|---|---|---|---|---|
| N | Statistic p-Value | Statistic | 95% CI | RE OR | 95% CI | |
| All included studies | 22 | p < 0.01 | 51.4% | 1.51 | 1.74 | 2.00 |
| Subsample of U.S. studies | 11 | p < 0.01 | 66.3% | 1.35 | 1.73 | 2.21 |
| Subsample of studies of agricultural practices | 12 | p < 0.01 | 56.4% | 1.47 | 1.81 | 2.22 |
| Priyardshi et al. [32] | 19 | p < 0.01 | n.r. | 1.49 | 1.94 | 2.53 |
| Priyardshi et al. [33] | 14 | p = 0.01 | n.r. | 1.31 | 1.85 | 2.60 |
| Van Maele-Fabry et al. [34] | 12 | p < 0.01 | 74.0% | 1.03 | 1.28 | 1.59 |
| Allen and Levy [35] | 20 | p = 0.03 | 40.0% | 1.40 | 1.66 | 1.96 |
| Pezzoli and Cereda [36] | 51 | p = 0.005 | 67.3% | 1.56 | 1.76 | 2.04 |
| Panel A: Sensitivity Analysis 1 | ||||
| Number of Agricultural Workers: | ||||
| 1,000,000 | 2,000,000 | 4,000,000 | ||
| Minimum OR | 1.03 | 1,200,000 | 2,400,000 | 4,800,000 |
| Agricultural Practices OR | 1.81 | 2,100,000 | 4,200,000 | 8,300,000 |
| Maximum OR | 2.60 | 3,000,000 | 5,900,000 | 11,900,000 |
| Panel B: Sensitivity Analysis 2 | ||||
| Probability of Suffering PD: | ||||
| 0.005 | 0.010 | 0.020 | ||
| Minimum OR | 1.03 | 1,200,000 | 2,400,000 | 4,800,000 |
| Agricultural Practices OR | 1.81 | 2,100,000 | 4,200,000 | 8,300,000 |
| Maximum OR | 2.60 | 3,000,000 | 5,900,000 | 11,700,000 |
| Panel C: Sensitivity Analysis 3 | ||||
| Value of the benefit per person: | ||||
| 35,925 | 1,000,000 | 3,700,000 | ||
| Minimum OR | 1.03 | 2,400,000 | 8,800,000 | 32,500,000 |
| Agricultural Practices OR | 1.81 | 4,200,000 | 15,300,000 | 56,600,000 |
| Maximum OR | 2.60 | 5,900,000 | 21,800,000 | 80,800,000 |
| Panel D: Sensitivity Analysis 4 | ||||
| Assume PD onset immediately instead of in 25 years Probability of Suffering PD : | ||||
| 0.005 | 0.010 | 0.020 | ||
| Minimum OR | 1.03 | 2,500,000 | 5,000,000 | 10,000,000 |
| Agricultural Practices OR | 1.81 | 4,400,000 | 8,700,000 | 17,300,000 |
| Maximum OR | 2.60 | 6,300,000 | 12,500,000 | 24,500,000 |
© 2017 by the authors. Licensee MDPI, Basel, Switzerland. This article is an open access article distributed under the terms and conditions of the Creative Commons Attribution (CC BY) license (http://creativecommons.org/licenses/by/4.0/).
Share and Cite
Sparling, A.S.; Martin, D.W.; Posey, L.B. An Evaluation of the Proposed Worker Protection Standard with Respect to Pesticide Exposure and Parkinson’s Disease. Int. J. Environ. Res. Public Health 2017, 14, 640. https://doi.org/10.3390/ijerph14060640
Sparling AS, Martin DW, Posey LB. An Evaluation of the Proposed Worker Protection Standard with Respect to Pesticide Exposure and Parkinson’s Disease. International Journal of Environmental Research and Public Health. 2017; 14(6):640. https://doi.org/10.3390/ijerph14060640
Chicago/Turabian StyleSparling, Alica Stubnova, David W. Martin, and Lillian B. Posey. 2017. "An Evaluation of the Proposed Worker Protection Standard with Respect to Pesticide Exposure and Parkinson’s Disease" International Journal of Environmental Research and Public Health 14, no. 6: 640. https://doi.org/10.3390/ijerph14060640
APA StyleSparling, A. S., Martin, D. W., & Posey, L. B. (2017). An Evaluation of the Proposed Worker Protection Standard with Respect to Pesticide Exposure and Parkinson’s Disease. International Journal of Environmental Research and Public Health, 14(6), 640. https://doi.org/10.3390/ijerph14060640