
FADS Gene Polymorphisms, Fatty Acid Desaturase Activities, and HDL-C in Type 2 Diabetes

 ,
,
Abstract
:1. Introduction
2. Subjects and Methods
2.1. Study Subjects and Inclusion Criteria
2.2. Clinical Data Collection and Measurements
2.3. Gas Chromatography Analysis of Plasma Lipids
2.4. Measurements of Desaturase and Pathway Activities
2.5. SNP Selection and Genotyping
2.6. Statistical Analysis
3. Result
3.1. General Characteristics of Type 2 Diabetes Patients
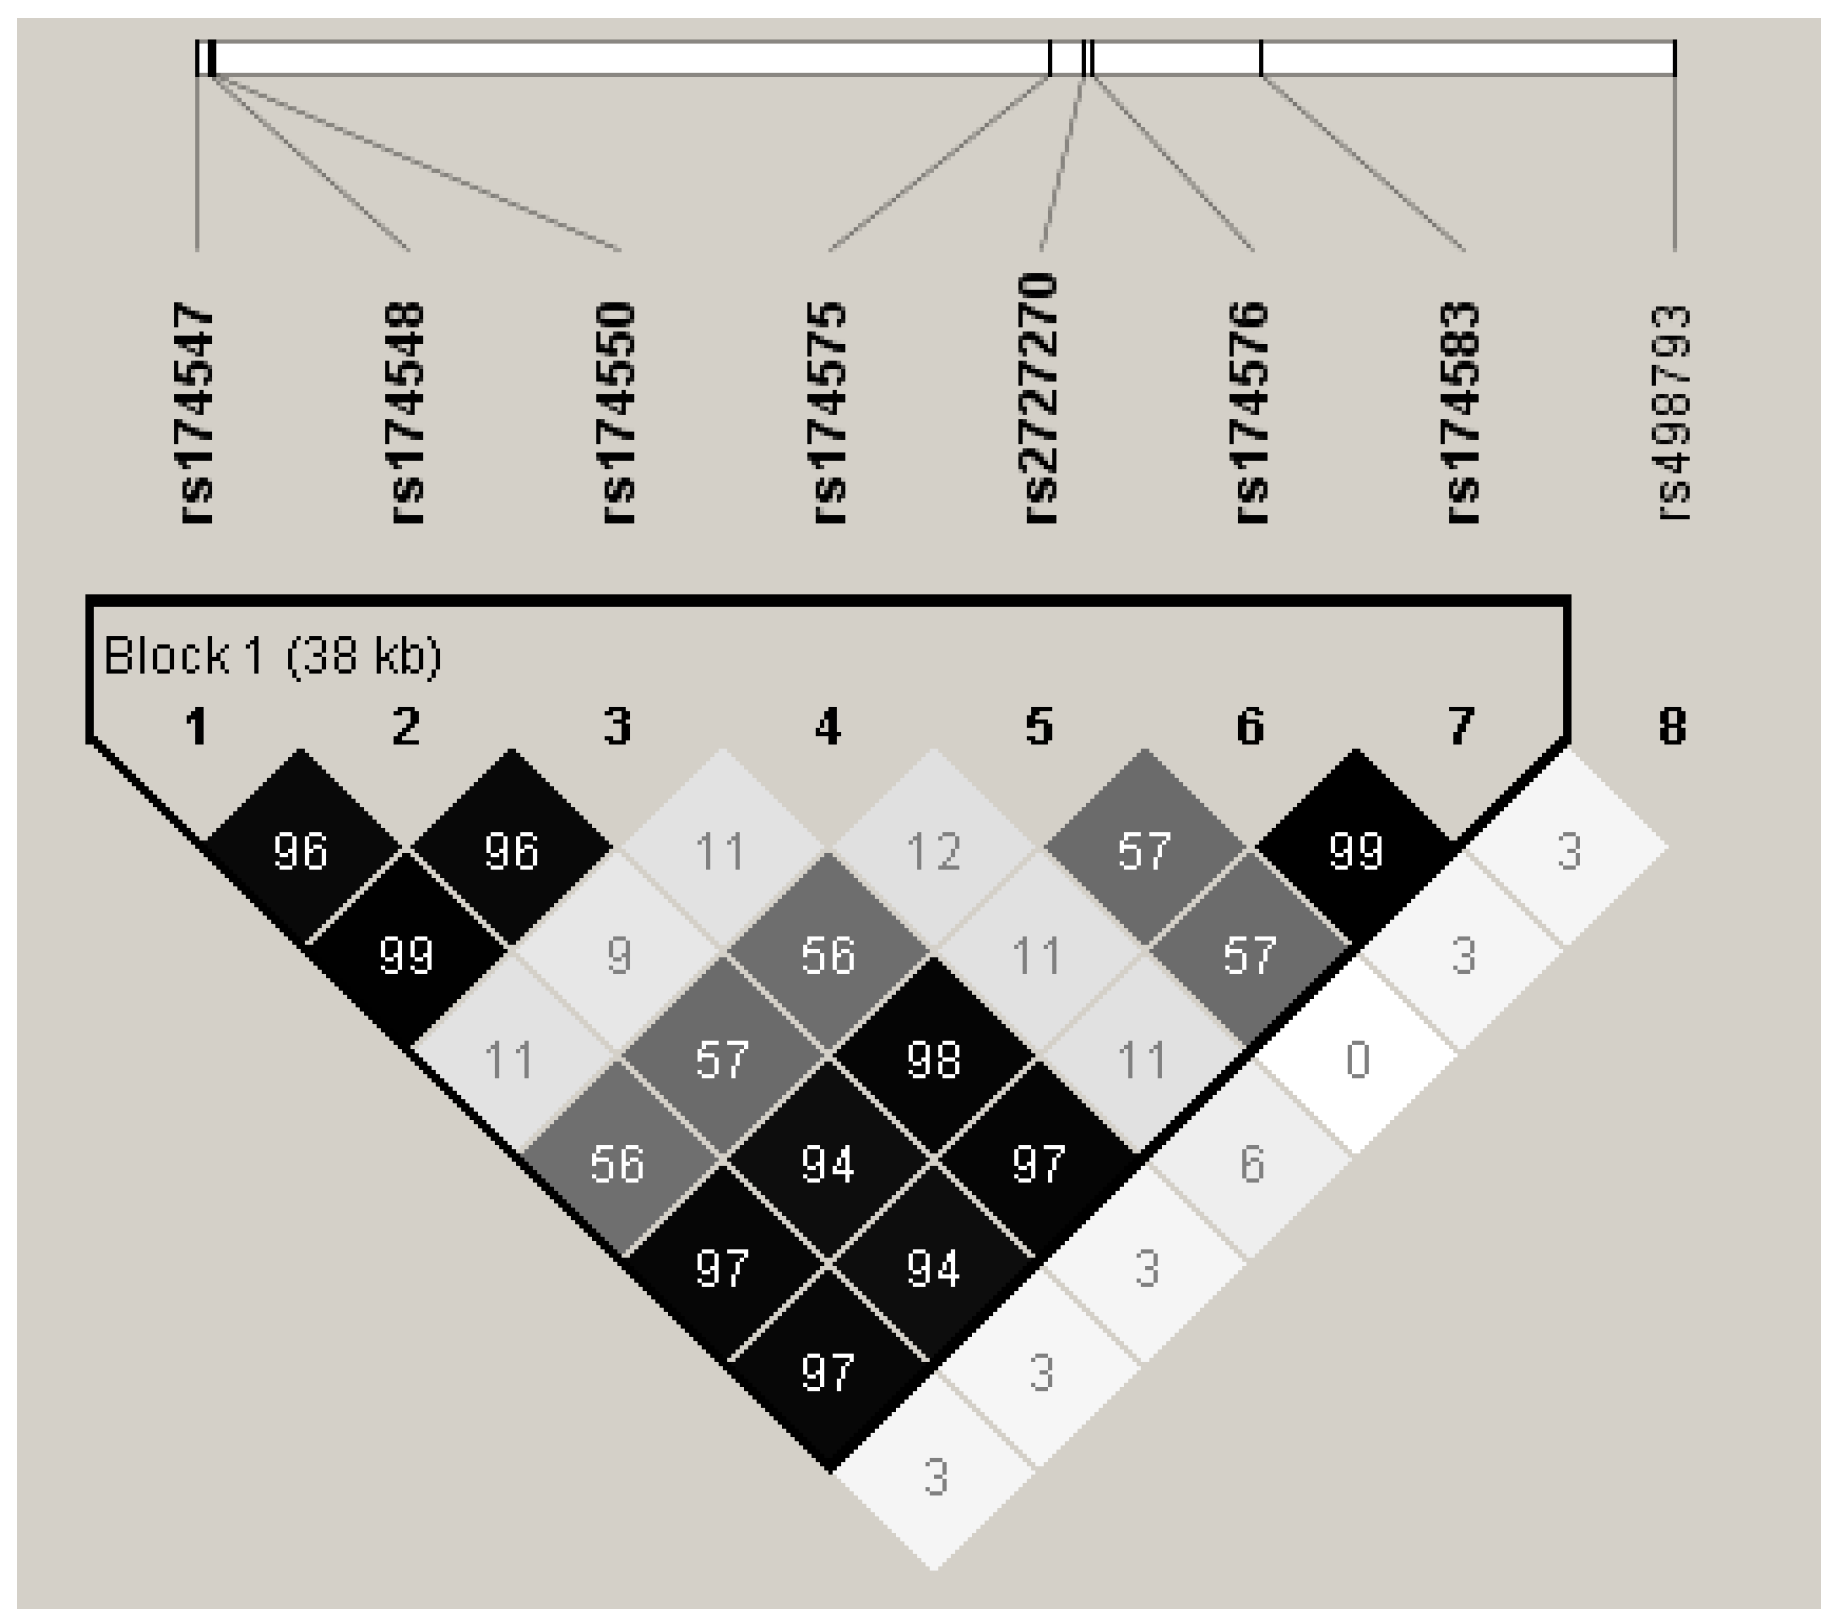
3.2. Genotype and Allele Distribution of FADS1 and FADS2 Polymorphisms among All Type 2 Diabetes Patients
3.3. FADS1 and FADS2 Genotypes and D5D and D6D Activities in Type 2 Diabetes Patients
3.4. FADS1 and FADS2 Genotypes and Lipid Traits in Type 2 Diabetes Patients
3.5. Relations among FADS Genotypes, Desaturases Activities and HDL-C Levels
4. Discussion
5. Conclusions
Acknowledgments
Author Contributions
Conflicts of Interest
Abbreviations
| ANOVA | Analysis and analysis of variance |
| D5D | Delta-5 desaturase |
| D6D | Delta-6 desaturase |
| PUFA | Polyunsaturated fatty acids |
| FADS | Fatty acid desaturase (FADS) |
| HDL-C | High density lipoprotein-cholesterol |
| HWE | Weinberg equilibrium expectation |
| LDL-C | Low density lipoprotein-cholesterol |
| LD | Linkage disequilibrium |
| MAF | Minor allele frequencies |
| SNP | single nucleotide polymorphisms |
References
- Quispe, R.; Martin, S.S.; Jones, S.R. Triglycerides to high-density lipoprotein-cholesterol ratio, glycemic control and cardiovascular risk in obese patients with type 2 diabetes. Curr. Opin. Endocrinol. Diabetes Obes. 2016, 23, 150–156. [Google Scholar] [CrossRef] [PubMed]
- Siebel, A.L.; Heywood, S.E.; Kingwell, B.A. HDL and glucose metabolism: Current evidence and therapeutic potential. Front. Pharmacol. 2015, 6, 258. [Google Scholar] [CrossRef] [PubMed]
- Verges, B. Pathophysiology of diabetic dyslipidaemia: Where are we? Diabetologia 2015, 58, 886–899. [Google Scholar] [CrossRef] [PubMed]
- In the clinic. Type 2 diabetes. Ann. Intern. Med. 2007, 146, ITC1. [Google Scholar]
- Marquardt, A.; Stohr, H.; White, K.; Weber, B.H. CDNA cloning, genomic structure, and chromosomal localization of three members of the human fatty acid desaturase family. Genomics 2000, 66, 175–183. [Google Scholar] [CrossRef] [PubMed]
- Schaeffer, L.; Gohlke, H.; Muller, M.; Heid, I.M.; Palmer, L.J.; Kompauer, I.; Demmelmair, H.; Illig, T.; Koletzko, B.; Heinrich, J. Common genetic variants of the FADS1 FADS2 gene cluster and their reconstructed haplotypes are associated with the fatty acid composition in phospholipids. Hum. Mol. Genet. 2006, 15, 1745–1756. [Google Scholar] [CrossRef] [PubMed]
- Lattka, E.; Illig, T.; Koletzko, B.; Heinrich, J. Genetic variants of the FADS 1 FADS 2 gene cluster as related to essential fatty acid metabolism. Curr. Opin. Lipidol. 2010, 21, 64–69. [Google Scholar] [CrossRef] [PubMed]
- Cormier, H.; Rudkowska, I.; Thifault, E.; Lemieux, S.; Couture, P. Polymorphisms in fatty acid desaturase (FADS) gene cluster: Effects on glycemic controls following an omega-3 polyunsaturated fatty acids (PUFA) supplementation. Genes 2013, 10, 485–498. [Google Scholar] [CrossRef] [PubMed]
- Tanaka, T.; Shen, J.; Abecasis, G.R.; Kisialiou, A.; Ordovas, J.M.; Guralnik, J.M.; Singleton, A.; Bandinelli, S.; Cherubini, A.; Arnett, D.; et al. Genome-wide association study of plasma polyunsaturated fatty acids in the Inchianti study. PLoS Gene 2009, 5, e1000338. [Google Scholar] [CrossRef] [PubMed]
- Hellstrand, S.; Sonestedt, E.; Ericson, U.; Gullberg, B.; Wirfalt, E.; Hedblad, B.; Orho-Melander, M. Intake levels of dietary long-chain pufas modify the association between genetic variation in FADS and LDL-C. J. Lipid Res. 2012, 53, 1183–1189. [Google Scholar] [CrossRef] [PubMed]
- Kathiresan, S.; Willer, C.J.; Peloso, G.M.; Demissie, S.; Musunuru, K.; Schadt, E.E.; Kaplan, L.; Bennett, D.; Li, Y.; Tanaka, T.; et al. Common variants at 30 loci contribute to polygenic dyslipidemia. Nat. Genet. 2009, 41, 56–65. [Google Scholar] [CrossRef] [PubMed]
- Aulchenko, Y.S.; Ripatti, S.; Lindqvist, I.; Boomsma, D.; Heid, I.M.; Pramstaller, P.P.; Penninx, B.W.; Janssens, A.C.; Wilson, J.F.; Spector, T.; et al. Loci influencing lipid levels and coronary heart disease risk in 16 European population cohorts. Nat. Genet. 2009, 41, 47–55. [Google Scholar] [CrossRef] [PubMed]
- Abdelmagid, S.A.; Clarke, S.E.; Roke, K.; Nielsen, D.E.; Badawi, A.; El-Sohemy, A.; Mutch, D.M.; Ma, D.W. Ethnicity, sex, FADS genetic variation, and hormonal contraceptive use influence delta-5- and delta-6-desaturase indices and plasma docosahexaenoic acid concentration in young Canadian adults: A cross-sectional study. Nutr. Metab. 2015, 12, 14. [Google Scholar] [CrossRef] [PubMed]
- Nakayama, K.; Bayasgalan, T.; Tazoe, F.; Yanagisawa, Y.; Gotoh, T.; Yamanaka, K.; Ogawa, A.; Munkhtulga, L.; Chimedregze, U.; Kagawa, Y.; et al. A single nucleotide polymorphism in the FADS 1/ FADS 2 gene is associated with plasma lipid profiles in two genetically similar Asian ethnic groups with distinctive differences in lifestyle. Hum. Genet. 2010, 127, 685–690. [Google Scholar] [CrossRef] [PubMed]
- Merino, D.M.; Johnston, H.; Clarke, S.; Roke, K.; Nielsen, D.; Badawi, A.; El-Sohemy, A.; Ma, D.W.; Mutch, D.M. Polymorphisms in FADS 1 and FADS 2 alter desaturase activity in young Caucasian and Asian adults. Mol. Genet. Metab. 2011, 103, 171–178. [Google Scholar] [CrossRef] [PubMed]
- Zhu, J.; Sun, Q.; Zong, G.; Si, Y.; Liu, C.; Qi, Q.; Ye, X.; Sun, L.; Sheng, H.; Li, H.; et al. Interaction between a common variant in FADS 1 and erythrocyte polyunsaturated fatty acids on lipid profile in Chinese Hans. J. Lipid Res. 2013, 54, 1477–1483. [Google Scholar] [CrossRef] [PubMed]
- Lu, Y.; Feskens, E.J.; Dolle, M.E.; Imholz, S.; Verschuren, W.M.; Muller, M.; Boer, J.M. Dietary n-3 and n-6 polyunsaturated fatty acid intake interacts with FADS 1 genetic variation to affect total and HDL-cholesterol concentrations in the doetinchem cohort study. Am. J. Clin. Nutr. 2010, 92, 258–265. [Google Scholar] [CrossRef] [PubMed]
- Vessby, B.; Tengblad, S.; Lithell, H. Insulin sensitivity is related to the fatty acid composition of serum lipids and skeletal muscle phospholipids in 70-year-old men. Diabetologia 1994, 37, 1044–1050. [Google Scholar] [CrossRef] [PubMed]
- Martinelli, N.; Girelli, D.; Malerba, G.; Guarini, P.; Illig, T.; Trabetti, E.; Sandri, M.; Friso, S.; Pizzolo, F.; Schaeffer, L.; et al. FADS s genotypes and desaturase activity estimated by the ratio of arachidonic acid to linoleic acid are associated with inflammation and coronary artery disease. Am. J. Clin. Nutr. 2008, 88, 941–949. [Google Scholar] [PubMed]
- American, D.A. Standards of medical care in diabetes. Diabetes Care 2004, 27 (Suppl. 1), S15–S35. [Google Scholar]
- Hsu, C.C.; Chang, H.Y.; Huang, M.C.; Hwang, S.J.; Yang, Y.C.; Tai, T.Y.; Yang, H.J.; Chang, C.T.; Chang, C.J.; Li, Y.S.; et al. Association between insulin resistance and development of microalbuminuria in type 2 diabetes: A prospective cohort study. Diabetes Care 2011, 34, 982–987. [Google Scholar] [CrossRef] [PubMed]
- Bligh, E.G.; Dyer, W.J. A rapid method of total lipid extraction and purification. Can. J. Biochem. Physiol. 1959, 37, 911–917. [Google Scholar] [CrossRef] [PubMed]
- Chung, H.F.; Long, K.Z.; Hsu, C.C.; Al Mamun, A.; Jhang, H.R.; Shin, S.J.; Hwang, S.J.; Huang, M.C. Association of n-3 polyunsaturated fatty acids and inflammatory indicators with renal function decline in type 2 diabetes. Clin. Nutr. 2015, 34, 229–234. [Google Scholar] [CrossRef] [PubMed]
- Bokor, S.; Dumont, J.; Spinneker, A.; Gonzalez-Gross, M.; Nova, E.; Widhalm, K.; Moschonis, G.; Stehle, P.; Amouyel, P.; De Henauw, S.; et al. Single nucleotide polymorphisms in the FADS gene cluster are associated with delta-5 and delta-6 desaturase activities estimated by serum fatty acid ratios. J. Lipid Res. 2010, 51, 2325–2333. [Google Scholar] [CrossRef] [PubMed]
- Tsai, M.H.; Lin, K.M.; Hsiao, M.C.; Shen, W.W.; Lu, M.L.; Tang, H.S.; Fang, C.K.; Wu, C.S.; Lu, S.C.; Liu, S.C.; et al. Genetic polymorphisms of cytochrome p450 enzymes influence metabolism of the antidepressant escitalopram and treatment response. Pharmacogenomics 2010, 11, 537–546. [Google Scholar] [CrossRef] [PubMed]
- Park, M.H.; Kim, N.; Lee, J.Y.; Park, H.Y. Genetic loci associated with lipid concentrations and cardiovascular risk factors in the korean population. J. Med. Genet. 2011, 48, 10–15. [Google Scholar] [CrossRef] [PubMed]
- Lu, Y.; Vaarhorst, A.; Merry, A.H.; Dolle, M.E.; Hovenier, R.; Imholz, S.; Schouten, L.J.; Heijmans, B.T.; Muller, M.; Slagboom, P.E.; et al. Markers of endogenous desaturase activity and risk of coronary heart disease in the carema cohort study. PLoS ONE 2012, 7, e41681. [Google Scholar] [CrossRef] [PubMed]
- Horiguchi, S.; Nakayama, K.; Iwamoto, S.; Ishijima, A.; Minezaki, T.; Baba, M.; Kontai, Y.; Horikawa, C.; Kawashima, H.; Shibata, H.; et al. Associations between a fatty acid desaturase gene polymorphism and blood arachidonic acid compositions in Japanese elderly. Prostaglandins Leukot. Essent. Fatty Acids 2016, 105, 9–14. [Google Scholar] [CrossRef] [PubMed]
- Vu-Dac, N.; Schoonjans, K.; Laine, B.; Fruchart, J.C.; Auwerx, J.; Staels, B. Negative regulation of the human apolipoprotein A-I promoter by fibrates can be attenuated by the interaction of the peroxisome proliferator-activated receptor with its response element. J. Biol. Chem. 1994, 269, 31012–31018. [Google Scholar] [PubMed]
- Vu-Dac, N.; Schoonjans, K.; Kosykh, V.; Dallongeville, J.; Fruchart, J.C.; Staels, B.; Auwerx, J. Fibrates increase human apolipoprotein A-II expression through activation of the peroxisome proliferator-activated receptor. J. Clin. Investig. 1995, 96, 741–750. [Google Scholar] [CrossRef] [PubMed]
- Hertz, R.; Bishara-Shieban, J.; Bar-Tana, J. Mode of action of peroxisome proliferators as hypolipidemic drugs. Suppression of apolipoprotein C-III. J. Biol. Chem. 1995, 270, 13470–13475. [Google Scholar] [CrossRef] [PubMed]
- National Cholesterol Education Program Expert Panel on Detection, Evaluation; Treatment of High Blood Cholesterol in Adults. Third report of the National Cholesterol Education Program (NCEP) expert panel on detection, evaluation, and treatment of high blood cholesterol in adults (Adult Treatment Panel III) final report. Circulation 2002, 106, 3143–3421. [Google Scholar]
- Nogi, A.; Yang, J.; Li, L.; Yamasaki, M.; Watanabe, M.; Hashimoto, M.; Shiwaku, K. Plasma n-3 polyunsaturated fatty acid and cardiovascular disease risk factors in Japanese, korean and mongolian workers. J. Occup. Health 2007, 49, 205–216. [Google Scholar] [CrossRef] [PubMed]


| Variables | All Type 2 Diabetes Patients (n = 820) | Type 2 Diabetes Patients without Using Lipid-Lowering Drugs (n = 176) b |
|---|---|---|
| Clinical Measures | ||
| Age (year) | 59.5 ± 8.5 | 58.3 ± 8.9 |
| Female (%) | 431 (52.6) | 99 (56.3) |
| Diabetes duration (year) | 11.0 ± 5.7 | 10.7 ± 5.3 |
| Education ≤6 years (%) | 446 (54.4) | 90 (51.1) |
| Smoking (%) | 243 (29.6) | 47 (26.7) |
| Drinking (%) | 99 (12.1) | 21 (11.9) |
| Exercise (%) | 529 (64.5) | 108 (61.4) |
| Body mass index (kg/m2) | 26.1 ± 3.8 | 25.4 ± 3.9 |
| Systolic blood pressure (mmHg) | 136.4 ± 19.6 | 135.5 ± 22.6 |
| Diastolic blood pressure (mmHg) | 79.4 ± 11.0 | 79.1 ± 11.3 |
| Triglyceride (mmol/L) | 1.8 ± 1.1 | 1.6 ± 1.1 |
| Cholesterol (mmol/L) | 4.9 ± 0.9 | 4.8 ± 0.9 |
| LDL-C (mmol/L) | 3.1 ± 0.8 | 3.0 ± 0.8 |
| HDL-C (mmol/L) | 1.0 ± 0.3 | 1.0 ± 0.3 |
| non-HDL-C (mmol/L) | 3.9 ± 0.8 | 3.8 ± 0.9 |
| Fasting glucose (mmol/L) | 8.3 ±2.7 | 8.7 ± 3.0 |
| Hemoglobin A1c (%) | 8.0 ± 1.5 | 8.2 ± 1.6 |
| Serum creatinine (μmol/L) | 86.6 ± 67.7 | 80.7 ± 63.2 |
| Blood urea nitrogen (mmol/L) | 5.8 ± 2.8 | 5.3 ± 2.3 |
| Plasma PUFA (%) c | ||
| Total PUFA | 40.5 ± 3.5 | |
| n-3 PUFA | 6.9 ± 2.2 | |
| C18:3 n3 (alpha-linolenic acid) | 0.9 ± 0.3 | |
| C20:5 n3 (eicosapentaenoic acid) | 0.9 ± 0.7 | |
| n-6 PUFA | 33.6 ± 3.6 | |
| C18:2 n6 (linoleic acid) | 24.1 ± 4.1 | |
| C18:3 n6 | 0.2 ± 0.2 | |
| C20:3 n6 | 1.7 ± 0.5 | |
| C20:4 n6 (arachidonic acid) | 6.6±1.6 |
| Gene | SNPs | Alleles (Major/Minor) | Genotype (MM/Mm/mm) | Allele Frequency (M/m) | Hapmap Genotype Frequency b (Allele Frequency) | HWE (p Value) e |
|---|---|---|---|---|---|---|
| FADS1 | rs174547 | T/C | 280/395/145 | 955/685 | 33.3/41.7/25.0 c | 0.774 |
| (34.1/48.2/17.7) | (58.2/41.8) | (54.2/45.8) c | ||||
| FADS1 | rs174548 | G/C | 268/404/147 | 940/698 | 31.8/41.2/27.1 c | 0.806 |
| (32.7/49.3/17.9) | (57.4/42.6) | (52.4/47.6) c | ||||
| FADS1 | rs174550 | C/T | 278/397/145 | 953/687 | 45.5/40.9/13.6 d | 0.874 |
| (33.9/48.4/17.7) | (41.9/58.1) | (65.9/34.1) d | ||||
| FADS2 | rs174575 | C/G | 613/188/19 | 1414/226 | 80.0/17.8/2.2 d | 0.314 |
| (74.8/22.9/2.3) | (86.2/13.8) | (88.9/11.1) d | ||||
| FADS2 | rs174576 | A/C | 280/397/143 | 957/683 | 31.8/43.5/24.7 c | 0.911 |
| (34.1/48.1/17.4) | (58.3/41.7) | (53.5/46.5) c | ||||
| FADS2 | rs174583 | T/C | 280/396/142 | 956/680 | 32.1/44/0/23.8 c | 0.922 |
| (34.1/48.3/17.3) | (58.4/42.6) | (54.2/45.8) c | ||||
| FADS2 | rs498793 | G/A | 683/124/13 | 1490/150 | 79.8/20.2/0 c | 0.010 |
| (83.3/15.1/1.6) | (90.9/9.1) | (89.9/10.1) c | ||||
| FADS2 | rs2727270 | C/T | 243/421/156 | 907/733 | 65.1/25.6/9.3 d | 0.270 |
| (29.6/51.3/19.0) | (55.3/44.7) | (77.9/22.1) d |
| Genotypes | n | D5D Activity | D6D Activity | n-3 Pathway Activity | n-6 Pathway Activity | |
|---|---|---|---|---|---|---|
| (20:4 n6/20:3 n6) | (18:3 n6/18:2 n6) | (20:5 n3/18:3 n3) | (20:4 n6/18:2 n6) | |||
| Mean ± SD | ||||||
| FADS1 | TT | 23 | 4.785 ± 1.162 | 0.020 ± 0.010 | 1.001 ±0 .297 | 0.389 ± 0.087 |
| rs174547 d | TC | 90 | 4.188 ± 1.306 | 0.011 ± 0.006 | 0.947 ± 0.358 | 0.300 ± 0.091 |
| CC | 63 | 4.126 ± 1.845 | 0.006 ± 0.005 | 0.842 ± 0.987 | 0.233 ± 0.075 | |
| p value | 0.05 | <0.001 | 0.001 | <0.001 | ||
| p for trend | 0.022 | <0.001 | <0.001 | <0.001 | ||
| FADS2 | CC | 132 | 4.285 ±1.503 | 0.011 ± 0.008 | 0.936 ± 0.716 | 0.292 ± 0.983 |
| rs174575 d | CG+GG | 44 | 4.120 ± 1.552 | 0.009 ± 0.007 | 0.858 ± 0.407 | 0.266 ± 0.095 |
| p value b | 0.426 | 0.008 | 0.309 | 0.098 | ||
| p for trend c | - | - | - | - | ||
| FADS2 | GG | 149 | 4.199 ± 1.393 | 0.011 ± 0.008 | 0.935 ± 0.678 | 0.291 ± 0.094 |
| rs498793 d | GA+AA | 27 | 4.490 ± 2.069 | 0.008 ± 0.006 | 0.815 ± 0.479 | 0.255 ± 0.113 |
| p value b | 0.866 | 0.031 | 0.112 | 0.065 | ||
| p for trend c | - | - | - | - | ||
| FADS2 | CC | 41 | 4.528 ± 1.300 | 0.015 ± 0.009 | 1.039 ± 0.392 | 0.355 ± 0.101 |
| rs2727270 d | CT | 99 | 4.210 ± 1.477 | 0.011 ± 0.007 | 0.923 ± 0.803 | 0 .275 ± 0.090 |
| TT | 36 | 4.013 ± 1.802 | 0.005 ± 0.002 | 0.759 ± 0.321 | 0.232 ± 0.069 | |
| p value | 0.120 | <0.001 | 0.006 | <0.001 | ||
| p for trend | 0.039 | <0.001 | 0.001 | <0.001 | ||
| Plasma Lipids | |||||||
|---|---|---|---|---|---|---|---|
| Genotypes | Triglyceride | Cholesterol | LDL-C | HDL-C | Non-HDL-C | ||
| (mmol/L) | (mmol/L) | (mmol/L) | (mmol/L) | (mmol/L) | |||
| n | Mean ± SD | ||||||
| FADS1 | TT | 23 | 1.4 ± 0.6 | 5.1 ± 0.9 | 3.3 ± 0.9 | 1.1 ± 0.3 | 4.0 ± 0.9 |
| rs174547 d | TC | 90 | 1.6 ± 1.2 | 4.8 ± 0.8 | 3.0 ± 0.7 | 1.0 ± 0.2 | 3.8 ± 0.8 |
| CC | 63 | 1.7 ±1.1 | 4.7 ± 1.0 | 2.9 ± 0.9 | 1.0 ± 0.3 | 3.7 ± 0.9 | |
| p value | 0.699 | 0.201 | 0.098 | 0.098 | 0.485 | ||
| p for trend | 0.426 | 0.082 | 0.059 | 0.031 | 0.248 | ||
| FADS2 | CC | 132 | 1.5 ± 1.0 | 4.8 ± 0.9 | 3.0 ± 0.8 | 1.0 ± 0.3 | 3.8 ± 0.9 |
| rs174575 d | CG+GG | 44 | 1.7 ± 1.3 | 4.9 ± 0.9 | 3.0 ± 0.9 | 1.0 ± 0.3 | 3.8 ± 0.9 |
| p value b | 0.625 | 0.645 | 0.983 | 0.964 | 0.627 | ||
| p for trend c | - | - | - | - | - | ||
| FADS2 | GG | 149 | 1.6 ± 1.2 | 4.9 ± 0.9 | 3.0 ± 0.8 | 1.0 ± 0.3 | 3.8 ± 0.9 |
| rs498793 d | GA+AA | 27 | 1.4 ± 0.7 | 4.5 ± 0.9 | 2.8 ± 0.8 | 1.0 ± 0.2 | 3.5 ± 0.8 |
| p value b | 0.482 | 0.034 | 0.261 | 0.298 | 0.096 | ||
| p for trend c | - | - | - | - | - | ||
| FADS2 | CC | 41 | 1.5 ± 1.3 | 5.0 ± 0.9 | 3.1 ± 0.9 | 1.1 ± 0.3 | 3.9 ± 0.9 |
| rs2727270 d | CT | 99 | 1.6 ± 0.9 | 4.8 ± 0.8 | 3.0 ± 0.7 | 1.0 ± 0.3 | 3.8 ± 0.8 |
| TT | 36 | 1.6 ± 1.3 | 4.6 ± 1.0 | 3.0 ± 1.0 | 1.0 ± 0.3 | 3.7 ± 1.0 | |
| p value | 0.472 | 0.147 | 0.249 | 0.083 | 0.354 | ||
| p for trend | 0.699 | 0.059 | 0.112 | 0.025 | 0.299 | ||
| Model 1 | Model 2 | Model 3 | Model 4 | Model 5 | ||||||
|---|---|---|---|---|---|---|---|---|---|---|
| Beta (SE) | p | Beta (SE) | p | Beta (SE) | p | Beta (SE) | p | Beta (SE) | p | |
| rs174547 | −0.059 (0.031) | 0.056 | - | - | - | 0.006 (0.050) | 0.898 | |||
| rs2727270 | - | −0.057 (0.031) | 0.064 | - | - | −0.018 (0.045) | 0.687 | |||
| D5D activity | - | - | 0.034 (0.014) | 0.019 | - | 0.041 (0.015) | 0.006 | |||
| D6D activity | - | - | - | 5.303 (2.759) | 0.056 | 6.239 (3.414) | 0.070 | |||
© 2017 by the authors. Licensee MDPI, Basel, Switzerland. This article is an open access article distributed under the terms and conditions of the Creative Commons Attribution (CC BY) license (http://creativecommons.org/licenses/by/4.0/).
Share and Cite
Huang, M.-C.; Chang, W.-T.; Chang, H.-Y.; Chung, H.-F.; Chen, F.-P.; Huang, Y.-F.; Hsu, C.-C.; Hwang, S.-J. FADS Gene Polymorphisms, Fatty Acid Desaturase Activities, and HDL-C in Type 2 Diabetes. Int. J. Environ. Res. Public Health 2017, 14, 572. https://doi.org/10.3390/ijerph14060572
Huang M-C, Chang W-T, Chang H-Y, Chung H-F, Chen F-P, Huang Y-F, Hsu C-C, Hwang S-J. FADS Gene Polymorphisms, Fatty Acid Desaturase Activities, and HDL-C in Type 2 Diabetes. International Journal of Environmental Research and Public Health. 2017; 14(6):572. https://doi.org/10.3390/ijerph14060572
Chicago/Turabian StyleHuang, Meng-Chuan, Wen-Tsan Chang, Hsin-Yu Chang, Hsin-Fang Chung, Fang-Pei Chen, Ya-Fang Huang, Chih-Cheng Hsu, and Shang-Jyh Hwang. 2017. "FADS Gene Polymorphisms, Fatty Acid Desaturase Activities, and HDL-C in Type 2 Diabetes" International Journal of Environmental Research and Public Health 14, no. 6: 572. https://doi.org/10.3390/ijerph14060572
APA StyleHuang, M.-C., Chang, W.-T., Chang, H.-Y., Chung, H.-F., Chen, F.-P., Huang, Y.-F., Hsu, C.-C., & Hwang, S.-J. (2017). FADS Gene Polymorphisms, Fatty Acid Desaturase Activities, and HDL-C in Type 2 Diabetes. International Journal of Environmental Research and Public Health, 14(6), 572. https://doi.org/10.3390/ijerph14060572