
Mapping Patterns and Trends in the Spatial Availability of Alcohol Using Low-Level Geographic Data: A Case Study in England 2003–2013

 , , , and
Abstract
:1. Introduction
2. Materials and Methods
2.1. Data
2.2. Outlet Measures
- Pubs, bars and nightclubs (café bars, wine bars and both wet- and dry-led pubs which focus on alcohol and food respectively)
- Restaurants
- All other on-trade outlets (including sports and social clubs, hotels, casinos and conference venues)
- Supermarkets (large grocery store providing many services, usually over 280 m2 in floor area)
- Convenience store (smaller grocery store providing limited/essential food and drink, usually under 280 m2 in area—note that in the UK the vast majority of grocery stores sell alcohol)
- All other off-trade outlets (including specialist off-licenses, corner shops and petrol station forecourts)
2.3. Availability Measures
- Outlet proximity; the Euclidean (straight line) distance from the centroid of a postcode to the nearest centroid of a postcode containing an outlet of a given type.
- Outlet density; the total number of outlets of a given type in a postcode whose centroid lay within a 1 km radius of the postcode centroid.
2.4. Area-Level Measure
2.5. Statistical Analyses
3. Results
4. Discussion
5. Conclusions
Supplementary Materials
Acknowledgments
Author Contributions
Conflicts of Interest
References
- Forouzanfar, M.H.; Alexander, L.; Anderson, H.R.; Bachman, V.F.; Biryukov, S.; Brauer, M.; Burnett, R.; Casey, D.; Coates, M.M.; Cohen, A.; et al. Global, regional, and national comparative risk assessment of 79 behavioural, environmental and occupational, and metabolic risks or clusters of risks in 188 countries, 1990–2013: A systematic analysis for the Global Burden of Disease Study 2013. Lancet 2015, 386, 2287–2323. [Google Scholar] [CrossRef]
- Anderson, P.; Baumberg, B. Alcohol in Europe; Institute for Alcohol Studies: London, UK, 2006. [Google Scholar]
- Babor, T. Alcohol: No Ordinary Commodity: Research and Public Policy, 2nd ed.; Oxford University Press: Oxford, UK, 2010. [Google Scholar]
- Stockwell, T.; Gruenewald, P. Controls on the physical availability of alcohol. In The Essential Handbook of Treatment and Prevention of Alcohol Problems; Heather, N., Stockwell, T., Eds.; John Wiley & Sons, Ltd.: Chichester, UK, 2004; pp. 213–233. [Google Scholar]
- Popova, S.; Giesbrecht, N.; Bekmuradov, D.; Patra, J. Hours and days of sale and density of alcohol outlets: Impacts on alcohol consumption and damage: A systematic review. Alcohol Alcohol. 2009, 44, 500–516. [Google Scholar] [CrossRef] [PubMed]
- Campbell, C.A.; Hahn, R.A.; Elder, R.; Brewer, R.; Chattopadhyay, S.; Fielding, J.; Naimi, T.S.; Toomey, T.; Lawrence, B.; Middleton, J.C.; et al. The effectiveness of limiting alcohol outlet density as a means of reducing excessive alcohol consumption and alcohol-related harms. Am. J. Prev. Med. 2009, 37, 556–569. [Google Scholar] [CrossRef] [PubMed]
- Livingston, M.; Chikritzhs, T.; Room, R. Changing the Density of Alcohol Outlets to Reduce Alcohol-Related Problems; Informa UK Ltd.: London, UK, 2009. [Google Scholar]
- Holmes, J.; Guo, Y.; Maheswaran, R.; Nicholls, J.; Meier, P.S.; Brennan, A. The impact of spatial and temporal availability of alcohol on its consumption and related harms: A critical review in the context of UK licensing policies. Drug Alcohol Rev. 2014, 33, 515–525. [Google Scholar] [CrossRef] [PubMed]
- Ellaway, A.; Macdonald, L.; Forsyth, A.; Macintyre, S. The socio-spatial distribution of alcohol outlets in Glasgow city. Health Place 2010, 16, 167–172. [Google Scholar] [CrossRef] [PubMed]
- Shortt, N.K.; Tisch, C.; Pearce, J.; Mitchell, R.; Richardson, E.A.; Hill, S.; Collin, J. A cross-sectional analysis of the relationship between tobacco and alcohol outlet density and neighbourhood deprivation. BMC Public Health 2015, 15, 1014. [Google Scholar] [CrossRef] [PubMed]
- Morrison, C.; Gruenewald, P.J.; Ponicki, W.R. Socioeconomic Determinants of Exposure to Alcohol Outlets. J. Stud. Alcohol Drugs 2015, 76, 439–446. [Google Scholar] [CrossRef] [PubMed]
- Livingston, M. The social gradient of alcohol availability in Victoria, Australia. Aust. N. Z. J. Public Health 2012, 36, 41–47. [Google Scholar] [CrossRef] [PubMed]
- Fone, D.; Morgan, J.; Fry, R.; Rodgers, S.; Orford, S.; Farewell, D.; Dunstan, F.; White, J.; Sivarajasingam, V.; Trefan, L.; et al. Change in alcohol outlet density and alcohol-related harm to population health (CHALICE): A comprehensive record-linked database study in Wales. Public Health Res. 2016, 4, 1–184. [Google Scholar] [CrossRef] [PubMed]
- Gruenewald, P.J.; Ponicki, W.R.; Holder, H.D. The Relationship of Outlet Densities to Alcohol Consumption: A Time Series Cross-Sectional Analysis. Alcohol. Clin. Exp. Res. 1993, 17, 38–47. [Google Scholar] [CrossRef] [PubMed]
- Gruenewald, P.J. The spatial ecology of alcohol problems: Niche theory and assortative drinking. Addiction 2007, 102, 870–878. [Google Scholar] [CrossRef] [PubMed]
- Forsyth, A.J.M.; Davidson, N. Community off-sales provision and the presence of alcohol-related detritus in residential neighbourhoods. Health Place 2010, 16, 349–358. [Google Scholar] [CrossRef] [PubMed]
- Pridemore, W.A.; Grubesic, T.H. Community organization moderates the effect of alcohol outlet density on violence. Br. J. Sociol. 2012, 63, 680–703. [Google Scholar] [CrossRef] [PubMed]
- Marmot, M. Social determinants of health inequalities. Lancet 2005, 365, 1099–1104. [Google Scholar] [CrossRef]
- Probst, C.; Roerecke, M.; Behrendt, S.; Rehm, J. Socioeconomic differences in alcohol-attributable mortality compared with all-cause mortality: A systematic review and meta-analysis. Int. J. Epidemiol. 2014, 43, 1314–1327. [Google Scholar] [CrossRef] [PubMed]
- Mackenbach, J.P.; Kulhánová, I.; Bopp, M.; Borrell, C.; Deboosere, P.; Kovács, K.; Looman, C.W.; Leinsalu, M.; Mäkelä, P.; Martikainen, P.; et al. Inequalities in Alcohol-Related Mortality in 17 European Countries: A Retrospective Analysis of Mortality Registers. PLoS Med. 2015, 12, e1001909. [Google Scholar] [CrossRef] [PubMed]
- Erskine, S.; Maheswaran, R.; Pearson, T.; Gleeson, D. Socioeconomic deprivation, urban-rural location and alcohol-related mortality in England and Wales. BMC Public Health 2010, 10, 99. [Google Scholar] [CrossRef] [PubMed]
- Hay, G.C.; Whigham, P.A.; Kypri, K.; Langley, J.D. Neighbourhood deprivation and access to alcohol outlets: A national study. Health Place 2009, 15, 1086–1093. [Google Scholar] [CrossRef] [PubMed]
- Romley, J.A.; Cohen, D.; Ringel, J.; Sturm, R. Alcohol and environmental justice: The density of liquor stores and bars in urban neighborhoods in the United States. J. Stud. Alcohol Drugs. 2007, 68, 48–55. [Google Scholar] [CrossRef] [PubMed]
- Office for National Statistics. ONS Postcode Directory User Guide; Office for National Statistics: Newport, UK, 2016.
- Public Health England. Alcohol Sales Data in England in 2014: Analysis to Assess Suitability for Inclusion as an Indicator in the Local Alcohol Profiles for England; Public Health England: London, UK, 2017.
- Office for National Statistics. ONS Postcode directory (UK) November 2014; Office for National Statistics: Newport, UK, 2014.
- Communities and Local Government. The English Incides of Deprivation 2010; Communities and Local Government: London, UK, 2011.
- R Core Team. R: A Language and Environment for Statistical Computing; R Foundation for Statistical Computing: Vienna, Austria, 2015. [Google Scholar]
- StataCorp. Stata Statistical Software: Release 12; StataCorp LP: College Station, TX, USA, 2011. [Google Scholar]
- Foster, S.; Hooper, P.; Knuiman, M.; Trapp, G.; Wood, L. Does alcohol outlet density differ by area-level disadvantage in metropolitan Perth? Drug Alcohol Rev. 2017. [Google Scholar] [CrossRef] [PubMed]
- Nicholls, J. Time for reform? Alcohol policy and cultural change in England since 2000. Br. Politics 2012, 7, 250–271. [Google Scholar] [CrossRef]
- Foster, J. The Licensing Act (2003): Its Uses and Abuses 10 Years on; Institute of Alcohol Studies: London, UK, 2016. [Google Scholar]
- Durnford, A.J.; Perkins, T.J.; Perry, J.M. An evaluation of alcohol attendances to an inner city emergency department before and after the introduction of the UK Licensing Act 2003. BMC Public Health 2008, 8, 379. [Google Scholar] [CrossRef] [PubMed]
- Foster, J.H.; Herring, R.; Waller, S.; Thom, B. The Licensing Act 2003: A step in the right direction? J. Subst. Use 2009, 14, 113–123. [Google Scholar] [CrossRef]
- Herring, R.; Thom, B.; Foster, J.; Franey, C.; Salazar, C. Local responses to the Alcohol Licensing Act 2003: The case of Greater London. Drugs Educ. Prev. Policy 2009, 15, 251–265. [Google Scholar] [CrossRef]
- Humphreys, D.K.; Eisner, M.P. Evaluating a natural experiment in alcohol policy. Criminol. Public Policy 2010, 9, 41–67. [Google Scholar] [CrossRef]
- Chartered Institute of Personnel and Development. Are We Working Harder Than Ever? CIPD: London, UK, 2014. [Google Scholar]
- IGD. Growing UK Convenience Market. 2014. Available online: http://www.igd.com/Research/Retail/Growing-UK-convenience-market/ (accessed on 8 July 2016).
- Higgs, G. The role of GIS for health utilization studies: Literature review. Health Serv. Outcomes Res. Methodol. 2009, 9, 84–99. [Google Scholar] [CrossRef]
- Office for National Statitics. Census Geography. Available online: https://www.ons.gov.uk/methodology/geography/ukgeographies/censusgeography#super-output-area-soa (accessed on 28 March 2017).
- Babb, P. Violent Crime, Disorder and Criminal Damage Since the Introduction of the Licensing Act 2003; Home Office: London, UK, 2007.
- Jones, L.A.; Goodacre, S. Effect of 24-h alcohol licensing on emergency departments: The South Yorkshire experience. Emerg. Med. J. 2010, 27, 688–691. [Google Scholar] [CrossRef] [PubMed]
- Gmel, G.; Holmes, J.; Studer, J. Are alcohol outlet densities strongly associated with alcohol-related outcomes? A critical review of recent evidence. Drug Alcohol Rev. 2015. [Google Scholar] [CrossRef] [PubMed]
- Holmes, J.; Meier, P.S. Commentary on Hobday et al. (2015): Inconsistent results beneath consistent conclusions—The need for a new approach to analysing alcohol availability. Addiction 2015, 110, 1910–1911. [Google Scholar] [CrossRef] [PubMed]
- Meier, P.S.; Holmes, J.; Angus, C.; Ally, A.K.; Meng, Y.; Brennan, A. Estimated Effects of Different Alcohol Taxation and Price Policies on Health Inequalities: A Mathematical Modelling Study. PLOS Med. 2016, 13, e1001963. [Google Scholar] [CrossRef] [PubMed]


| Outlet Category | 2003 | 2007 | 2010 | 2013 | Change 2003–2013 | % Change 2003–2013 | |
|---|---|---|---|---|---|---|---|
| Population in millions (aged 18+) | 38.8 | 40.2 | 41.4 | 42.4 | 3.5 | 9% | |
| On-trade | Pubs, bars and nightclubs | 55,105 | 56,204 | 53,487 | 49,940 | −5165 | −9% |
| Restaurants | 18,410 | 18,849 | 19,160 | 21,433 | 3023 | 16% | |
| Other on-trade | 48,727 | 45,848 | 43,115 | 36,191 | −12,536 | −26% | |
| Off-trade | Supermarkets | 4417 | 5101 | 6072 | 5859 | 1442 | 33% |
| Convenience stores | 8083 | 11,225 | 11,901 | 16,467 | 8384 | 104% | |
| Other off-trade | 20,892 | 22,166 | 22,874 | 23,134 | 2242 | 11% | |
| On-trade | 122,242 | 120,901 | 115,762 | 107,564 | −14,678 | −12% | |
| Off-trade | 33,392 | 38,492 | 40,847 | 45,460 | 12,068 | 36% | |
| All outlets | 155,634 | 159,393 | 156,609 | 153,024 | −2610 | −2% | |
| Outlet Category | Mean Availability (Inter-Quartile Range) | Change from 2003 to 2013 (IQR) | Mean % Change from 2003 to 2013 | ||||
|---|---|---|---|---|---|---|---|
| 2003 | 2007 | 2010 | 2013 | ||||
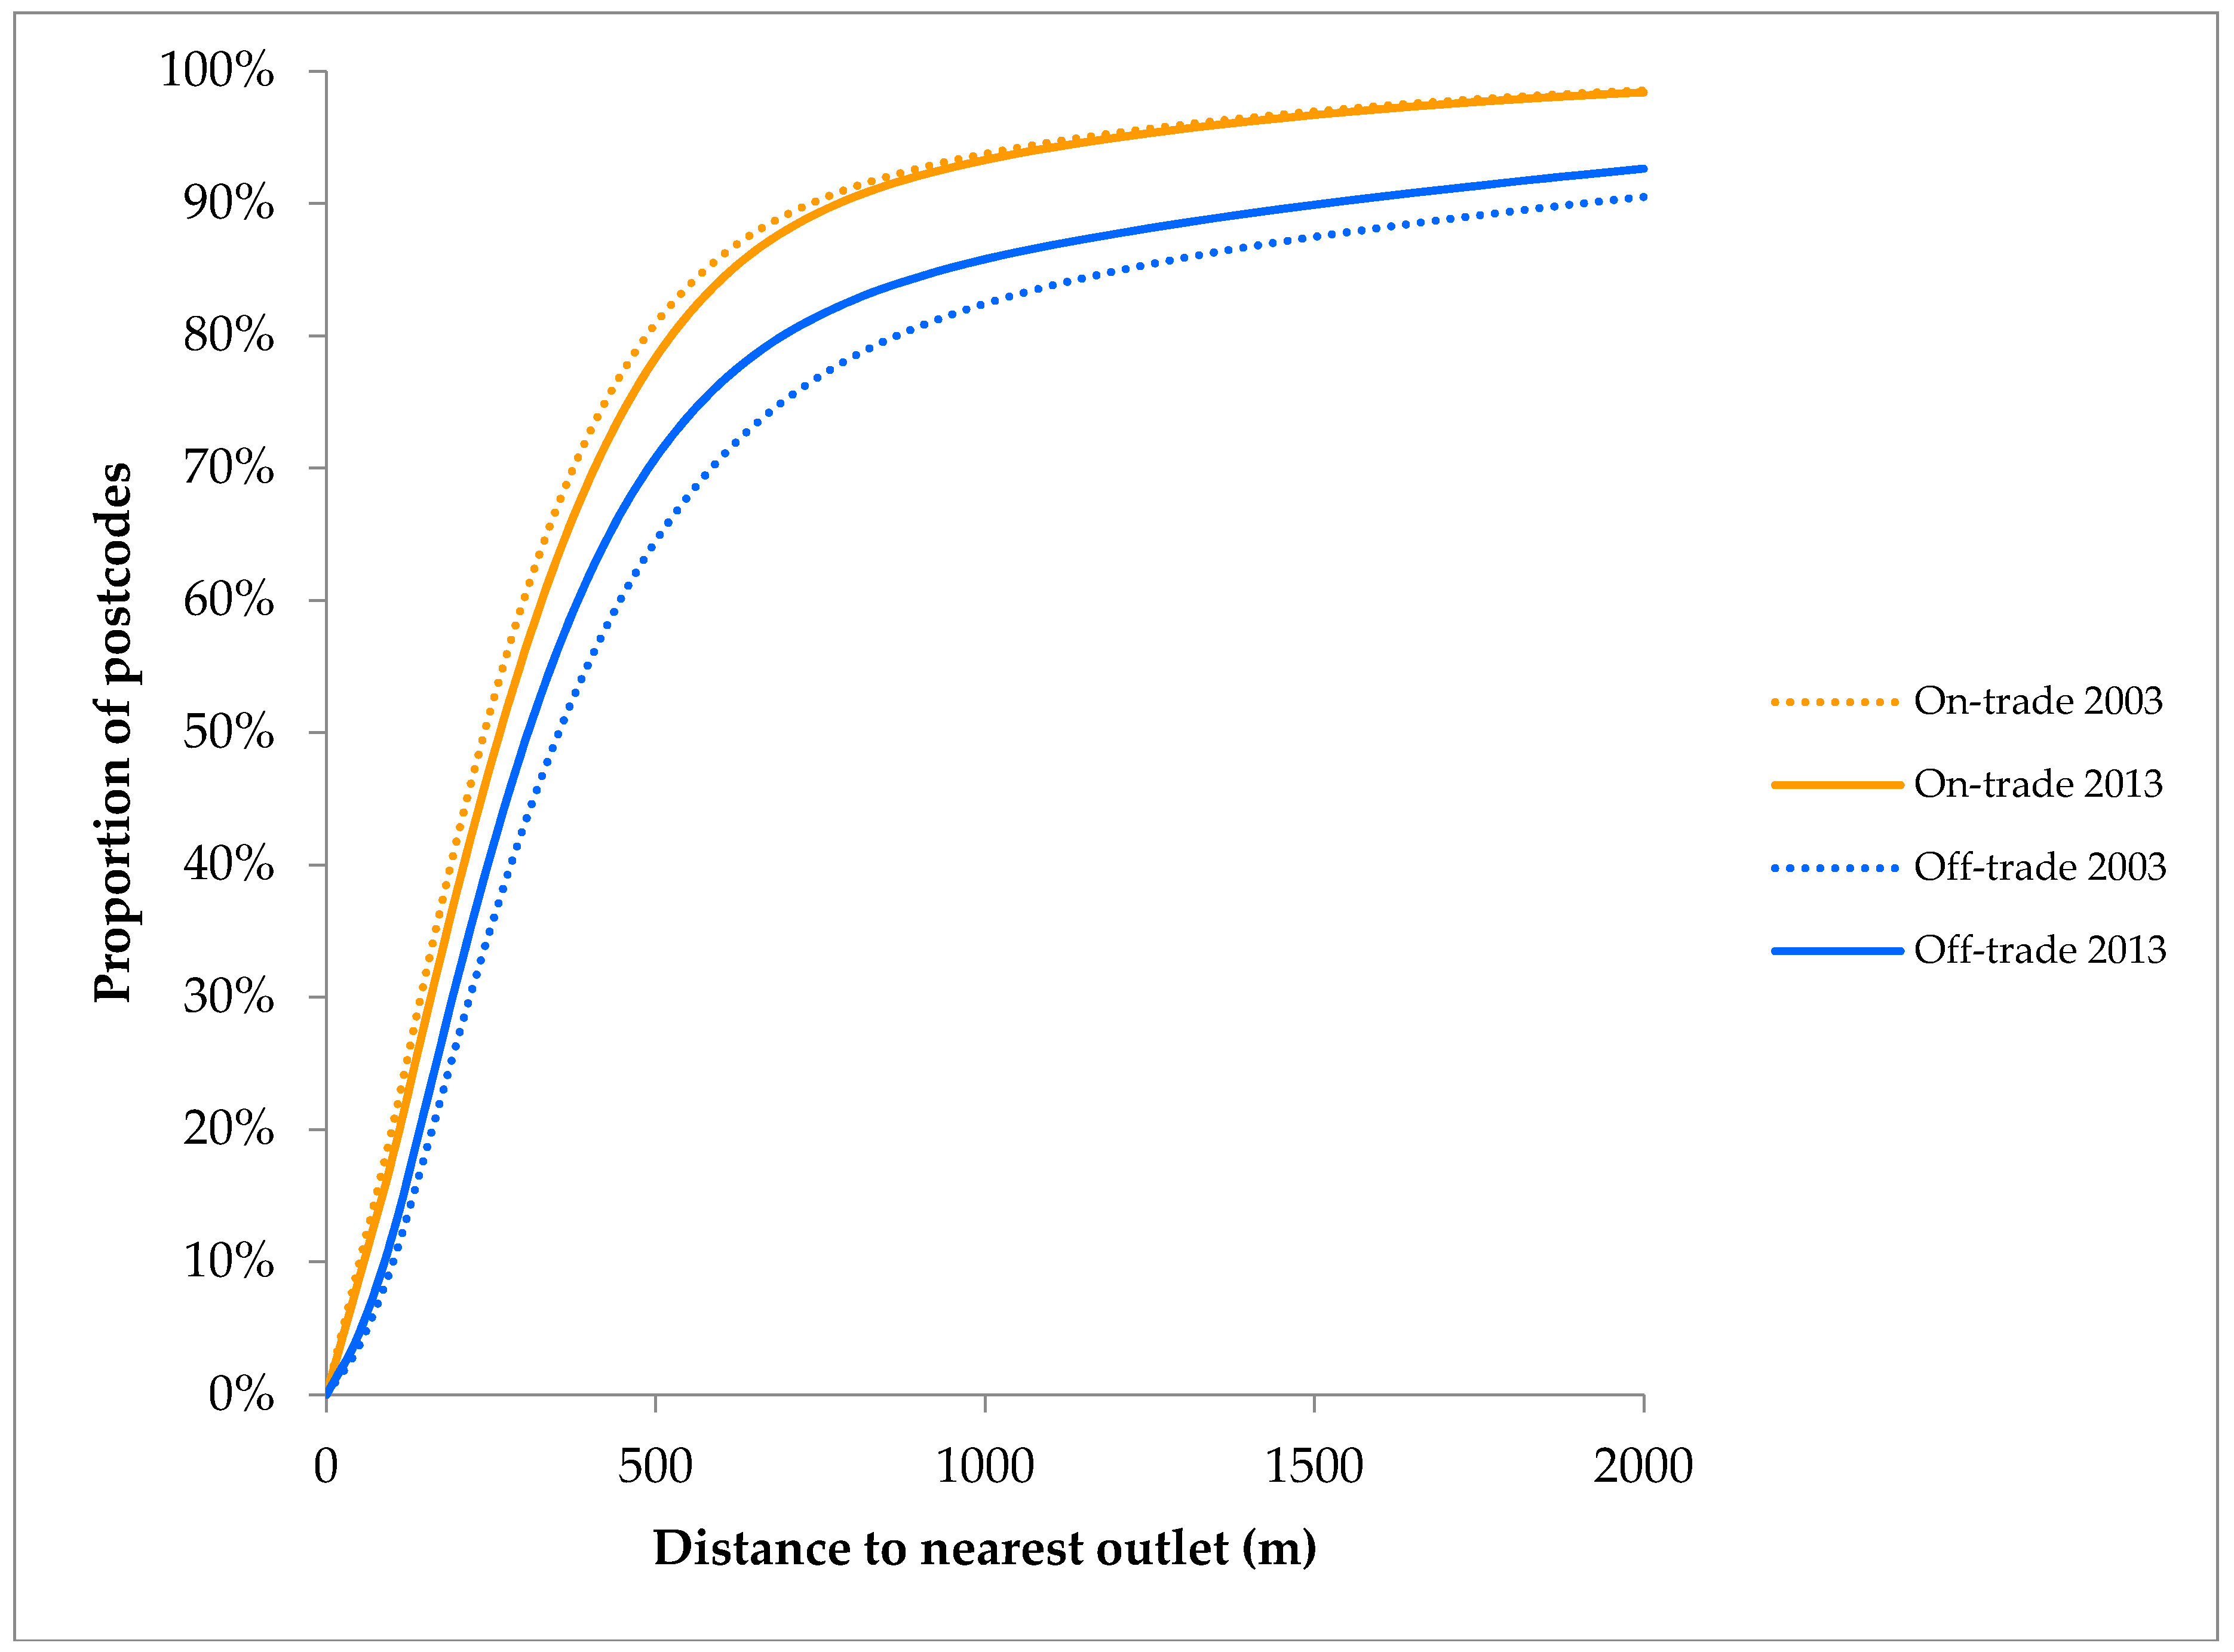
| Outlet proximity (distance to nearest outlet (m)) | Pubs, bars & nightclubs | 471 (167–566) | 467 (167–565) | 484 (174–590) | 501 (182–613) | 31 (0–0) | 6.6% |
| Restaurants | 1469 (429–1843) | 1477 (423–1831) | 1489 (425–1822) | 1424 (407–1712) | −45 (−104–11) | −3.1% | |
| Other on-trade | 653 (206–717) | 667 (214–731) | 679 (222–747) | 724 (241–797) | 71 (0–51) | 10.9% | |
| Supermarkets | 2146 (626–2485) | 1958 (575–2199) | 1888 (535–2086) | 1904 (549–2133) | −242 (0–0) | −11.3% | |
| Convenience stores | 1397 (385–1492) | 1148 (324–1183) | 1122 (314–1139) | 997 (272–953) | −400 (−349–0) | −28.6% | |
| Other off-trade | 1039 (234–1040) | 955 (226–949) | 946 (223–931) | 891 (225–929) | −149 (0–0) | −14.3% | |
| All on-trade | 357 (121–423) | 358 (123–426) | 368 (128–439) | 383 (135–458) | 26 (0–0) | 7.3% | |
| All off-trade | 749 (189–692) | 668 (177–617) | 657 (174–603) | 610 (167–569) | −139 (−5–0) | −18.6% | |
| All outlets | 318 (102–362) | 315 (102–356) | 319 (104–360) | 323 (106–363) | 5 (0–0) | 1.6% | |
| Outlet density (no. of outlets within 1 km) | Pubs, bars & nightclubs | 10.7 (2–10) | 11 (2–11) | 10.2 (2–10) | 9.8 (2–9) | −0.8 (−1–0) | −7.9% |
| Restaurants | 5.3 (0–4) | 5.7 (0–4) | 5.8 (0–4) | 6.4 (0–4) | 1 (0–1) | 19.2% | |
| Other on-trade | 8.3 (1–9) | 7.6 (1–8) | 7.1 (1–8) | 6 (1–6) | −2.4 (−3–0) | −28.3% | |
| Supermarkets | 0.8 (0–1) | 1 (0–2) | 1.2 (0–2) | 1.1 (0–2) | 0.3 (0–0) | 35.6% | |
| Convenience stores | 1.5 (0–2) | 2.1 (0–3) | 2.3 (0–3) | 3.3 (1–4) | 1.8 (0–2) | 118.4% | |
| Other off-trade | 4.4 (0–6) | 4.6 (1–6) | 4.8 (1–6) | 4.7 (1–6) | 0.4 (0–1) | 8.2% | |
| All on-trade | 24.3 (4–24) | 24.3 (4–23) | 23.1 (3–22) | 22.2 (3–20) | −2.2 (−3–0) | −8.9% | |
| All off-trade | 6.7 (1–9) | 7.7 (2–10) | 8.3 (2–11) | 9.1 (2–12) | 2.4 (0–3) | 36.1% | |
| All outlets | 31 (5–33) | 32 (6–34) | 31.3 (6–33) | 31.3 (6–33) | 0.2 (−2–2) | 0.8% | |
| Outlet Type by Deprivation Quintile | Mean Outlet Density (IQR) | Mean Change from 2003 to 2013 | % Change in Mean from 2003 to 2013 | ||||
|---|---|---|---|---|---|---|---|
| 2003 | 2007 | 2010 | 2013 | ||||
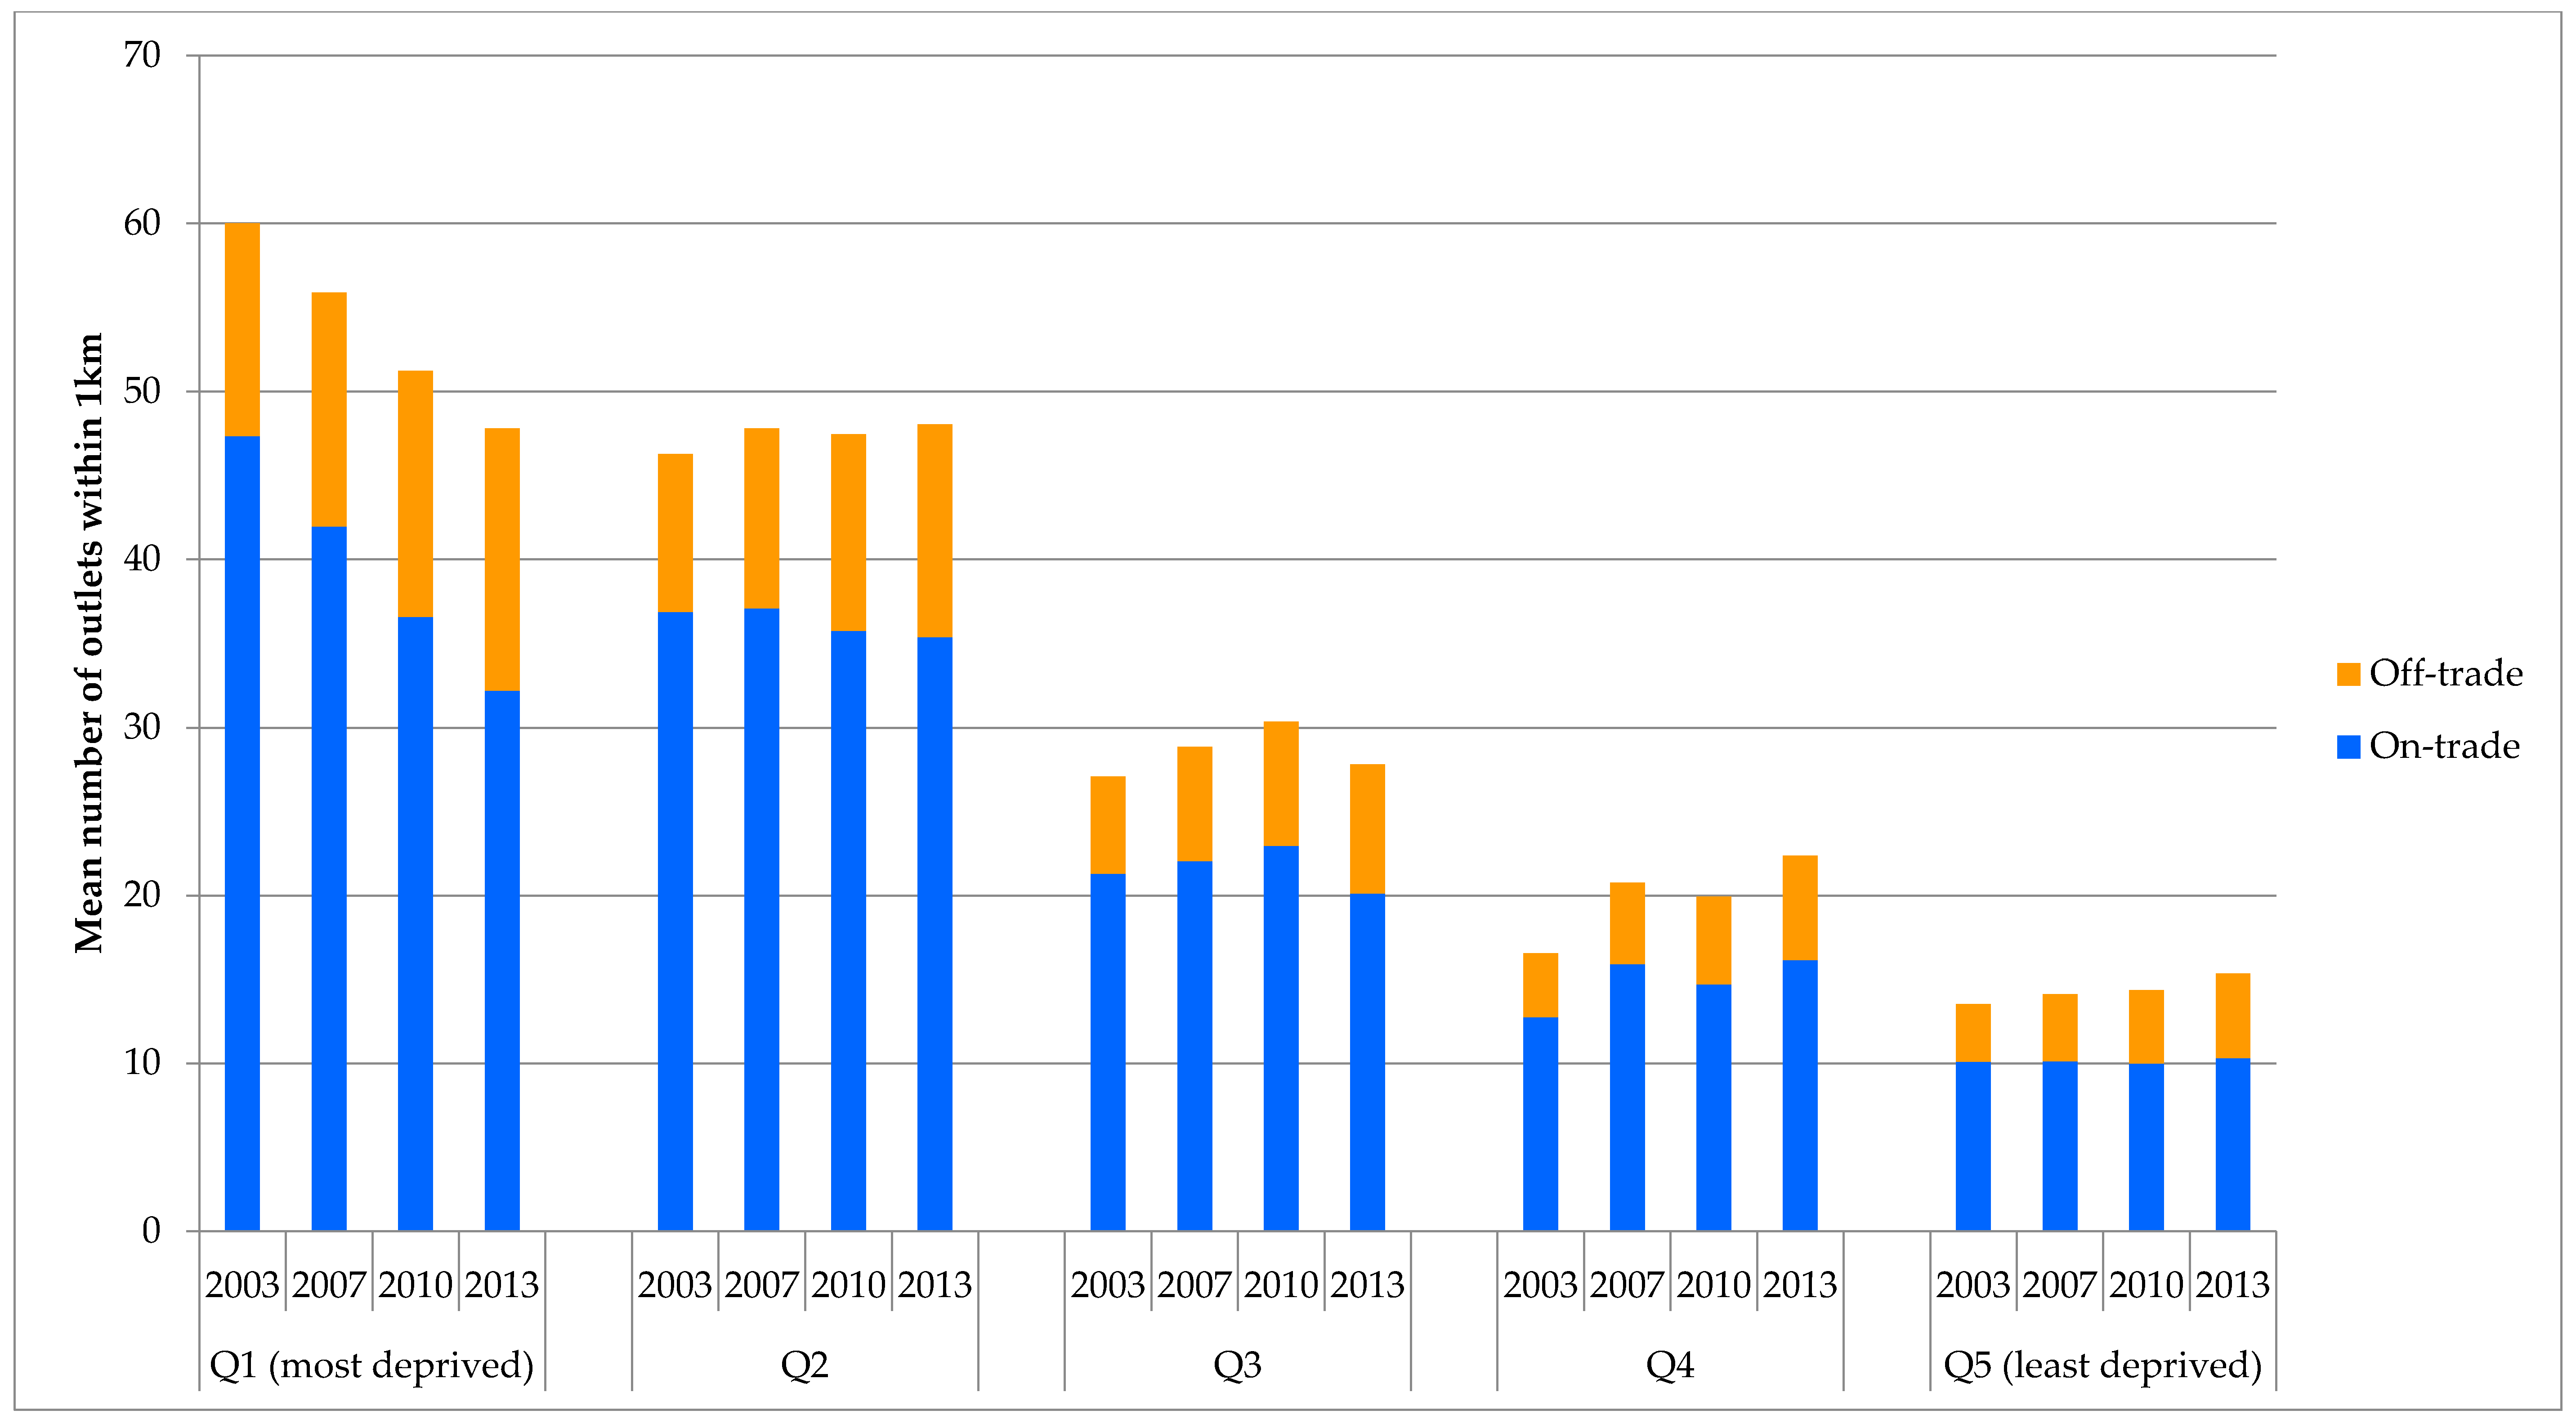
| On-trade | Q1 (most deprived) | 47.3 (10–52) | 42 (10–47) | 36.6 (9–39) | 32.2 (7–34) | −15.1 | −32.0% |
| Q2 | 36.9 (7–36) | 37.1 (7–34) | 35.8 (7–32) | 35.4 (5–29) | −1.5 | −4.1% | |
| Q3 | 21.3 (3–22) | 22.1 (3–21) | 23 (2–20) | 20.1 (2–17) | −1.2 | −5.6% | |
| Q4 | 12.7 (2–14) | 15.9 (2–14) | 14.7 (2–13) | 16.2 (2–14) | 3.4 | 26.8% | |
| Q5 (least deprived) | 10.1 (3–12) | 10.1 (3–12) | 10 (3–11) | 10.3 (3–12) | 0.2 | 2.2% | |
| Off-trade | Q1 (most deprived) | 12.7 (6–18) | 13.9 (7–19) | 14.6 (7–20) | 15.6 (8–21) | 2.9 | 23.1% |
| Q2 | 9.4 (3–13) | 10.7 (4–14) | 11.7 (4–16) | 12.7 (4–17) | 3.3 | 34.9% | |
| Q3 | 5.8 (1–8) | 6.8 (1–9) | 7.4 (1–10) | 7.7 (1–11) | 1.9 | 33.2% | |
| Q4 | 3.8 (0–5) | 4.9 (0–7) | 5.2 (0–7) | 6.2 (1–8) | 2.4 | 62.4% | |
| Q5 (least deprived) | 3.4 (1–5) | 4 (1–6) | 4.4 (1–6) | 5 (2–7) | 1.6 | 47.2% | |
| All outlets | Q1 (most deprived) | 60 (17–70) | 55.9 (17–67) | 51.2 (17–60) | 47.8 (16–55) | −12.2 | −20.4% |
| Q2 | 46.3 (12–49) | 47.8 (12–48) | 47.4 (12–48) | 48.1 (11–47) | 1.8 | 3.8% | |
| Q3 | 27.1 (4–30) | 28.9 (4–31) | 30.4 (4–30) | 27.8 (3–29) | 0.7 | 2.6% | |
| Q4 | 16.6 (2–19) | 20.8 (3–21) | 19.9 (2–21) | 22.4 (3–23) | 5.8 | 35.0% | |
| Q5 (least deprived) | 13.5 (4–17) | 14.1 (4–17) | 14.4 (4–17) | 15.4 (5–18) | 1.8 | 13.6% | |
| Outlet Category by Deprivation Quintile | Mean Outlet Density | Change from 2003 to 2013 | % Change from 2003 to 2013 | |||||
|---|---|---|---|---|---|---|---|---|
| 2003 | 2007 | 2010 | 2013 | |||||
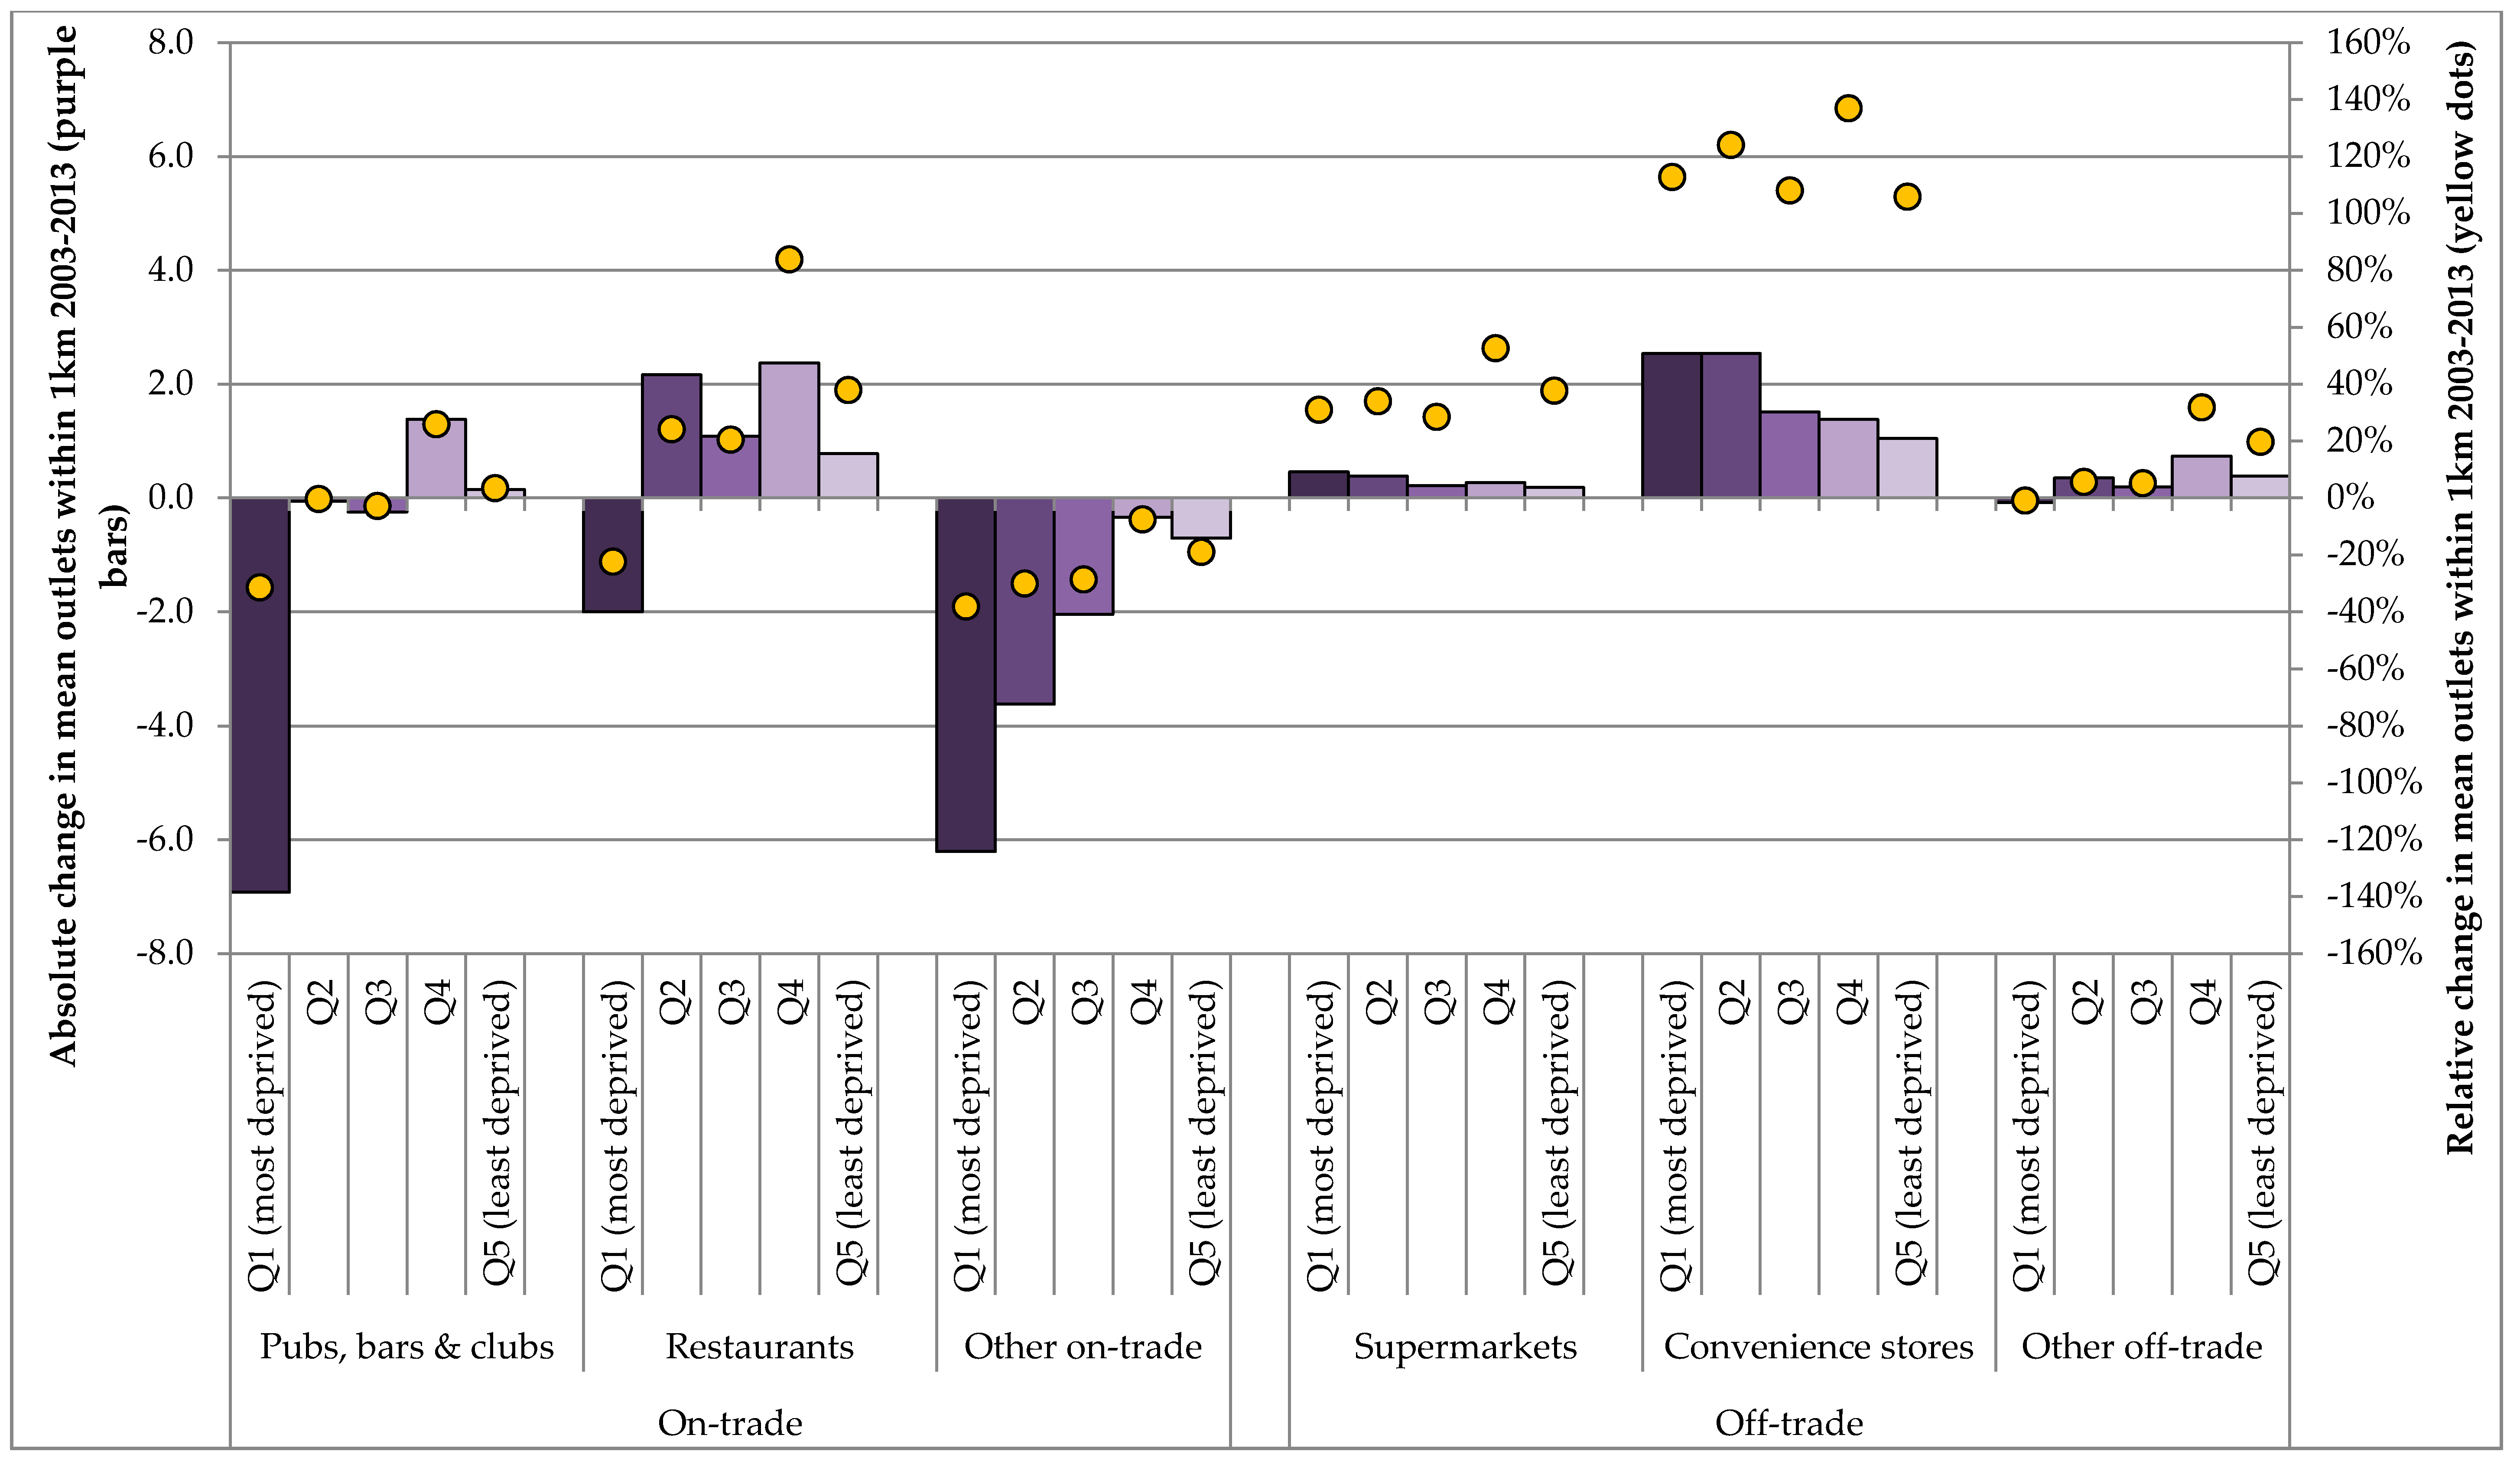
| On-trade | Pubs, bars & clubs | Q1 (most deprived) | 14.9 | 13.7 | 11.8 | 10.4 | −4.5 | −30.2% |
| Q2 | 10.9 | 11.0 | 10.6 | 10.6 | −0.3 | −2.9% | ||
| Q3 | 6.4 | 6.8 | 6.7 | 6.2 | −0.2 | −2.7% | ||
| Q4 | 4.1 | 4.8 | 4.6 | 5.1 | 1.0 | 23.1% | ||
| Q5 (least deprived) | 3.5 | 3.6 | 3.5 | 3.7 | 0.1 | 4.0% | ||
| Restaurants | Q1 (most deprived) | 9.0 | 7.5 | 6.8 | 7.0 | −2.0 | −22.3% | |
| Q2 | 8.9 | 9.5 | 9.8 | 11.1 | 2.2 | 24.2% | ||
| Q3 | 5.3 | 5.7 | 6.8 | 6.4 | 1.1 | 20.6% | ||
| Q4 | 2.8 | 4.4 | 4.2 | 5.2 | 2.4 | 83.9% | ||
| Q5 (least deprived) | 2.0 | 2.1 | 2.3 | 2.8 | 0.8 | 38.0% | ||
| Other on-trade | Q1 (most deprived) | 16.3 | 14.0 | 12.6 | 10.1 | −6.2 | −38.1% | |
| Q2 | 12.1 | 10.9 | 10.1 | 8.4 | −3.6 | −30.0% | ||
| Q3 | 7.1 | 6.7 | 6.5 | 5.1 | −2.0 | −28.6% | ||
| Q4 | 4.6 | 4.9 | 4.4 | 4.2 | −0.3 | −7.5% | ||
| Q5 (least deprived) | 3.7 | 3.6 | 3.4 | 3.0 | −0.7 | −18.9% | ||
| Off-trade | Supermarkets | Q1 (most deprived) | 1.5 | 1.7 | 2.0 | 1.9 | 0.5 | 31.1% |
| Q2 | 1.1 | 1.3 | 1.6 | 1.5 | 0.4 | 34.0% | ||
| Q3 | 0.8 | 0.9 | 1.1 | 1.0 | 0.2 | 28.6% | ||
| Q4 | 0.5 | 0.6 | 0.7 | 0.8 | 0.3 | 52.7% | ||
| Q5 (least deprived) | 0.5 | 0.6 | 0.7 | 0.7 | 0.2 | 37.8% | ||
| Convenience stores | Q1 (most deprived) | 2.2 | 3.2 | 3.3 | 4.8 | 2.5 | 112.8% | |
| Q2 | 2.0 | 3.0 | 3.2 | 4.6 | 2.5 | 124.1% | ||
| Q3 | 1.4 | 2.0 | 2.1 | 2.9 | 1.5 | 108.1% | ||
| Q4 | 1.0 | 1.5 | 1.6 | 2.4 | 1.4 | 137.0% | ||
| Q5 (least deprived) | 1.0 | 1.3 | 1.4 | 2.0 | 1.0 | 105.9% | ||
| Other off-trade | Q1 (most deprived) | 8.9 | 9.1 | 9.3 | 8.9 | −0.1 | −0.9% | |
| Q2 | 6.2 | 6.4 | 6.8 | 6.6 | 0.4 | 5.7% | ||
| Q3 | 3.6 | 3.9 | 4.2 | 3.8 | 0.2 | 5.3% | ||
| Q4 | 2.3 | 2.7 | 2.9 | 3.0 | 0.7 | 31.9% | ||
| Q5 (least deprived) | 1.9 | 2.1 | 2.3 | 2.3 | 0.4 | 19.8% | ||
© 2017 by the authors. Licensee MDPI, Basel, Switzerland. This article is an open access article distributed under the terms and conditions of the Creative Commons Attribution (CC BY) license (http://creativecommons.org/licenses/by/4.0/).
Share and Cite
Angus, C.; Holmes, J.; Maheswaran, R.; Green, M.A.; Meier, P.; Brennan, A. Mapping Patterns and Trends in the Spatial Availability of Alcohol Using Low-Level Geographic Data: A Case Study in England 2003–2013. Int. J. Environ. Res. Public Health 2017, 14, 406. https://doi.org/10.3390/ijerph14040406
Angus C, Holmes J, Maheswaran R, Green MA, Meier P, Brennan A. Mapping Patterns and Trends in the Spatial Availability of Alcohol Using Low-Level Geographic Data: A Case Study in England 2003–2013. International Journal of Environmental Research and Public Health. 2017; 14(4):406. https://doi.org/10.3390/ijerph14040406
Chicago/Turabian StyleAngus, Colin, John Holmes, Ravi Maheswaran, Mark A. Green, Petra Meier, and Alan Brennan. 2017. "Mapping Patterns and Trends in the Spatial Availability of Alcohol Using Low-Level Geographic Data: A Case Study in England 2003–2013" International Journal of Environmental Research and Public Health 14, no. 4: 406. https://doi.org/10.3390/ijerph14040406
APA StyleAngus, C., Holmes, J., Maheswaran, R., Green, M. A., Meier, P., & Brennan, A. (2017). Mapping Patterns and Trends in the Spatial Availability of Alcohol Using Low-Level Geographic Data: A Case Study in England 2003–2013. International Journal of Environmental Research and Public Health, 14(4), 406. https://doi.org/10.3390/ijerph14040406