
Heat Wave Vulnerability Mapping for India

Abstract
:1. Introduction
2. Materials and Methods
2.1. Data Sources
2.2. Choice of Variables
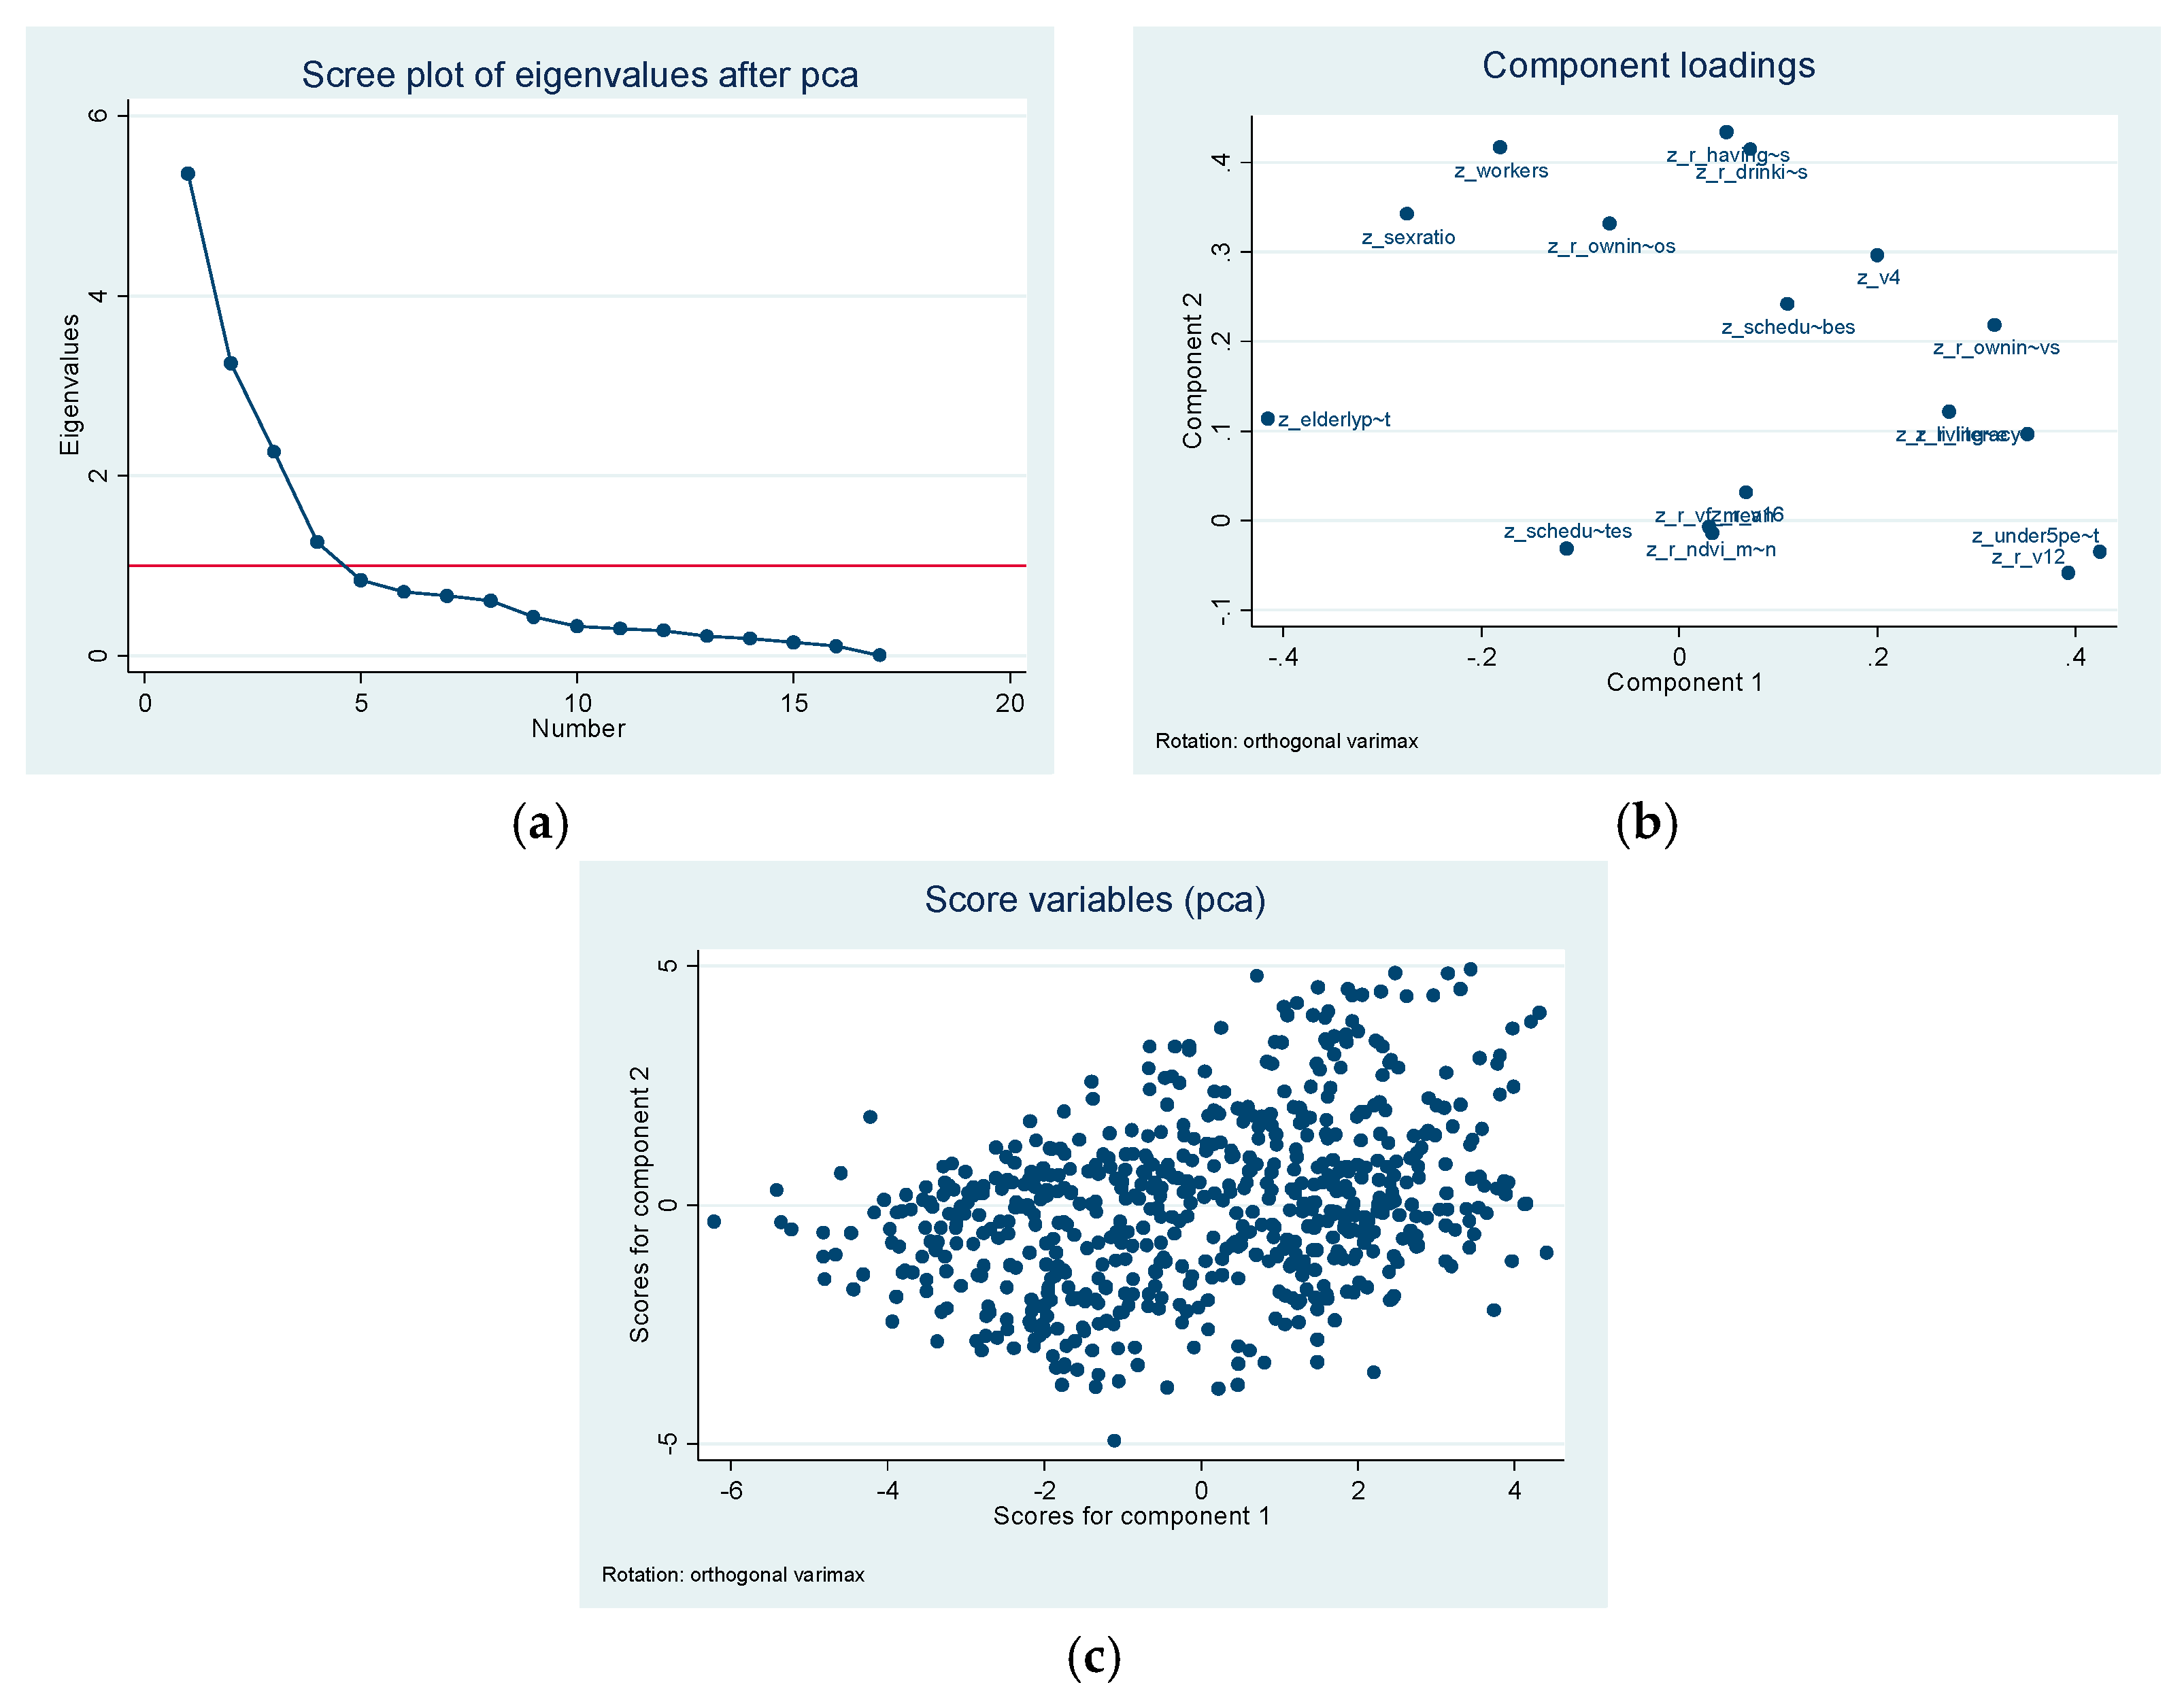
2.3. Data Analysis
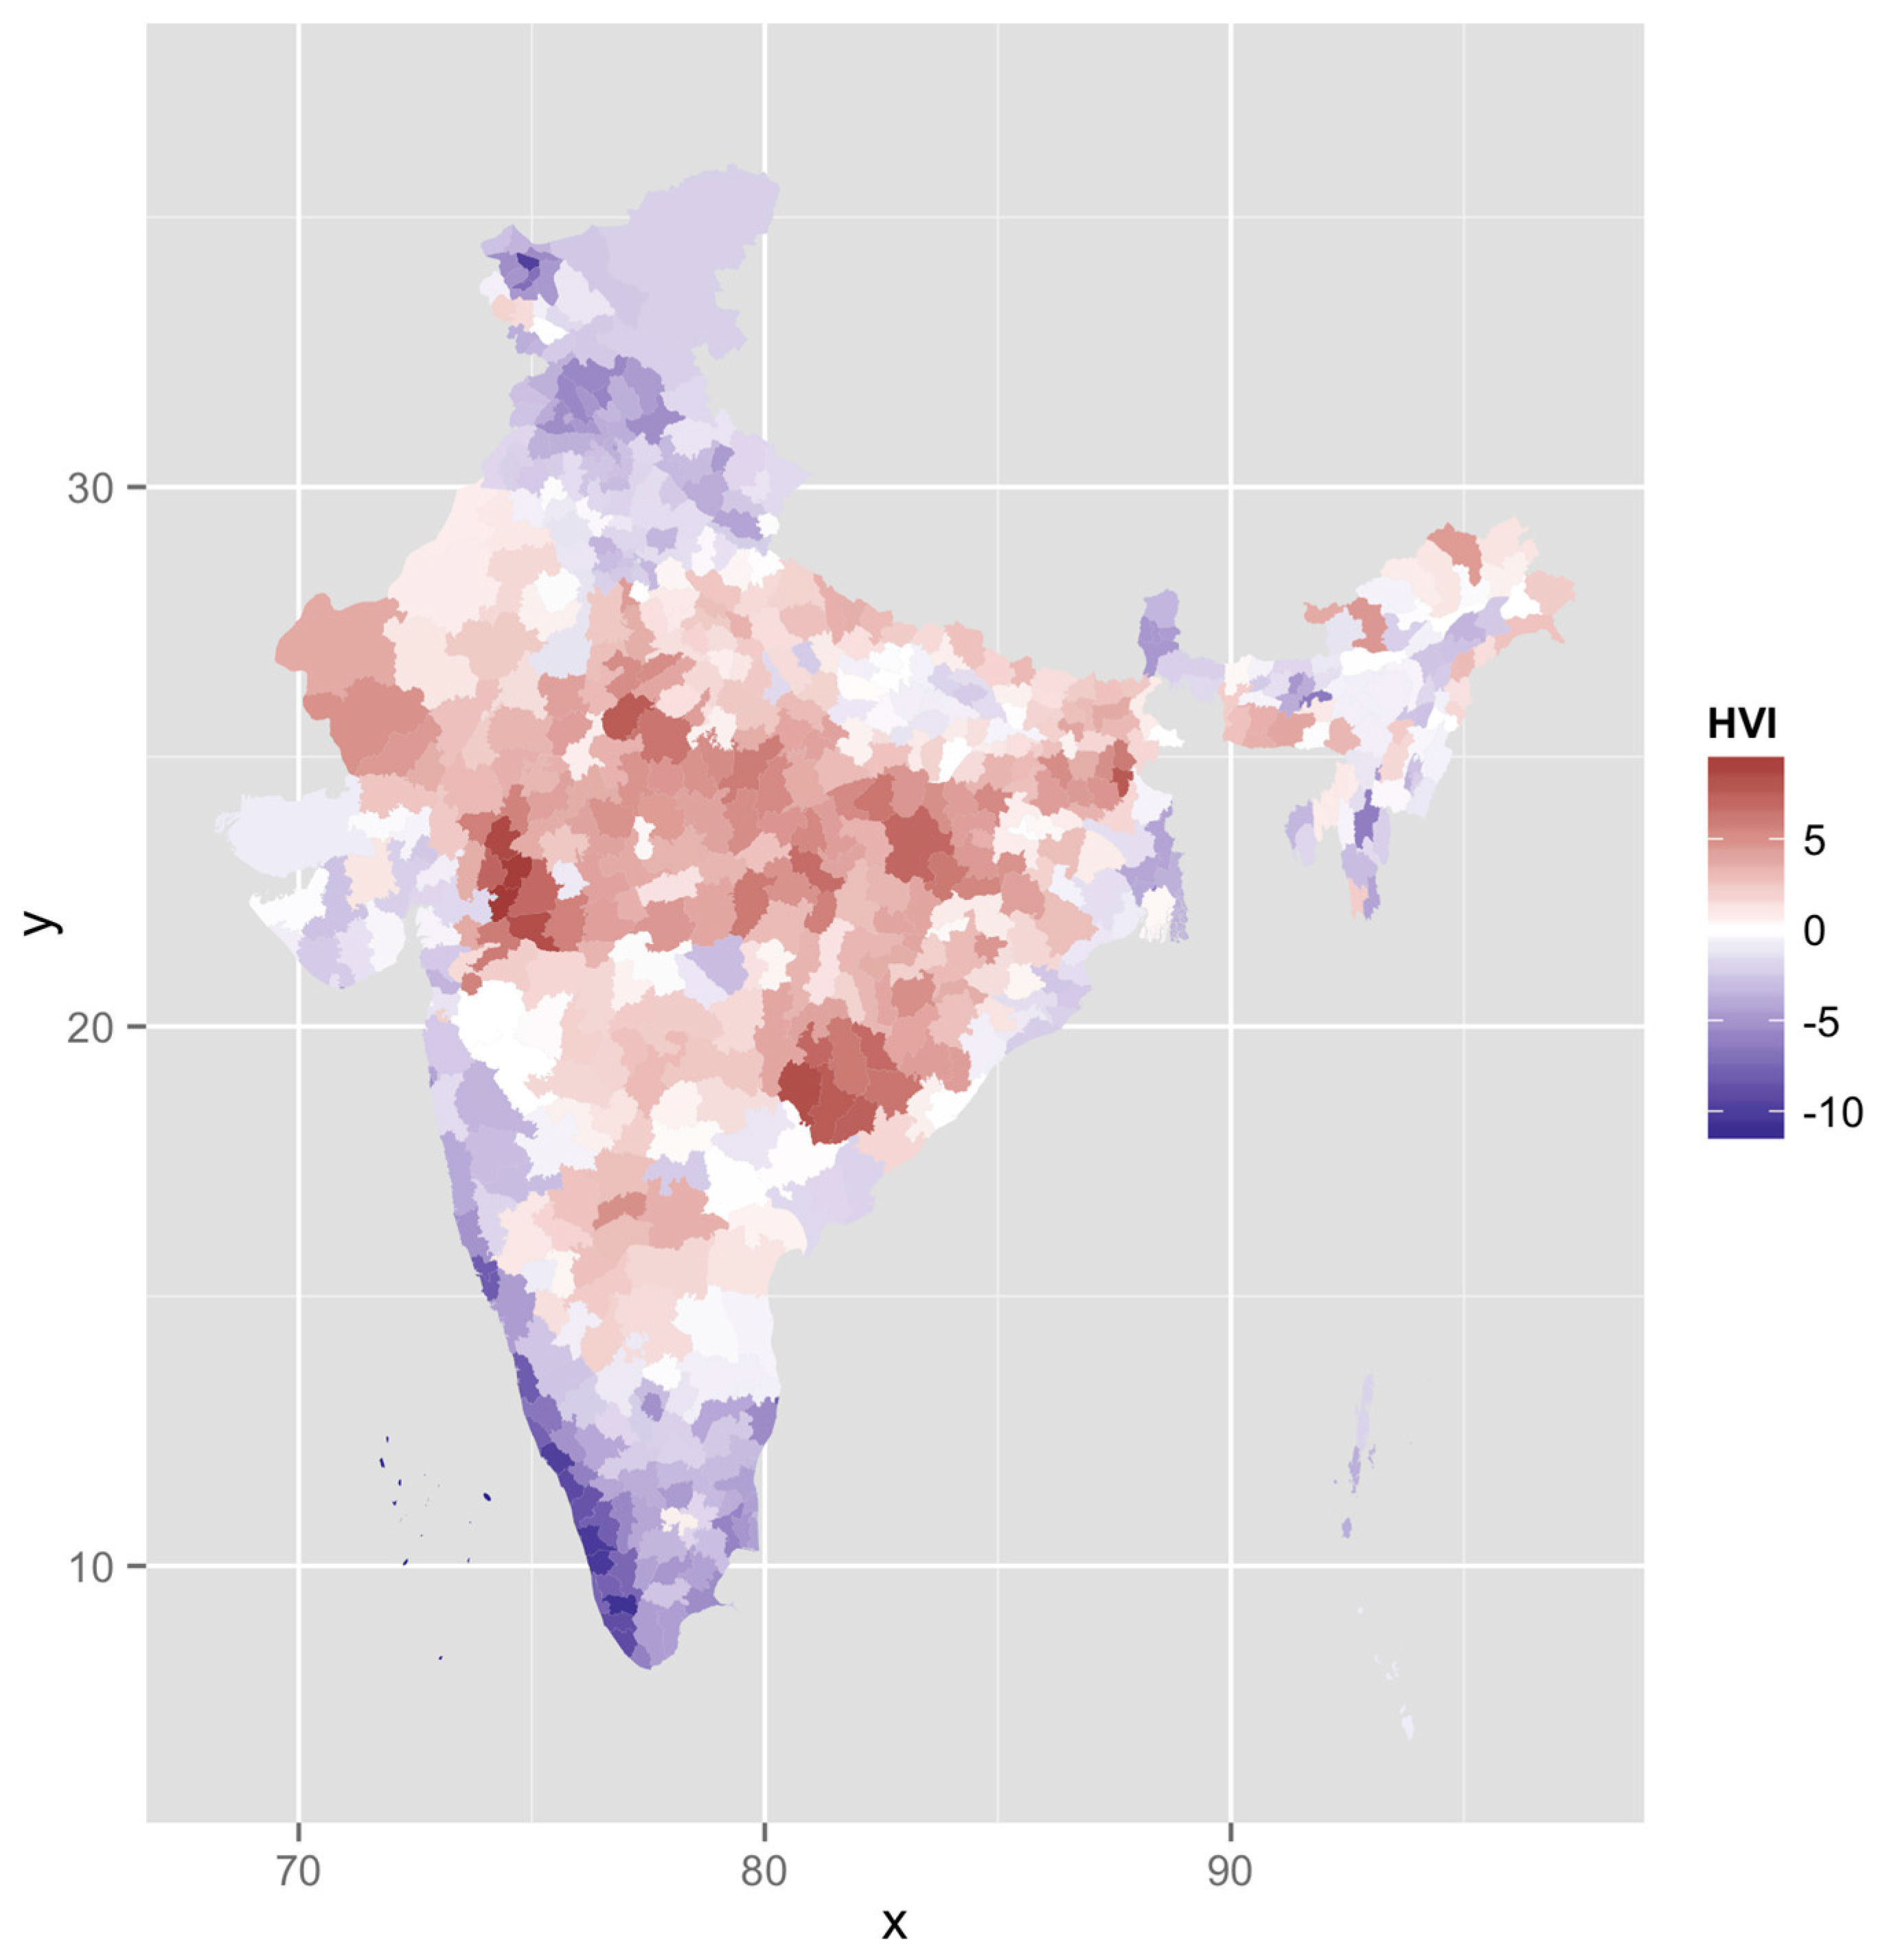
3. Results
4. Discussion
5. Conclusions
Acknowledgments
Author Contributions
Conflicts of Interest
References
- Parry, M.L. Climate Change 2007-Impacts, Adaptation and Vulnerability: Working Group II Contribution to the Fourth Assessment Report of the Ipcc; Cambridge University Press: Cambridge, UK, 2007; Volume 4. [Google Scholar]
- Robine, J.-M.; Cheung, S.L.K.; Le Roy, S.; Van Oyen, H.; Griffiths, C.; Michel, J.-P.; Herrmann, F.R. Death toll exceeded 70,000 in Europe during the summer of 2003. Comptes Rendus Biol. 2008, 331, 171–178. [Google Scholar] [CrossRef] [PubMed]
- Fouillet, A.; Rey, G.; Laurent, F.; Pavillon, G.; Bellec, S.; Guihenneuc-Jouyaux, C.; Clavel, J.; Jougla, E.; Hémon, D. Excess mortality related to the august 2003 heat wave in France. Int. Arch. Occup. Environ. Health 2006, 80, 16–24. [Google Scholar] [CrossRef] [PubMed]
- Shaposhnikov, D.; Revich, B.; Bellander, T.; Bedada, G.B.; Bottai, M.; Kharkova, T.; Kvasha, E.; Lezina, E.; Lind, T.; Semutnikova, E. Mortality related to air pollution with the moscow heat wave and wildfire of 2010. Epidemiology 2014, 25, 359–364. [Google Scholar] [CrossRef] [PubMed]
- Liberto, T.D. India heat wave kills thousands. In Event Tracker; Climate Government: Washington DC, USA, 2015. [Google Scholar]
- Curriero, F.C.; Heiner, K.S.; Samet, J.M.; Zeger, S.L.; Strug, L.; Patz, J.A. Temperature and mortality in 11 cities of the eastern United States. Am. J. Epidemiol. 2002, 155, 80–87. [Google Scholar] [CrossRef] [PubMed]
- Mastrangelo, G.; Fedeli, U.; Visentin, C.; Milan, G.; Fadda, E.; Spolaore, P. Pattern and determinants of hospitalization during heat waves: An ecologic study. BMC Public Health 2007, 7, 200. [Google Scholar] [CrossRef] [PubMed]
- Hess, J.J.; Saha, S.; Luber, G. Summertime acute heat illness in us emergency departments from 2006 through 2010: Analysis of a nationally representative sample. Environ. Health Perspect. 2014, 122, 1209. [Google Scholar] [PubMed]
- Knowlton, K.; Rotkin-Ellman, M.; King, G.; Margolis, H.G.; Smith, D.; Solomon, G.; Trent, R.; English, P. The 2006 california heat wave: Impacts on hospitalizations and emergency department visits. Environ. Health Perspect. 2009, 117, 61. [Google Scholar] [CrossRef] [PubMed]
- Azhar, G.S.; Mavalankar, D.; Nori-Sarma, A.; Rajiva, A.; Dutta, P.; Jaiswal, A.; Sheffield, P.; Knowlton, K.; Hess, J.J. Heat-related mortality in india: Excess all-cause mortality associated with the 2010 ahmedabad heat wave. PLoS ONE 2014, 9, e91831. [Google Scholar]
- Azhar, G.S.; Rajiva, A.; Dutta, P.; Mavalankar, D. Research and policy disconnect for heat wave deaths in India. Curr. Sci. 2014, 107, 1091–1092. [Google Scholar]
- Ebi, K.L.; Teisberg, T.J.; Kalkstein, L.S.; Robinson, L.; Weiher, R.F. Heat watch/warning systems save lives: Estimated costs and benefits for Philadelphia 1995–1998. Bull. Am. Meteorol. Soc. 2004, 85, 1067–1073. [Google Scholar] [CrossRef]
- Sheridan, S.C.; Dixon, P.G. Spatiotemporal trends in human vulnerability and adaptation to heat across the United States. Anthropocene 2016. [Google Scholar] [CrossRef]
- Knowlton, K.; Kulkarni, S.P.; Azhar, G.S.; Mavalankar, D.; Jaiswal, A.; Connolly, M.; Nori-Sarma, A.; Rajiva, A.; Dutta, P.; Deol, B. Development and implementation of South Asia’s first heat-health action plan in Ahmedabad (Gujarat, India). Int. J. Environ. Res. Public Health 2014, 11, 3473–3492. [Google Scholar] [CrossRef] [PubMed]
- Watts, N.; Adger, W.N.; Agnolucci, P.; Blackstock, J.; Byass, P.; Cai, W.; Chaytor, S.; Colbourn, T.; Collins, M.; Cooper, A. Health and climate change: Policy responses to protect public health. Lancet 2015, 386, 1861–1914. [Google Scholar] [CrossRef]
- Bao, J.; Li, X.; Yu, C. The construction and validation of the heat vulnerability index, a review. Int. J. Environ. Res. Public Health 2015, 12, 7220–7234. [Google Scholar] [CrossRef] [PubMed]
- Reid, C.E.; O’Neill, M.S.; Gronlund, C.J.; Brines, S.J.; Diez-Roux, A.V.; Brown, D.G.; Schwartz, J.D. Mapping community determinants of heat vulnerability. Environ. Health Perspect. 2009, 117, 1730–1736. [Google Scholar] [CrossRef] [PubMed]
- Johnson, D.P.; Stanforth, A.; Lulla, V.; Luber, G. Developing an applied extreme heat vulnerability index utilizing socioeconomic and environmental data. Appl. Geogr. 2012, 35, 23–31. [Google Scholar] [CrossRef]
- Wolf, T.; McGregor, G. The development of a heat wave vulnerability index for london, United Kingdom. Weather Clim. Extrem. 2013, 1, 59–68. [Google Scholar] [CrossRef]
- Madrigano, J.; Ito, K.; Johnson, S.; Kinney, P.L.; Matte, T. A case-only study of vulnerability to heat wave-related mortality in New York city (2000–2011). Environ. Health Perspect. 2015. [Google Scholar] [CrossRef] [PubMed]
- Rama Rao, C.; Raju, B.; Subba Rao, A.; Rao, K.; Rao, V.; Ramachandran, K.; Venkateswarlu, B.; Sikka, A.; Srinivasa Rao, M.; Maheswari, M. A district level assessment of vulnerability of indian agriculture to climate change. Curr. Sci. 2016, 110, 1939. [Google Scholar] [CrossRef]
- International Institute for Population Sciences. District Level Household and Facility Survey 2007–2008; DLHS-3; Ministry of Health and Family Welfare, Government of India: New Delhi, India, 2010.
- Conti, S.; Masocco, M.; Meli, P.; Minelli, G.; Palummeri, E.; Solimini, R.; Toccaceli, V.; Vichi, M. General and specific mortality among the elderly during the 2003 heat wave in Genoa (Italy). Environ. Res. 2007, 103, 267–274. [Google Scholar] [CrossRef] [PubMed]
- Hutter, H.-P.; Moshammer, H.; Wallner, P.; Leitner, B.; Kundi, M. Heatwaves in Vienna: Effects on mortality. Wien. Klin. Wochenschr. 2007, 119, 223–227. [Google Scholar] [CrossRef] [PubMed]
- Naughton, M.P.; Henderson, A.; Mirabelli, M.C.; Kaiser, R.; Wilhelm, J.L.; Kieszak, S.M.; Rubin, C.H.; McGeehin, M.A. Heat-related mortality during a 1999 heat wave in Chicago. Am. J. Prev. Med. 2002, 22, 221–227. [Google Scholar] [CrossRef]
- Stafoggia, M.; Forastiere, F.; Agostini, D.; Biggeri, A.; Bisanti, L.; Cadum, E.; Caranci, N.; de’Donato, F.; De Lisio, S.; De Maria, M. Vulnerability to heat-related mortality: A multicity, population-based, case-crossover analysis. Epidemiology 2006, 17, 315–323. [Google Scholar] [CrossRef] [PubMed]
- Whitman, S.; Good, G.; Donoghue, E.R.; Benbow, N.; Shou, W.; Mou, S. Mortality in Chicago attributed to the July 1995 heat wave. Am. J. Public Health 1997, 87, 1515–1518. [Google Scholar] [CrossRef] [PubMed]
- Centers for Disease Control and Prevention. Heat-related deaths—Los Angeles County, California, 1999–2000, and United States, 1979–1998. MMWR: Morb. Mortal. Wkly. Rep. 2001, 50, 623–626. [Google Scholar]
- Kim, Y.; Joh, S. A vulnerability study of the low-income elderly in the context of high temperature and mortality in Seoul, Korea. Sci. Total Environ. 2006, 371, 82–88. [Google Scholar] [CrossRef] [PubMed]
- Medina-Ramón, M.; Zanobetti, A.; Cavanagh, D.P.; Schwartz, J. Extreme temperatures and mortality: Assessing effect modification by personal characteristics and specific cause of death in a multi-city case-only analysis. Environ. Health Perspect. 2006, 1331–1336. [Google Scholar] [CrossRef]
- Semenza, J.C.; McCullough, J.E.; Flanders, W.D.; McGeehin, M.A.; Lumpkin, J.R. Excess hospital admissions during the July 1995 heat wave in Chicago. Am. J. Prev. Med. 1999, 16, 269–277. [Google Scholar] [CrossRef]
- Tran, K.V.; Azhar, G.S.; Nair, R.; Knowlton, K.; Jaiswal, A.; Sheffield, P.; Mavalankar, D.; Hess, J. A cross-sectional, randomized cluster sample survey of household vulnerability to extreme heat among slum dwellers in Ahmedabad, India. Int. J. Environ. Res. Public Health 2013, 10, 2515–2543. [Google Scholar] [CrossRef] [PubMed]
- Kakkad, K.; Barzaga, M.L.; Wallenstein, S.; Azhar, G.S.; Sheffield, P.E. Neonates in Ahmedabad, India, during the 2010 heat wave: A climate change adaptation study. J. Environ. Public Health 2014, 2014, 946875. [Google Scholar] [CrossRef] [PubMed]
- Braga, A.L.F.; Zanobetti, A.; Schwartz, J. The time course of weather-related deaths. Epidemiology 2001, 12, 662–667. [Google Scholar] [CrossRef] [PubMed]
- Kalkstein, L.S.; Davis, R.E. Weather and human mortality: An evaluation of demographic and interregional responses in the United States. Ann. Assoc. Am. Geogr. 1989, 79, 44–64. [Google Scholar] [CrossRef]
- Barreca, A.; Clay, K.; Deschenes, O.; Greenstone, M.; Shapiro, J.S. Adapting to Climate Change: The Remarkable Decline in the US Temperature-Mortality Relationship over the 20th Century; National Bureau of Economic Research: Cambridge, MA, USA, 2013. [Google Scholar]
- Kilbourne, E.M.; Choi, K.; Jones, T.S.; Thacker, S.B. Risk factors for heatstroke: A case-control study. JAMA 1982, 247, 3332–3336. [Google Scholar] [CrossRef] [PubMed]
- Balakrishnan, K.; Rajarathnam, U. Public Health and Air Pollution in Asia (PAPA): Coordinated Studies of Short-Term Exposure to Air Pollution and Daily Mortality in Two INDIAN Cities; Research Report; Health Effects Institute: Boston, MA, USA, 2011. [Google Scholar]
- Sheridan, S.C.; Dolney, T.J. Heat, mortality, and level of urbanization: Measuring vulnerability across Ohio, USA. Clim. Res. 2003, 24, 255–265. [Google Scholar] [CrossRef]
- Madrigano, J.; Jack, D.; Anderson, G.B.; Bell, M.L.; Kinney, P.L. Temperature, ozone, and mortality in urban and non-urban counties in the northeastern United States. Environ. Health 2015, 14, 3. [Google Scholar] [CrossRef] [PubMed]


| Category | Source | Variable | Mean | Standard Deviation | Minimum | Maximum | |
|---|---|---|---|---|---|---|---|
| 1 | Demographic | Census 2011 | Elderly (%) | 6.941611 | 1.85144 | 1.911948 | 16.31032 |
| 2 | Demographic | Census 2011 | Under five (%) | 11.77559 | 2.430698 | 6.39814 | 19.94178 |
| 3 | Demographic | Census 2011 | Sex ratio | 945.4773 | 60.60111 | 533.5676 | 1184.402 |
| 4 | Social Class | Census 2011 | Scheduled castes (%) | 14.85952 | 9.127914 | 0 | 50.17002 |
| 5 | Social Class | Census 2011 | Scheduled tribes (%) | 17.70213 | 26.97455 | 0 | 98.57509 |
| 6 | Socio-economic | Census 2011 | Literacy (%) | 62.4771 | 10.52398 | 28.77288 | 88.73746 |
| 7 | Socio-economic | Census 2011 | Workers (%) | 41.19976 | 7.02642 | 25.83138 | 66.8953 |
| 8 | Socio-economic | DLHS 3 | Lowest wealth quintile (%) | 18.69547 | 17.8634 | 0 | 85 |
| 9 | Household Amenities | Census 2011 | Drinking water inside premises (%) | 42.35347 | 22.93822 | 2.426598 | 93.86555 |
| 10 | Household Amenities | Census 2011 | Living in a good house (%) | 51.01322 | 14.27142 | 13.01783 | 88.05314 |
| 11 | Household Amenities | Census 2011 | Having only mobiles (%) | 51.21369 | 14.46154 | 7.97389 | 79.62046 |
| 12 | Household Amenities | Census 2011 | Owning radios (%) | 20.44393 | 11.38917 | 2.827992 | 77.2401 |
| 13 | Household Amenities | Census 2011 | Owning TVs (%) | 43.6372 | 24.04314 | 5.787766 | 95.40281 |
| 14 | Population Health | DLHS 3 | Children (12–23 months) fully immunized (%) | 56.89797 | 21.96324 | 3.8 | 100 |
| 15 | Population Health | DLHS 3 | Villages having Sub-Center within 3 km (%) | 69.91922 | 18.23694 | 0 | 100 |
| 16 | Land Cover | ISRO | Vegetation Fraction | 73.24128 | 38.98999 | 10.60944 | 255 |
| 17 | Land Cover | ISRO | Normalized Difference Vegetation Index | 84.19634 | 32.20057 | 35.78857 | 255 |
| Variable | Factor 1 | Factor 2 | Factor 3 | Factor 4 |
|---|---|---|---|---|
| Elderly | –0.41 | 0.11 | 0.13 | –0.19 |
| Under five | 0.42 | –0.03 | –0.01 | –0.05 |
| Sex ratio | –0.27 | 0.34 | –0.10 | –0.25 |
| Scheduled castes | –0.11 | –0.03 | 0.38 | –0.20 |
| Scheduled tribes | 0.11 | 0.24 | –0.30 | 0.24 |
| Literacy | 0.35 | 0.10 | 0.10 | –0.04 |
| Workers | –0.18 | 0.42 | –0.01 | 0.33 |
| Lowest wealth quintile | 0.20 | 0.30 | 0.13 | –0.18 |
| Drinking water inside premises | 0.07 | 0.41 | 0.01 | 0.07 |
| Living in a good house | 0.27 | 0.12 | 0.02 | –0.39 |
| Having only mobiles | 0.05 | 0.43 | –0.10 | –0.07 |
| Owning radios | –0.07 | 0.33 | 0.30 | 0.09 |
| Owning TVs | 0.32 | 0.22 | 0.03 | –0.15 |
| Children (12–23 months) fully immunized | 0.39 | –0.06 | 0.02 | 0.10 |
| Villages having sub-center within 3 km | 0.07 | 0.03 | 0.08 | 0.66 |
| Vegetation fraction | 0.03 | –0.01 | 0.55 | 0.10 |
| Normalized difference vegetation index | 0.03 | –0.01 | 0.55 | 0.08 |
| HVI Category | Number (%) of Districts |
|---|---|
| Very high | 10 (1.56) |
| High | 97 (15.16) |
| High normal | 213 (33.28) |
| Low normal | 225 (35.16) |
| Low | 75 (11.72) |
| Very low | 20 (3.13) |
| District | State |
|---|---|
| Dakshin Bastar Dantewada | Chhattisgarh |
| Pakur | Jharkhand |
| Alirajpur | Madhya Pradesh |
| Sheopur | Madhya Pradesh |
| Barwani | Madhya Pradesh |
| Banswara | Rajasthan |
| Jhabua | Madhya Pradesh |
| Malkangiri | Odisha |
| Dohad | Gujarat |
| Bijapur | Chhattisgarh |
© 2017 by the authors. Licensee MDPI, Basel, Switzerland. This article is an open access article distributed under the terms and conditions of the Creative Commons Attribution (CC BY) license (http://creativecommons.org/licenses/by/4.0/).
Share and Cite
Azhar, G.; Saha, S.; Ganguly, P.; Mavalankar, D.; Madrigano, J. Heat Wave Vulnerability Mapping for India. Int. J. Environ. Res. Public Health 2017, 14, 357. https://doi.org/10.3390/ijerph14040357
Azhar G, Saha S, Ganguly P, Mavalankar D, Madrigano J. Heat Wave Vulnerability Mapping for India. International Journal of Environmental Research and Public Health. 2017; 14(4):357. https://doi.org/10.3390/ijerph14040357
Chicago/Turabian StyleAzhar, Gulrez, Shubhayu Saha, Partha Ganguly, Dileep Mavalankar, and Jaime Madrigano. 2017. "Heat Wave Vulnerability Mapping for India" International Journal of Environmental Research and Public Health 14, no. 4: 357. https://doi.org/10.3390/ijerph14040357
APA StyleAzhar, G., Saha, S., Ganguly, P., Mavalankar, D., & Madrigano, J. (2017). Heat Wave Vulnerability Mapping for India. International Journal of Environmental Research and Public Health, 14(4), 357. https://doi.org/10.3390/ijerph14040357