
Exploring the Linkage between Urban Flood Risk and Spatial Patterns in Small Urbanized Catchments of Beijing, China


Abstract
:1. Introduction
- (1)
- By using regression analysis, this study attempts to quantify the potential relationships between spatial characteristics and urban flood variables under different rainfall conditions for small urbanized catchments;
- (2)
- Comparing the catchment runoff outputs of different scenarios and investigating whether different catchment patterns affect runoff process; and
- (3)
- We discussed the potential implications of our findings and the relevance of the study to urban catchment design and flood management.
2. Materials and Methods
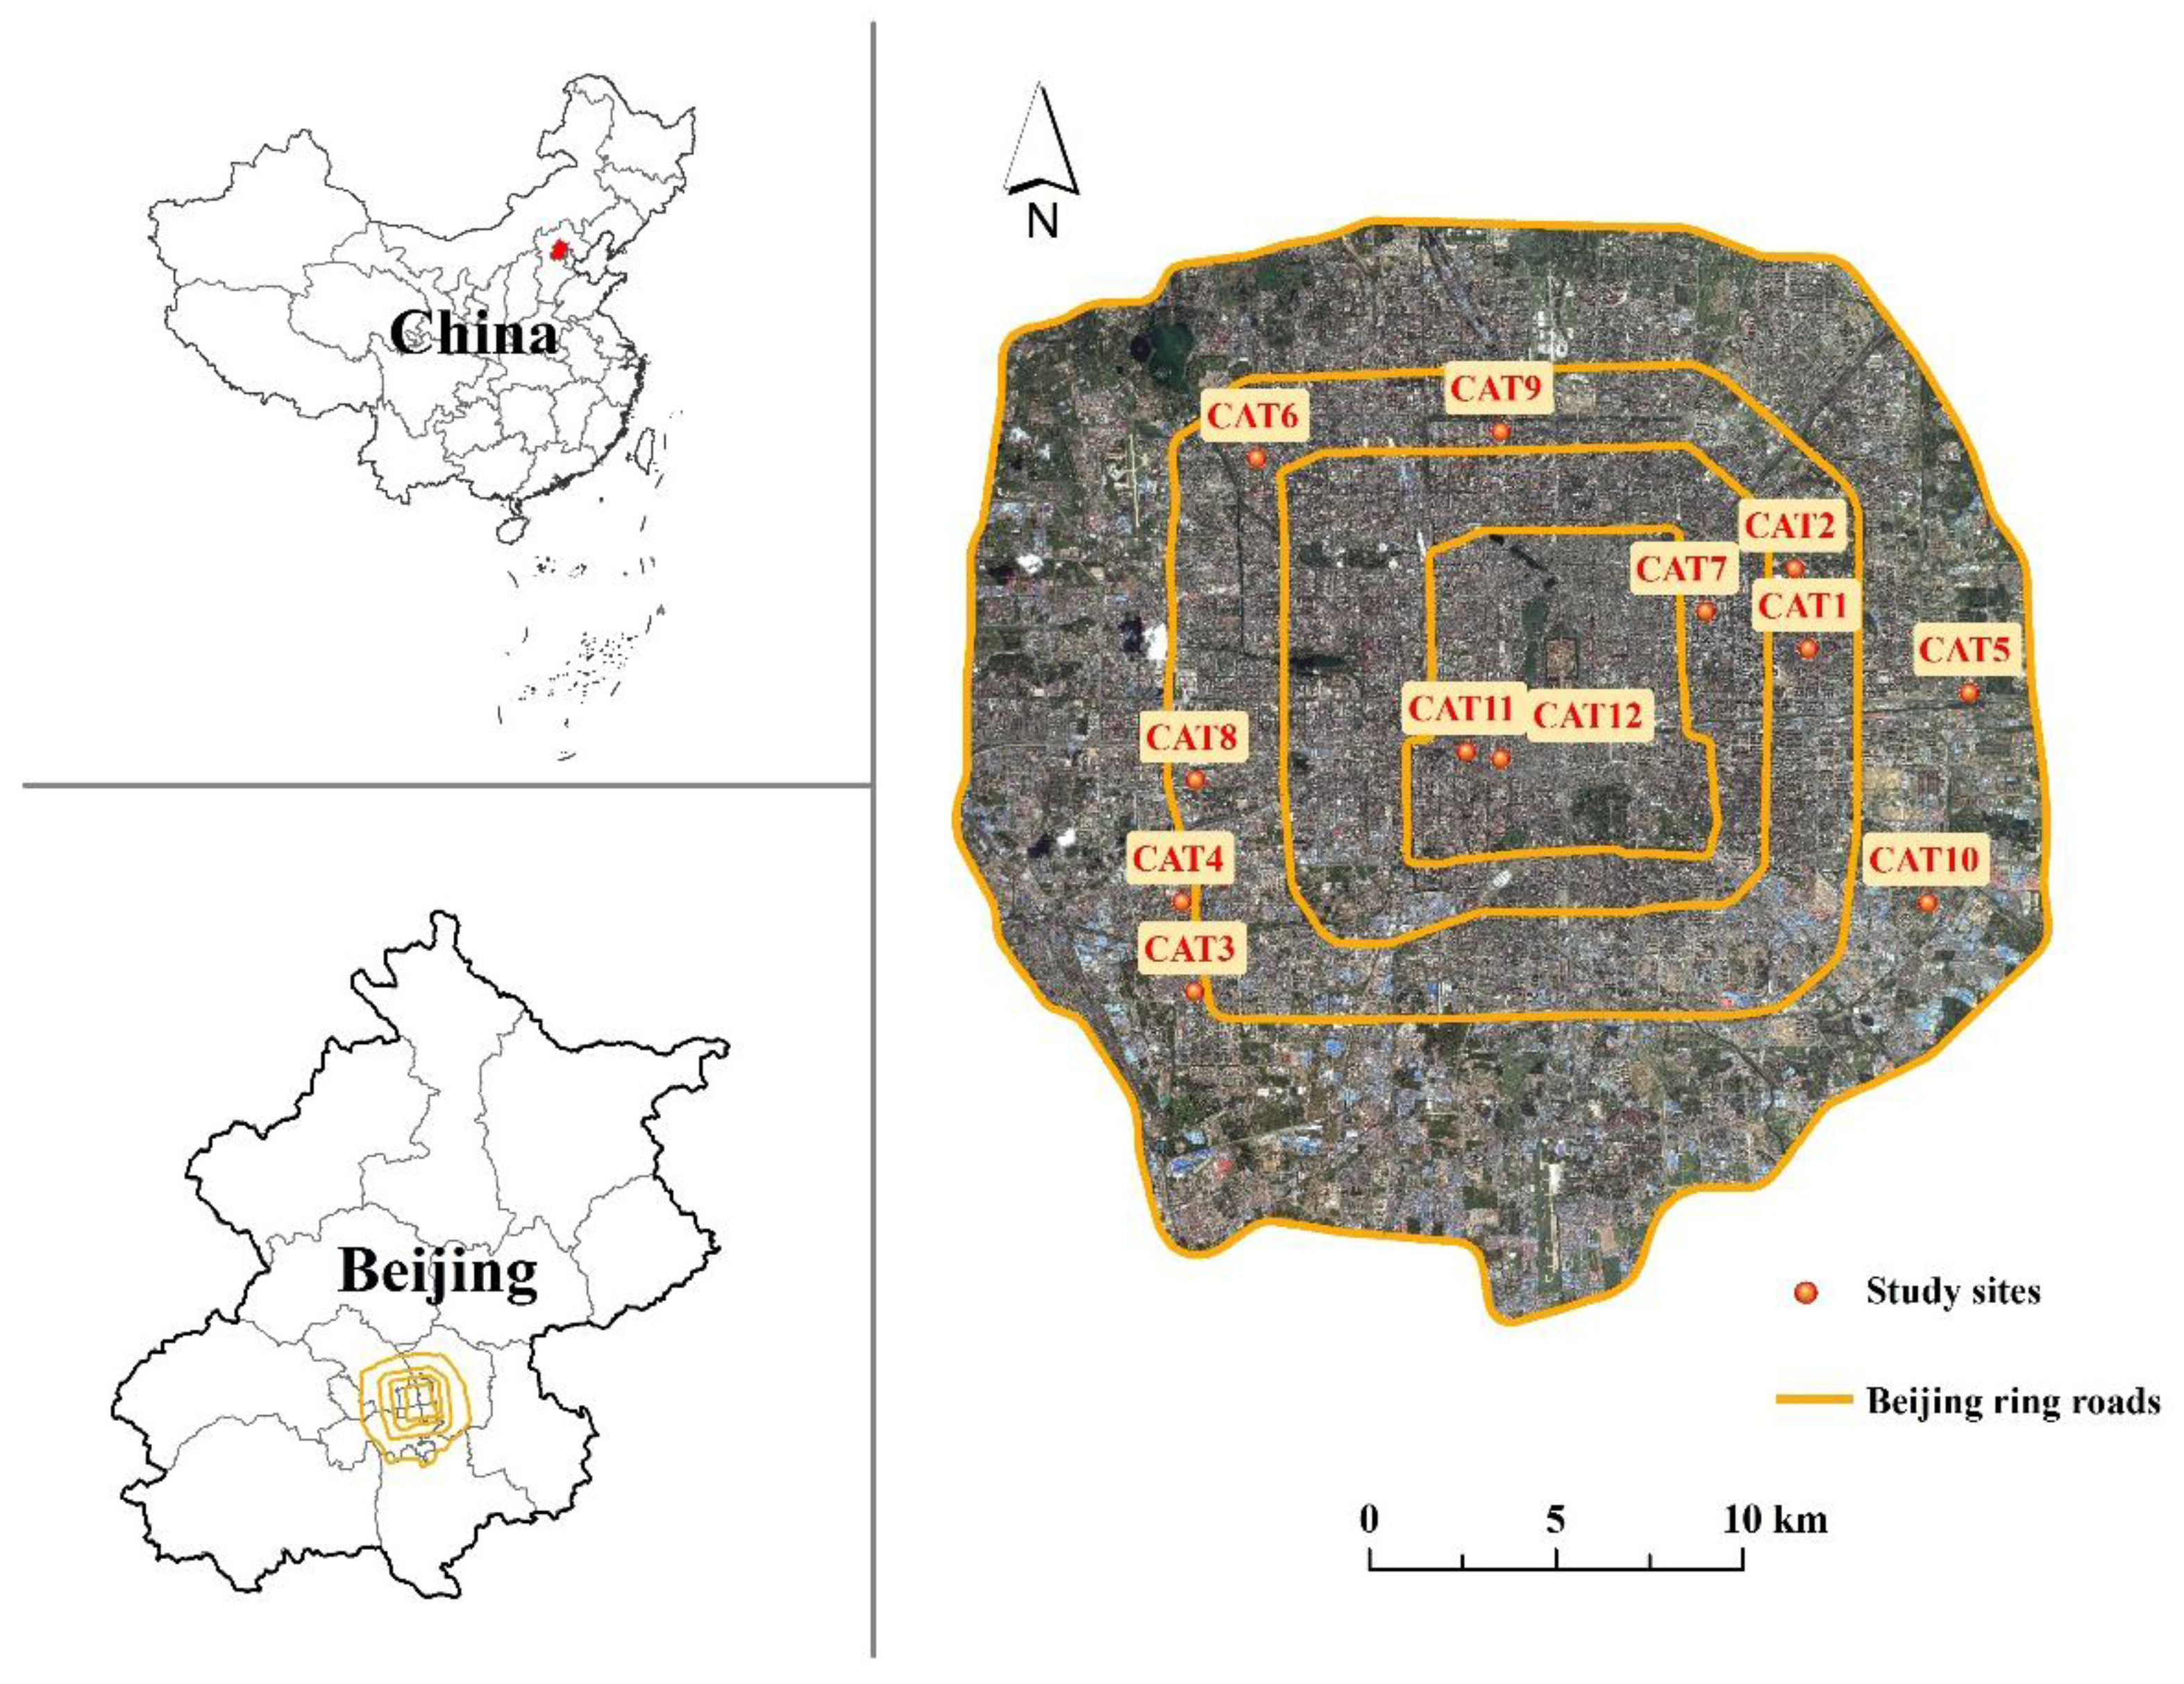
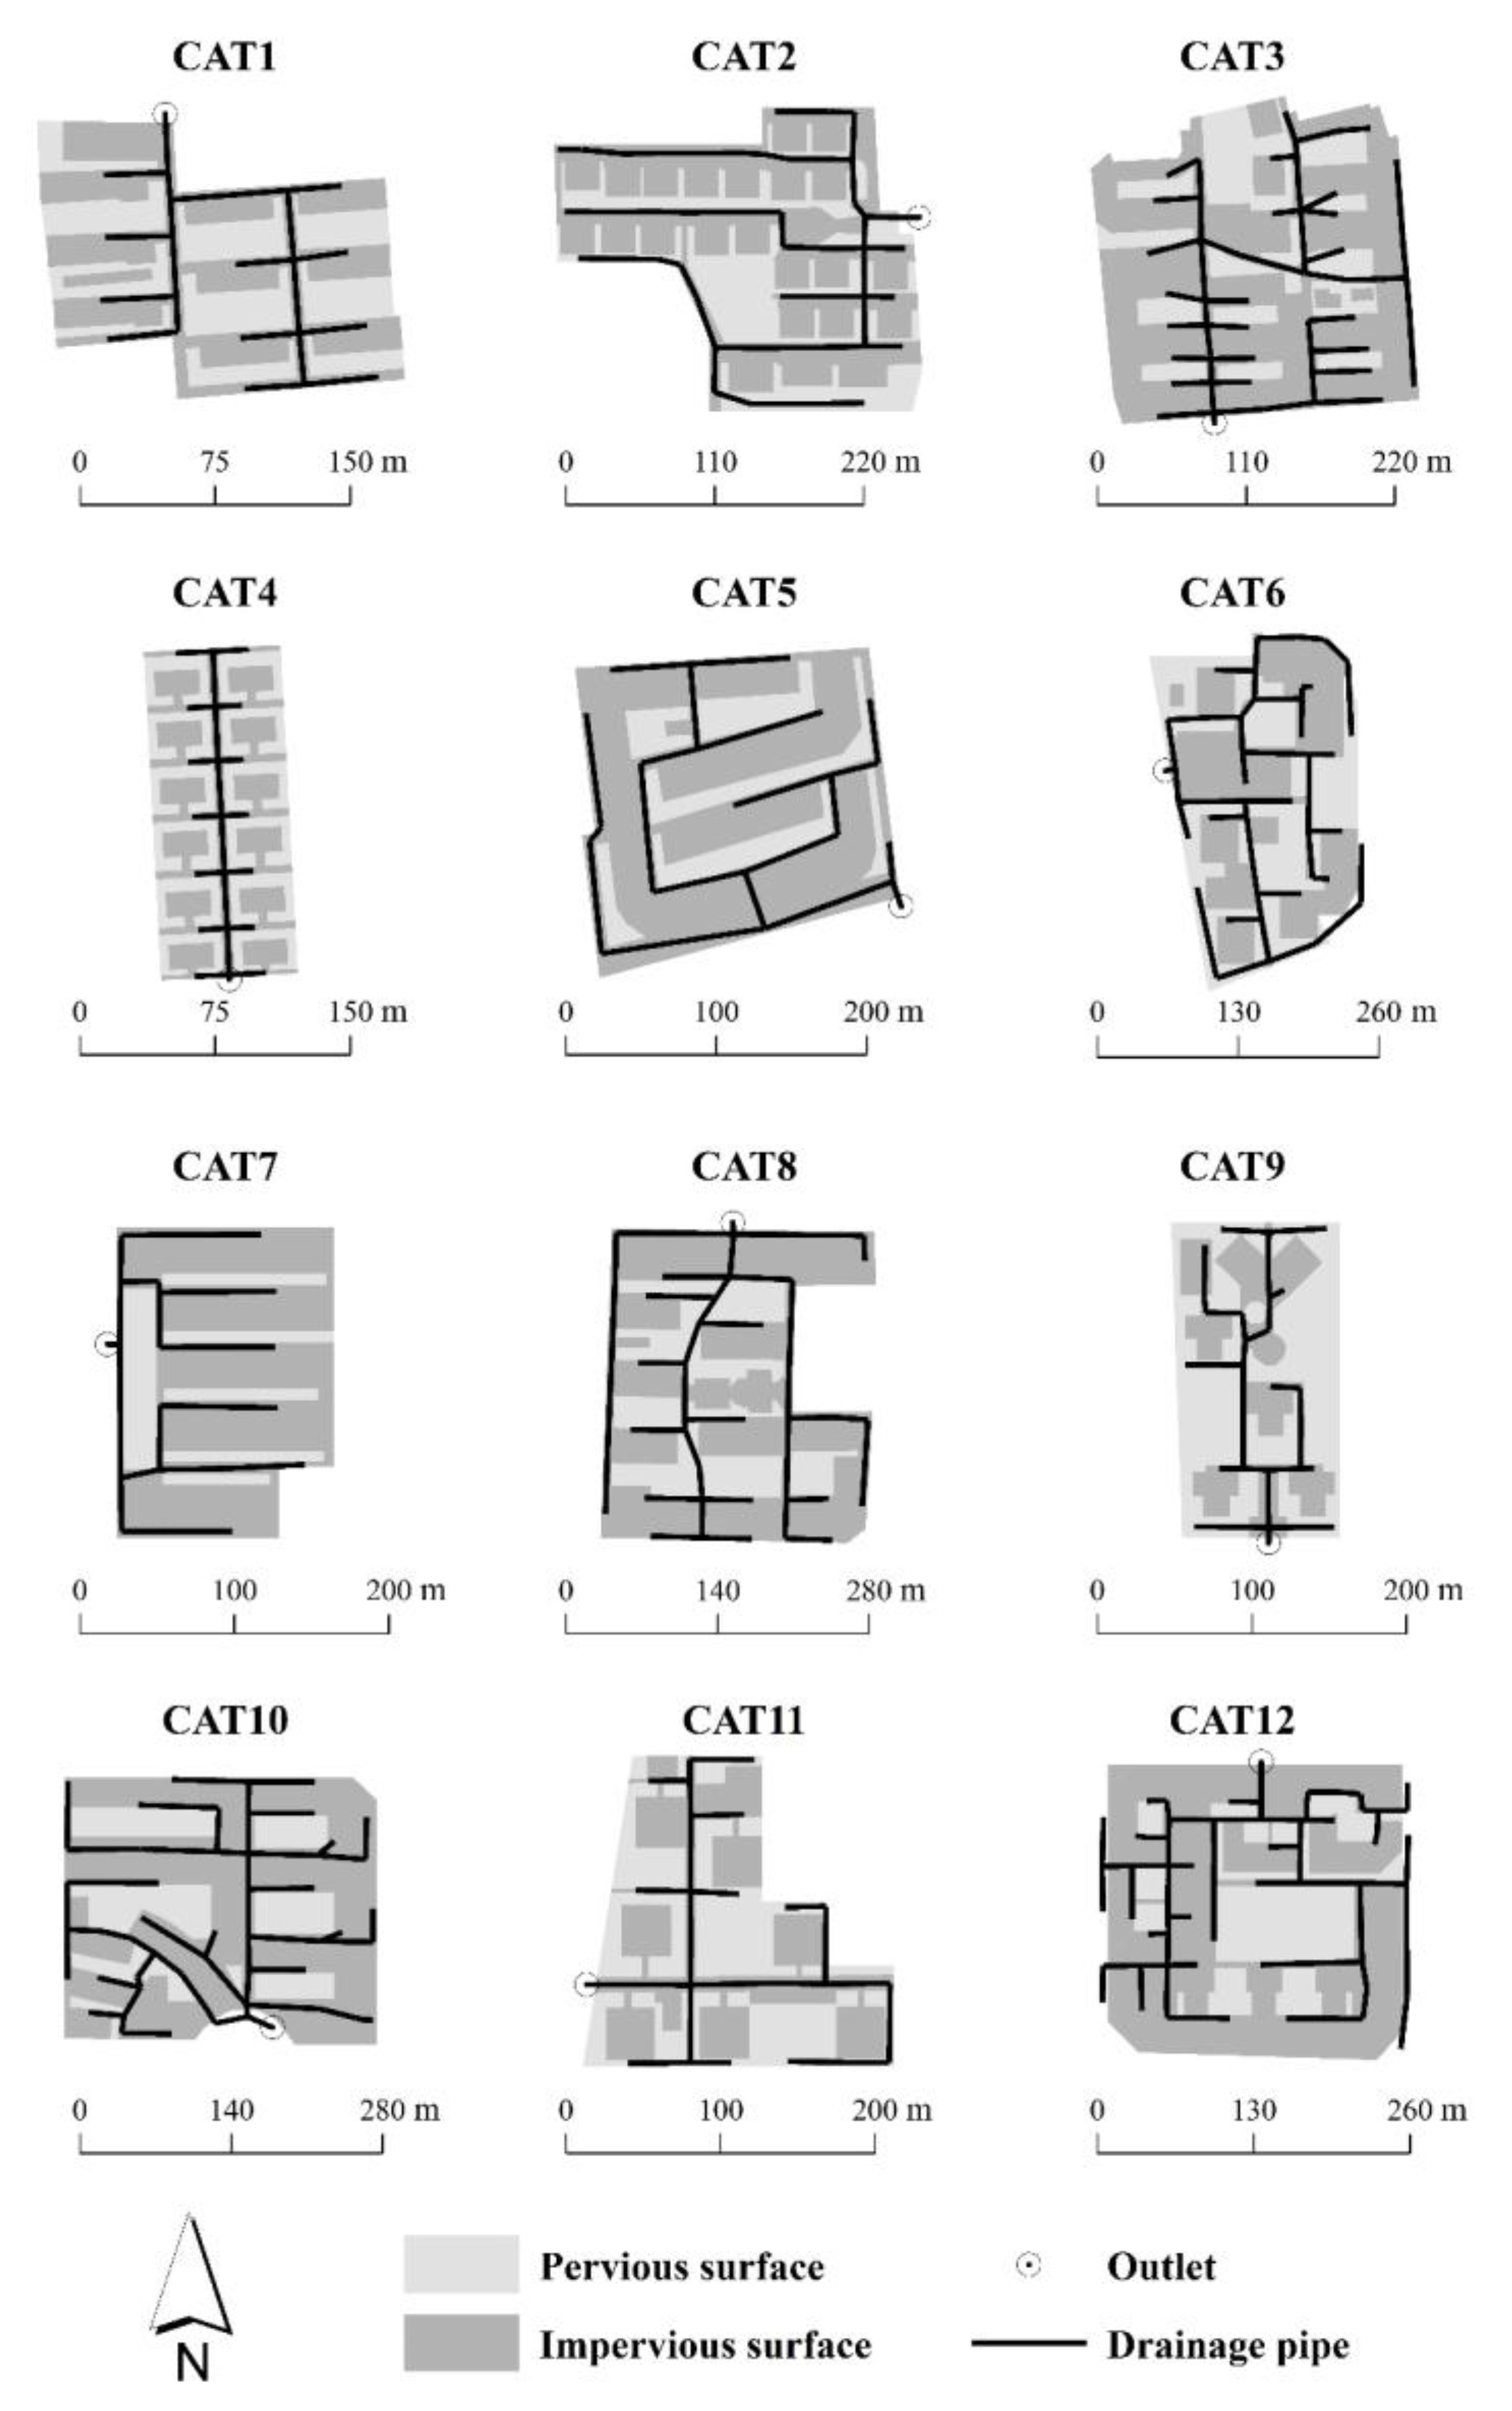
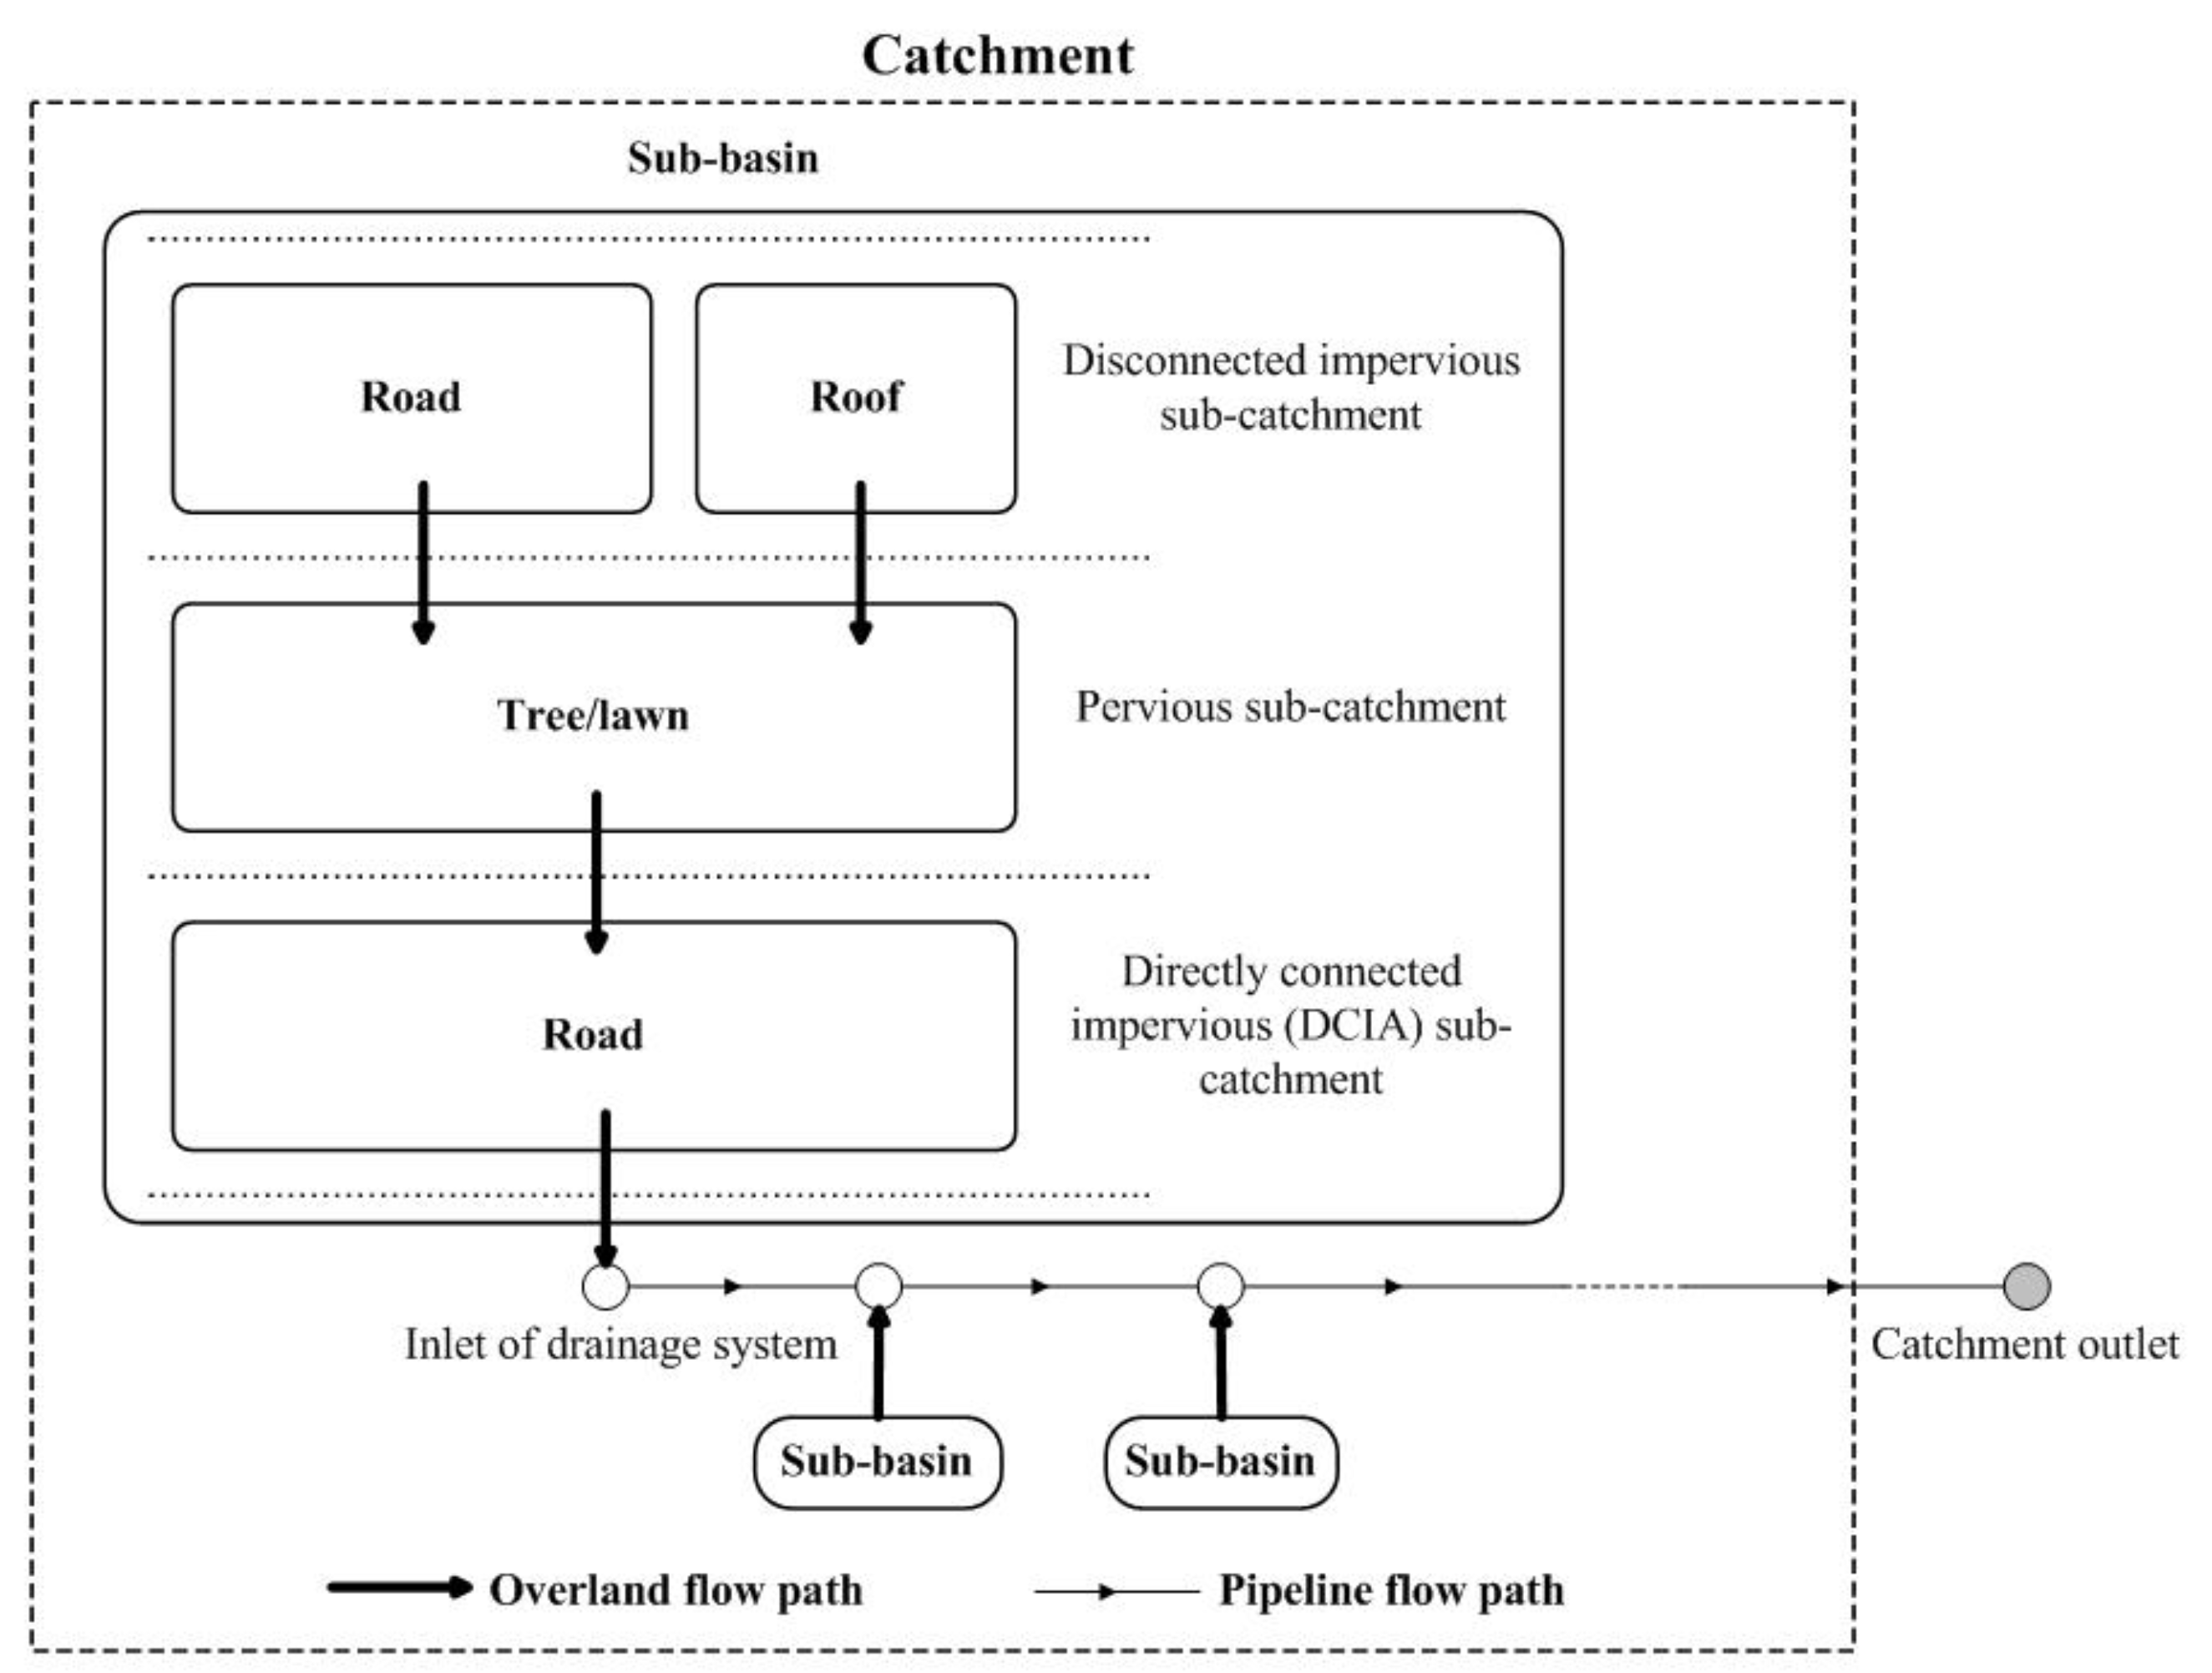
2.1. Study Areas
2.2. Model Implementation
- (1)
- (2)
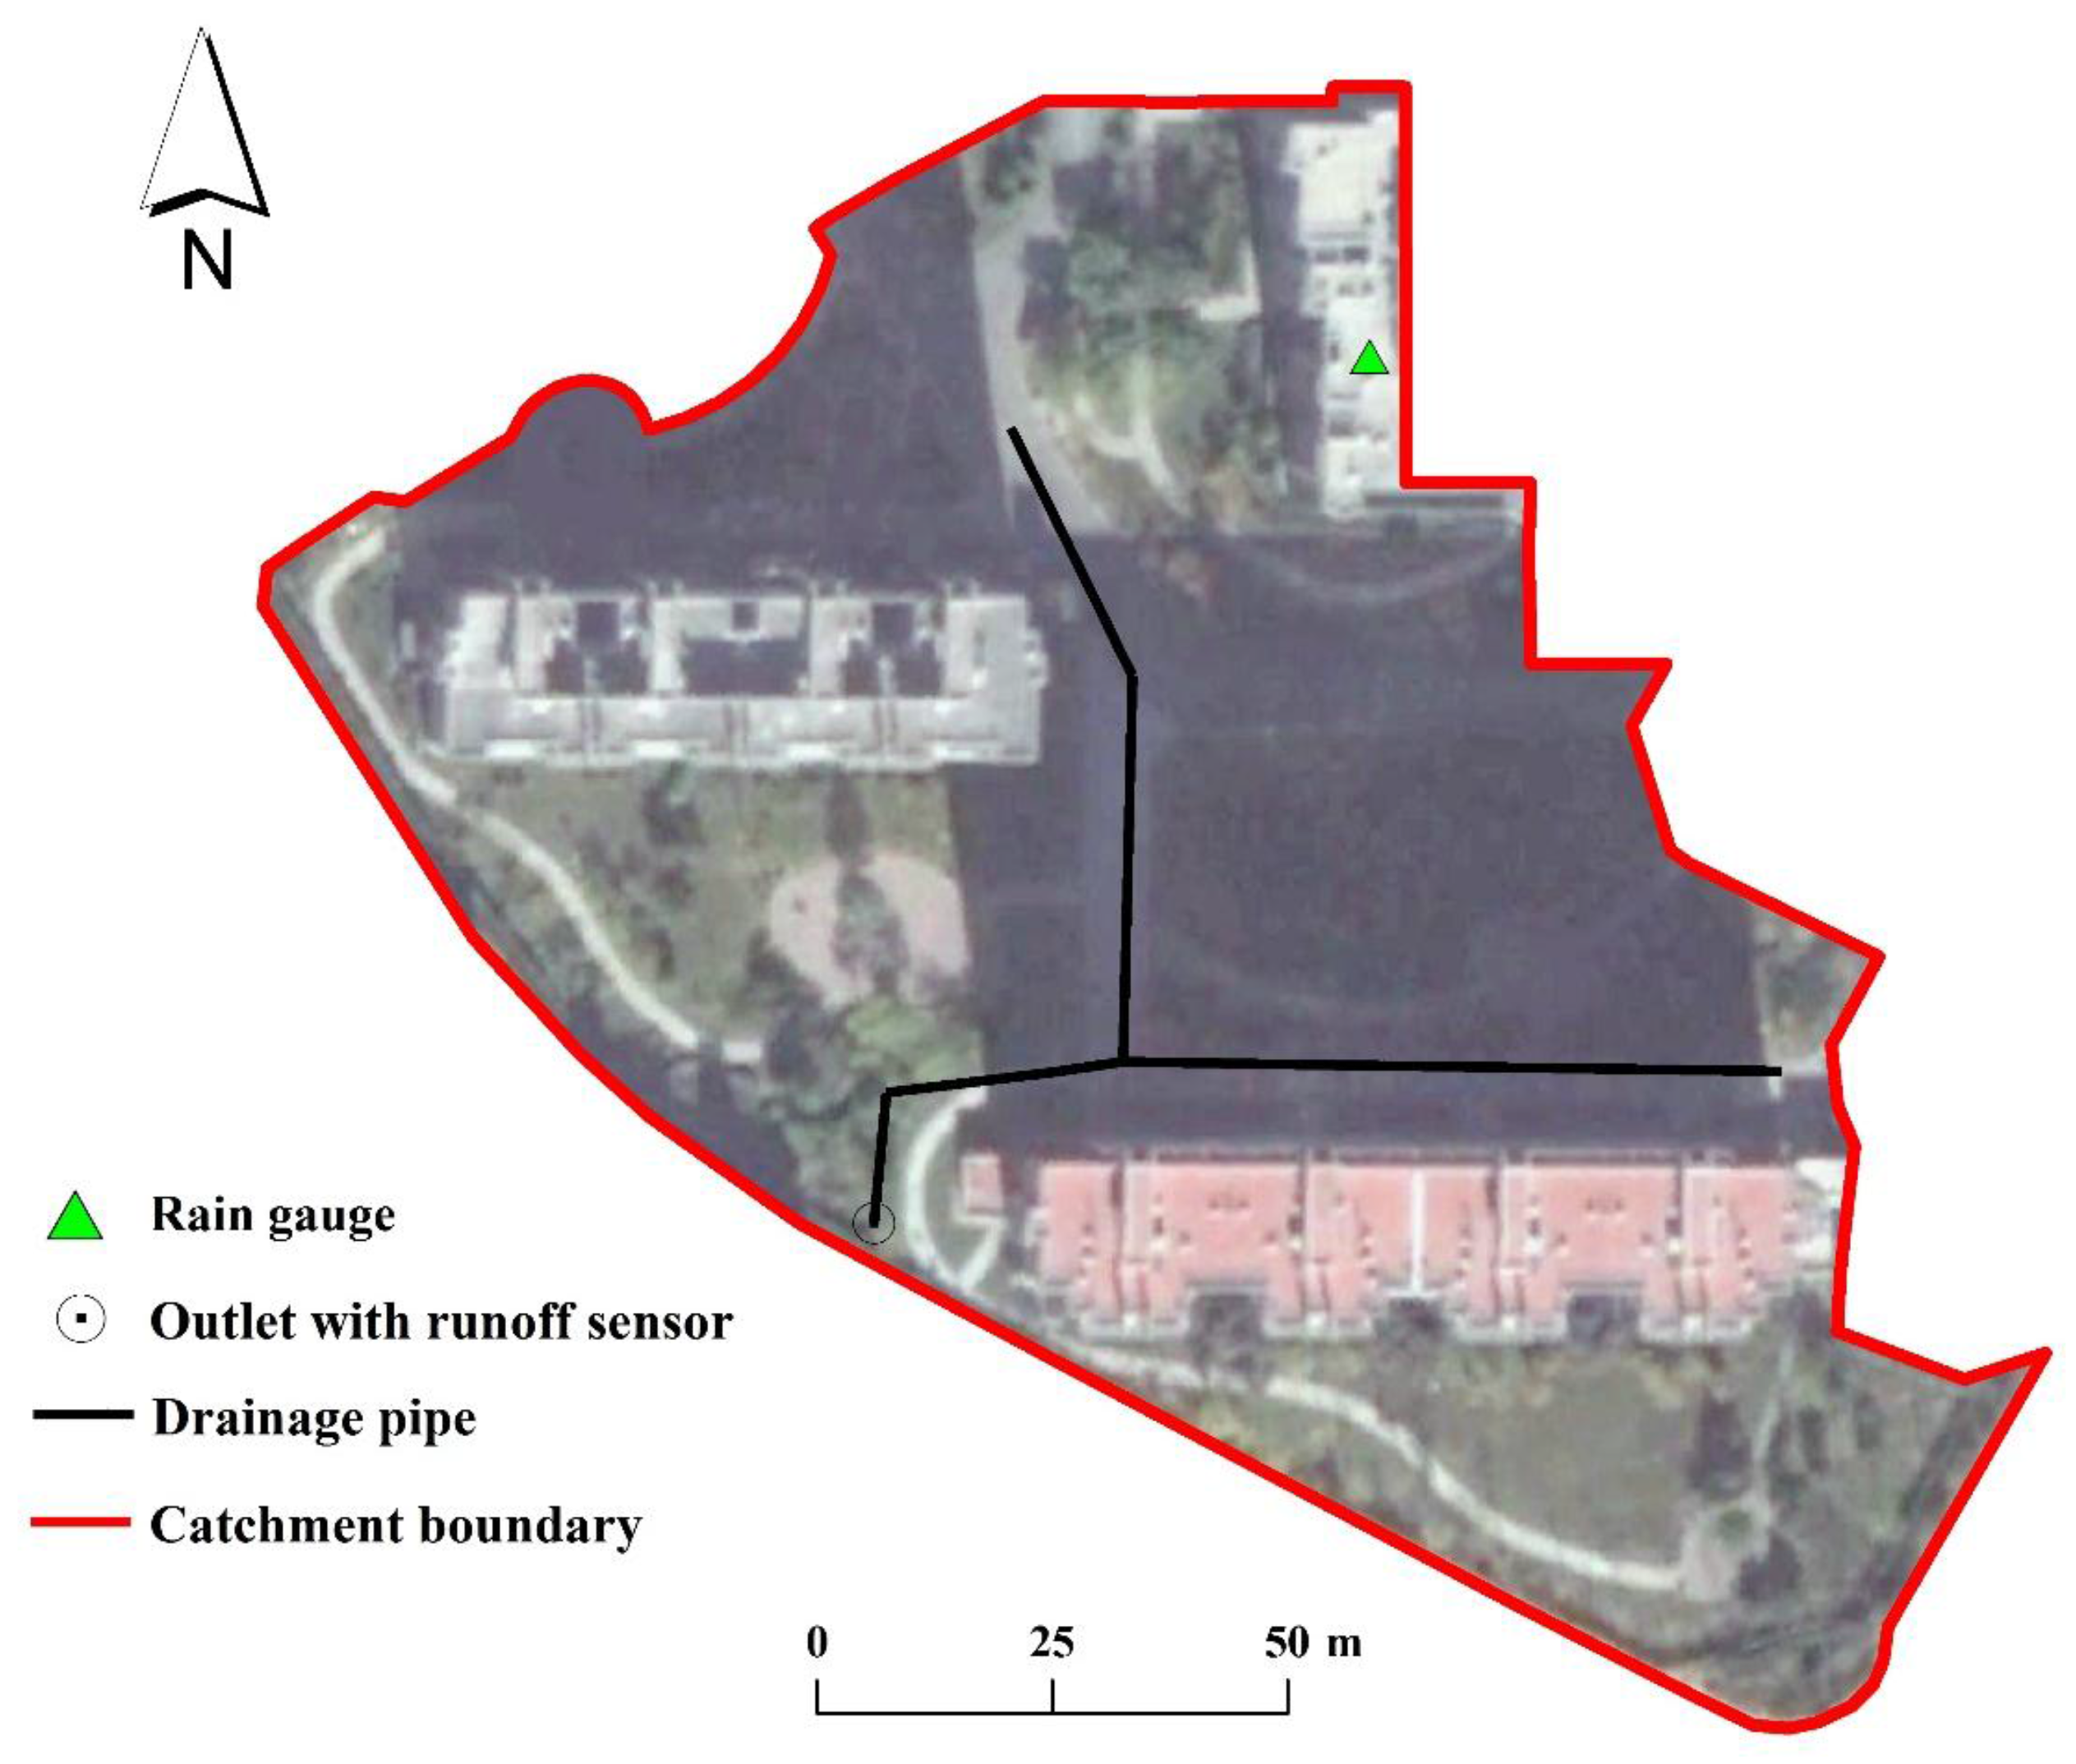
- As previously described, drainage systems of the study catchments were designated to be similar in order to minimize the hydraulics interference from drainage structures. Therefore, no real life measurements were conducted in these sites, and no suitable rainfall-runoff datasets are available for model calibration/validation. To guarantee the model credibility, we conducted a hydrological monitoring task in a residential catchment of Beijing, China (40°2′ N, 116°24′ E), as shown in Figure 4. This monitored catchment covers a drainage area of 1.69 ha. We collected detailed rainfall-runoff data in this site with runoff sensor and rain gauge during the rainy season in 2013. Following the modelling procedure mentioned above, we built a detailed model for this monitored catchment by using SWMM model. Then we obtained a group of calibrated SWMM parameters based on these rainfall-runoff data (Table 2). More details about this monitored catchment and its model calibration/validation process can refer to Yao et al. [14].
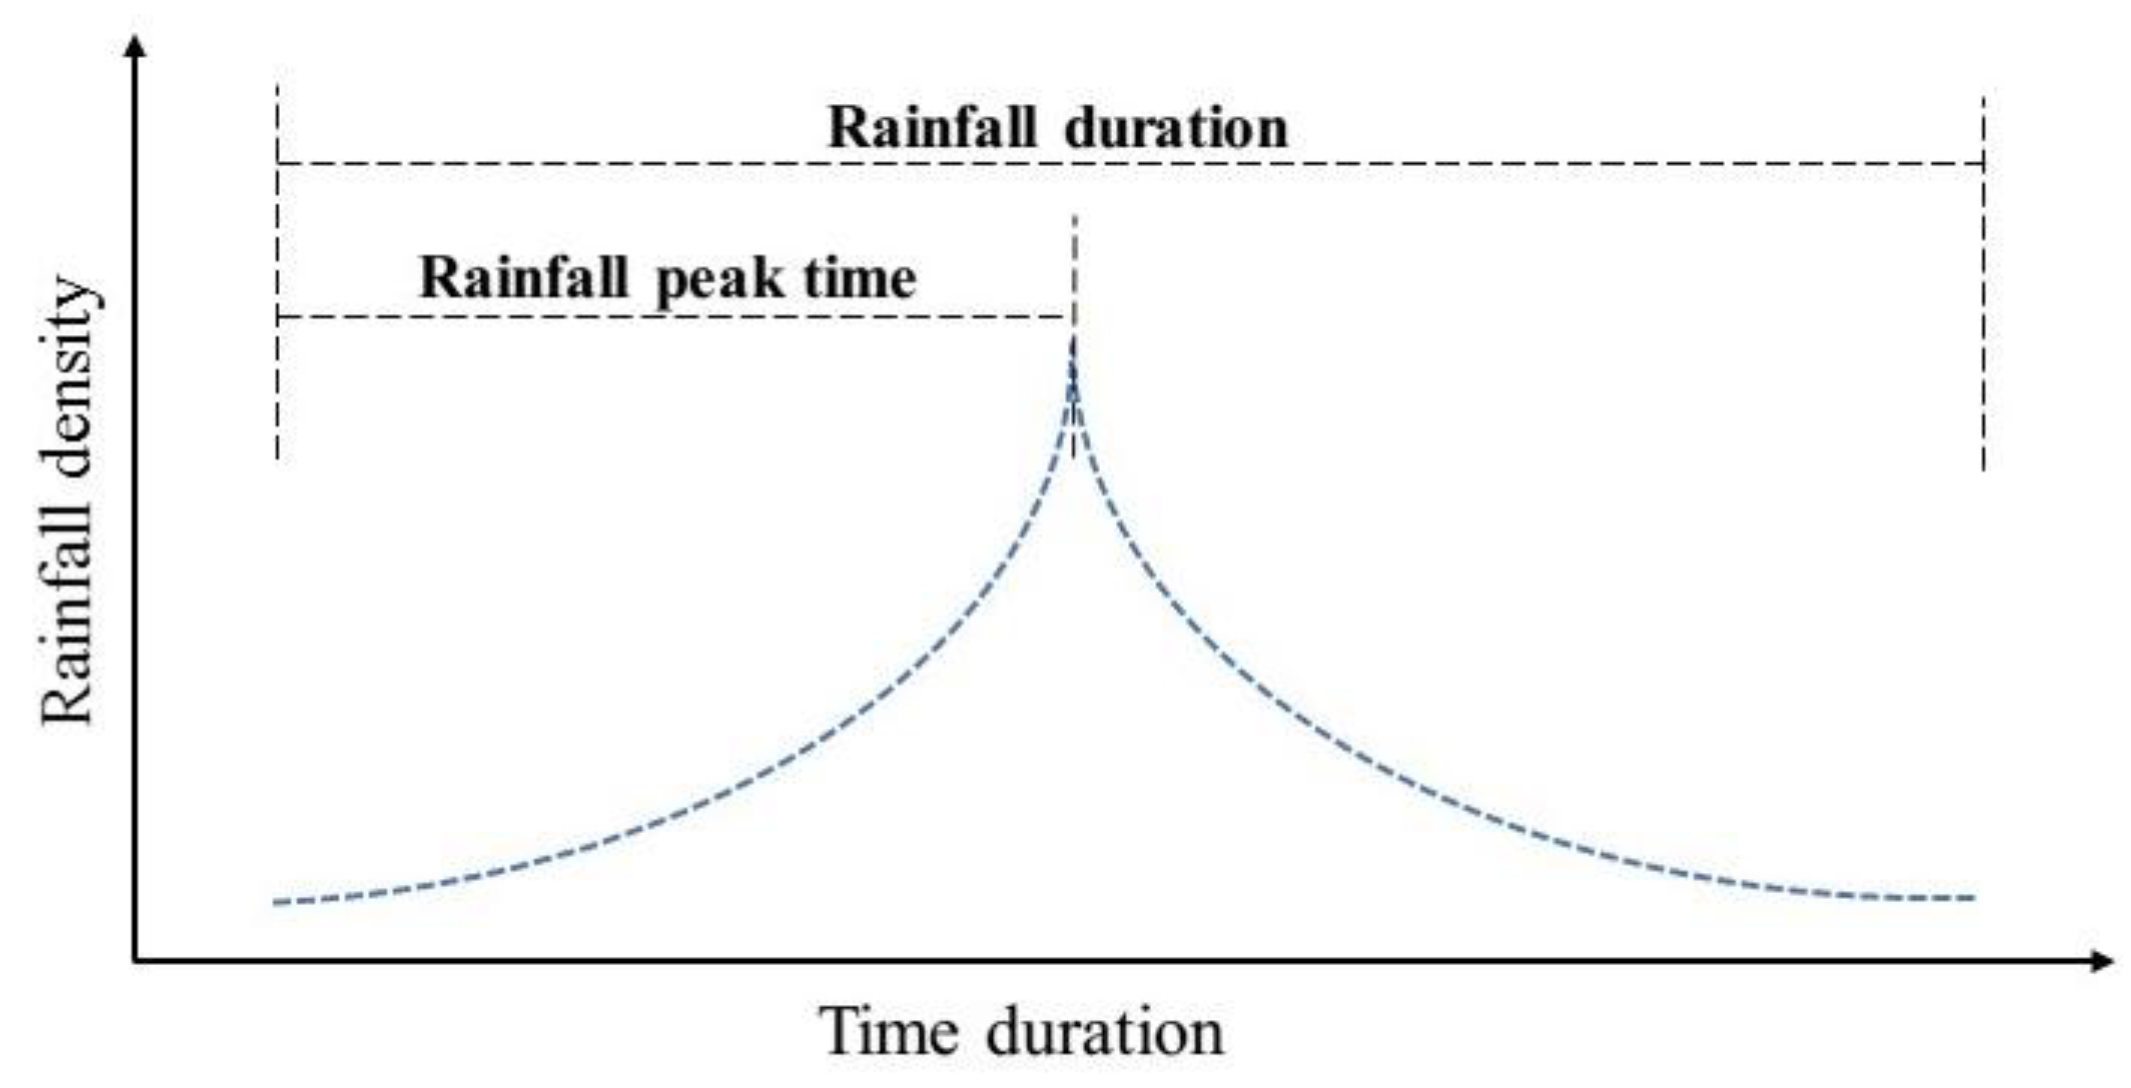
2.3. Input Rainfall Conditions
2.4. Data Analysis
3. Results
3.1. Spatial Details of the Study Catchments
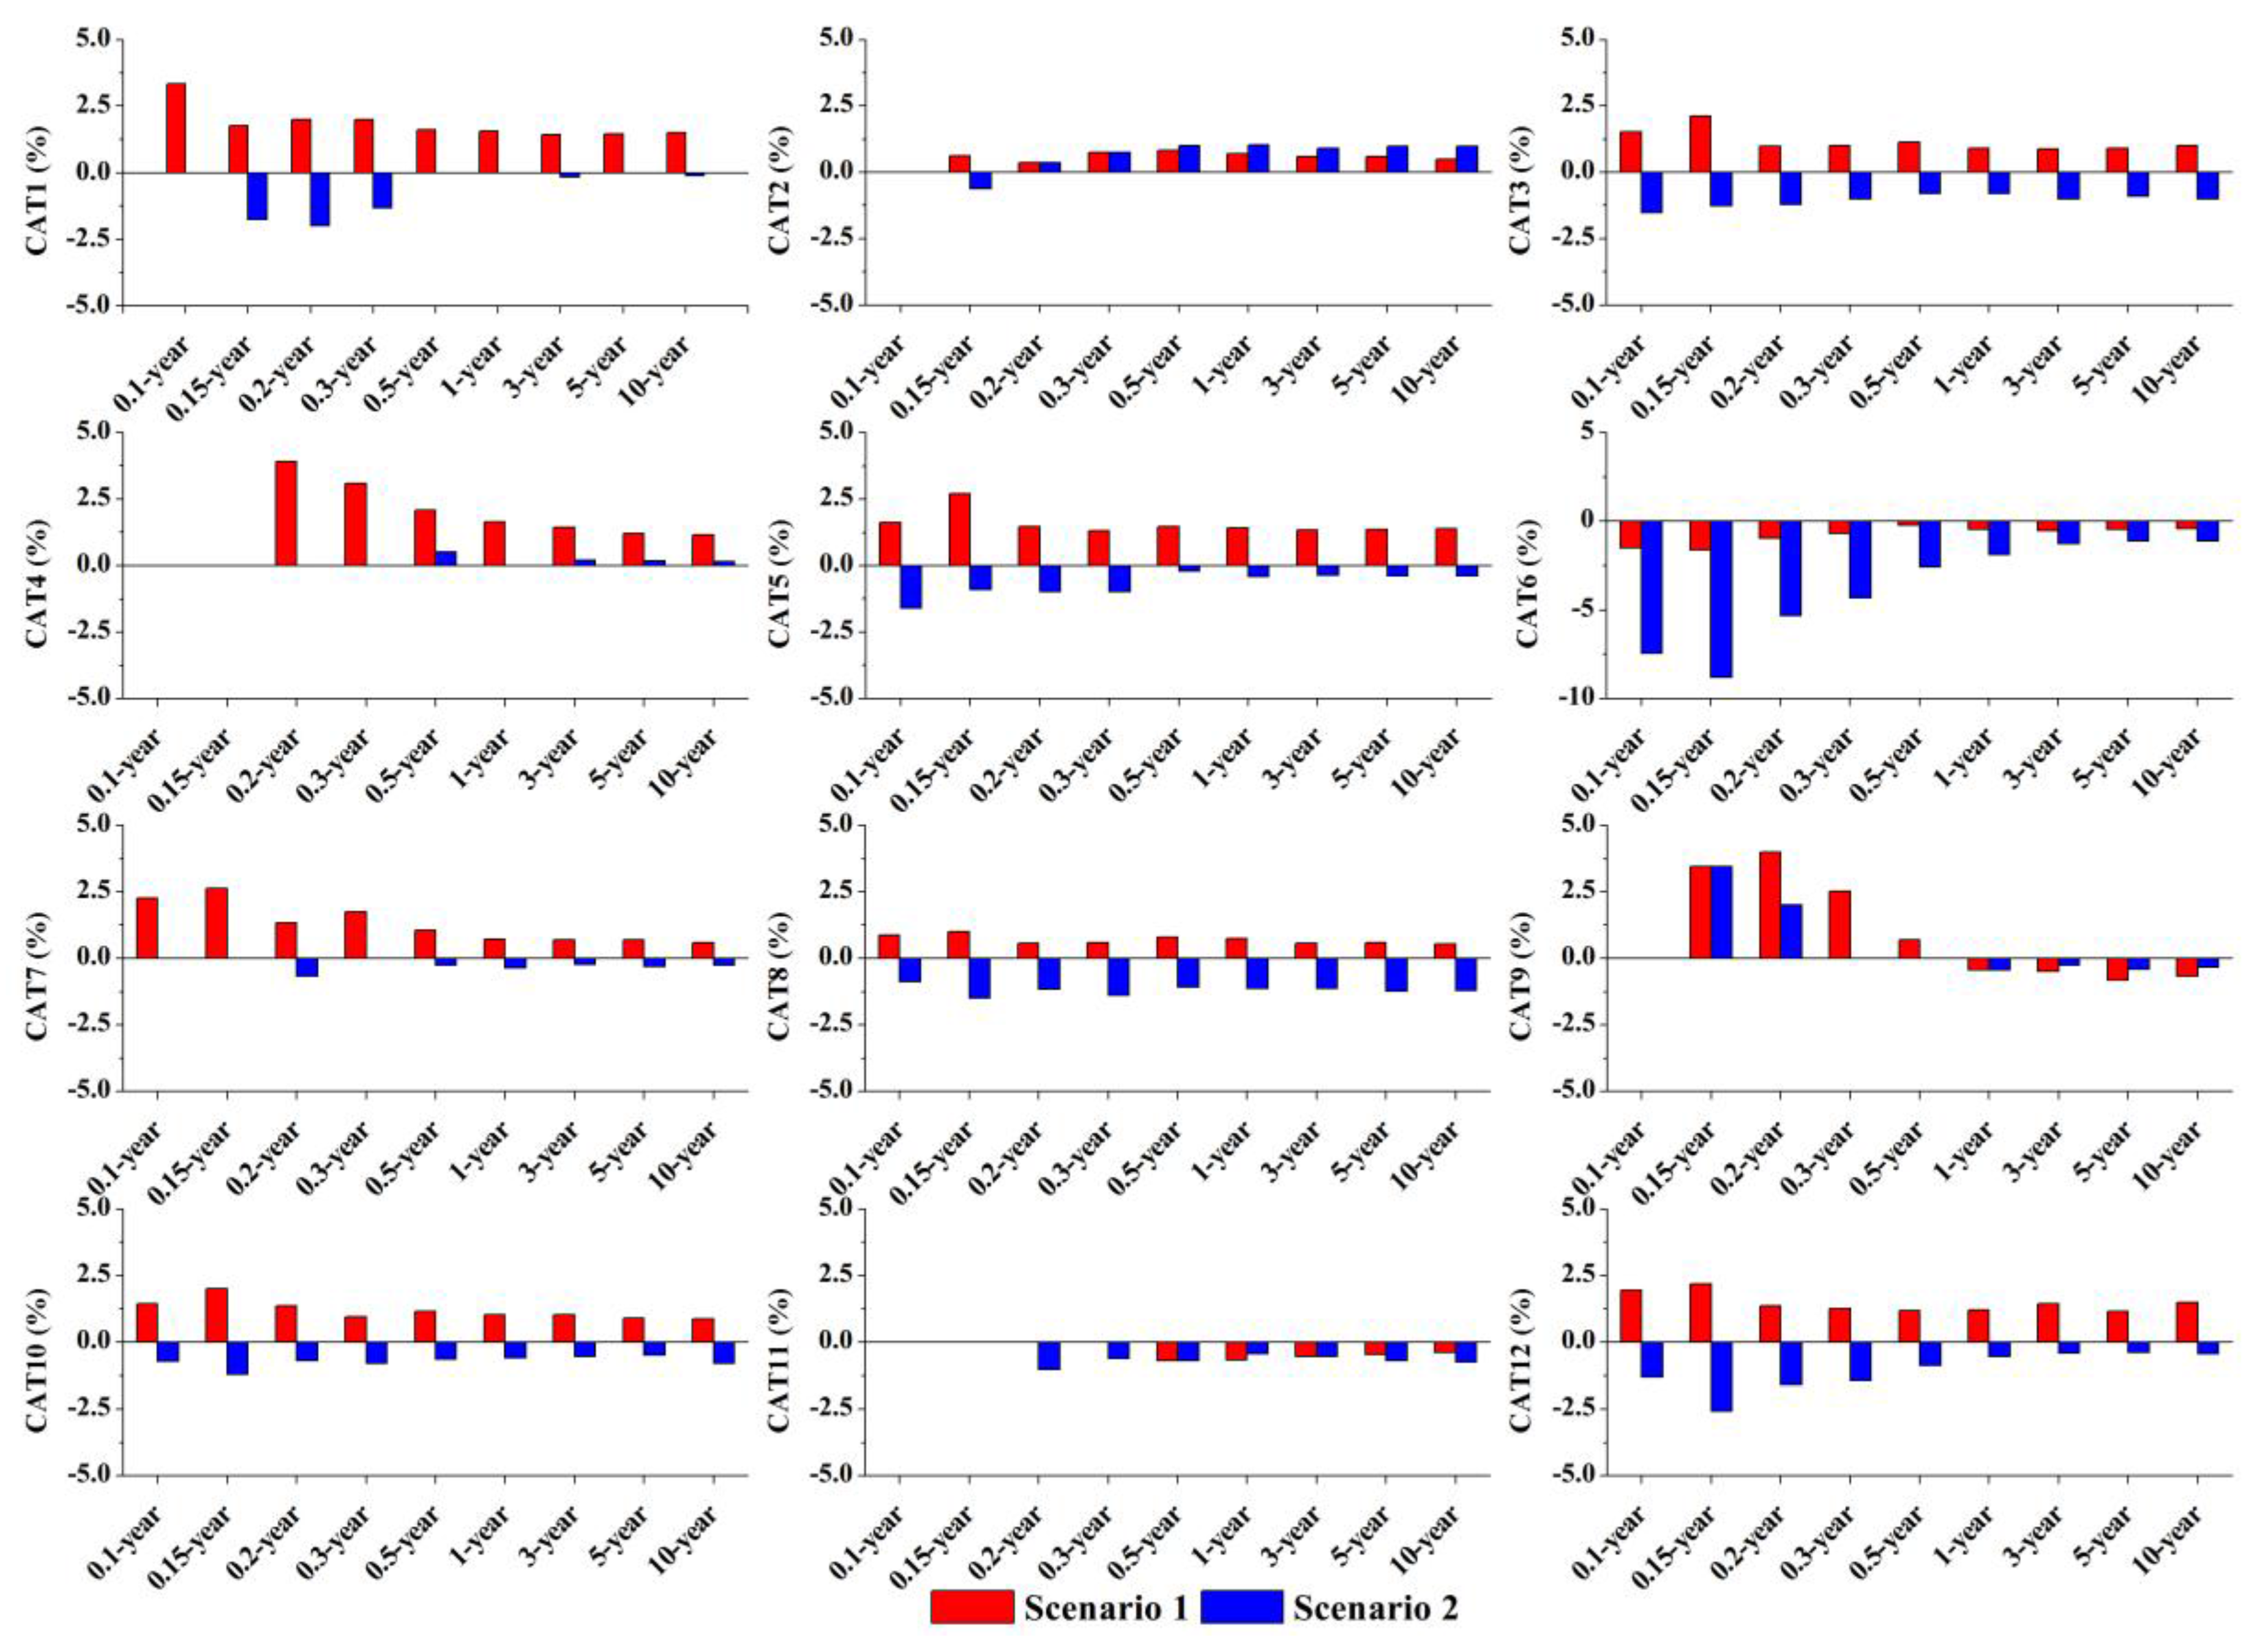
3.2. Simulated Runoff Variables
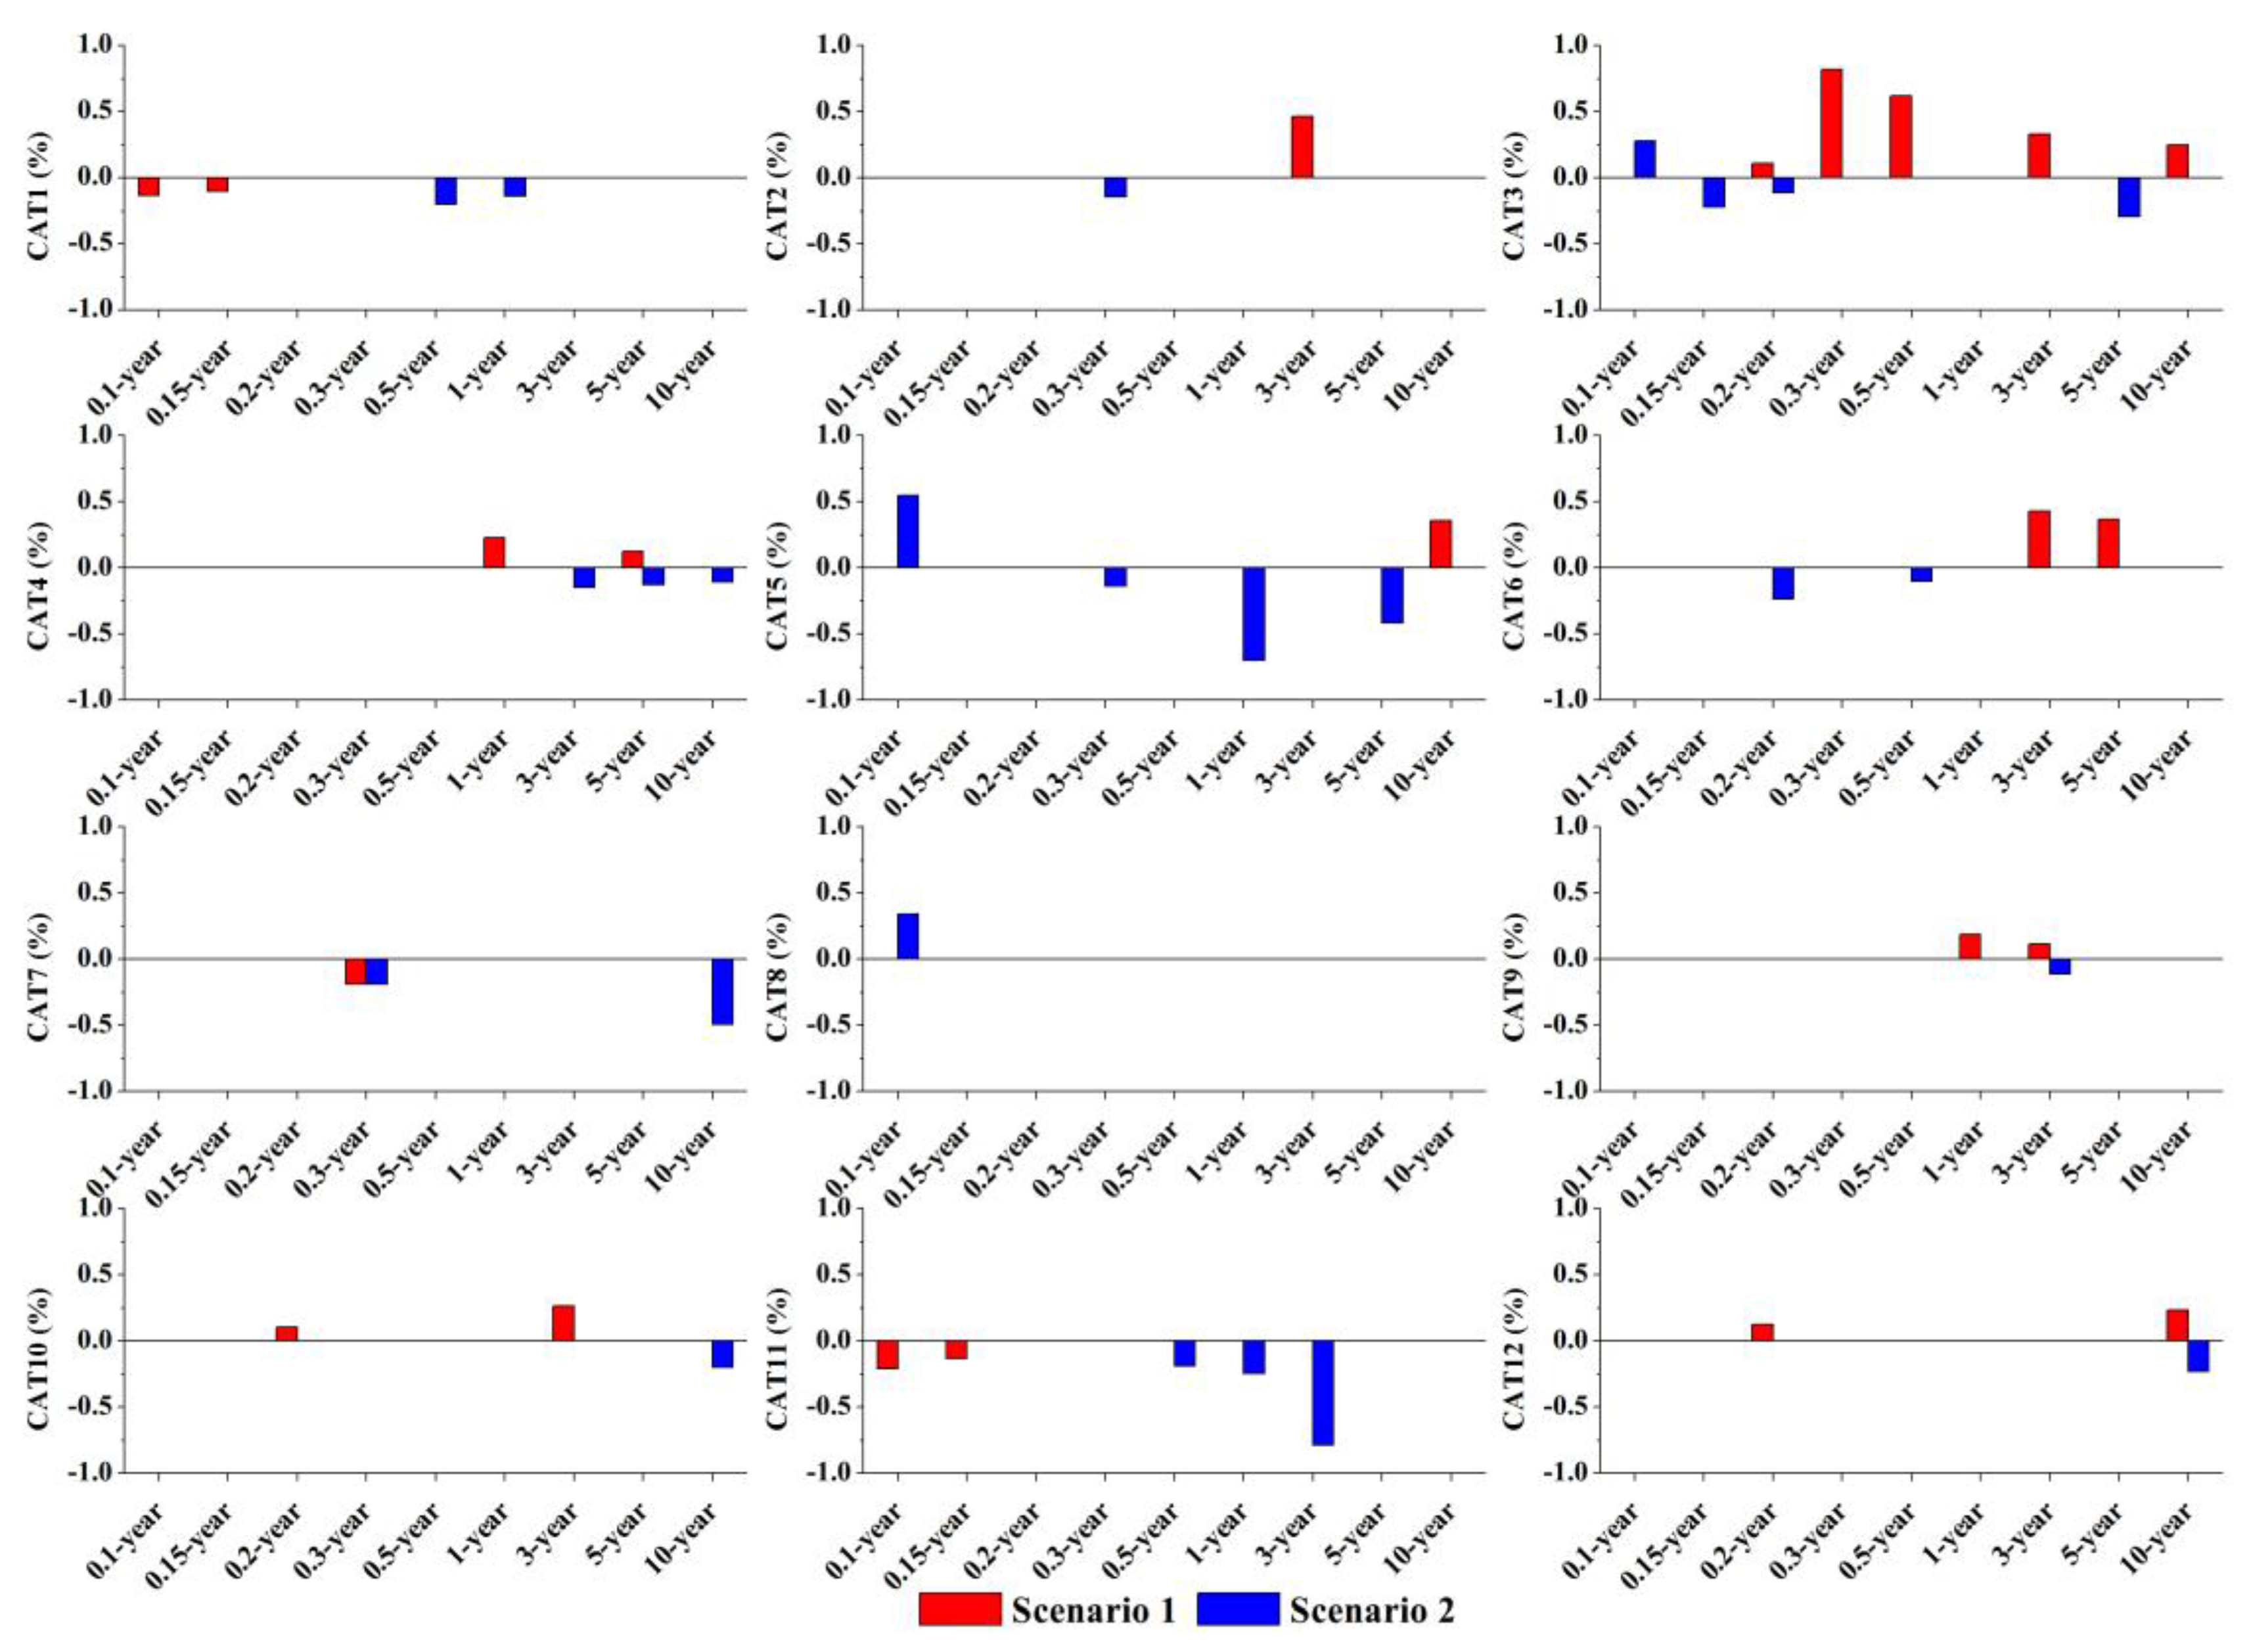
3.3. Relationship between Catchment Spatial Patterns and Runoff Responses
4. Discussion
4.1. Hydrological Impacts of Catchment Spatial Characteristics
4.2. Effects of Different Catchment Impervious Patterns on Rainfall-Runoff
4.3. Practical Implications of Results
5. Conclusions
- (1)
- Imperviousness metrics act as effective indicators in predicting both Qt and Qp. However, this significant relationship is rainfall-dependent. For small rainfall conditions, DCIA contributes to the majority of hydrological alternations in Qt and Qp, while TIA becomes more responsible in predicting runoff responses than DCIA as rainfall increases.
- (2)
- Sub-basin segmentation of the catchment (Ad) also has essential impacts on its peak runoff. Reasonably reducing the drainage inlet number will benefit peak flow mitigation at the catchment outlet.
- (3)
- Changing the spatial arrangement of imperviousness (IAC) could affect the catchment peak runoff. Generally, catchments with an impervious concentration far from the outlet tend to produce a lower peak runoff than that with downstream concentration. However, the regulation potential of Qp through IAC alteration is relatively limited.
Acknowledgments
Author Contributions
Conflicts of Interest
References
- Palla, A.; Gnecco, I. Hydrologic modeling of Low Impact Development systems at the urban catchment scale. J. Hydrol. 2015, 528, 361–368. [Google Scholar] [CrossRef]
- Moglen, G.E. Hydrology and impervious areas. J. Hydrol. Eng. 2009, 14, 303–304. [Google Scholar] [CrossRef]
- Schueler, T.R. The importance of imperviousness. Watershed Prot. Tech. 1994, 1, 100–111. [Google Scholar]
- Shuster, W.D.; Bonta, J.; Thurston, H.; Warnemuende, E.; Smith, D.R. Impacts of impervious surface on watershed hydrology: A review. Urban Water J. 2005, 2, 263–275. [Google Scholar] [CrossRef]
- Jha, A.K.; Bloch, R.; Lamond, J. Cities and Flooding: A Guide to Integrated Urban Flood Risk Management for the 21st Century; World Bank Publications: Washington, DC, USA, 2012. [Google Scholar]
- Milly, P.; Wetherald, R.; Dunne, K.; Delworth, T. Increasing risk of great floods in a changing climate. Nature 2002, 415, 514–517. [Google Scholar] [CrossRef] [PubMed]
- Zevenbergen, C.; Gersonius, B. Challenges in urban flood management. In Advances in Urban Flood Management; Taylor & Francis: New York, NY, USA, 2007; pp. 1–11. [Google Scholar]
- Meierdiercks, K.L.; Smith, J.A.; Baeck, M.L.; Miller, A.J. Analyses of Urban Drainage Network Structure and its Impact on Hydrologic Response. J. Am. Water Resour. Assoc. 2010, 46, 932–943. [Google Scholar] [CrossRef]
- Mejía, A.I.; Moglen, G.E. Spatial patterns of urban development from optimization of flood peaks and imperviousness-based measures. J. Hydrol. Eng. 2009, 14, 416–424. [Google Scholar] [CrossRef]
- Arnold, C.L.; Gibbons, C.J. Impervious surface coverage: The emergence of a key environmental indicator. J. Am. Plan. Assoc. 1996, 62, 243–258. [Google Scholar] [CrossRef]
- Schueler, T.R.; Fraley-McNeal, L.; Cappiella, K. Is impervious cover still important? Review of recent research. J. Hydrol. Eng. 2009, 14, 309–315. [Google Scholar] [CrossRef]
- Boyd, M.; Bufill, M.; Knee, R. Pervious and impervious runoff in urban catchments. Hydrol. Sci. J. 1993, 38, 463–478. [Google Scholar] [CrossRef]
- Dietz, M.E.; Clausen, J.C. Stormwater runoff and export changes with development in a traditional and low impact subdivision. J. Environ. Manag. 2008, 87, 560–566. [Google Scholar] [CrossRef] [PubMed]
- Yao, L.; Wei, W.; Chen, L. How does imperviousness impact the urban rainfall-runoff process under various storm cases? Ecol. Indic. 2016, 60, 893–905. [Google Scholar] [CrossRef]
- Ogden, F.L.; Raj Pradhan, N.; Downer, C.W.; Zahner, J.A. Relative importance of impervious area, drainage density, width function, and subsurface storm drainage on flood runoff from an urbanized catchment. Water Resour. Res. 2011, 47, 1–12. [Google Scholar] [CrossRef]
- Bacchin, T.K.; Veerbeek, W.; Pathirana, A.; Denekew, H.B.; Zevenbergen, C. Spatial metrics modeling to analyse correlations between urban form and surface water drainage performance. In Proceedings of the 12nd International Conference on Urban Drainage, Porto Alegre, Brazil, 11–16 September 2011; International Water Association: Porto Alegre, Brazil, 2011. [Google Scholar]
- Qin, H.; Li, Z.; Fu, G. The effects of low impact development on urban flooding under different rainfall characteristics. J. Environ. Manag. 2013, 129, 577–585. [Google Scholar] [CrossRef] [PubMed]
- Li, F.; Duan, H.F.; Yan, H.; Tao, T. Multi-Objective Optimal Design of Detention Tanks in the Urban Stormwater Drainage System: Framework Development and Case Study. Water Resour. Manag. 2015, 29, 2125–2137. [Google Scholar] [CrossRef]
- Brander, K.E.; Owen, K.E.; Potter, K.W. Modeled impacts of development type on runoff volume and infiltration performance. J. Am. Water Resour. Assoc. 2004, 40, 961–969. [Google Scholar] [CrossRef]
- Hood, M.J.; Clausen, J.C.; Warner, G.S. Comparison of Stormwater Lag Times for Low Impact and Traditional Residential Development. J. Am. Water Resour. Assoc. 2007, 43, 1036–1046. [Google Scholar] [CrossRef]
- Yang, G.; Bowling, L.C.; Cherkauer, K.A.; Pijanowski, B.C. The impact of urban development on hydrologic regime from catchment to basin scales. Landsc. Urban Plan. 2011, 103, 237–247. [Google Scholar] [CrossRef]
- Van Nieuwenhuyse, B.H.J.; Antoine, M.; Wyseure, G.; Govers, G. Pattern-process relationships in surface hydrology: Hydrological connectivity expressed in landscape metrics. Hydrol. Processes 2011, 25, 3760–3773. [Google Scholar] [CrossRef]
- Dams, J.; Dujardin, J.; Reggers, R.; Bashir, I.; Canters, F.; Batelaan, O. Mapping impervious surface change from remote sensing for hydrological modeling. J. Hydrol. 2013, 485, 84–95. [Google Scholar] [CrossRef]
- Faulkner, D.S.; Francis, O.; Lamb, R. Greenfield run off and flood estimation on small catchments. J. Flood Risk Manag. 2012, 5, 81–90. [Google Scholar] [CrossRef]
- Grimaldi, S.; Petroselli, A.; Romano, N. Curve-Number/Green–Ampt mixed procedure for streamflow predictions in ungauged basins: Parameter sensitivity analysis. Hydrol. Processes 2013, 27, 1265–1275. [Google Scholar] [CrossRef]
- Grimaldi, S.; Petroselli, A. Do we still need the Rational Formula? An alternative empirical procedure for peak discharge estimation in small and ungauged basins. Hydrol. Sci. J. 2014, 60, 67–77. [Google Scholar] [CrossRef]
- Zoppou, C. Review of urban storm water models. Environ. Model. Softw. 2001, 16, 195–231. [Google Scholar] [CrossRef]
- Goldshleger, N.; Karnibad, L.; Shoshany, M.; Asaf, L. Generalising urban runoff and street network density relationship: A hydrological and remote-sensing case study in Israel. Urban Water J. 2012, 9, 189–197. [Google Scholar] [CrossRef]
- Lee, J.G.; Heaney, J.P. Estimation of urban imperviousness and its impacts on storm water systems. J. Water Resour. Plan. Manag. 2003, 129, 419–426. [Google Scholar] [CrossRef]
- Yao, L.; Chen, L.; Wei, W. Assessing the effectiveness of imperviousness on stormwater runoff in micro urban catchments by model simulation. Hydrol. Processes 2015, 30, 1836–1848. [Google Scholar] [CrossRef]
- Fletcher, T.; Andrieu, H.; Hamel, P. Understanding, management and modelling of urban hydrology and its consequences for receiving waters: A state of the art. Adv. Water Resour. 2012, 51, 261–279. [Google Scholar] [CrossRef]
- Krebs, G.; Kokkonen, T.; Valtanen, M.; Setälä, H.; Koivusalo, H. Spatial resolution considerations for urban hydrological modelling. J. Hydrol. 2014, 512, 482–497. [Google Scholar] [CrossRef]
- Rossman, L.A. Storm Water Management Model User's Manual, Version 5.0; Water Supply and Water Resource Division, National Risk Management Research Laboratory, Office of Research and Development, US Environmental Protection Agency: Washington, DC, USA, 2010.
- Ouyang, W.; Guo, B.; Hao, F.; Huang, H.; Li, J.; Gong, Y. Modeling urban storm rainfall runoff from diverse underlying surfaces and application for control design in Beijing. J. Environ. Manag. 2012, 113, 467–473. [Google Scholar] [CrossRef] [PubMed]
- Vos, P.E.J.; Maiheu, B.; Vankerkom, J.; Janssen, S. Improving local air quality in cities: To tree or not to tree? Environ. Pollut. 2013, 183, 113–122. [Google Scholar] [CrossRef] [PubMed]
- Wang, Q.; Zhang, X.; Wei, M.; Zhou, Y.; Li, P.; Bai, G. Research summary of planning and design standards for storm water system in Beijing City. Water Wastewater Eng. 2011, 37, 34–39. [Google Scholar]
- Alley, W.M.; Veenhuis, J.E. Effective impervious area in urban runoff modeling. J. Hydraul. Eng. 1983, 109, 313–319. [Google Scholar] [CrossRef]
- Leopold, L.B. Hydrology for Urban Land Planning: A Guidebook on the Hydrologic Effects of Urban Land Use; United States Department of the Interior: Washington, DC, USA, 1968.
- Boyd, M.J.; Bufill, M.C.; Knee, R.M. Predicting pervious and impervious storm runoff from urban drainage basins. Hydrol. Sci. J. 1994, 39, 321–332. [Google Scholar] [CrossRef]
- Sillanpää, N.; Koivusalo, H. Impacts of urbanisation and event magnitude on runoff contributing area and runoff coefficients. In Proceedings of the 13th International Conference on Urban Drainage, Sarawak, Malesia, 7–11 September 2014.
- Guan, M.; Sillanpää, N.; Koivusalo, H. Storm runoff response to rainfall pattern, magnitude and urbanization in a developing urban catchment. Hydrol. Processes 2015. [Google Scholar] [CrossRef]
- Sheeder, S.A.; Ross, J.D.; Carlson, T.N. Dual urban and rural hydrograph signals in three small watersheds. J. Am. Water Resour. Assoc. 2002, 38, 1027–1040. [Google Scholar] [CrossRef]
- Berne, A.; Delrieu, G.; Creutin, J.-D.; Obled, C. Temporal and spatial resolution of rainfall measurements required for urban hydrology. J. Hydrol. 2004, 299, 166–179. [Google Scholar] [CrossRef]
- Di Lazzaro, M. Regional analysis of storm hydrographs in the Rescaled Width Function framework. J. Hydrol. 2009, 373, 352–365. [Google Scholar] [CrossRef]
- Mejía, A.I.; Moglen, G.E. Spatial distribution of imperviousness and the space-time variability of rainfall, runoff generation, and routing. Water Resour. Res. 2010, 46, W07509. [Google Scholar] [CrossRef]
- Jarden, K.M.; Jefferson, A.J.; Grieser, J.M. Assessing the effects of catchment-scale urban green infrastructure retrofits on hydrograph characteristics. Hydrol. Processes 2015. [Google Scholar] [CrossRef]
- Stone, B. Paving over paradise: How land use regulations promote residential imperviousness. Landsc. Urban Plan. 2004, 69, 101–113. [Google Scholar] [CrossRef]
- Moussa, R. What controls the width function shape, and can it be used for channel network comparison and regionalization? Water Resour. Res. 2008, 44, W08456. [Google Scholar] [CrossRef]
- Gilroy, K.L.; McCuen, R.H. Spatio-temporal effects of low impact development practices. J. Hydrol. 2009, 367, 228–236. [Google Scholar] [CrossRef]
- Jia, H.; Yao, H.; Shaw, L.Y. Advances in LID BMPs research and practice for urban runoff control in China. Front. Environ. Sci. Eng. 2013, 7, 709–720. [Google Scholar] [CrossRef]
- Schmitt, T.G.; Thomas, M.; Ettrich, N. Analysis and modeling of flooding in urban drainage systems. J. Hydrol. 2004, 299, 300–311. [Google Scholar] [CrossRef]
- Carter, T.; Jackson, C.R. Vegetated roofs for stormwater management at multiple spatial scales. Landsc. Urban Plan. 2007, 80, 84–94. [Google Scholar] [CrossRef]
- Yao, L.; Chen, L.; Wei, W.; Sun, R. Potential reduction in urban runoff by green spaces in Beijing: A scenario analysis. Urban For. Urban Green. 2015, 14, 300–308. [Google Scholar] [CrossRef]
- Mejía, A.I.; Moglen, G.E. Impact of the spatial distribution of imperviousness on the hydrologic response of an urbanizing basin. Hydrol. Processes 2010, 24, 3359–3373. [Google Scholar] [CrossRef]
- Aronica, G.; Lanza, L. Drainage efficiency in urban areas: A case study. Hydrol. Processes 2005, 19, 1105–1119. [Google Scholar] [CrossRef]
- Walsh, C.J.; Roy, A.H.; Feminella, J.W.; Cottingham, P.D.; Groffman, P.M.; Morgan, R.P., II. The urban stream syndrome: Current knowledge and the search for a cure. J. N. Am. Benthol. Soc. 2009, 24, 706–723. [Google Scholar] [CrossRef]
- Nardi, F.; Annis, A.; Biscarini, C. On the impact of urbanization on flood hydrology of small ungauged basins: The case study of the Tiber river tributary network within the city of Rome. J. Flood Risk Manag. 2015. [Google Scholar] [CrossRef]


| Catchment | Layout Type 1 | Catchment Area (ha) | Impervious Fraction (%) | Percent Land Cover (%) | Average Drainage Area 4 (Ad, ha) | Drainage Density 5 (m/ha) | ||||
|---|---|---|---|---|---|---|---|---|---|---|
| TIA 2 | DCIA 3 | Roof | Road | Tree | Lawn | |||||
| CAT 1 | Linear | 2.26 | 58.28 | 40.84 | 28.13 | 30.15 | 41.72 | - | 0.11 | 303.82 |
| CAT 2 | Interspersed | 4.17 | 68.18 | 50.34 | 34.36 | 33.82 | 0.83 | 30.99 | 0.14 | 307.45 |
| CAT 3 | Semi-enclosed | 4.81 | 73.68 | 65.11 | 33.78 | 39.89 | 22.03 | 4.29 | 0.11 | 316.86 |
| CAT 4 | Interspersed | 1.39 | 54.38 | 24.06 | 30.32 | 24.06 | 45.62 | - | 0.09 | 303.08 |
| CAT 5 | Semi-enclosed | 3.74 | 77.60 | 61.67 | 43.13 | 34.46 | 9.56 | 12.84 | 0.09 | 307.83 |
| CAT 6 | Interspersed | 5.07 | 53.03 | 38.47 | 27.63 | 25.39 | 34.57 | 12.40 | 0.09 | 302.35 |
| CAT 7 | Linear | 2.67 | 77.79 | 56.47 | 46.29 | 31.50 | 13.92 | 8.30 | 0.07 | 305.60 |
| CAT 8 | Linear | 6.18 | 72.65 | 59.20 | 46.36 | 27.29 | - | 27.35 | 0.18 | 304.24 |
| CAT 9 | Interspersed | 2.15 | 37.95 | 20.55 | 18.47 | 19.48 | 33.65 | 28.40 | 0.12 | 296.15 |
| CAT 10 | Semi-enclosed | 6.84 | 74.50 | 71.42 | 38.59 | 35.91 | 2.31 | 23.20 | 0.16 | 305.39 |
| CAT 11 | Interspersed | 2.73 | 48.56 | 19.27 | 34.94 | 13.62 | 12.17 | 39.27 | 0.16 | 302.13 |
| CAT 12 | Semi-enclosed | 5.88 | 72.73 | 65.01 | 53.64 | 19.10 | 27.27 | - | 0.08 | 304.17 |
| Land Cover | Manning’s Roughness | Depression Storage (mm) |
|---|---|---|
| Roads | 0.017 | 0.675 |
| Roofs | 0.008 | 0.100 |
| Lawns | 0.266 | 1.540 |
| Trees | 0.150 | 1.540 |
| Pipeline | 0.0123 | - |
| Catchments | 0.1 Year | 0.15 Year | 0.2 Year | 0.3 Year | 0.5 Year | 1 Year | 3 Year | 5 Year | 10 Year | |||||||||
|---|---|---|---|---|---|---|---|---|---|---|---|---|---|---|---|---|---|---|
| Qt | Qp | Qt | Qp | Qt | Qp | Qt | Qp | Qt | Qp | Qt | Qp | Qt | Qp | Qt | Qp | Qt | Qp | |
| CAT 1 | 3.29 | 0.08 | 4.29 | 0.15 | 9.15 | 0.27 | 14.19 | 0.40 | 21.97 | 0.66 | 32.50 | 1.02 | 49.52 | 1.68 | 57.48 | 2.01 | 68.53 | 2.46 |
| CAT 2 | 4.22 | 0.13 | 5.45 | 0.23 | 11.66 | 0.40 | 16.79 | 0.57 | 24.23 | 0.87 | 34.78 | 1.25 | 51.82 | 1.90 | 59.97 | 2.22 | 71.01 | 2.66 |
| CAT 3 | 7.46 | 0.16 | 9.54 | 0.30 | 18.79 | 0.51 | 25.36 | 0.74 | 33.67 | 1.09 | 45.10 | 1.54 | 62.98 | 2.26 | 71.50 | 2.60 | 82.72 | 3.08 |
| CAT 4 | 1.84 | 0.05 | 2.43 | 0.10 | 7.72 | 0.22 | 12.99 | 0.42 | 20.86 | 0.83 | 31.40 | 1.32 | 48.58 | 2.12 | 56.67 | 2.50 | 67.71 | 3.02 |
| CAT 5 | 4.87 | 0.10 | 6.21 | 0.18 | 13.20 | 0.33 | 19.22 | 0.49 | 27.31 | 0.77 | 38.28 | 1.14 | 55.68 | 1.79 | 63.98 | 2.11 | 74.96 | 2.55 |
| CAT 6 | 3.04 | 0.08 | 3.91 | 0.15 | 8.39 | 0.25 | 12.54 | 0.36 | 19.48 | 0.55 | 29.41 | 0.82 | 45.99 | 1.33 | 53.89 | 1.58 | 64.75 | 1.94 |
| CAT 7 | 4.79 | 0.10 | 6.28 | 0.17 | 13.95 | 0.33 | 19.85 | 0.52 | 27.82 | 0.85 | 38.88 | 1.25 | 56.45 | 1.92 | 64.68 | 2.25 | 75.90 | 2.70 |
| CAT 8 | 4.71 | 0.11 | 5.97 | 0.20 | 12.08 | 0.34 | 17.31 | 0.49 | 24.59 | 0.72 | 35.10 | 1.03 | 52.08 | 1.56 | 60.17 | 1.82 | 71.17 | 2.19 |
| CAT 9 | 1.59 | 0.04 | 2.09 | 0.08 | 5.35 | 0.14 | 8.70 | 0.22 | 15.17 | 0.40 | 24.75 | 0.66 | 40.99 | 1.12 | 48.85 | 1.36 | 59.55 | 1.69 |
| CAT 10 | 5.68 | 0.12 | 7.17 | 0.22 | 14.04 | 0.38 | 19.31 | 0.56 | 26.92 | 0.83 | 37.60 | 1.19 | 54.86 | 1.81 | 63.05 | 2.12 | 74.17 | 2.54 |
| CAT 11 | 1.76 | 0.04 | 2.75 | 0.09 | 7.41 | 0.22 | 11.96 | 0.36 | 19.33 | 0.64 | 29.60 | 0.99 | 46.59 | 1.60 | 54.29 | 1.90 | 65.30 | 2.33 |
| CAT 12 | 5.23 | 0.16 | 6.63 | 0.28 | 13.38 | 0.45 | 18.70 | 0.64 | 26.34 | 0.95 | 37.05 | 1.35 | 54.39 | 2.04 | 62.54 | 2.38 | 73.59 | 2.85 |
| Rainfall Condition | Qt | Qp | ||
|---|---|---|---|---|
| Regression Model | R2 | Regression Model | R2 | |
| 0.1 year | Qt = 0.900 × DCIA ** − 0.251 | 0.878 | Qp = 0.002 × DCIA ** − 0.511 × Ad ** + 0.005 * | 0.926 |
| 0.15 year | Qt = 0.110 × DCIA ** | 0.857 | Qp = 0.004 × DCIA ** − 0.918 × Ad ** + 0.088 ** | 0.908 |
| 0.2 year | Qt = 0.181 × DCIA ** + 2.637 | 0.801 | Qp = 0.006 × DCIA ** − 1.221 × Ad * + 0.168 ** | 0.868 |
| 0.3 year | Qt = 0.309 × TIA ** − 3.383 | 0.808 | Qp = 0.013 × TIA ** − 2.406 × Ad ** − 0.043 | 0.915 |
| 0.5 year | Qt = 0.336 × TIA ** + 2.432 | 0.806 | Qp = 0.016 × TIA ** − 3.674 × Ad ** + 0.136 | 0.900 |
| 1 year | Qt = 0.368 × TIA ** + 10.969 * | 0.804 | Qp = 0.034 × TIA ** − 0.009 × DCIA * − 5.389 × Ad ** + 0.048 | 0.919 |
| 3 year | Qt = 0.394 × TIA ** + 26.409 ** | 0.799 | Qp = 0.050 × TIA ** − 0.017 × DCIA * − 7.567 × Ad ** + 0.255 | 0.901 |
| 5 year | Qt = 0.407 × TIA ** + 33.645 ** | 0.799 | Qp = 0.057 × TIA ** − 0.020 × DCIA * − 8.524 × Ad ** + 0.391 | 0.892 |
| 10 year | Qt = 0.415 × TIA ** + 44.160 ** | 0.798 | Qp = 0.065 × TIA ** − 0.024 × DCIA * − 9.719 × Ad ** + 0.591 | 0.881 |
© 2017 by the authors. Licensee MDPI, Basel, Switzerland. This article is an open access article distributed under the terms and conditions of the Creative Commons Attribution (CC BY) license ( http://creativecommons.org/licenses/by/4.0/).
Share and Cite
Yao, L.; Chen, L.; Wei, W. Exploring the Linkage between Urban Flood Risk and Spatial Patterns in Small Urbanized Catchments of Beijing, China. Int. J. Environ. Res. Public Health 2017, 14, 239. https://doi.org/10.3390/ijerph14030239
Yao L, Chen L, Wei W. Exploring the Linkage between Urban Flood Risk and Spatial Patterns in Small Urbanized Catchments of Beijing, China. International Journal of Environmental Research and Public Health. 2017; 14(3):239. https://doi.org/10.3390/ijerph14030239
Chicago/Turabian StyleYao, Lei, Liding Chen, and Wei Wei. 2017. "Exploring the Linkage between Urban Flood Risk and Spatial Patterns in Small Urbanized Catchments of Beijing, China" International Journal of Environmental Research and Public Health 14, no. 3: 239. https://doi.org/10.3390/ijerph14030239
APA StyleYao, L., Chen, L., & Wei, W. (2017). Exploring the Linkage between Urban Flood Risk and Spatial Patterns in Small Urbanized Catchments of Beijing, China. International Journal of Environmental Research and Public Health, 14(3), 239. https://doi.org/10.3390/ijerph14030239