
Determination of Histamine in Silages Using Nanomaghemite Core (γ-Fe2O3)-Titanium Dioxide Shell Nanoparticles Off-Line Coupled with Ion Exchange Chromatography

 ,
, 


Abstract
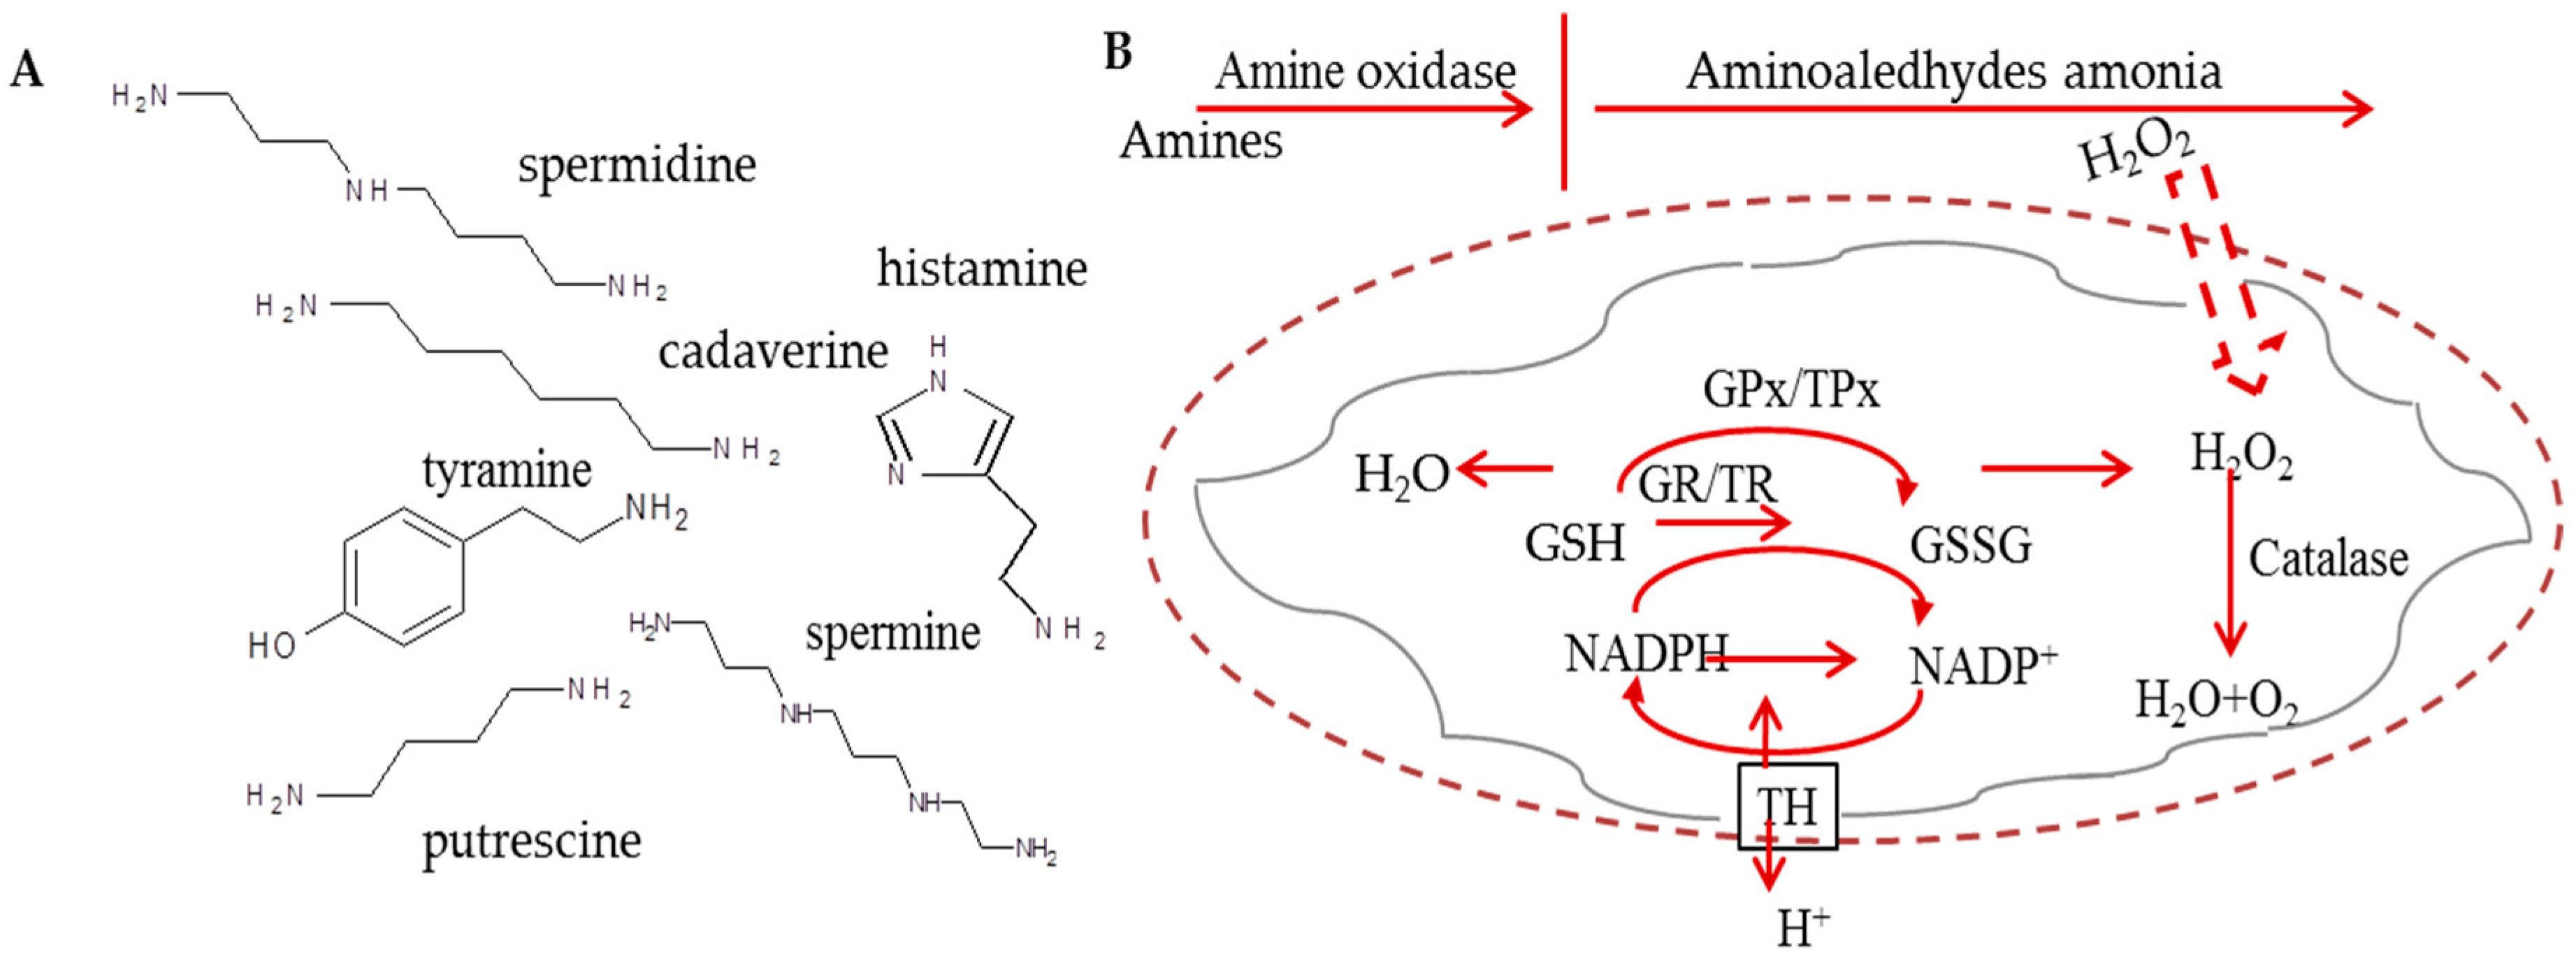
:1. Introduction
2. Materials and Methods
2.1. Chemicals
2.2. Real Samples of Silage
2.3. Synthesis of Paramagnetic Microparticles
2.4. X-ray Fluorescence Analysis
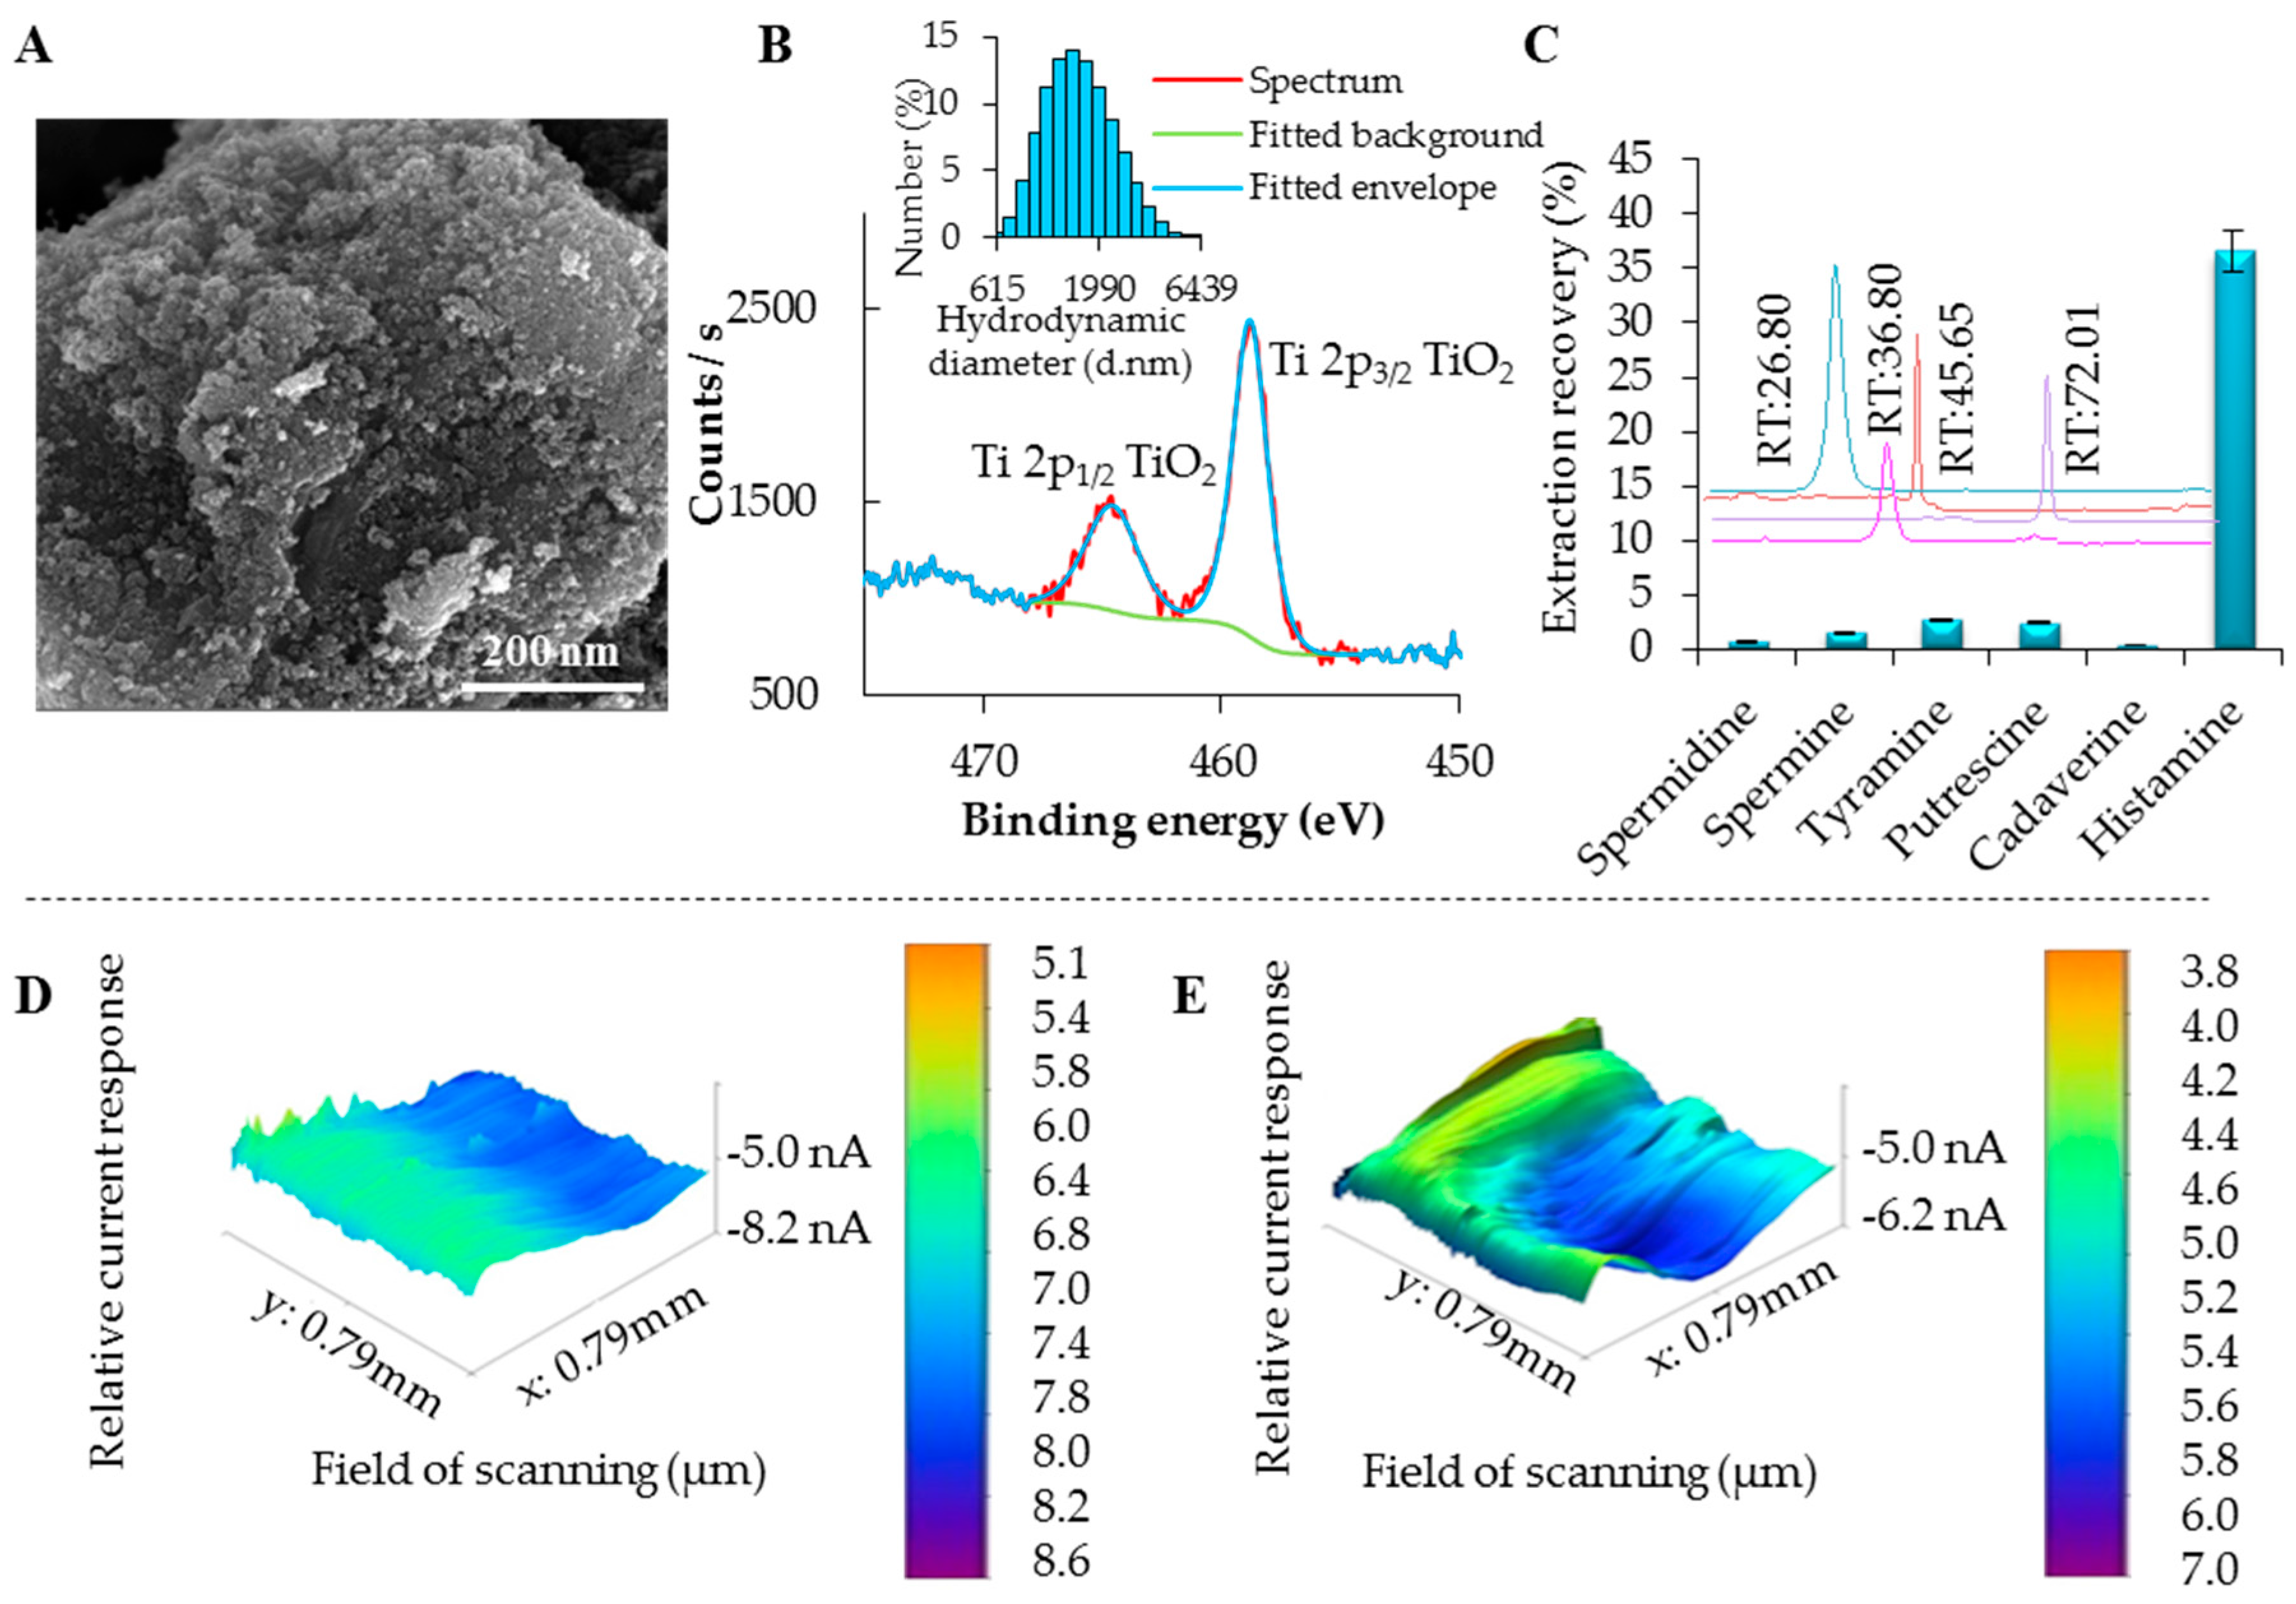
2.5. Scanning Electron Microscopy
2.6. Scanning Electrochemical Microscopy
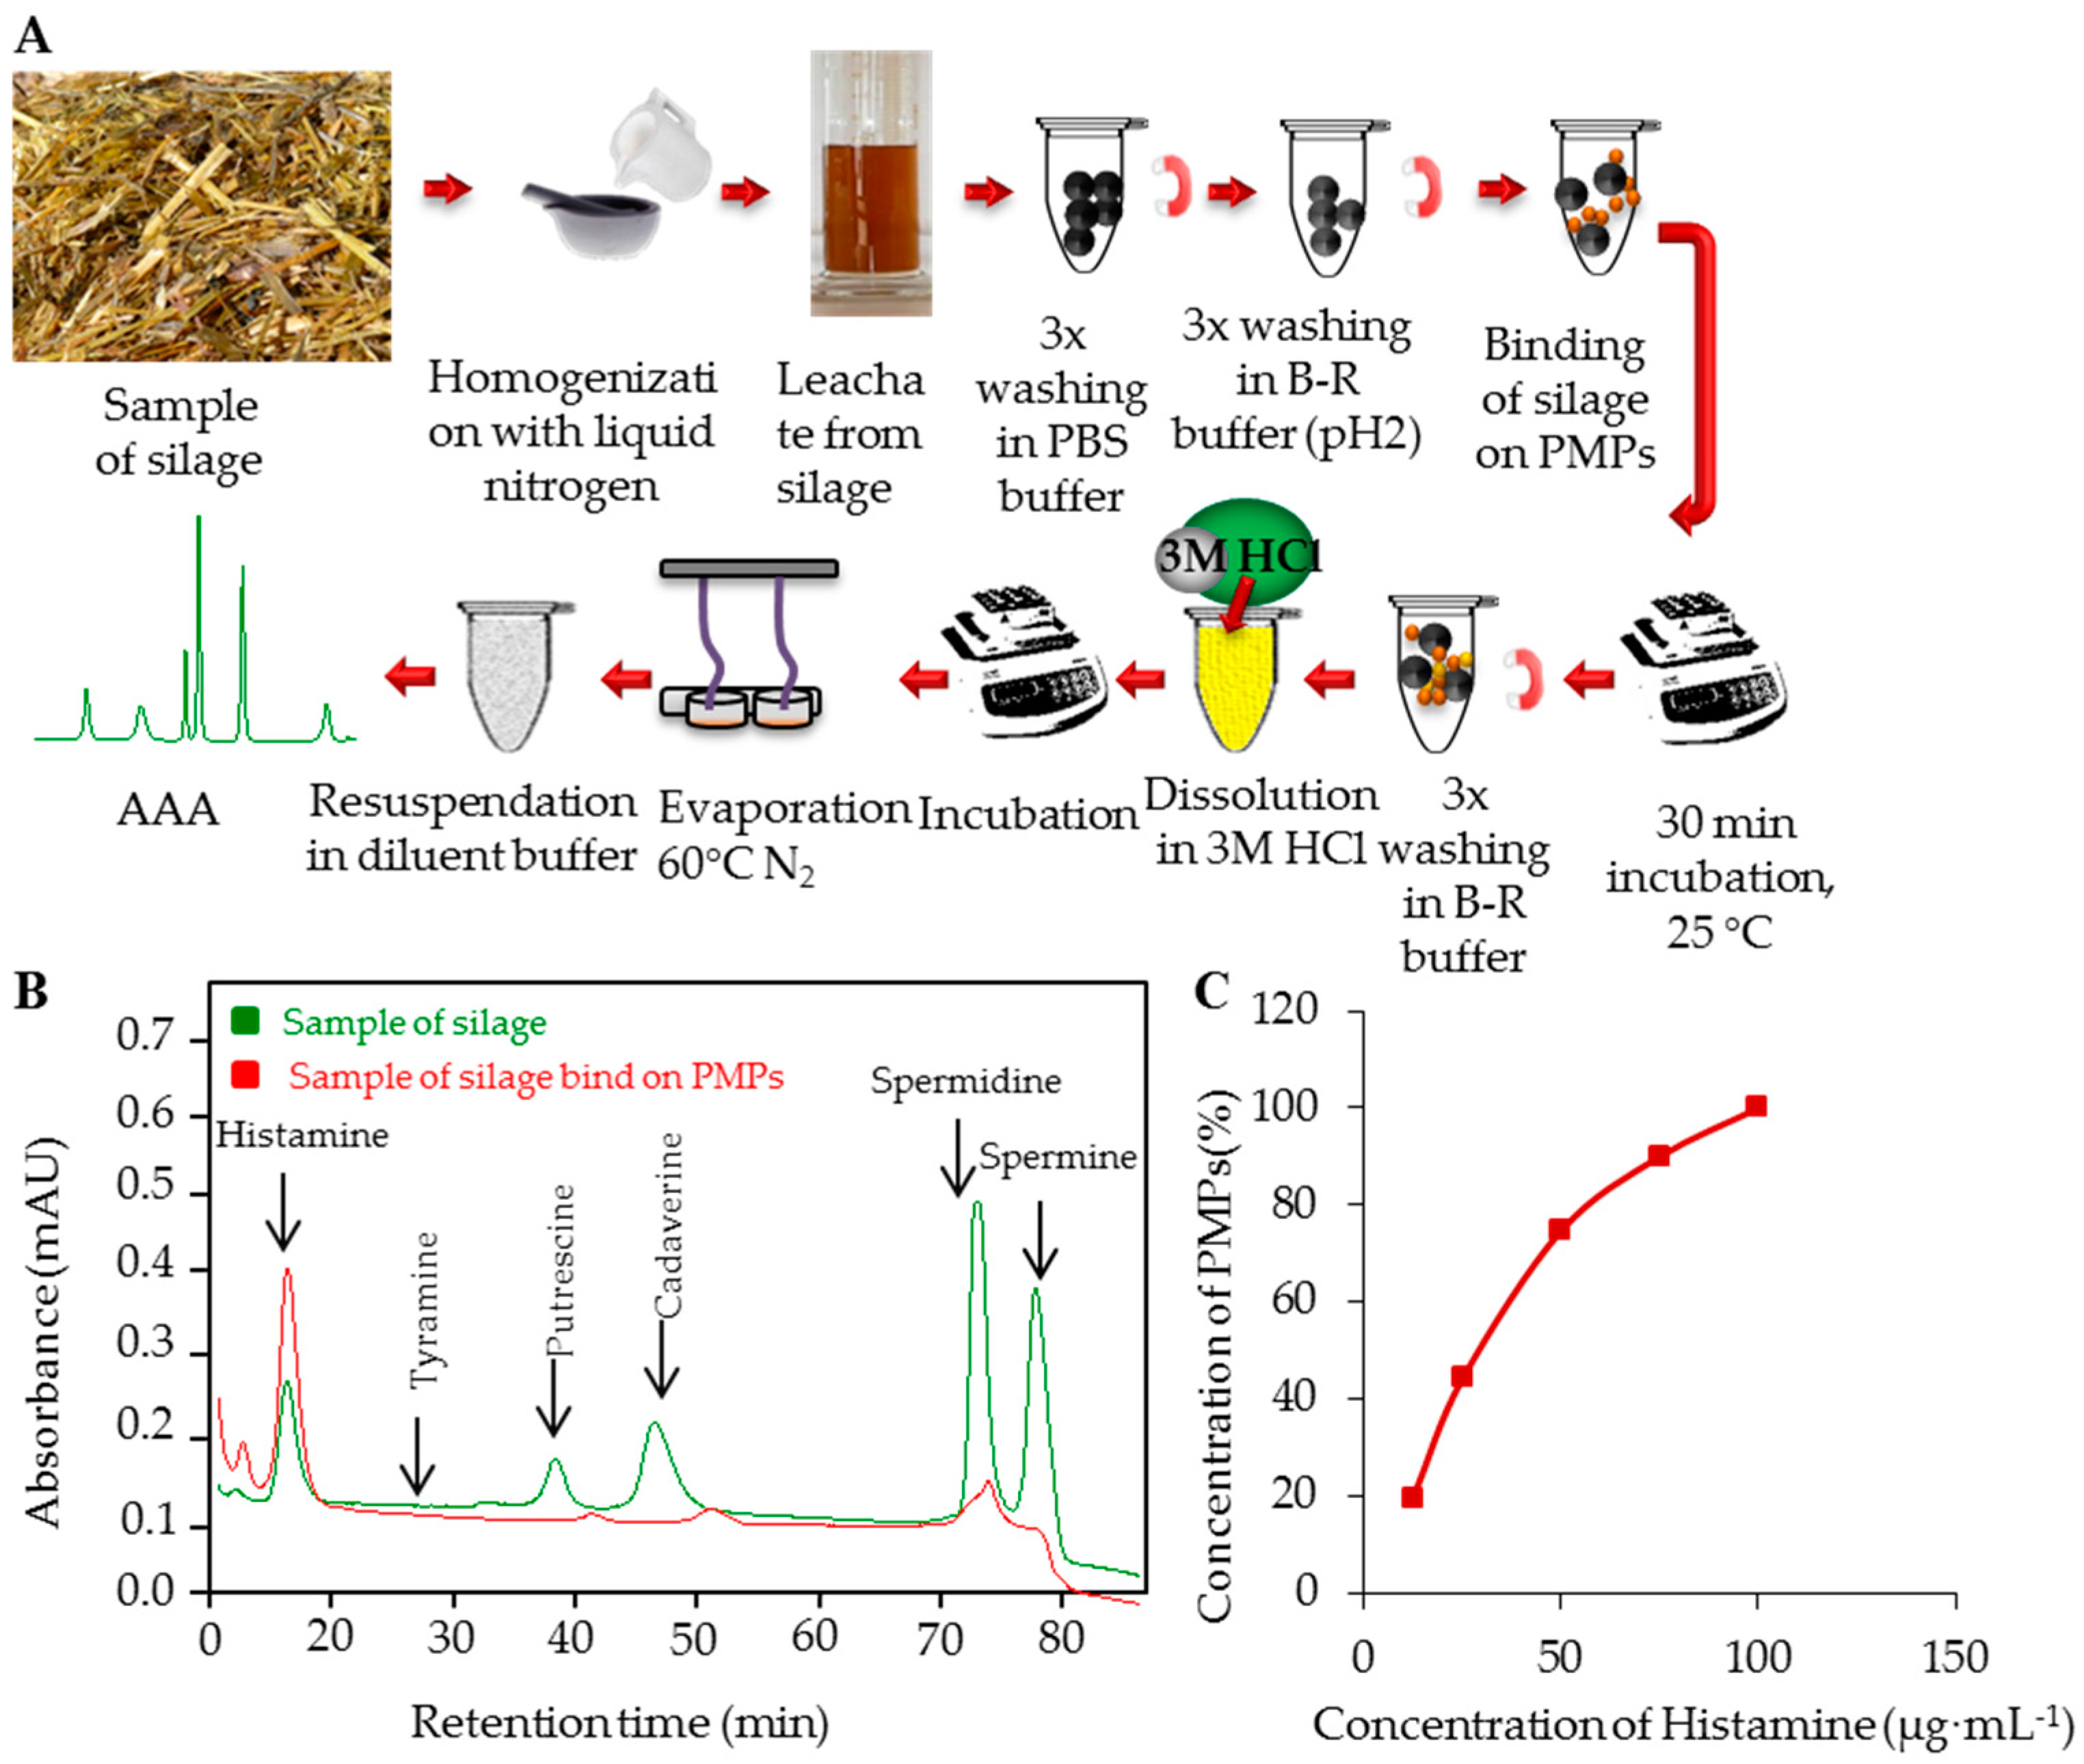
2.7. Sample Preparation
2.8. Ion-Exchange Chromatography
2.9. Recovery
2.10. Descriptive Statistics
3. Results and Discussion
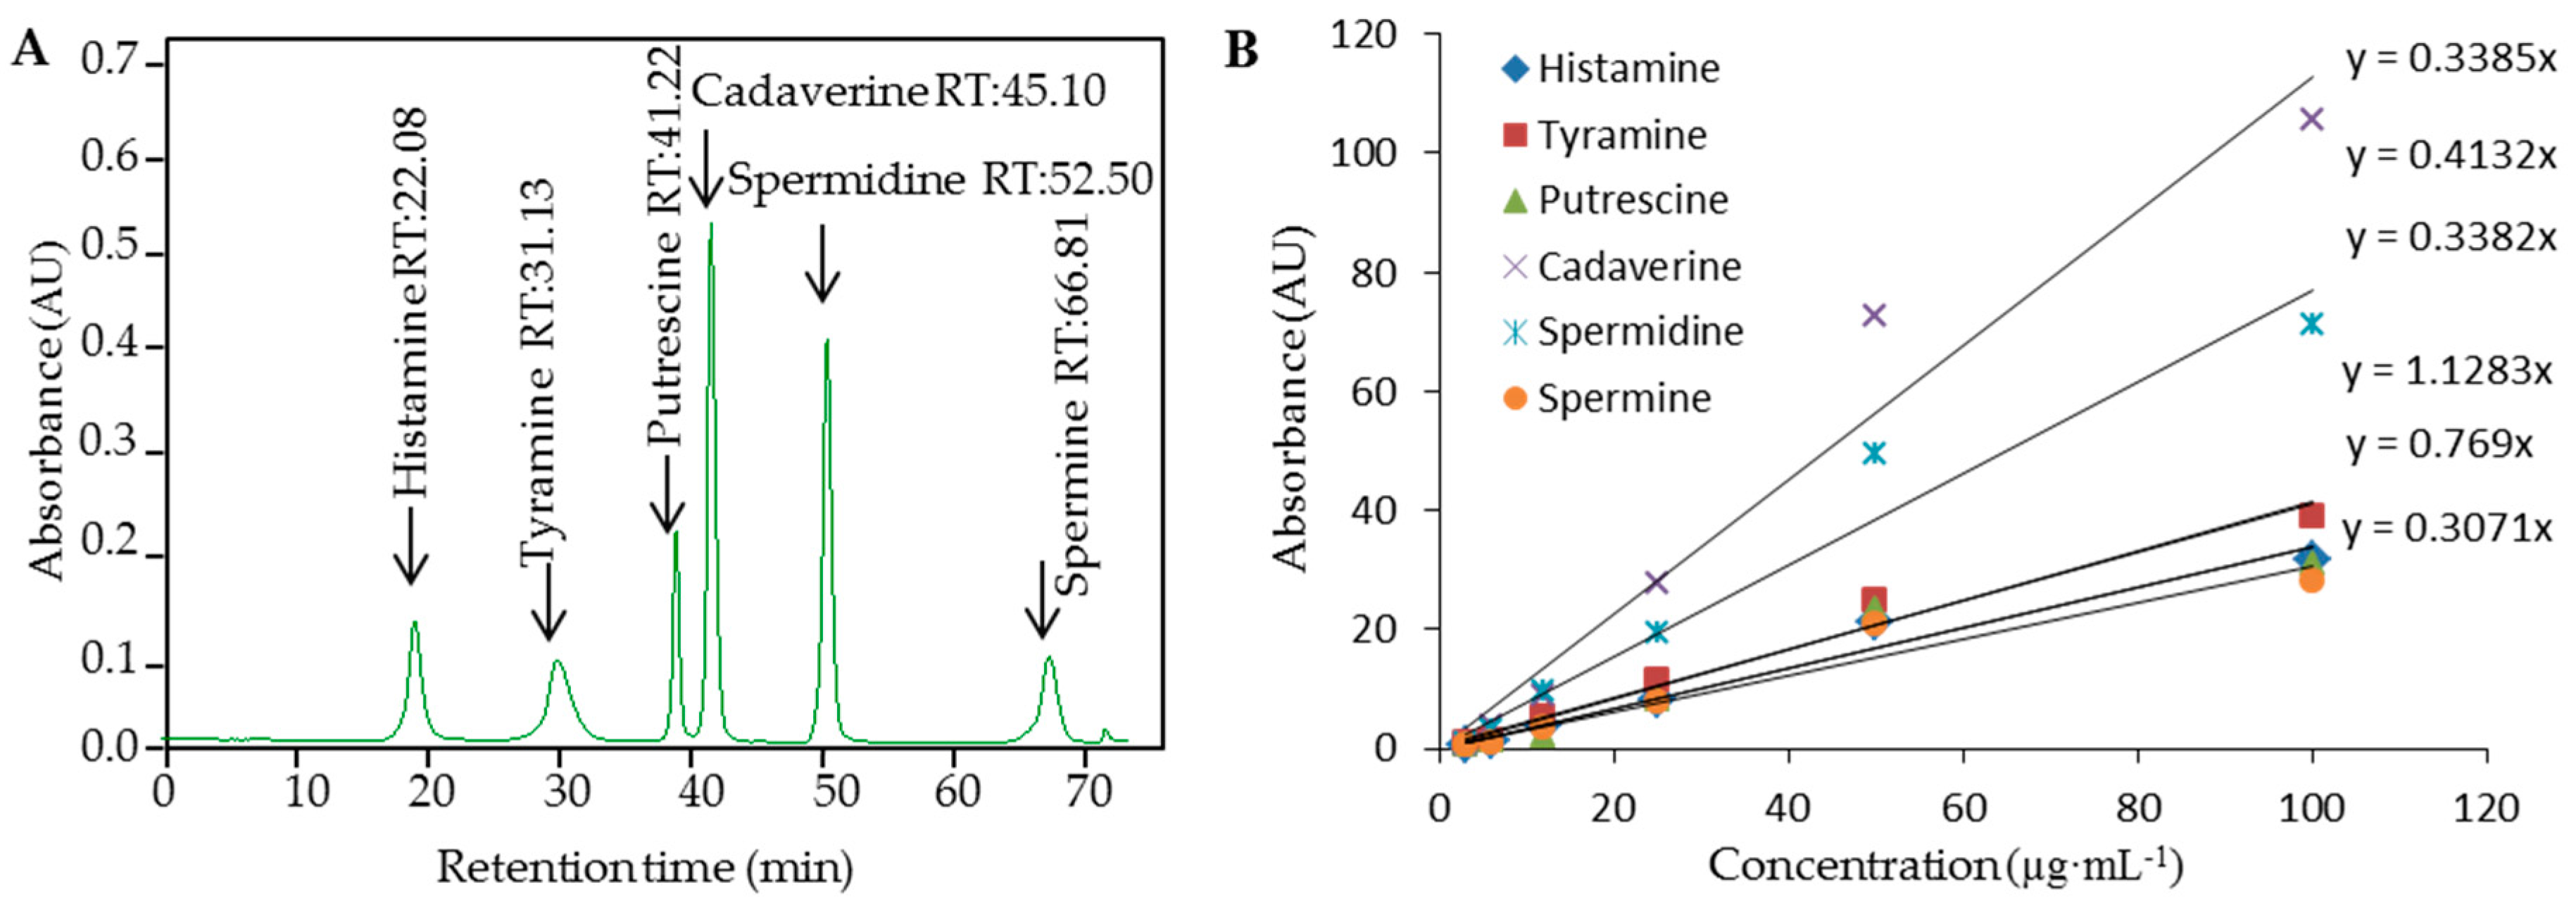
3.1. Ion-Exchange Liquid Chromatography with Vis Detection of Biogenic Amines
3.2. PMPs-Based Isolation of BAs
3.3. SECM Analysis
3.4. Real Samples Analyses
4. Conclusions
Supplementary Materials
Acknowledgments
Author Contributions
Conflicts of Interest
References
- Sirocchi, V.; Caprioli, G.; Cecchini, C.; Coman, M.M.; Cresci, A.; Maggi, F.; Papa, F.; Ricciutelli, M.; Vittori, S.; Sagratini, G. Biogenic amines as freshness index of meat wrapped in a new active packaging system formulated with essential oils of rosmarinus officinalis. Int. J. Food Sci. Nutr. 2013, 64, 921–928. [Google Scholar] [CrossRef] [PubMed]
- Agostinelli, E.; Arancia, G.; Dalla Vedova, L.; Belli, F.; Marra, M.; Salvi, M.; Toninello, A. The biological functions of polyamine oxidation products by amine oxidases: Perspectives of clinical applications. Amino Acids 2004, 27, 347–358. [Google Scholar] [CrossRef] [PubMed]
- Mayer, H.K.; Fiechter, G.; Fischer, E. A new ultra-pressure liquid chromatography method for the determination of biogenic amines in cheese. J. Chromatogr. A 2010, 1217, 3251–3257. [Google Scholar] [CrossRef] [PubMed]
- Reguant, C.; Araque, I.; Bordons, A. Role of lactic acid bacteria in wine. In Beneficial Microbes in Fermented and Functional Foods; CRC Press: Boca Raton, FL, USA, 2014. [Google Scholar]
- Kalac, P.; Krausova, P. A review of dietary polyamines: Formation, implications for growth and health and occurrence in foods. Food Chem. 2005, 90, 219–230. [Google Scholar] [CrossRef]
- Bardocz, S.; Duguid, T.J.; Brown, D.S.; Grant, G.; Pusztai, A.; White, A.; Ralph, A. The importance of dietary polyamines in cell regeneration and growth. Br. J. Nutr. 1995, 73, 819–828. [Google Scholar] [CrossRef] [PubMed]
- Linares, D.M.; del Rio, B.; Redruello, B.; Ladero, V.; Martin, M.C.; Fernandez, M.; Ruas-Madiedo, P.; Alvarez, M.A. Comparative analysis of the in vitro cytotoxicity of the dietary biogenic amines tyramine and histamine. Food Chem. 2016, 197, 658–663. [Google Scholar] [CrossRef] [PubMed]
- Middlebrooks, B.L.; Toom, P.M.; Douglas, W.L.; Harrison, R.E.; McDowell, S. Effects of storage time and temperature in the microflora and amine development in spanish mackrel (scomberomorus-maculatus). J. Food Sci. 1988, 53, 1024–1029. [Google Scholar] [CrossRef]
- Dulphy, J.P.; VanOs, M. Control of voluntary intake of precision-chopped silages by ruminants: A review. Reprod. Nutr. Dev. 1996, 36, 113–135. [Google Scholar] [CrossRef] [PubMed]
- Steidlova, S.; Kalac, P. Levels of biogenic amines in maize silages. Anim. Feed Sci. Technol. 2002, 102, 197–205. [Google Scholar] [CrossRef]
- Duniere, L.; Sindou, J.; Chaucheyras-Durand, F.; Chevallier, I.; Thevenot-Sergentet, D. Silage processing and strategies to prevent persistence of undesirable microorganisms. Anim. Feed Sci. Technol. 2013, 182, 1–15. [Google Scholar] [CrossRef]
- Taylor, S.L.; Speckhard, M.W. Isolation of histamine-producing bacteria from frozen tuna. Mar. Fish. Rev. 1983, 45, 35–39. [Google Scholar]
- Tao, Z.H.; Sato, M.; Han, Y.L.; Tan, Z.J.; Yamaguchi, T.; Nakano, T. A simple and rapid method for histamine analysis in fish and fishery products by TLC determination. Food Control 2011, 22, 1154–1157. [Google Scholar] [CrossRef]
- Tang, W.R.; Ge, S.L.; Gao, F.; Wang, G.; Wang, Q.J.; He, P.G.; Fang, Y.Z. On-line sample preconcentration technique based on a dynamic pH junction in CE-amperometric detection for the analysis of biogenic amines in urine. Electrophoresis 2013, 34, 2041–2048. [Google Scholar] [CrossRef] [PubMed]
- Cernei, N.; Heger, Z.; Kopel, P.; Skladanka, J.; Zitka, O.; Adam, V.; Kizek, R. Isolation of biogenic amines using paramagnetic microparticles off-line coupled with ion exchange liquid chromatography. Chromatographia 2014, 77, 1451–1459. [Google Scholar] [CrossRef]
- Kim, T.K.; Lee, J.I.; Kim, J.H.; Mah, J.H.; Hwang, H.J.; Kim, Y.W. Comparison of ELISA and HPLC methods for the determination of biogenic amines in commercial doenjang and gochujang. Food Sci. Biotechnol. 2011, 20, 1747–1750. [Google Scholar] [CrossRef]
- Deng, Y.H.; Zhang, H.S.; Du, X.L.; Wang, H. Quantification of biogenic amines in human plasma based on the derivatization with n-hydroxy-succinimidyl fluorescelin-o-acetate by high-performance liquid chromatography. J. Sep. Sci. 2008, 31, 990–998. [Google Scholar] [CrossRef] [PubMed]
- Bilgin, B.; Genccelep, H. Determination of biogenic amines in fish products. Food Sci. Biotechnol. 2015, 24, 1907–1913. [Google Scholar] [CrossRef]
- Zitka, O.; Cernei, N.; Heger, Z.; Matousek, M.; Kopel, P.; Kynicky, J.; Masarik, M.; Kizek, R.; Adam, V. Microfluidic chip coupled with modified paramagnetic particles for sarcosine isolation in urine. Electrophoresis 2013, 34, 2639–2647. [Google Scholar] [CrossRef] [PubMed]
- He, J.C.; Huang, M.Y.; Wang, D.M.; Zhang, Z.M.; Li, G.K. Magnetic separation techniques in sample preparation for biological analysis: A review. J. Pharm. Biomed. Anal. 2014, 101, 84–101. [Google Scholar] [CrossRef] [PubMed]
- Heger, Z.; Cernei, N.; Guran, R.; Michalek, P.; Milosavljevic, V.; Kopel, P.; Zitka, O.; Kynicky, J.; Lany, P.; Adam, V.; et al. γ-Fe2O3 magnetic core functionalized with tetraethyl orthosilicate and 3-aminopropyl triethoxysilane for an isolation of H7N7 influenza serotype virions. Int. J. Electrochem. Sci. 2014, 9, 3374–3385. [Google Scholar]
- Heger, Z.; Zitka, J.; Cernei, N.; Krizkova, S.; Sztalmachova, M.; Kopel, P.; Masarik, M.; Hodek, P.; Zitka, O.; Adam, V.; et al. 3D-printed biosensor with poly (dimethylsiloxane) reservoir for magnetic separation and quantum dots-based immunolabeling of metallothionein. Electrophoresis 2015, 36, 1256–1264. [Google Scholar] [CrossRef] [PubMed]
- Causon, R. Validation of chromatographic methods in biomedical analysis—Viewpoint and discussion. J. Chromatogr. B 1997, 689, 175–180. [Google Scholar] [CrossRef]
- Bugianesi, R.; Serafini, M.; Simone, F.; Wu, D.Y.; Meydani, S.; Ferro-Luzzi, A.; Azzini, E.; Maiani, G. High-performance liquid chromatography with coulometric electrode array detector for the determination of quercetin levels in cells of the immune system. Anal. Biochem. 2000, 284, 296–300. [Google Scholar] [CrossRef] [PubMed]
- Long, G.L.; Winefordner, J.D. Limit of detection. Anal. Chem. 1983, 55, 712–724. [Google Scholar]
- Busto, O.; Miracle, M.; Guasch, J.; Borrull, F. Determination of biogenic amines in wines by high-performance liquid chromatography with on-column fluorescence derivatization. J. Chromatogr. A 1997, 757, 311–318. [Google Scholar] [CrossRef]
- Oguri, S.; Watanabe, S.; Abe, S. Determination of histamine and some other amines by high-performance capillary electrophoresis with on-line mode in-capillary derivatization. J. Chromatogr. A 1997, 790, 177–183. [Google Scholar] [CrossRef]
- Sadain, S.K.; Koropchak, J.A. Condensation nucleation light scattering detection for biogenic amines separated by ion-exchange chromatography. J. Chromatogr. A 1999, 844, 111–118. [Google Scholar] [CrossRef]
- Sadain, S.K.; Koropchak, J.A. Condensation nucleation light scattering detection (CNLSD) for ion chromatography. J. Liq. Chromatogr. Relat. Technol. 1999, 22, 799–811. [Google Scholar] [CrossRef]
- Magro, M.; Sinigaglia, G.; Nodari, L.; Tucek, J.; Polakova, K.; Marusak, Z.; Cardillo, S.; Salviulo, G.; Russo, U.; Stevanato, R.; et al. Charge binding of rhodamine derivative to OH− stabilized nanomaghemite: Universal nanocarrier for construction of magnetofluorescent biosensors. Acta Biomater. 2012, 8, 2068–2076. [Google Scholar] [CrossRef] [PubMed]
- Kopel, P.; Wawrzak, D.; Langer, V.; Cihalova, K.; Chudobova, D.; Vesely, R.; Adam, V.; Kizek, R. Biological activity and molecular structures of bis (benzimidazole) and trithiocyanurate complexes. Molecules 2015, 20, 10360–10376. [Google Scholar] [CrossRef] [PubMed]
- De Robertis, A.; De Stefano, C.; Gianguzza, A.; Sammartano, S. Binding of polyanions by biogenic amines. I. Formation and stability of protonated putrescine and cadaverine complexes with inorganic anions. Talanta 1998, 46, 1085–1093. [Google Scholar] [CrossRef]
- Karamani, A.A.; Douvalis, A.P.; Stalikas, C.D. Zero-valent iron/iron oxide-oxyhydroxide/graphene as a magnetic sorbent for the enrichment of polychlorinated biphenyls, polyaromatic hydrocarbons and phthalates prior to gas chromatography-mass spectrometry. J. Chromatogr. A 2013, 1271, 1–9. [Google Scholar] [CrossRef] [PubMed]
- Pamme, N. Magnetic nanoparticles in lab-on-a-chip devices. In Magnetic Nanoparticles; CRC Press: Boca Raton, FL, USA, 2012. [Google Scholar]
- Issadore, D.; Park, Y.I.; Shao, H.; Min, C.; Lee, K.; Liong, M.; Weissleder, R.; Lee, H. Magnetic sensing technology for molecular analyses. Lab Chip 2014, 14, 2385–2397. [Google Scholar] [CrossRef] [PubMed]


| MAN18 | Recovery (%) |
|---|---|
| Cadaverine | 0.3 |
| Spermidine | 0.7 |
| Spermine | 1.5 |
| Putrescine | 2.4 |
| Tyramine | 2.6 |
| Histamine | 90.0 |
| Compound | Mr (g·mol−1) | Regression Equation | Linear Dynamic Range (μg·mL−1) | R2 | LOD (μg·mL−1) | LOQ (μg·mL−1) | RSD (%) |
|---|---|---|---|---|---|---|---|
| Histamine | 111.2 | y = 0.3234x | 3.0–100.0 | 0.996 | 2 | 7 | 2.0 |
| Date of Sampling | 31 October 2015 | 31 October 2015 | 31 October 2015 | 25 November 2015 | 25 November 2015 | 25 November 2015 | 25 November 2015 |
|---|---|---|---|---|---|---|---|
| Concentration of Histamine | (µg·mL−1) | (µg·mL−1) | (µg·mL−1) | (µg·mL−1) | (µg·mL−1) | (µg·mL−1) | (µg·mL−1) |
| IEC | 750 | 420 | 60 | 43 | 56 | 42 | 58 |
| PMPs (2 mg) | 280 | 152 | 22 | 16 | 20 | 15 | 21 |
| PMPs (12 mg) | 690 | 380 | 54 | 39 | 50 | 38 | 52 |
© 2016 by the authors; licensee MDPI, Basel, Switzerland. This article is an open access article distributed under the terms and conditions of the Creative Commons Attribution (CC-BY) license (http://creativecommons.org/licenses/by/4.0/).
Share and Cite
Cernei, N.; Lackova, Z.; Guran, R.; Hynek, D.; Skladanka, J.; Horky, P.; Zitka, O.; Adam, V. Determination of Histamine in Silages Using Nanomaghemite Core (γ-Fe2O3)-Titanium Dioxide Shell Nanoparticles Off-Line Coupled with Ion Exchange Chromatography. Int. J. Environ. Res. Public Health 2016, 13, 904. https://doi.org/10.3390/ijerph13090904
Cernei N, Lackova Z, Guran R, Hynek D, Skladanka J, Horky P, Zitka O, Adam V. Determination of Histamine in Silages Using Nanomaghemite Core (γ-Fe2O3)-Titanium Dioxide Shell Nanoparticles Off-Line Coupled with Ion Exchange Chromatography. International Journal of Environmental Research and Public Health. 2016; 13(9):904. https://doi.org/10.3390/ijerph13090904
Chicago/Turabian StyleCernei, Natalia, Zuzana Lackova, Roman Guran, David Hynek, Jiri Skladanka, Pavel Horky, Ondrej Zitka, and Vojtech Adam. 2016. "Determination of Histamine in Silages Using Nanomaghemite Core (γ-Fe2O3)-Titanium Dioxide Shell Nanoparticles Off-Line Coupled with Ion Exchange Chromatography" International Journal of Environmental Research and Public Health 13, no. 9: 904. https://doi.org/10.3390/ijerph13090904
APA StyleCernei, N., Lackova, Z., Guran, R., Hynek, D., Skladanka, J., Horky, P., Zitka, O., & Adam, V. (2016). Determination of Histamine in Silages Using Nanomaghemite Core (γ-Fe2O3)-Titanium Dioxide Shell Nanoparticles Off-Line Coupled with Ion Exchange Chromatography. International Journal of Environmental Research and Public Health, 13(9), 904. https://doi.org/10.3390/ijerph13090904