Abstract
Background: Childhood obesity has become one of the most serious public health challenges in the 21st century in most developing countries. The percentile curve tool is useful for monitoring and screening obesity at population level, however, in China, no official recommendations on childhood body mass index (BMI) and waist circumference (WC) reference percentiles have been made in practice. Aims: to construct the percentile reference values for BMI and WC, and then to calculate the prevalence of overall and abdominal obesity for Chinese children and adolescents. Methods: A total of 5062 anthropometric records for children and adolescents aged from 7 to 18 years (2679 boys and 2383 girls) were included for analysis. The participants were recruited as part of the national representative “China Health and Nutrition Survey” (CHNS). Age, gender, weight, height, and WC were assessed. Smoothed BMI and WC percentile curves and values for the 3rd, 5th, 10th, 15th, 25th, 50th, 75th, 85th, 90th, 95th and 97th percentiles were constructed by using the Lambda-Mu-Sigma (LMS) method. The prevalence estimates of the overall and abdominal obesity were calculated by using the cut-offs from our CHNS study and the previous “Chinese National Survey on Students’ Constitution and Health” (CNSSCH) study, respectively. The difference between prevalence estimates was tested by a McNemar test, and the agreement between these prevalence estimates was calculated by using the Cohen’s kappa coefficient. Results: The prevalence values of overall obesity based on the cut-offs from CHNS and CNSSCH studies were at an almost perfect agreement level in boys (κ = 0.93). However, among girls, the overall obesity prevalence differed between the studies (p < 0.001) and the agreement was weaker (κ = 0.76). The abdominal obesity prevalence estimates were significant different according to the two systems both in boys and girls, although the agreement reached to 0.88, which represented an almost perfect agreement level. Conclusions: This study provided new BMI and WC percentile curves and reference values for Chinese children and adolescents aged 7–18 years, which can be adopted in future researches. Large longitudinal study is still needed to reveal the childhood growth pattern and validate the inconsistence between different percentile studies.
1. Introduction
Childhood obesity, defined as an excessive fat accumulation status in children [1,2], has become one of the most serious public health challenges in the 21st century [3]. Globally, approximately 170 million children (aged less than 18 years) are suffering from the physical and psychological consequences caused by overweight or obesity [4,5], which may result in decreased life quality and increased risk of developing non-communicable diseases such as cardiovascular disease, type 2 diabetes and cancers in their later adulthood life [6,7]. Although there are still many regions struggling with child hunger, such as South-eastern Asia and Sub-Saharan Africa [8], the childhood obesity has already reached endemic proportions by extending to developing countries, including China [9,10].
At the population level, percentile curve is a useful tool for monitoring and screening obesity among school-aged children and adolescents [11]. For measuring overall obesity, the most commonly used indicator is Body Mass Index (BMI) [12]. Generally, overweight and obesity in children are defined respectively based on the 85th percentile and 95th percentile of BMI among children [13]. Although BMI has been used to demonstrate the weight-for-height relationship and to some extent can provide an estimate of the body fat percentage, BMI alone cannot reflect the fat distribution very comprehensively, such as the abdominal fat deposits [14].
Abdominal obesity, which is the deposition of visceral fat, is associated with higher risk of metabolic complications, such as hyperlipidaemia, and diabetes [15,16]. Commonly adopted predictive indicators of abdominal obesity include waist circumference (WC) and related indices such as the waist-to-height and waist-to-hip ratios [16,17,18]. WC is a relatively simple and convenient measure and can be readily used to estimate the accumulation of abdominal fat [19]. Given that children are growing and their bodies are developing over the years, a uniform referent value may not be appropriate. Previous literates suggest the use of age- and gender-specific WC ≥ 90th percentile as the threshold for abdominal obesity [18,20,21].
In China, no official recommendations on childhood BMI and WC reference percentiles have been made in clinical or population practice, however, based on different investigations, several reference percentiles have been established at both local and national levels [22,23,24,25,26]. Among them, the most nationally representative BMI and WC percentiles were generated based on a large cross-sectional school-based study conducted in 2005, namely, the “Chinese National Survey on Students’ Constitution and Health” (CNSSCH) [24,27], which participants included students from primary and high schools aged 7–18 years [28]. The main limitation of the study was that the percentiles were established based on only cross-sectional data, this may therefore limit the reflection of the real BMI and WC growth pattern with age [24,27]. In addition, the childhood growth pattern changes with time, economic and social development, so it needs to be regularly updated [29,30], the current CNSSCH BMI and WC reference percentiles were based on data in the year of 2005, the usage may be implausible.
Another prospective household-based study “China Health and Nutrition Survey” (CHNS), which has been conducted successively in the years of 1989, 1991, 1993, 1997, 2000, 2004, 2006, 2009 and 2011 covering nine provinces (Guangxi, Guizhou, Heilongjiang, Henan, Hubei, Hunan, Jiangsu, Liaoning and Shandong) with different geographies, economic development levels, and health indicators [31,32], has both the merits of national representativeness and longitudinal follow-up quality which allows better reflection of growth pattern [31]. To the best of our knowledge, no percentile curves for BMI and WC have been established based on the data from CHNS for school-aged children and adolescents (7–18 years old) in China. In addition, although the CNSSCH BMI and WC percentiles have made inter-national comparisons with the percentiles proposed by WHO and the US Center for Disease Control and Prevention, it is still imperative to address the previous study limitations and describe percentiles based on a new national dataset and then conduct an intra-national comparison.
In this study, we aim to construct the percentile reference values for BMI and WC based on CHNS data, and then to calculate the prevalence of overall and abdominal obesity by using CHNS and CNSSCH cut-offs and make an intra-national comparison.
2. Materials and Methods
2.1. Study Sample
Detailed information on the CHNS study design has been published elsewhere [31]. The study procedures were approved by the Institutional Review Boards of the University of North Carolina, Chapel Hill and the Chinese Centre for Disease Control [33]. This study is a secondary data analysis using public and de-identified dataset obtained from the most recent four CHNS (2004, 2006, 2009 and 2011) to construct the percentile values, no ethics approval was needed [34]. A total of 3262 school-aged participants were included in the analysis, among them, 100 (3.07%) participants had the complete four follow-ups from 2004 to 2011, 314 (9.63%) were followed for three times, 872 (26.73%) were followed for two times, and 1976 (60.58%) were only investigated for once, not all the participants were enrolled in the first survey in 2004, new participants were gradually added in the following surveys, the average timed measurement was 1.55 for one participant. Large sample size is essential for constructing percentile values at each age group [35], so we included all the anthropometric records in these four CHNS and adopted the mixed cross-sectional/longitudinal sample. Finally, a total of 5062 anthropometric records (2679 boys and 2383 girls) were included and assessed for age, gender, weight, height, and WC.
2.2. Anthropometry
Standard procedures were followed to conduct anthropometric measurements by well-trained examiners. Weight was measured to the nearest 0.1 kg in light clothing by using the calibrated beam scale. Height was measured to the nearest 0.1 cm without shoes by using a portable stadiometer, and WC was measured at a midpoint between the lowest rib and the iliac crest in a horizontal plane by using non-elastic tape [33,36]. All data collection staff were trained in an interobserver reliability testing before surveys [37]. BMI was calculated as weight (kg) divided by height squared (m2).
2.3. Statistical Analysis
General characteristics of the children and adolescents were reported as mean ± SD or as counts and percentages. Gender-specific percentile values were calculated and smoothed by the Lambda-Mu-Sigma (LMS) method with the LMS Chart Maker Pro version 2.3 software (The Institute of Child Health, London, UK) [38], which summarizes a changing percentile at every age point based on Box–Cox power transformation by three smoothed curves: L (lambda, skewness), M (mu, median) and S (sigma, coefficient of variation). We presented the following percentile curves for BMI and WC: 3rd, 5th, 10th, 15th, 25th, 50th, 75th, 85th, 90th, 95th and 97th. The 5th, 50th and 95th percentiles of BMI, and the 10th, 50th and 90th percentiles of WC were plotted to compare between boys and girls and with the corresponding values in the CNSSCH references. Overall obesity was defined as having age- and gender-specific BMI percentile ≥95th and abdominal obesity was defined as having age- and gender-specific WC percentile ≥90th. The prevalence of obesity was determined for the CHNS study subjects by adopting the cut-offs of the CHNS and CNSSCH classification systems, respectively, and McNemar test was used to compare the differences in prevalence. The agreement between these prevalence was tested by the Cohen’s kappa coefficient (κ). The agreement of κ < 0.00 indicates “poor”, 0.00 ≤ κ ≤ 0.02 “slight”, 0.21 ≤ κ ≤ 0.40 “fair”, 0.41 ≤ κ ≤ 0.60 “moderate”, 0.61 ≤ κ ≤ 0.80 “substantial” and 0.81 ≤ κ ≤ 1.00 “almost perfect” agreement [39,40,41]. All statistical analyses were conducted in IBM SPSS Statistics 19. Statistical significance was considered at p < 0.05 and all tests were two-sided.
3. Results
The descriptive characteristics of the anthropometric records are shown in Table 1. Among all the 5062 records for school-aged children and adolescents, 2679 (52.9%) were boys and 2383 (47.1%) were girls. The average BMI were 18.2 ± 3.33 kg/m2 in boys and 17.9 ± 3.24 kg/m2 in girls, the average WC were 64.9 ± 10.89 cm in boys and 62.2 ± 9.42 cm in girls. Figure 1 and Figure 2 show the full set of smoothed percentile curves of BMI and WC respectively for Chinese children and adolescents aged from 7 to 18 years according to gender. The corresponding 3rd, 5th, 10th, 15th, 25th, 50th, 75th, 85th, 90th, 95th and 97th percentile values for BMI and WC are presented in Table 2 and Table 3.

Table 1.
Characteristics of the anthropometric records (n = 5062, mean (SD)).
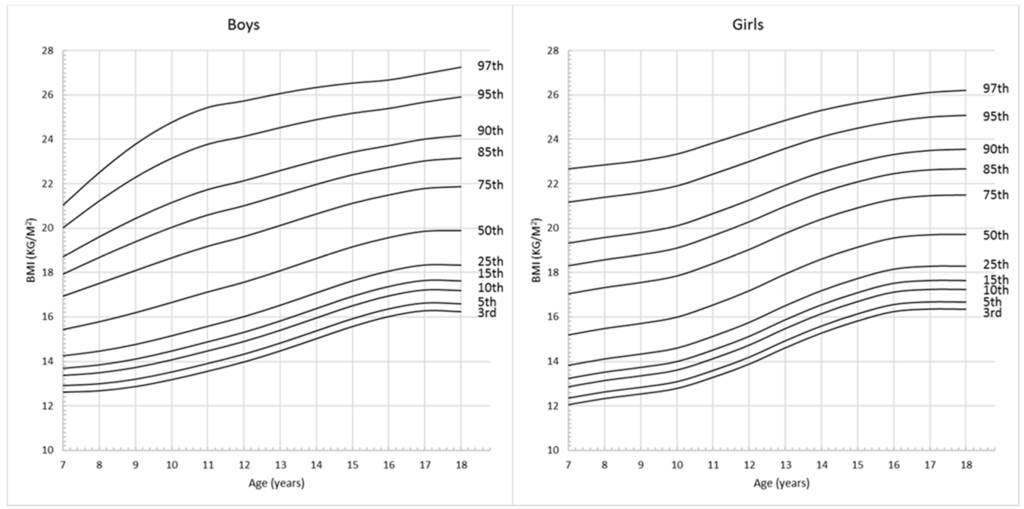
Figure 1.
Gender- and age- specific BMI percentile curves for Chinese children and adolescents aged 7–18 years.
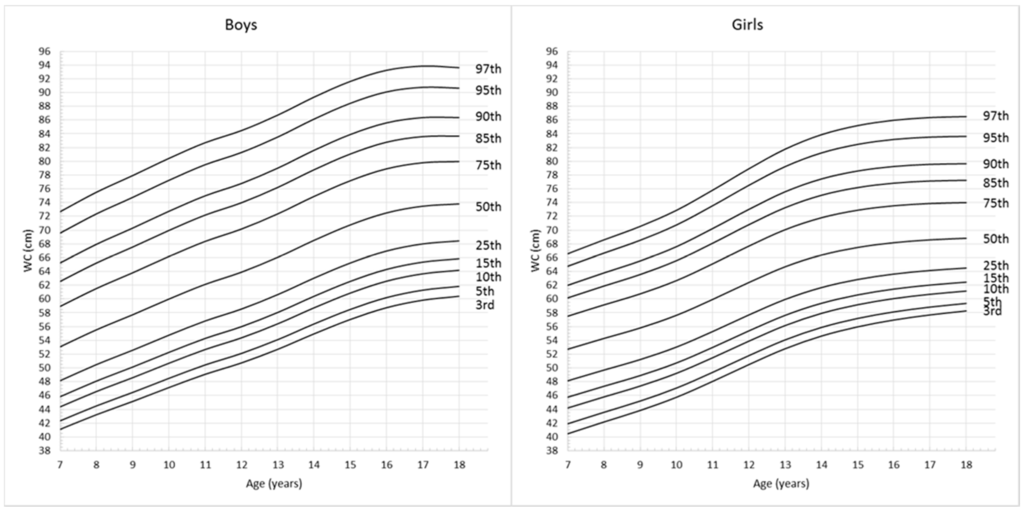
Figure 2.
Gender- and age- specific WC percentile curves for Chinese children and adolescents aged 7–18 years.

Table 2.
Gender- and Age- specific BMI percentile values for Chinese children and adolescents aged 7–18 years (n = 5062).

Table 3.
Gender- and Age- specific WC percentile values for Chinese children and adolescents aged 7–18 years (n = 5062).
Figure 3 shows the comparison of BMI and WC percentiles between boys and girls respectively. For BMI curves, before the age of 8, the upper 95th percentile values were higher for girls than boys. Between the ages of 8 and 12.5 years, 5th, 50th and 95th percentiles for boys remained above those for girls. After the age of 12.5 years, the lower 5th percentile values for girls were higher than those for boys. However, from 17 years, the 5th and 50th BMI percentile values were similar for both boys and girls. WC for boys and girls increased with age, and 10th, 50th and 90th percentile values for boys were higher than those for girls. The curves started to be flat from 17 years for boys and 15 years for girls, and the overall absolute increase in WC was greater among boys than girls.
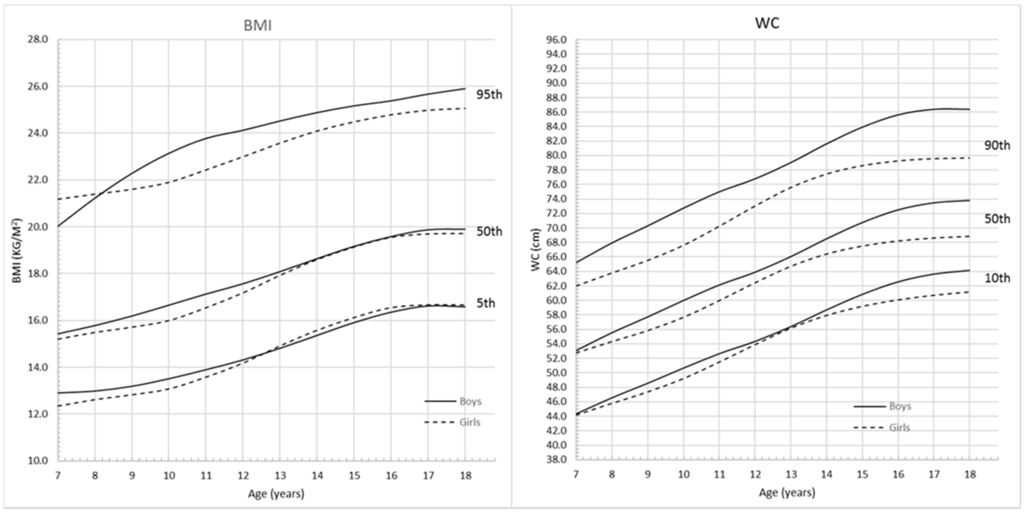
Figure 3.
Comparison of the BMI and WC percentile curves for Chinese boys and girls aged 7–18 years.
Figure 4 and Figure 5 show the comparison of the 5th, 50th and 95th percentile curves based on CHNS and CNSSCH data. For BMI (Figure 4), the CHNS and CNSSCH percentiles showed a similar shift in distribution; however, among boys, the CHNS-based percentiles started to flatten from 17 years while CNSSCH-based curves continued with increasing trend after 17 years.
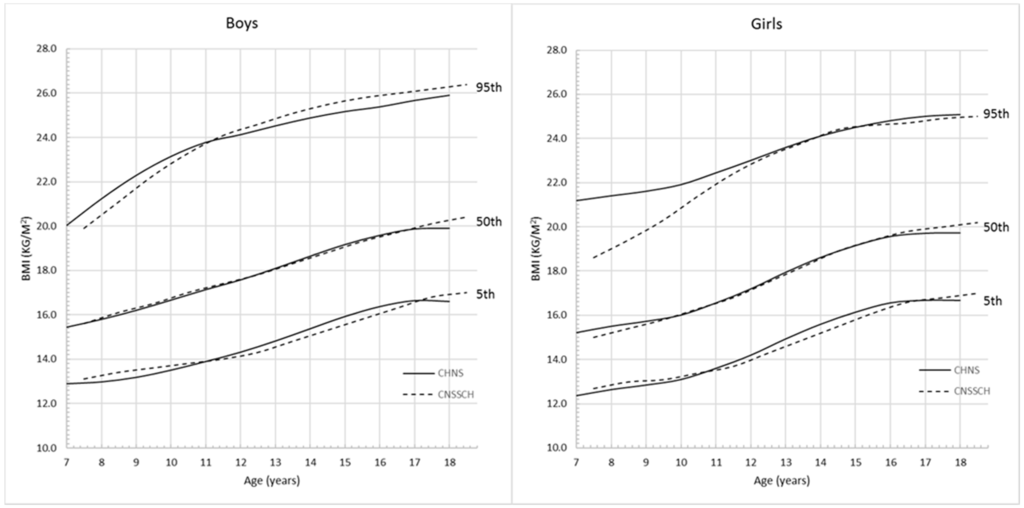
Figure 4.
Comparison of the CHNS and CNSSCH BMI percentile curves for Chinese boys and girls aged 7–18 years.
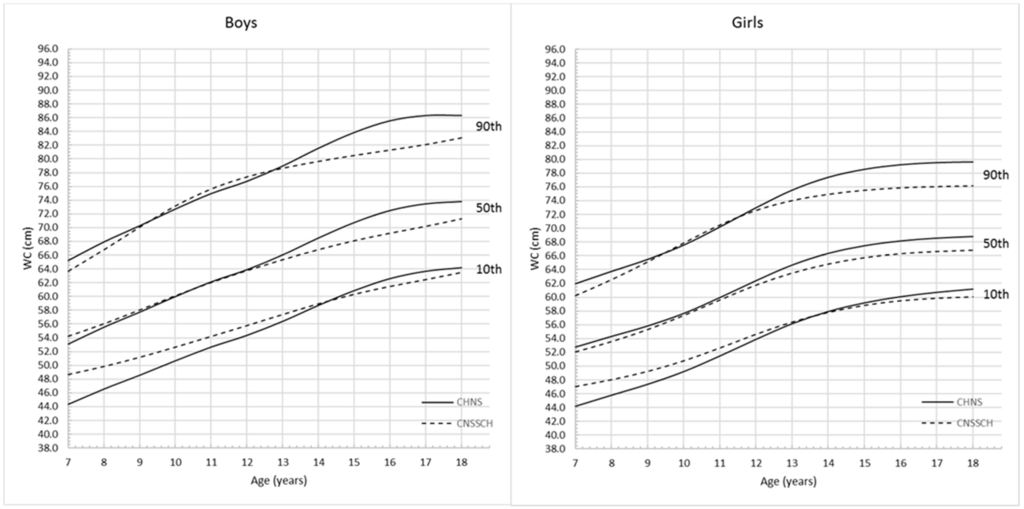
Figure 5.
Comparison of the CHNS and CNSSCH WC percentile curves for Chinese boys and girls aged 7–18 years.
Among girls, the CHNS-based upper 5th percentile values were higher than those derived from CNSSCH data, and this trend was more apparent before the age of 12 years. For WC (Figure 5), the increasing patterns of the CHNS and CNSSCH percentiles were slightly different. Among boys, the CHNS percentiles showed a rapid growth pattern before 17 years and then started to flatten while the CNSSCH-based curves showed a continuous increasing trend across ages. Among girls, the difference of WC changing patterns was not very obvious, both the CHNS- and CNSSCH-based percentile curves started to flatten from the age of 15 years, and values for CNSSCH were lower at all 10th, 50th and 90th percentiles.
The prevalence values of overall obesity calculated by the CHNS and CNSSCH cut-offs are shown in Table 4. The overall obesity prevalence was 5.7% for males aged 7–18 years according to the CHNS reference, which was slightly lower than that calculated based on the CNSSCH reference (5.8%). There was no significant difference (p > 0.05) between the prevalence, and the coefficient of agreement κ was 0.93, which represented an almost perfect agreement level. Among girls aged 7–18 years, the overall obesity prevalence was 5.0% according to the CHNS reference, which was significantly lower (p < 0.001) than that according to the CNSSCH reference (7.7%). The coefficient of agreement κ was only 0.76, which represented a substantial agreement level.

Table 4.
Prevalence of overall obesity among Chinese boys and girls aged 7–18 years and the comparison based on the CHNS and CNSSCH cut-offs.
The prevalence of abdominal obesity calculated by the CHNS and CNSSCH cut-offs were shown in Table 5, the abdominal obesity prevalence was 9.9% for male children and adolescents aged 7–18 years according to the CHNS reference, which was significantly lower (p < 0.001) than that according to the CNSSCH reference (11.8%). The coefficient of agreement κ was 0.88, which represented an almost perfect agreement.

Table 5.
Prevalence of abdominal obesity among Chinese boys and girls aged 7–18 years and the comparison based on the CHNS and CNSSCH cut-offs.
Among girls aged 7–18 years, the overall obesity prevalence was 10.2% according to the CHNS reference, which was also significantly lower (p < 0.001) compared to that based on the CNSSCH reference (12.5%), although the agreement was also almost perfect (κ = 0.88).
4. Discussion
In this study, we constructed the BMI and WC reference values for Chinese children and adolescents aged 7–18 years based on a large national representative study. To the best of our knowledge, this is the most up-to date national BMI and WC reference for school-aged children and adolescents in China. The proposed BMI and WC reference values can be adopted as useful references for monitoring both overall and abdominal obesity among Chinese children and adolescents.
The current widely adopted BMI and WC reference values for identifying obesity among Chinese school-aged children and adolescents were based on the CNSSCH [24,27]. Its large sample size can guarantee the study preciseness in generating reference values, but the cross-sectional study design may limit its use to reflect how BMI and WC change with age [24]. In this study, the notably difference of BMI percentile curves was in CHNS reference curves, the BMI started to be flat before 18 years but the CNSSCH curve still showed increasing trend at 18 years, which was also observed among girls. In addition, the CHNS WC growth pattern also started to reach plateau before adulthood both among boys and girls, while the CNSSCH WC curve showed the potential to keep the increasing trend after 18 years among boys. This difference may be explained by the data property of these two studies, the mixed cross-sectional/longitudinal may have a better performance in reflecting the real growth pattern.
BMI and WC are widely used to define obesity at population level [13,21]. Generally, both the overall and abdominal obesity prevalence were overestimated by the CNSSCH cut-offs, this may because that the CNSSCH reference was only based on anthropometric data of children and adolescents aged 7–18 years at the year of 2005, while the CHNS percentile curves were established by using more up-to-date data from 2004 to 2011. These overall obesity prevalence estimates for boys were in good agreement with the CNSSCH study, however, the difference of overall obesity among girls were larger, which needs future validation. The abdominal obesity prevalence identified by these two reference systems were in high agreement both among boys and girls but still significantly different. In addition, the comparison between the prevalence of obesity based on CHNS and CNSSCH revealed that CNSSCH might overestimate the prevalence of obesity, which should be of caution in the future application. Both CHNS and CNSSCH reference systems have merits, the former was derived from mixed cross-sectional/longitudinal data, but the latter had a larger sample size. Since the absence of national BMI and WC percentile curves calculated by large longitudinal studies in Chinese or even Asian children and adolescents, it’s hard to conclude the best performing system in identifying obesity prevalence among school-aged children and adolescents, the difference between these two systems also reveals the urgent needs to build new reference values of BMI and WC by large national cohort study.
However, the CHNS reference derived in this study may still be imperfect because it’s not a pure longitudinal study, and the sample size at the age of 18 years was not enough (less than 100), this might also influence the accuracy of our reference estimation. Despite the limitations, this study has several strengths: first of all, this study is a national representative survey, the generated CHNS percentile curves can be used at the national level; secondly, the CHNS percentiles curves were based on both cross-sectional and longitudinal data which will better reflect the growth pattern during childhood.
5. Conclusions
To conclude, our study has provided new national BMI and WC percentile curves and reference values for Chinese children and adolescents aged 7–18 years, since our findings were based on a mixed cross-sectional/longitudinal database, the proposed percentiles should be considered as reference but not as the real growth pattern standard in future practice.
Acknowledgments
This study was supported by the National Natural Science Foundation of China No. 21577119. We are grateful to the National Institute of Nutrition and Food Safety, China Center for Disease Control and Prevention; the Carolina Population Center, University of North Carolina at Chapel Hill; the National Institutes of Health (NIH; R01-HD30880, DK056350, and R01-HD38700); and the Fogarty International Center, NIH, for financial support for the CHNS data collection and analysis files since 1989. We thank those parties, the China-Japan Friendship Hospital, and the Ministry of Health for support for CHNS 2009 survey.
Author Contributions
All authors participated in the design of the study, Peige Song and Xue Li collected and cleaned the data, Peige Song and Danijela Gasevic interpreted the results, Peige Song and Xue Li drafted the manuscript and all authors revised and approved the final manuscript.
Conflicts of Interest
The authors declare no conflict of interest.
Abbreviations
The following abbreviations are used in this manuscript:
| BMI | Body Mass Index |
| WC | Waist Circumference |
| CHNS | China Health and Nutrition Survey |
| LMS | Lambda-Mu-Sigma |
| CNSSCH | Chinese National Survey on Students’ Constitution and Health |
References
- Maggi, S.; Busetto, L.; Noale, M.; Limongi, F.; Crepaldi, G. Obesity: Definition and epidemiology. In Multidisciplinary Approach to Obesity; Springer: Heidelberg, Germany, 2015; pp. 31–39. [Google Scholar]
- Juni, M.H. Obesity: A public health threats in developing countries. Int. J. Public Health Clin. Sci. 2015, 2, 2. [Google Scholar]
- Commission on Ending Childhood Obesity. Report of the Commission on Ending Childhood Obesity; World Health Organization: Geneva, Switzerland, 2016. [Google Scholar]
- World Health Organization. Population-Based Approaches to Childhood Obesity Prevention; World Health Organization: Geneva, Switzerland, 2012. [Google Scholar]
- Sacks, G.; Shill, J.; Snowdon, W.; Swinburn, B.; Armstrong, T.; Irwin, R.; Randby, S.; Xuereb, G. Prioritizing Areas for Action in the Field of Population-Based Prevention of Childhood Obesity; World Health Organization: Geneva, Switzerland, 2012. [Google Scholar]
- Raj, M.; Kumar, R.K. Obesity in children & adolescents. Indian J. Med. Res. 2010, 132, 598. [Google Scholar] [PubMed]
- Lakshman, R.; Elks, C.E.; Ong, K.K. Childhood obesity. Circulation 2012, 126, 1770–1779. [Google Scholar] [CrossRef] [PubMed]
- Benson, T.; Shekar, M. Trends and issues in child undernutrition. In Disease and Mortality in Sub-Saharan Africa, 2nd ed.; Jamison, D.T., Feachem, R.G., Makgoba, M.W., Bos, E.R., Baingana, F.K., Hofman, K.J., Rogo, K.O., Eds.; World Bank: Washington, DC, USA, 2006. [Google Scholar]
- Ellulu, M.; Abed, Y.; Rahmat, A.; Ranneh, Y.; Ali, F. Epidemiology of obesity in developing countries: Challenges and prevention. Glob. Epidemic Obes. 2014, 2, 2. [Google Scholar] [CrossRef]
- Prentice, A.M. The emerging epidemic of obesity in developing countries. Int. J. Epidemiol. 2006, 35, 93–99. [Google Scholar] [CrossRef] [PubMed]
- Onis, M.D.; Onyango, A.W.; Borghi, E.; Siyam, A.; Nishida, C.; Siekmann, J. Development of a WHO growth reference for school-aged children and adolescents. Bull. World Health Organ. 2007, 85, 660–667. [Google Scholar] [CrossRef] [PubMed]
- Roberts, K.C.; Shields, M.; de Groh, M.; Aziz, A.; Gilbert, J.-A. Overweight and obesity in children and adolescents: Results from the 2009 to 2011 Canadian Health Measures Survey. Health Rep. 2012, 23, 37–41. [Google Scholar] [PubMed]
- Harrington, D.M.; Staiano, A.E.; Broyles, S.T.; Gupta, A.K.; Katzmarzyk, P.T. BMI percentiles for the identification of abdominal obesity and metabolic risk in children and adolescents: Evidence in support of the CDC 95th percentile. Eur. J. Clin. Nutr. 2013, 67, 218–222. [Google Scholar] [CrossRef] [PubMed]
- Alberti, K.G.M.; Zimmet, P.; Shaw, J.; IDF Epidemiology Task Force Consensus Group. The metabolic syndrome—A new worldwide definition. Lancet 2005, 366, 1059–1062. [Google Scholar] [CrossRef]
- McCarthy, H.D.; Ellis, S.M.; Cole, T.J. Central overweight and obesity in British youth aged 11–16 years: Cross sectional surveys of waist circumference. BMJ 2003, 326, 624. [Google Scholar] [CrossRef] [PubMed]
- Li, C.; Ford, E.S.; Mokdad, A.H.; Cook, S. Recent trends in waist circumference and waist-height ratio among U.S. children and adolescents. Pediatrics 2006, 118, e1390–e1398. [Google Scholar] [CrossRef] [PubMed]
- Fernández, J.R.; Redden, D.T.; Pietrobelli, A.; Allison, D.B. Waist circumference percentiles in nationally representative samples of African-American, European-American, and Mexican-American children and adolescents. J. Pediatr. 2004, 145, 439–444. [Google Scholar] [CrossRef] [PubMed]
- Bacopoulou, F.; Efthymiou, V.; Landis, G.; Rentoumis, A.; Chrousos, G.P. Waist circumference, waist-to-hip ratio and waist-to-height ratio reference percentiles for abdominal obesity among Greek adolescents. BMC Pediatr. 2015, 15, 1. [Google Scholar] [CrossRef] [PubMed]
- Hu, F. Obesity Epidemiology; Oxford University Press: New York, NY, USA, 2008. [Google Scholar]
- ÇİÇEK, B.; Öztürk, A.; Mazicioğlu, M.M.; Inanc, N.; Kurtoğlu, S. A novel cut-off for abdominal obesity derived from various anthropometric indices to predict body composition: Arm fat area. Turk. J. Med. Sci. 2010, 40, 515–523. [Google Scholar]
- Mushtaq, M.U.; Gull, S.; Abdullah, H.M.; Shahid, U.; Shad, M.A.; Akram, J. Waist circumference, waist-hip ratio and waist-height ratio percentiles and central obesity among Pakistani children aged five to twelve years. BMC Pediatr. 2011, 11, 1. [Google Scholar] [CrossRef] [PubMed]
- Sung, R.Y.; So, H.-K.; Choi, K.-C.; Nelson, E.A.; Li, A.M.; Yin, J.A.; Kwok, C.W.; Ng, P.-C.; Fok, T.-F. Waist circumference and waist-to-height ratio of Hong Kong Chinese children. BMC Public Health 2008, 8, 1. [Google Scholar] [CrossRef] [PubMed]
- Li, H.; Ji, C.-Y.; Zong, X.-N.; Zhang, Y.-Q. Body mass index growth curves for Chinese children and adolescents aged 0 to 18 years. Chin. J. Pediatr. 2009, 47, 493–498. [Google Scholar]
- Ma, J.; Wang, Z.; Song, Y.; Hu, P.; Zhang, B. BMI percentile curves for Chinese children aged 7–18 years, in comparison with the WHO and the U.S. Centers for Disease Control and Prevention references. Public Health Nutr. 2010, 13, 1990–1996. [Google Scholar] [CrossRef] [PubMed]
- Sung, R.; Yu, C.; Choi, K.; McManus, A.; Li, A.; Xu, S.; Chan, D.; Lo, A.; Chan, J.; Fok, T. Waist circumference and body mass index in Chinese children: Cutoff values for predicting cardiovascular risk factors. Int. J. Obes. 2007, 31, 550–558. [Google Scholar] [CrossRef] [PubMed]
- Liu, A.; Hills, A.P.; Hu, X.; Li, Y.; Du, L.; Xu, Y.; Byrne, N.M.; Ma, G. Waist circumference cut-off values for the prediction of cardiovascular risk factors clustering in Chinese school-aged children: A cross-sectional study. BMC Public Health 2010, 10, 1. [Google Scholar] [CrossRef] [PubMed]
- Cheng-Ye, J.; Rita, Y.; Guan-Sheng, M.; Jun, M.; Zhong-Hu, H.; Tian-Jiao, C. Waist circumference distribution of Chinese school-age children and adolescents. Biomed. Environ. Sci. 2010, 23, 12–20. [Google Scholar]
- Ji, C.Y.; Cheng, T.O. Prevalence and geographic distribution of childhood obesity in China in 2005. Int. J. Cardiol. 2008, 131, 1–8. [Google Scholar] [CrossRef] [PubMed]
- Khadilkar, V.; Yadav, S.; Agrawal, K.; Tamboli, S.; Banerjee, M.; Cherian, A.; Goyal, J.P.; Khadilkar, A.; Kumaravel, V.; Mohan, V. Revised IAP growth charts for height, weight and body mass index for 5- to 18-year-old Indian children. Indian Pediatr. 2015, 52, 47–55. [Google Scholar] [CrossRef] [PubMed]
- Khadilkar, V.; Khadilkar, A. Growth charts: A diagnostic tool. Indian J. Endocrinol. Metab. 2011, 15, 166. [Google Scholar] [CrossRef] [PubMed]
- Zhang, B.; Zhai, F.; Du, S.; Popkin, B.M. The China health and nutrition survey, 1989–2011. Obes. Rev. 2014, 15, 2–7. [Google Scholar] [CrossRef] [PubMed]
- Wang, Q. Smoking and body weight: Evidence from China health and nutrition survey. BMC Public Health 2015, 15, 1. [Google Scholar] [CrossRef] [PubMed]
- Jaacks, L.M.; Gordon-Larsen, P.; Mayer-Davis, E.J.; Adair, L.S.; Popkin, B. Age, period and cohort effects on adult body mass index and overweight from 1991 to 2009 in China: The China Health and Nutrition Survey. Int. J. Epidemiol. 2013, 42, 828–837. [Google Scholar] [CrossRef] [PubMed]
- The China Health and Nutrition Survey. Longitudinal Data Master Files. Available online: http://www.cpc.unc.edu/projects/china/data/datasets/longitudinal (accessed on 1 June 2016).
- Chen, C. Growth charts of Body Mass Index (BMI) with quantile regression. In Proceedings of the 2005 International Conference on Algorithmic Mathematics and Computer Science, Las Vegas, NV, USA, 20–23 June 2005; pp. 114–120.
- Xi, B.; He, D.; Hu, Y.; Zhou, D. Prevalence of metabolic syndrome and its influencing factors among the Chinese adults: The China Health and Nutrition Survey in 2009. Prev. Med. 2013, 57, 867–871. [Google Scholar] [CrossRef] [PubMed]
- Tudor-Locke, C.; Ainsworth, B.E.; Adair, L.; Du, S.; Popkin, B. Physical activity and inactivity in Chinese school-aged youth: The China Health and Nutrition Survey. Int. J. Obes. 2003, 27, 1093–1099. [Google Scholar] [CrossRef] [PubMed]
- Cole, T.J.; Green, P.J. Smoothing reference centile curves: The LMS method and penalized likelihood. Stat. Med. 1992, 11, 1305–1319. [Google Scholar] [CrossRef] [PubMed]
- Bertino, E.; Gilli, G.; Occhi, L.; Giuliani, F.; Di Nicola, P.; Spada, E.; Fabris, C. Postnatal growth of preterm infants: Which reference charts? Minerva Pediatr. 2010, 62, 71–74. [Google Scholar] [PubMed]
- Kêkê, L.; Samouda, H.; Jacobs, J.; di Pompeo, C.; Lemdani, M.; Hubert, H.; Zitouni, D.; Guinhouya, B. Body mass index and childhood obesity classification systems: A comparison of the French, International Obesity Task Force (IOTF) and World Health Organization (WHO) references. Rev. Epidemiol. Sante Publique 2015, 63, 173–182. [Google Scholar] [CrossRef] [PubMed]
- Zogg, S.; Dürr, S.; Miedinger, D.; Steveling, E.H.; Maier, S.; Leuppi, J.D. Differences in classification of COPD patients into risk groups AD: A cross-sectional study. BMC Res. Notes 2014, 7, 562. [Google Scholar] [CrossRef] [PubMed]
© 2016 by the authors; licensee MDPI, Basel, Switzerland. This article is an open access article distributed under the terms and conditions of the Creative Commons Attribution (CC-BY) license (http://creativecommons.org/licenses/by/4.0/).