
Excess Medical Care Costs Associated with Physical Inactivity among Korean Adults: Retrospective Cohort Study

Abstract
:1. Introduction
2. Materials and Methods
2.1. Data Source and Study Population
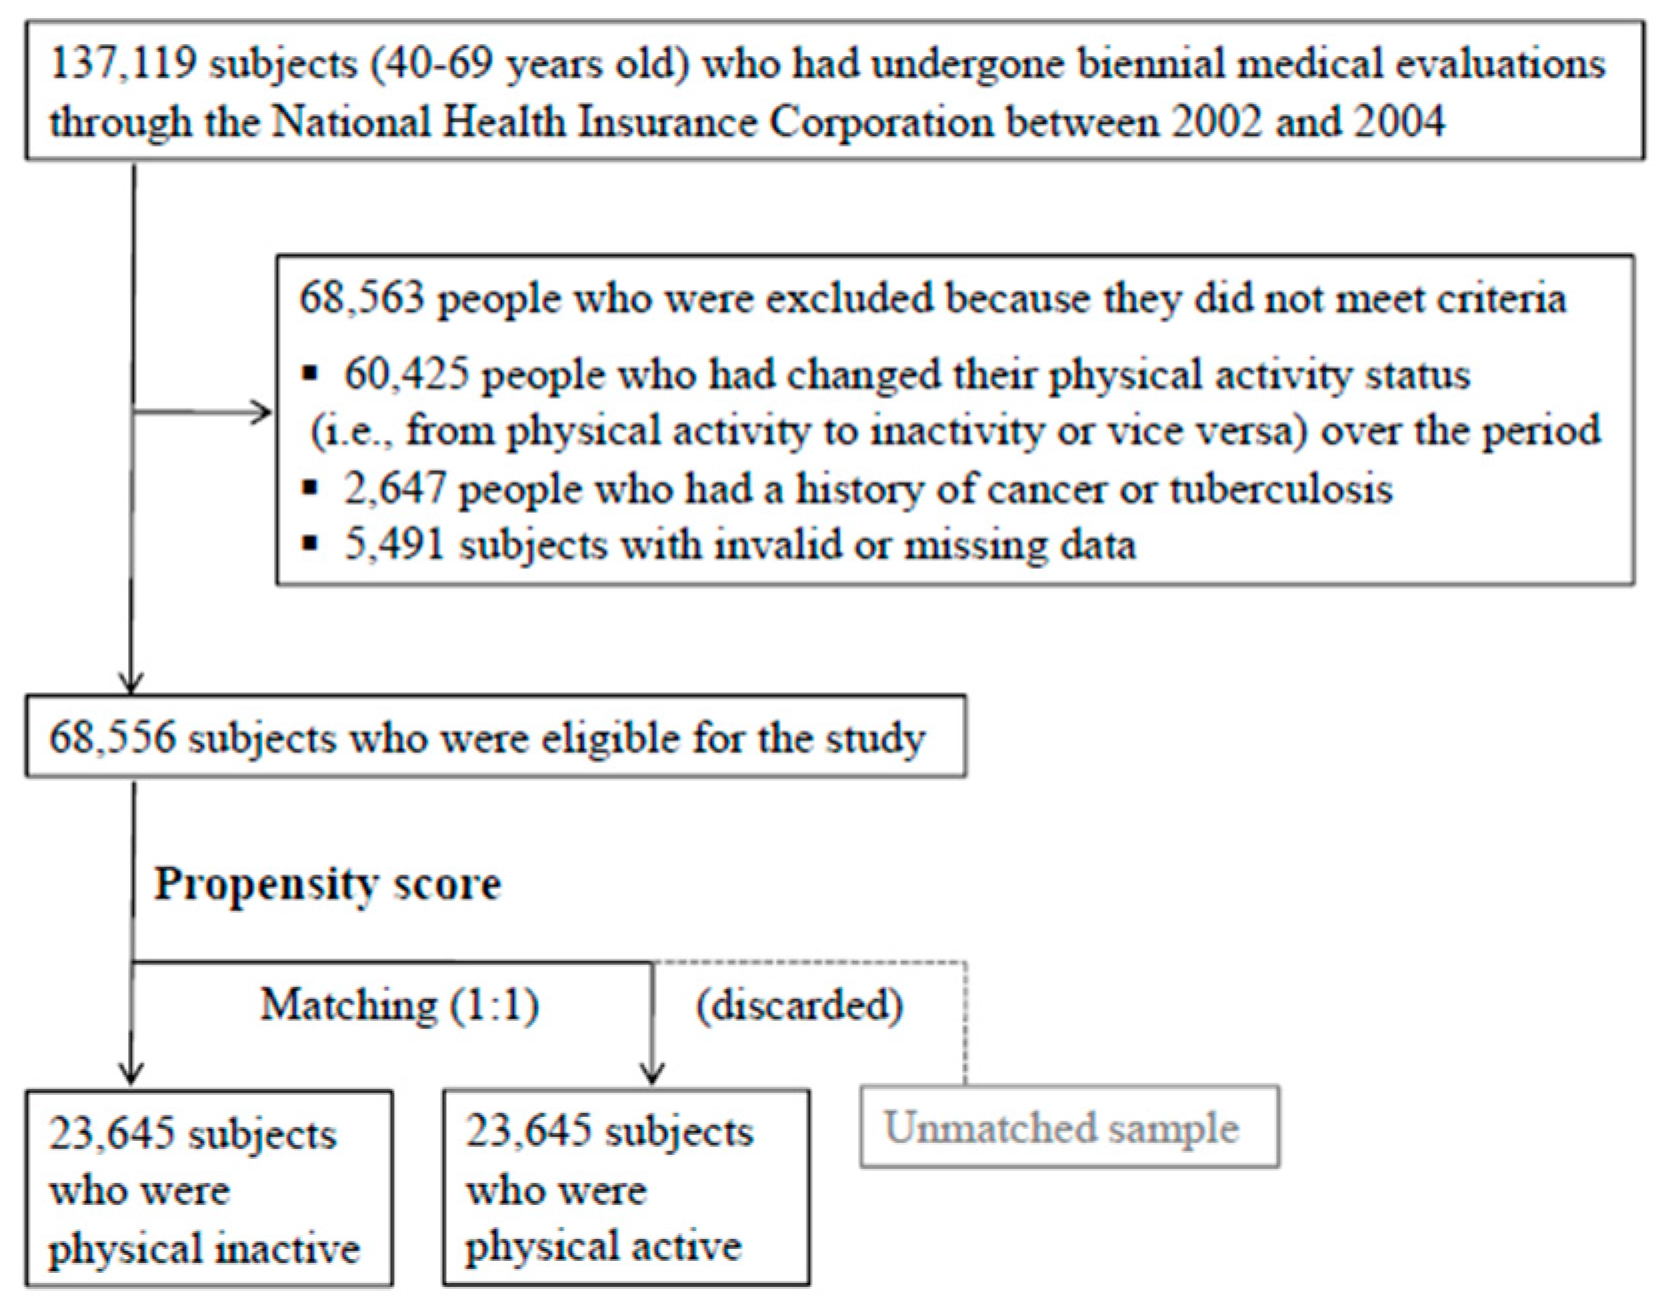
2.2. Measurements
2.3. Statistical Analysis
3. Results

| Variables | Active Group | Inactivity Group | p-Value * | ||
|---|---|---|---|---|---|
| (n = 23,645) | (n = 23,645) | ||||
| Age (year) | |||||
| 40–49 | 11,791 | (50.1) | 11,755 | (49.9) | 0.0737 |
| 50–59 | 7077 | (49.3) | 7269 | (50.7) | |
| 60–69 | 4777 | (50.8) | 4621 | (49.2) | |
| Gender | |||||
| Female | 12,517 | (49.9) | 12,559 | (50.1) | 0.6988 |
| Male | 11,128 | (50.1) | 11,086 | (49.9) | |
| Income (won) | |||||
| Q1 | 4576 | (51.0) | 4403 | (49.0) | 0.0667 |
| Q2 | 5450 | (49.1) | 5649 | (50.9) | |
| Q3 | 5415 | (50.2) | 5365 | (49.8) | |
| Q4 | 8204 | (49.9) | 8228 | (50.1) | |
| Residential area | |||||
| Rural | 11,605 | (49.7) | 11,733 | (50.3) | 0.2391 |
| Urban | 12,040 | (50.3) | 11,912 | (49.7) | |
| Cigarettesmoking | |||||
| No | 16,899 | (49.8) | 17,026 | (50.2) | 0.1946 |
| Yes | 6746 | (50.5) | 6619 | (49.5) | |
| Alcohol drinking | |||||
| No | 13,267 | (49.7) | 13,452 | (50.4) | 0.0862 |
| Yes | 10,378 | (50.5) | 10,193 | (49.6) | |
| BMI (kg/m2) | |||||
| Normal or less (BMI < 25) | 15,043 | (48.6) | 15,898 | (51.4) | <0.0001 |
| Overweight or more (BMI ≥ 25) | 8602 | (52.6) | 7747 | (47.4) | |
| Variables | Active Group | Inactivity Group | % Increase † | p-Value | ||
|---|---|---|---|---|---|---|
| Mean *(95% CI) | Mean *(95% CI) | |||||
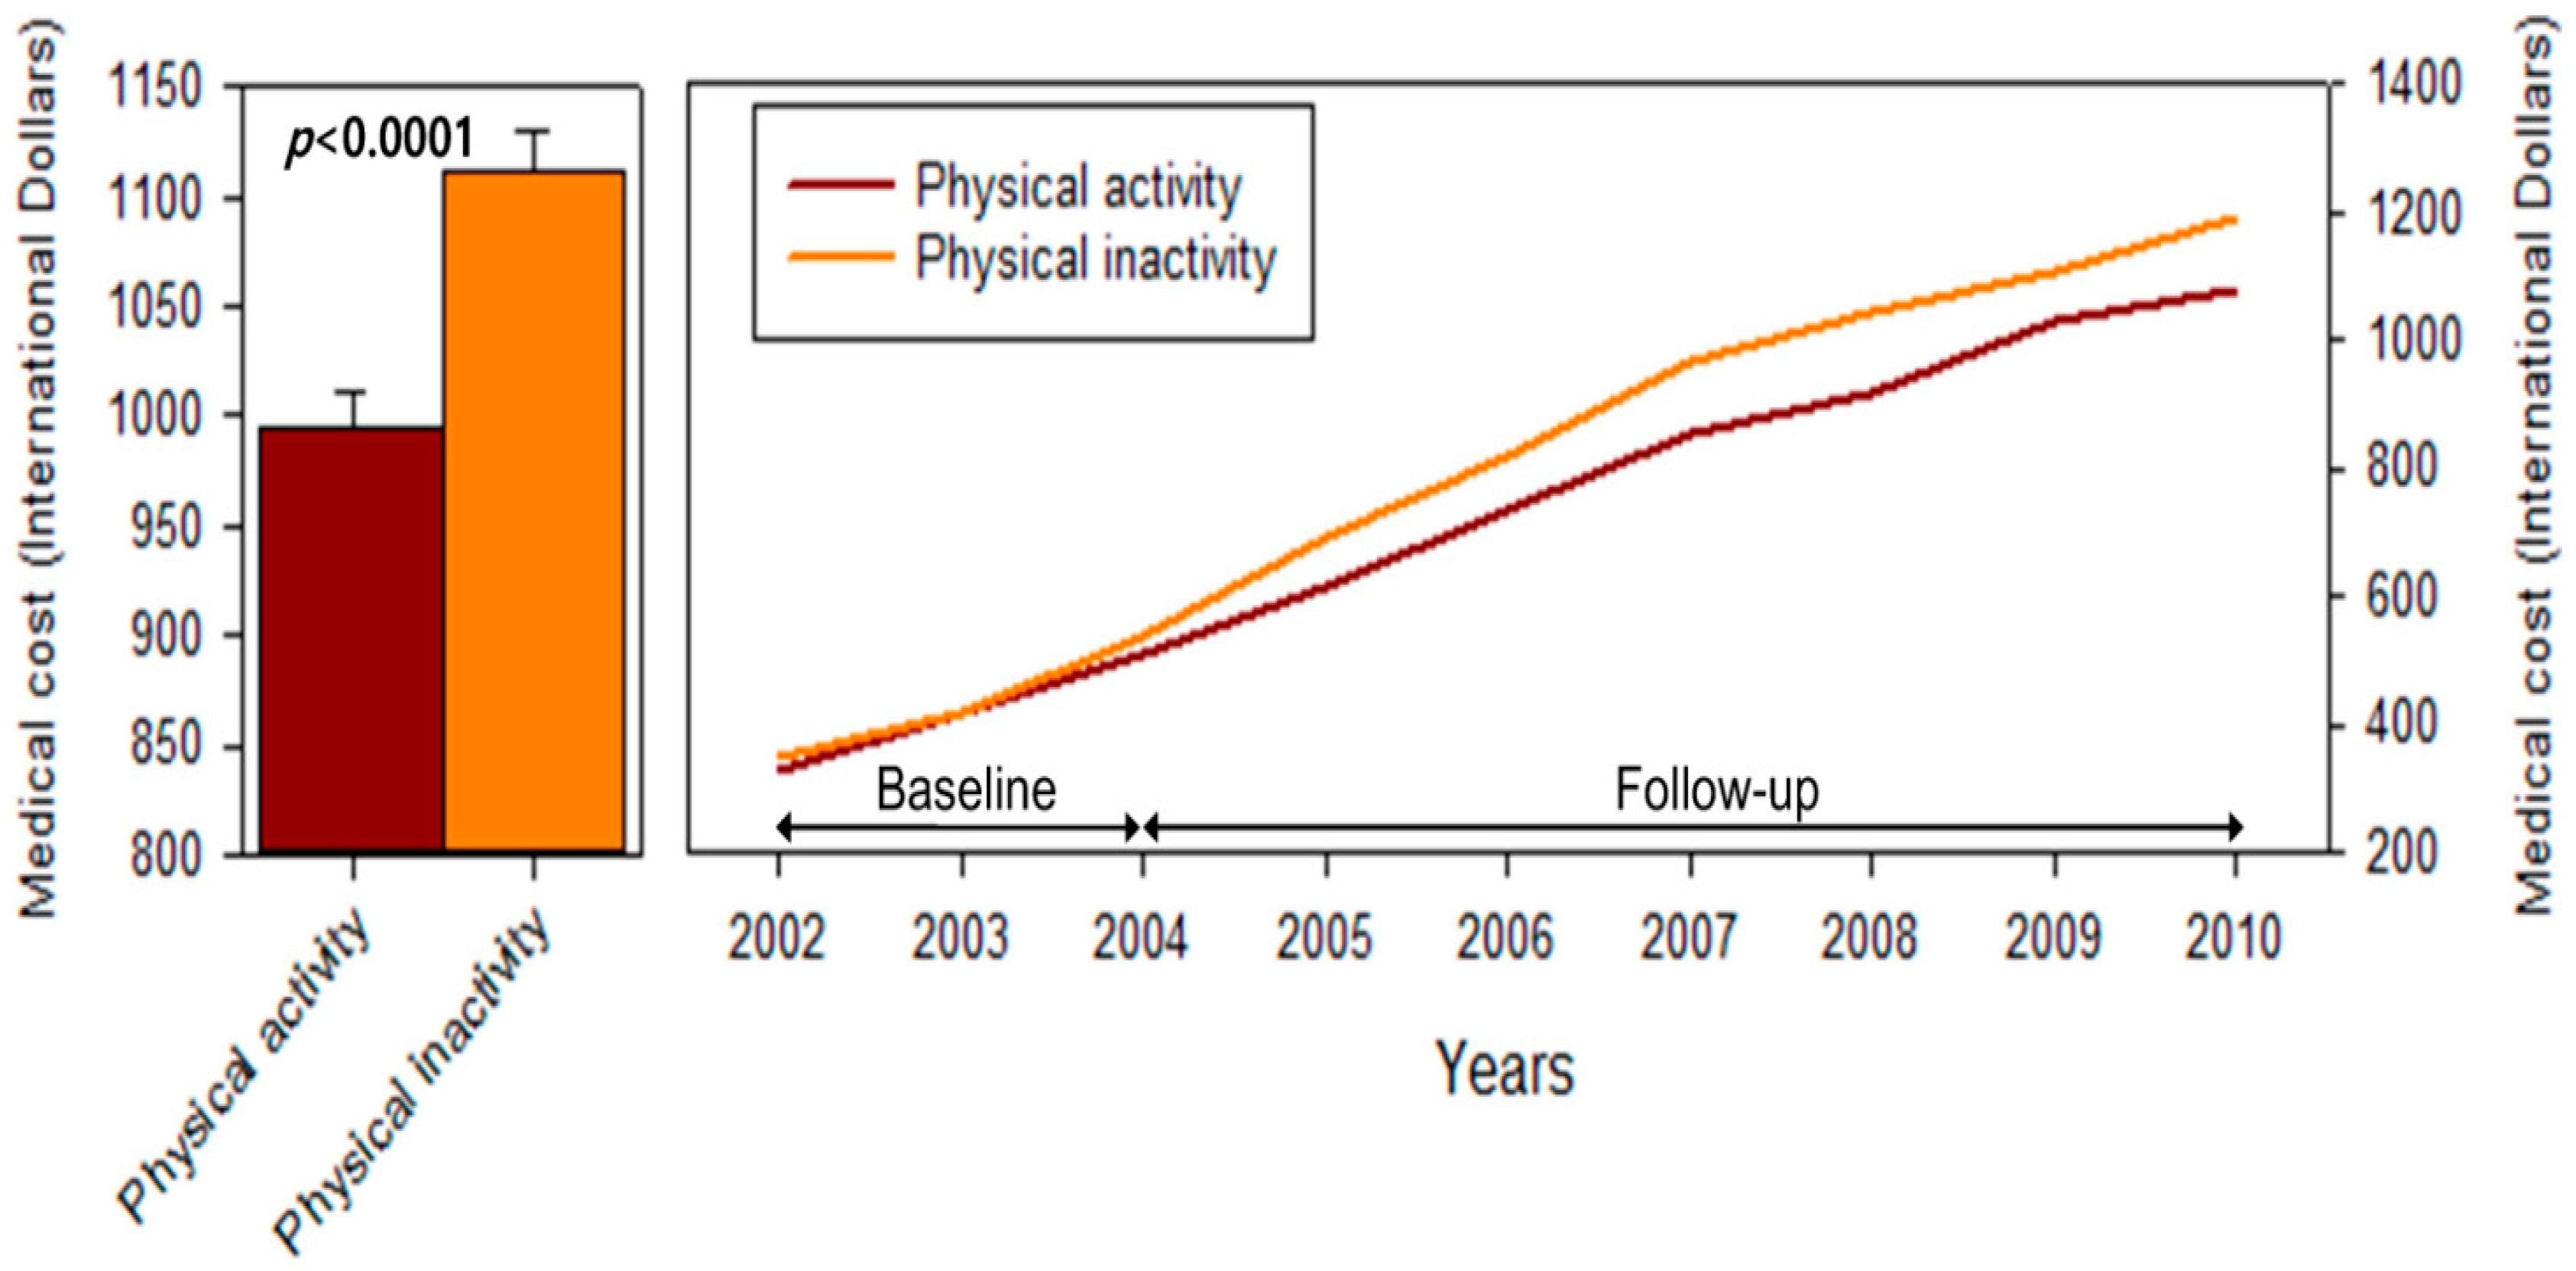
| Total medical expenditures | 994.1 | (977.0–1011.6) | 1110.5 | (1091.0–1130.3) | 11.7 | <0.0001 |
| Medical costs from specific diseases | ||||||
| Cardiovascular disease (n = 29,263) | 767.8 | (747.3–788.7) | 902.8 | (878.2–928.1) | 17.6 | <0.0001 |
| Endocrine and metabolic diseases (n = 28,204) | 744.5 | (723.9–765.5) | 932.9 | (906.7–959.9) | 25.3 | <0.0001 |
| Musculoskeletal disease (n = 40,891) | 422.8 | (414.2–431.6) | 475.6 | (465.8–485.6) | 12.5 | <0.0001 |
| Respiratory disease (n = 42,778) | 324.1 | (316.9–331.5) | 380.1 | (371.3–389.0) | 17.3 | <0.0001 |
| Digestive disease (n = 44,259) | 572.3 | (560.5–584.2) | 665.1 | (651.2–679.3) | 16.2 | <0.0001 |
| Neurologic disease (n = 22,057) | 665.4 | (641.6–690.1) | 723.5 | (697.6–750.3) | 8.7 | 0.0002 |
| Psychiatric disease (n = 20,700) | 489.9 | (472.3–508.1) | 572.5 | (551.9–594.0) | 16.9 | <0.0001 |
4. Discussion
5. Conclusions
Acknowledgments
Author Contributions
Conflicts ofInterest
References
- Warburton, D.E.; Nicol, C.W.; Bredin, S.S. Health benefits of physical activity: The evidence. CMAJ 2006, 174, 801–809. [Google Scholar] [CrossRef] [PubMed]
- Blair, S.N.; Cheng, Y.; Holder, J.S. Is physical activity or physical fitness more important in defining health benefits? Med. Sci. Sports Exerc. 2001, 33, S379–S399. [Google Scholar] [CrossRef] [PubMed]
- Lee, I.M.; Shiroma, E.J.; Lobelo, F.; Puska, P.; Blair, S.N.; Katzmarzyk, P.T. Effect of physical inactivity on major non-communicable diseases worldwide: An analysis of burden of disease and life expectancy. Lancet 2012, 380, 219–229. [Google Scholar] [CrossRef]
- World Health Organization. Global Recommendations on Physical Activity for Health; World Health Organization: Geneva, Switzerland, 2010. [Google Scholar]
- World Health Organization. Global Health Risks. Mortality and Burden of Disease Attributable Selected Major Risks, 2009. Available online: http://www.Who.Int/healthinfo/global_burden_disease/globalhealthrisks_report_full.Pdf (accessed on 15 January2015).
- Allender, S.; Foster, C.; Scarborough, P.; Rayner, M. The burden of physical activity-related ill health in the UK. J. Epidemiol. Community Health 2007, 61, 344–348. [Google Scholar] [CrossRef] [PubMed]
- Garrett, N.A.; Brasure, M.; Schmitz, K.H.; Schultz, M.M.; Huber, M.R. Physical inactivity: Direct cost to a health plan. Am. J. Prev. Med. 2004, 27, 304–309. [Google Scholar] [CrossRef] [PubMed]
- Katzmarzyk, P.T.; Janssen, I. The economic costs associated with physical inactivity and obesity in Canada: An update. Can. J. Appl. Physiol. 2004, 29, 90–115. [Google Scholar] [CrossRef] [PubMed]
- Pratt, M.; Macera, C.A.; Wang, G. Higher direct medical costs associated with physical inactivity. Physician Sportsmed. 2000, 28, 63–70. [Google Scholar]
- Wang, F.; McDonald, T.; Reffitt, B.; Edington, D.W. BMI, physical activity, and health care utilization/costs among medicare retirees. Obes. Res. 2005, 13, 1450–1457. [Google Scholar] [CrossRef] [PubMed]
- Wang, G.; Pratt, M.; Macera, C.A.; Zheng, Z.J.; Heath, G. Physical activity, cardiovascular disease, and medical expenditures in U.S. Adults. Ann. Behav. Med. 2004, 28, 88–94. [Google Scholar] [CrossRef] [PubMed]
- National Health Insurance Corporation. Available online: http://www.Nhis.Or.Kr/retrievehomemain.Xx (accessed on 15 January 2015).
- Jee, S.H.; Sull, J.W.; Park, J.; Lee, S.Y.; Ohrr, H.; Guallar, E.; Samet, J.M. Body-mass index and mortality in Korean men and women. N. Engl. J. Med. 2006, 355, 779–787. [Google Scholar] [CrossRef] [PubMed]
- Faries, D.E.; Leon, A.C.; Maria, H.J.; Obenchain, R.L. Analysis of Observational Health Care Data Using SAS®; SAS Institute Inc.: Cary, NC, USA, 2010. [Google Scholar]
- Leitzmann, M.F.; Park, Y.; Blair, A.; Ballard-Barbash, R.; Mouw, T.; Hollenbeck, A.R.; Schatzkin, A. Physical activity recommendations and decreased risk of mortality. Arch. Intern. Med. 2007, 167, 2453–2460. [Google Scholar] [CrossRef] [PubMed]
- Franco, O.H.; de Laet, C.; Peeters, A.; Jonker, J.; Mackenbach, J.; Nusselder, W. Effects of physical activity on life expectancy with cardiovascular disease. Arch. Intern. Med. 2005, 165, 2355–2360. [Google Scholar] [CrossRef] [PubMed]
- Caspersen, C.J.; Powell, K.E.; Christenson, G.M. Physical activity, exercise, and physical fitness: Definitions and distinctions for health-related research. Public Health Rep. 1985, 100, 126–131. [Google Scholar] [PubMed]
- Dunn, A.L.; Trivedi, M.H.; O’Neal, H.A. Physical activity dose-response effects on outcomes of depression and anxiety. Med. Sci. Sports Exerc. 2001, 33, S587–S597. [Google Scholar] [CrossRef] [PubMed]
- Sargeant, L.A.; Wareham, N.J.; Khaw, K.T. Family history of diabetes identifies a group at increased risk for the metabolic consequences of obesity and physical inactivity in EPIC-Norfolk: A population-based study. The European Prospective Investigation into Cancer. Int. J. Obes. Relat. Metab. Disord. 2000, 24, 1333–1339. [Google Scholar] [CrossRef] [PubMed]
- Begg, S.; Vos, T.; Barker, B.; Stevenson, C.; Stanley, L.; Lopez, A. The Burden of Disease and Injury in Australia 2003; AIHW: Canberra, Australia, 2007; Available online: http://www.aihw.gov.au/publication-detail/?id=6442467990 (accessed on 4 January 2015).
- Martin, B.W.; Beeler, I.; Szucs, T.; Smala, A.M.; Brugger, O.; Casparis, C.; Allenbach, R.; Raeber, P.A.; Marti, B. Economic benefits of the health-enhancing effects of physical activity: First estimates for Switzerland. Sportmed. Sportraumatol. 2001, 49, 131–133. [Google Scholar]
© 2016 by the authors; licensee MDPI, Basel, Switzerland. This article is an open access article distributed under the terms and conditions of the Creative Commons by Attribution (CC-BY) license (http://creativecommons.org/licenses/by/4.0/).
Share and Cite
Min, J.-Y.; Min, K.-B. Excess Medical Care Costs Associated with Physical Inactivity among Korean Adults: Retrospective Cohort Study. Int. J. Environ. Res. Public Health 2016, 13, 136. https://doi.org/10.3390/ijerph13010136
Min J-Y, Min K-B. Excess Medical Care Costs Associated with Physical Inactivity among Korean Adults: Retrospective Cohort Study. International Journal of Environmental Research and Public Health. 2016; 13(1):136. https://doi.org/10.3390/ijerph13010136
Chicago/Turabian StyleMin, Jin-Young, and Kyoung-Bok Min. 2016. "Excess Medical Care Costs Associated with Physical Inactivity among Korean Adults: Retrospective Cohort Study" International Journal of Environmental Research and Public Health 13, no. 1: 136. https://doi.org/10.3390/ijerph13010136
APA StyleMin, J.-Y., & Min, K.-B. (2016). Excess Medical Care Costs Associated with Physical Inactivity among Korean Adults: Retrospective Cohort Study. International Journal of Environmental Research and Public Health, 13(1), 136. https://doi.org/10.3390/ijerph13010136