
Brand Cigarillos: Low Price but High Particulate Matter Levels—Is Their Favorable Taxation in the European Union Justified?

Abstract
:1. Introduction
2. Experimental Section
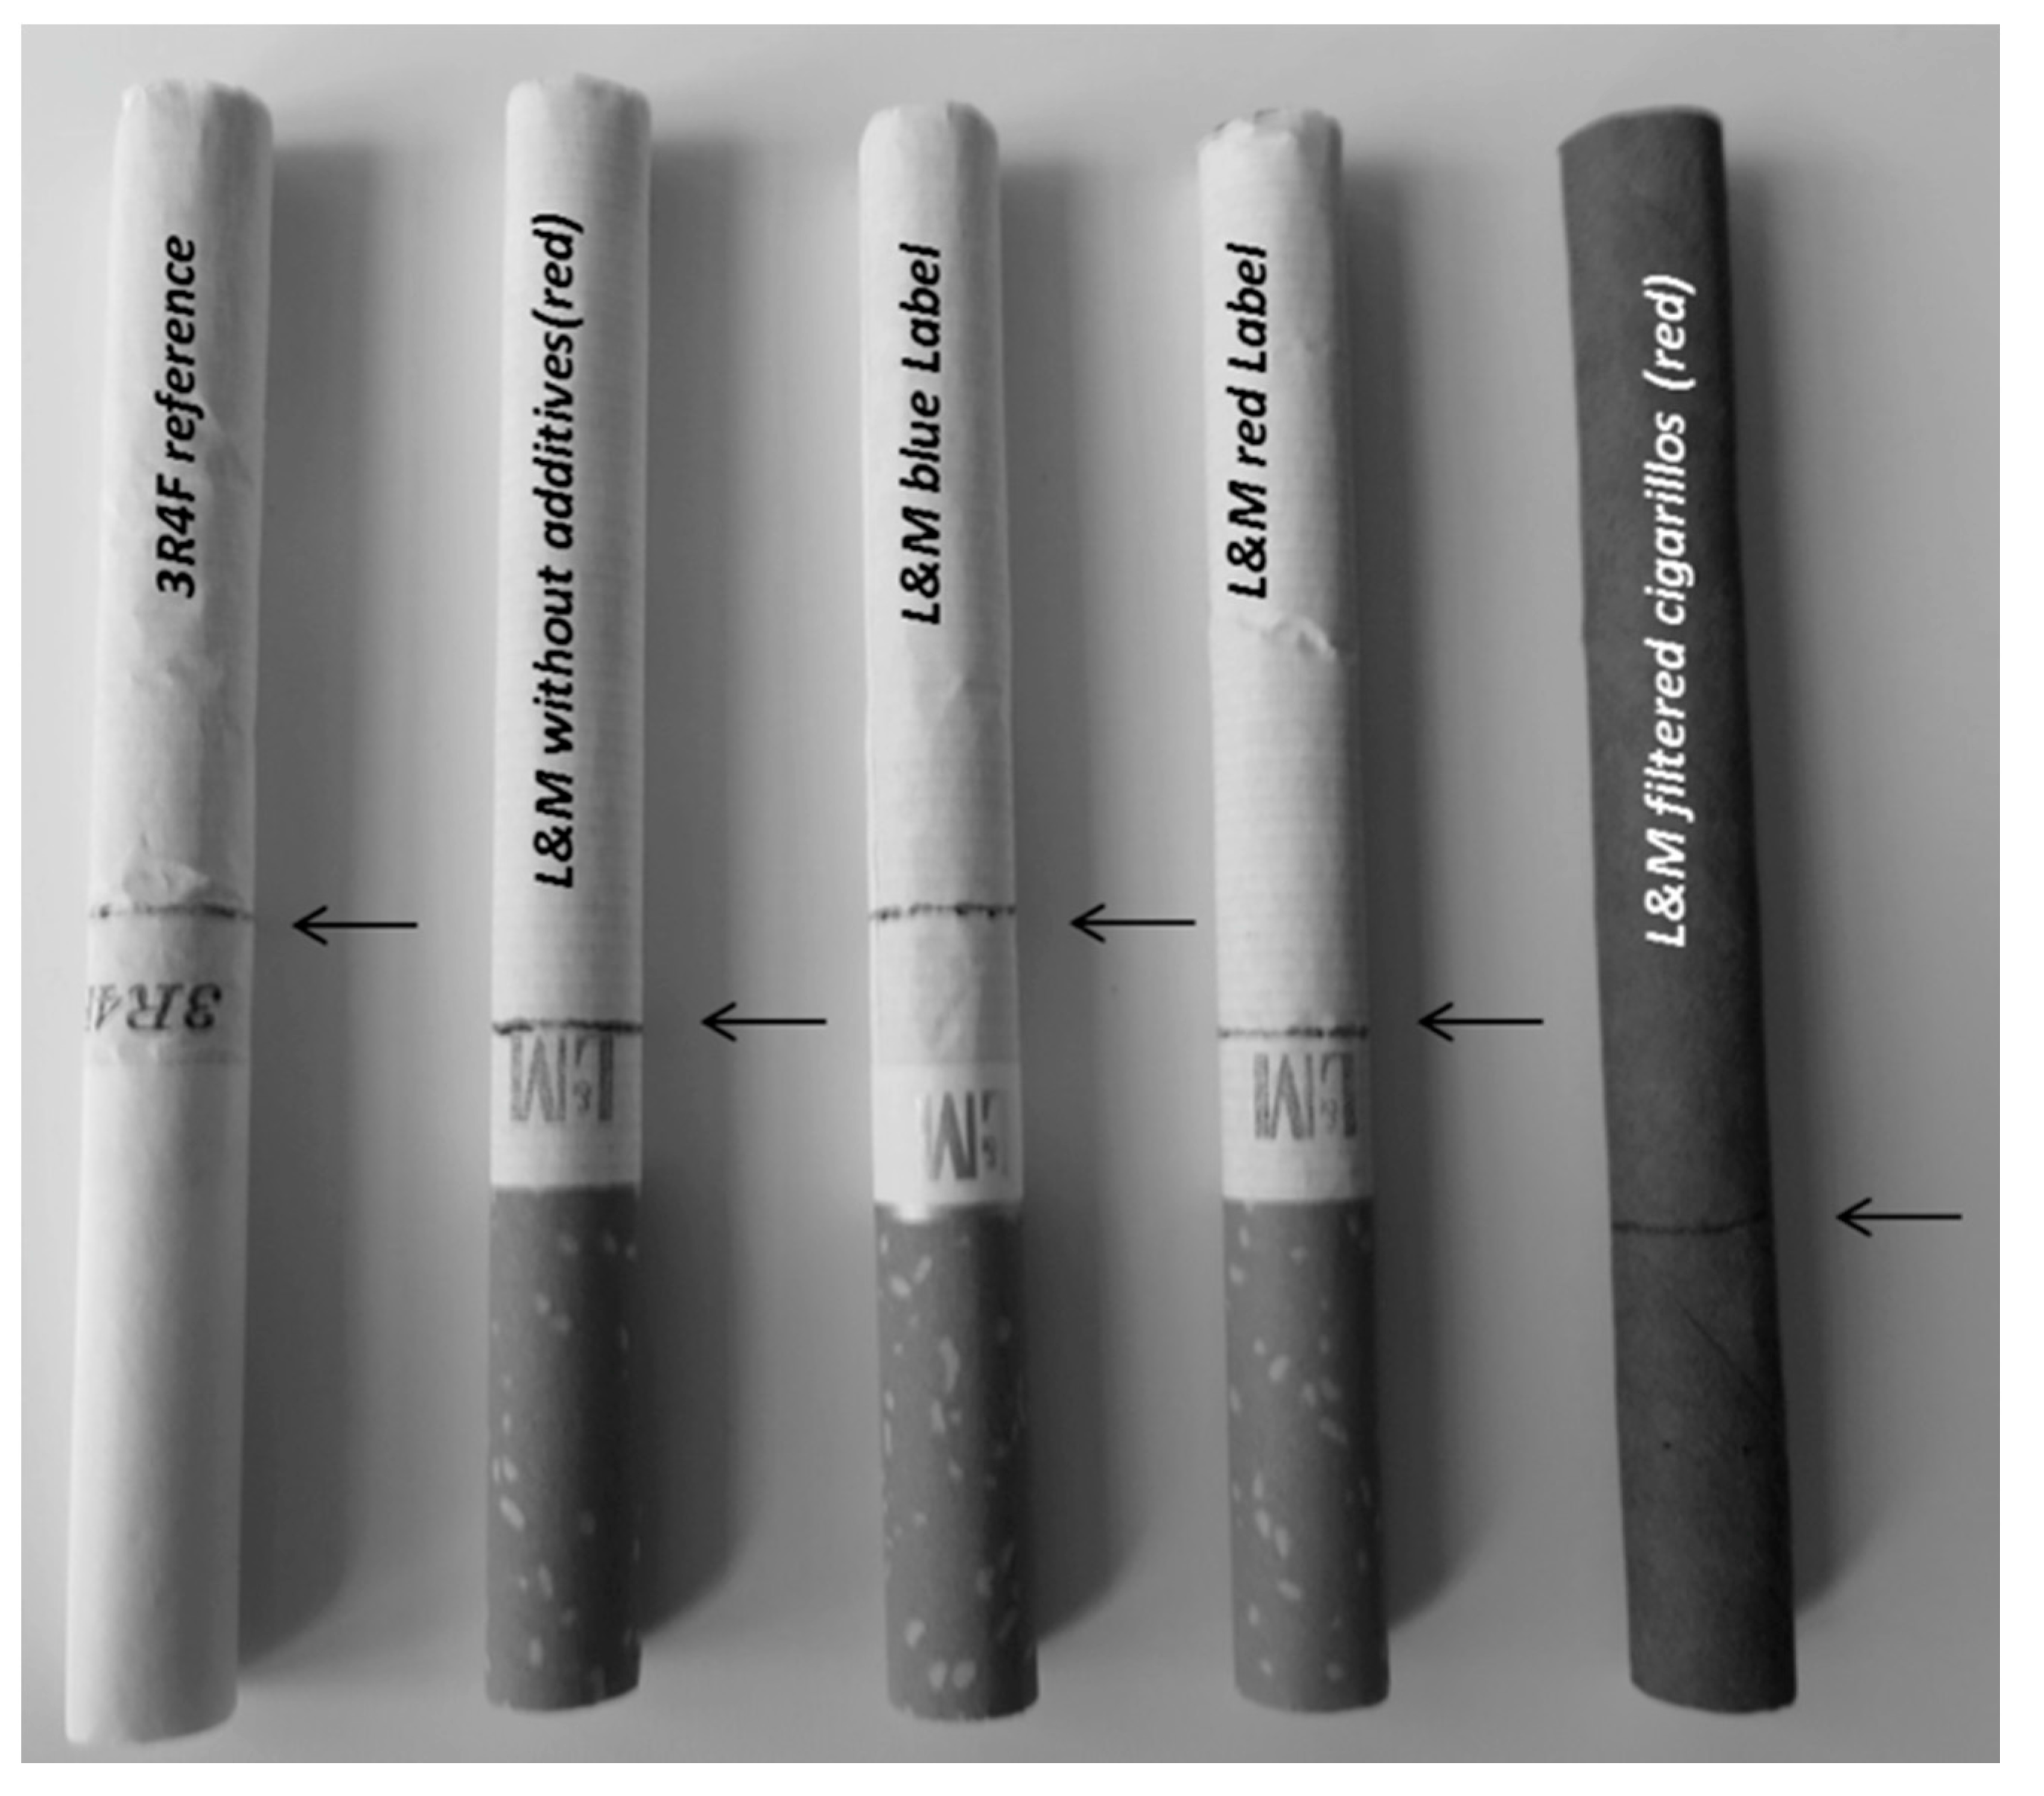
2.1. Tobacco Products

| Features | 3R4F Reference | L&M without Additive (Red) | L&M Blue | L&M Red | L&M Filtered Cigarillos (Red) |
|---|---|---|---|---|---|
| producer | Univ. of Kentucky | Philip Morris GmbH | Philip Morris GmbH | Philip Morris GmbH | Philip Morris GmbH |
| price [€] | 0.15 | 5 | 5 | 5 | 2.20 |
| units per package | 20 | 20 | 20 | 20 | 17 |
| tar content [mg] | 9.4 | 10 | 6 | 10 | no information |
| nicotine content [mg] | 0.73 | 0.9 | 0.5 | 0.8 | no information |
| carbon monoxide [mg] | 12.0 | 10 | 7 | 10 | no information |
| length [mm] | 84 | 83 | 83 | 83 | 84 |
| weight [mg] | 988 | 787 | 771 | 828 | 1241 |
| filter length [mm] | 27 | 20 | 26 | 20 | 7 |
| filter diameter [mm] | 8 | 8 | 8 | 8 | 8 |
| filter weight [mg] | 170 | 112 | 147 | 105 | 35 |
| tobacco weight [mg] | 775 | 582 | 528 | 623 | 869 |


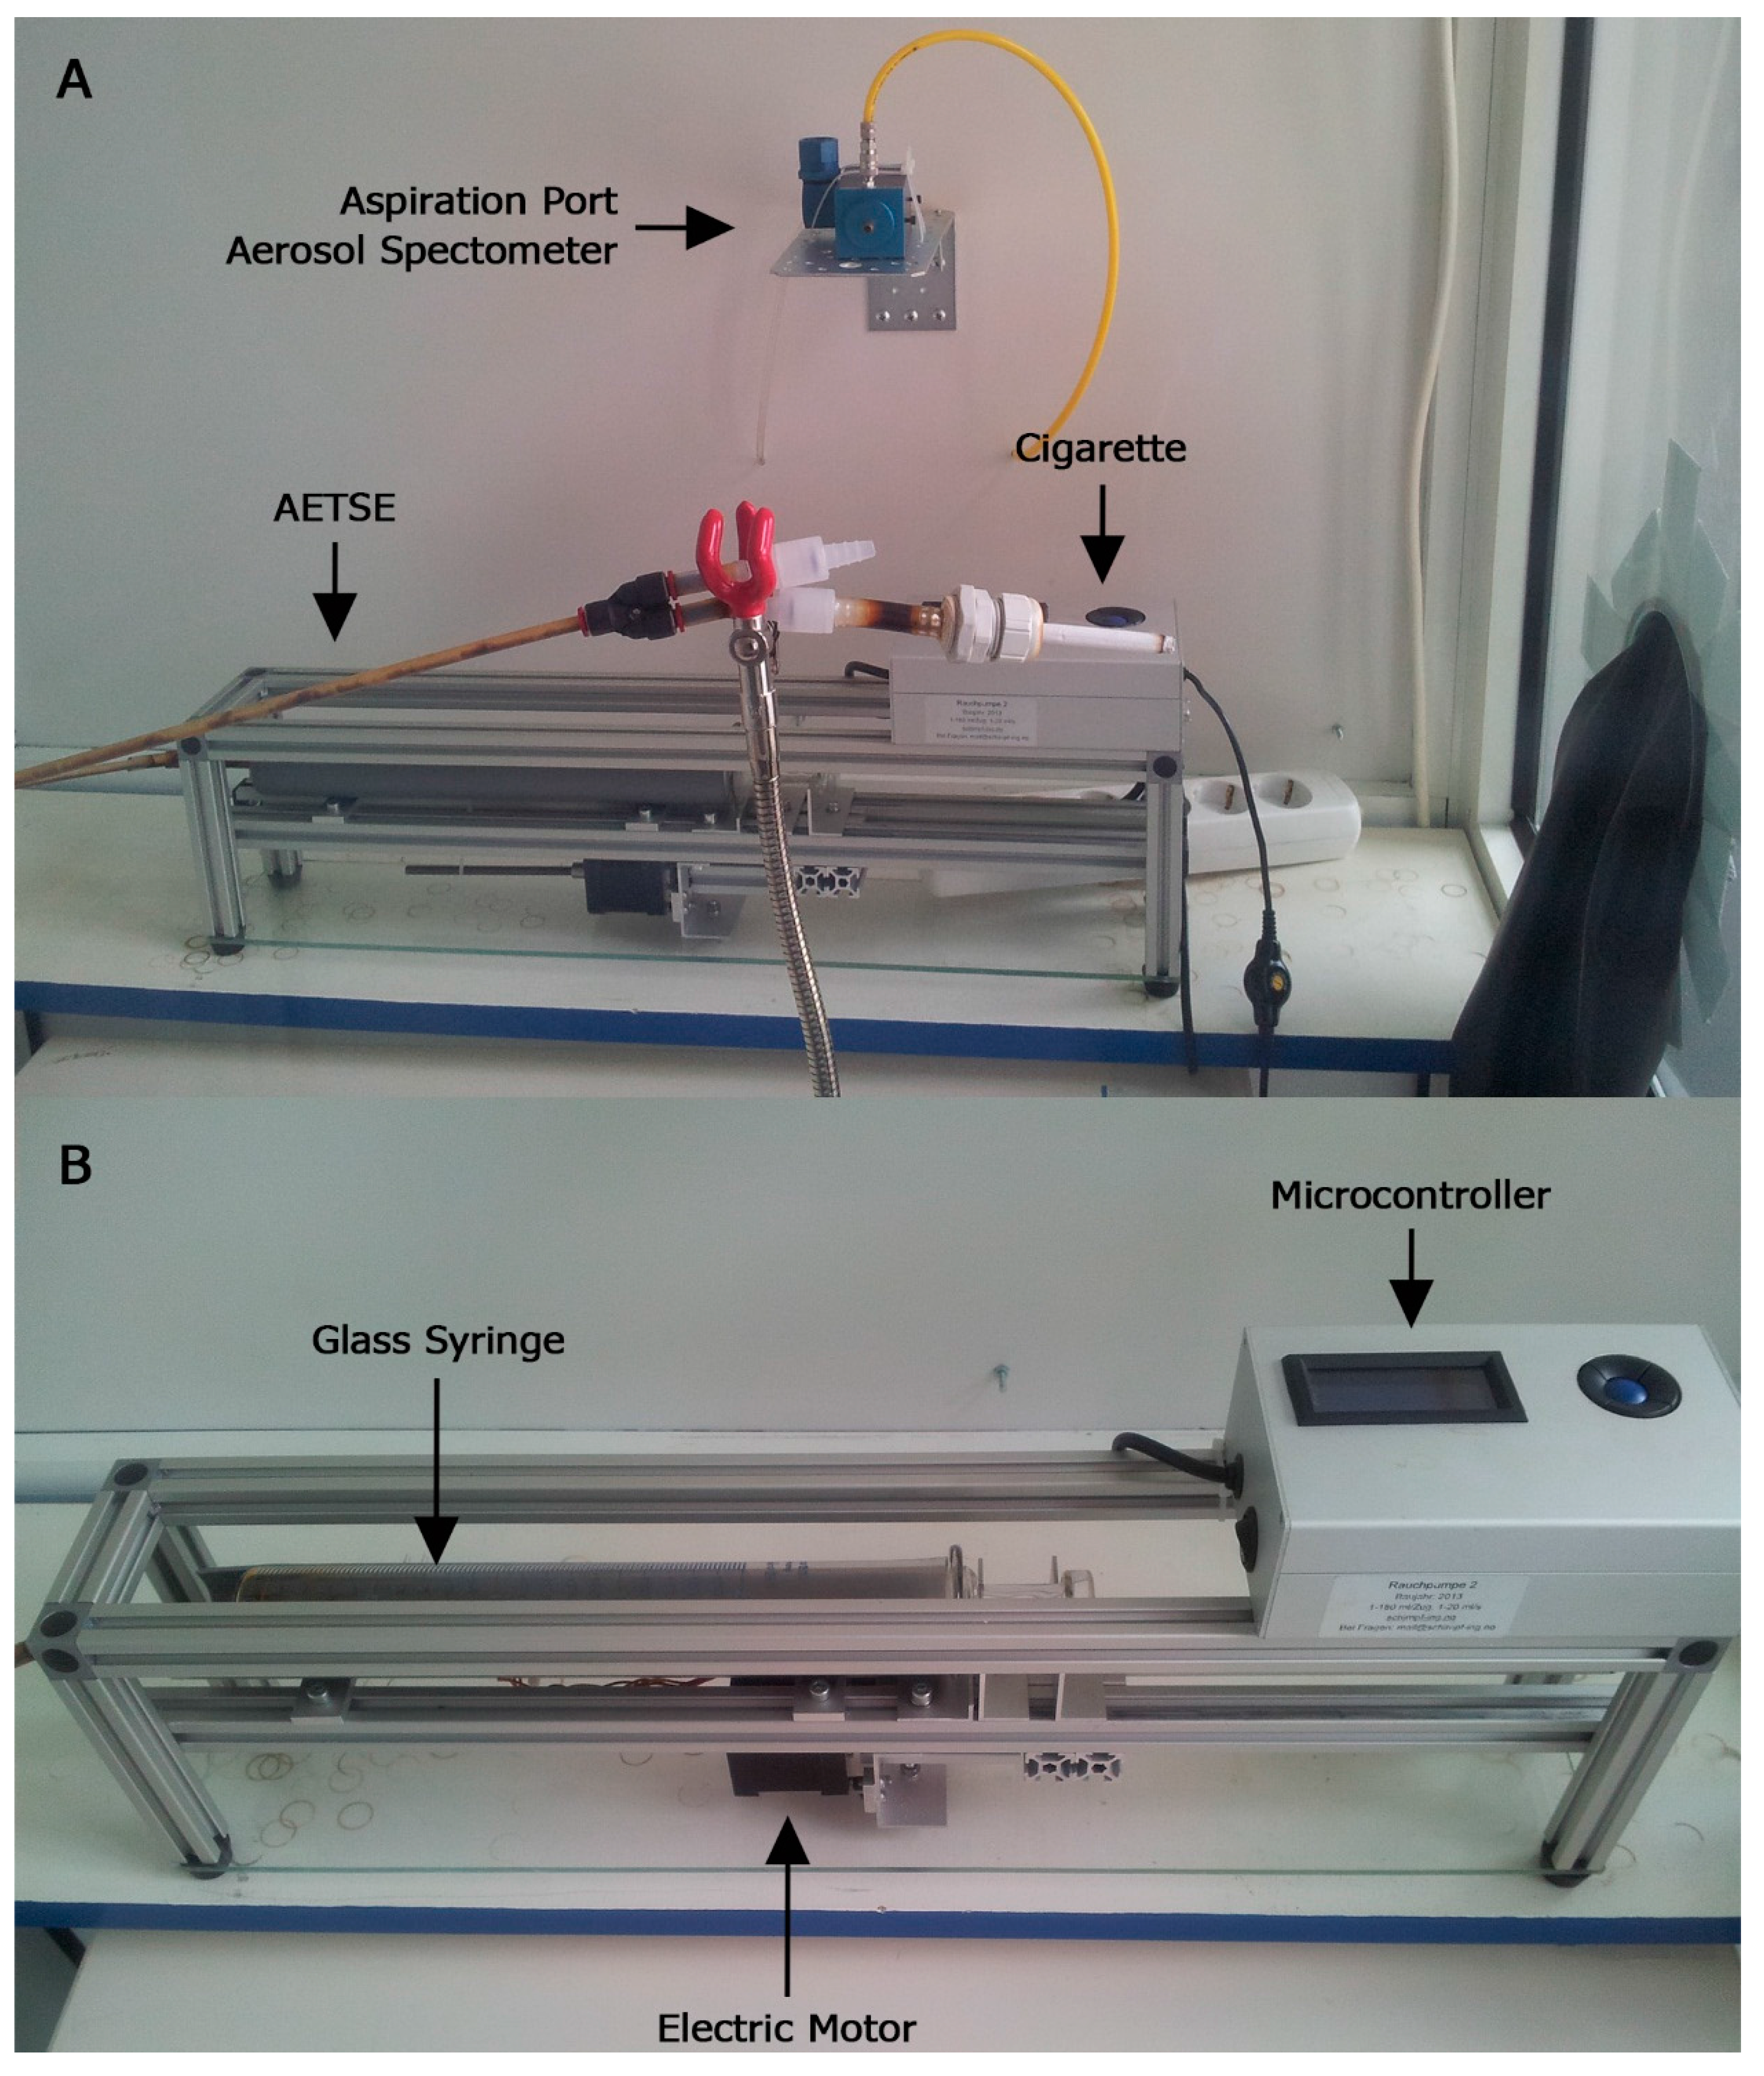
2.2. Analytical Unit/Automatic Environmental Tobacco Smoke Emitter (AETSE)
2.3. Aerosol Spectrometer
2.4. Smoking Protocol
| Smoking parameters | 3R4F Reference | L&M without Additives (Red) | L&M Blue | L&M Red | L&M Filtered Cigarillo (Red) |
|---|---|---|---|---|---|
| number tested (n) | 20 | 20 | 20 | 20 | 20 |
| minimum duration of smoking [s] | 300 | 285 | 270 | 345 | 660 |
| maximum duration of smoking [s] | 450 | 400 | 460 | 520 | 1380 |
| mean duration of smoking [s] | 404 | 357 | 355 | 438 | 1054 |
| mean number of drags taken | 13 | 10 | 10 | 14 | 35 |
2.5. Data Processing and Analysis


3. Results and Discussion
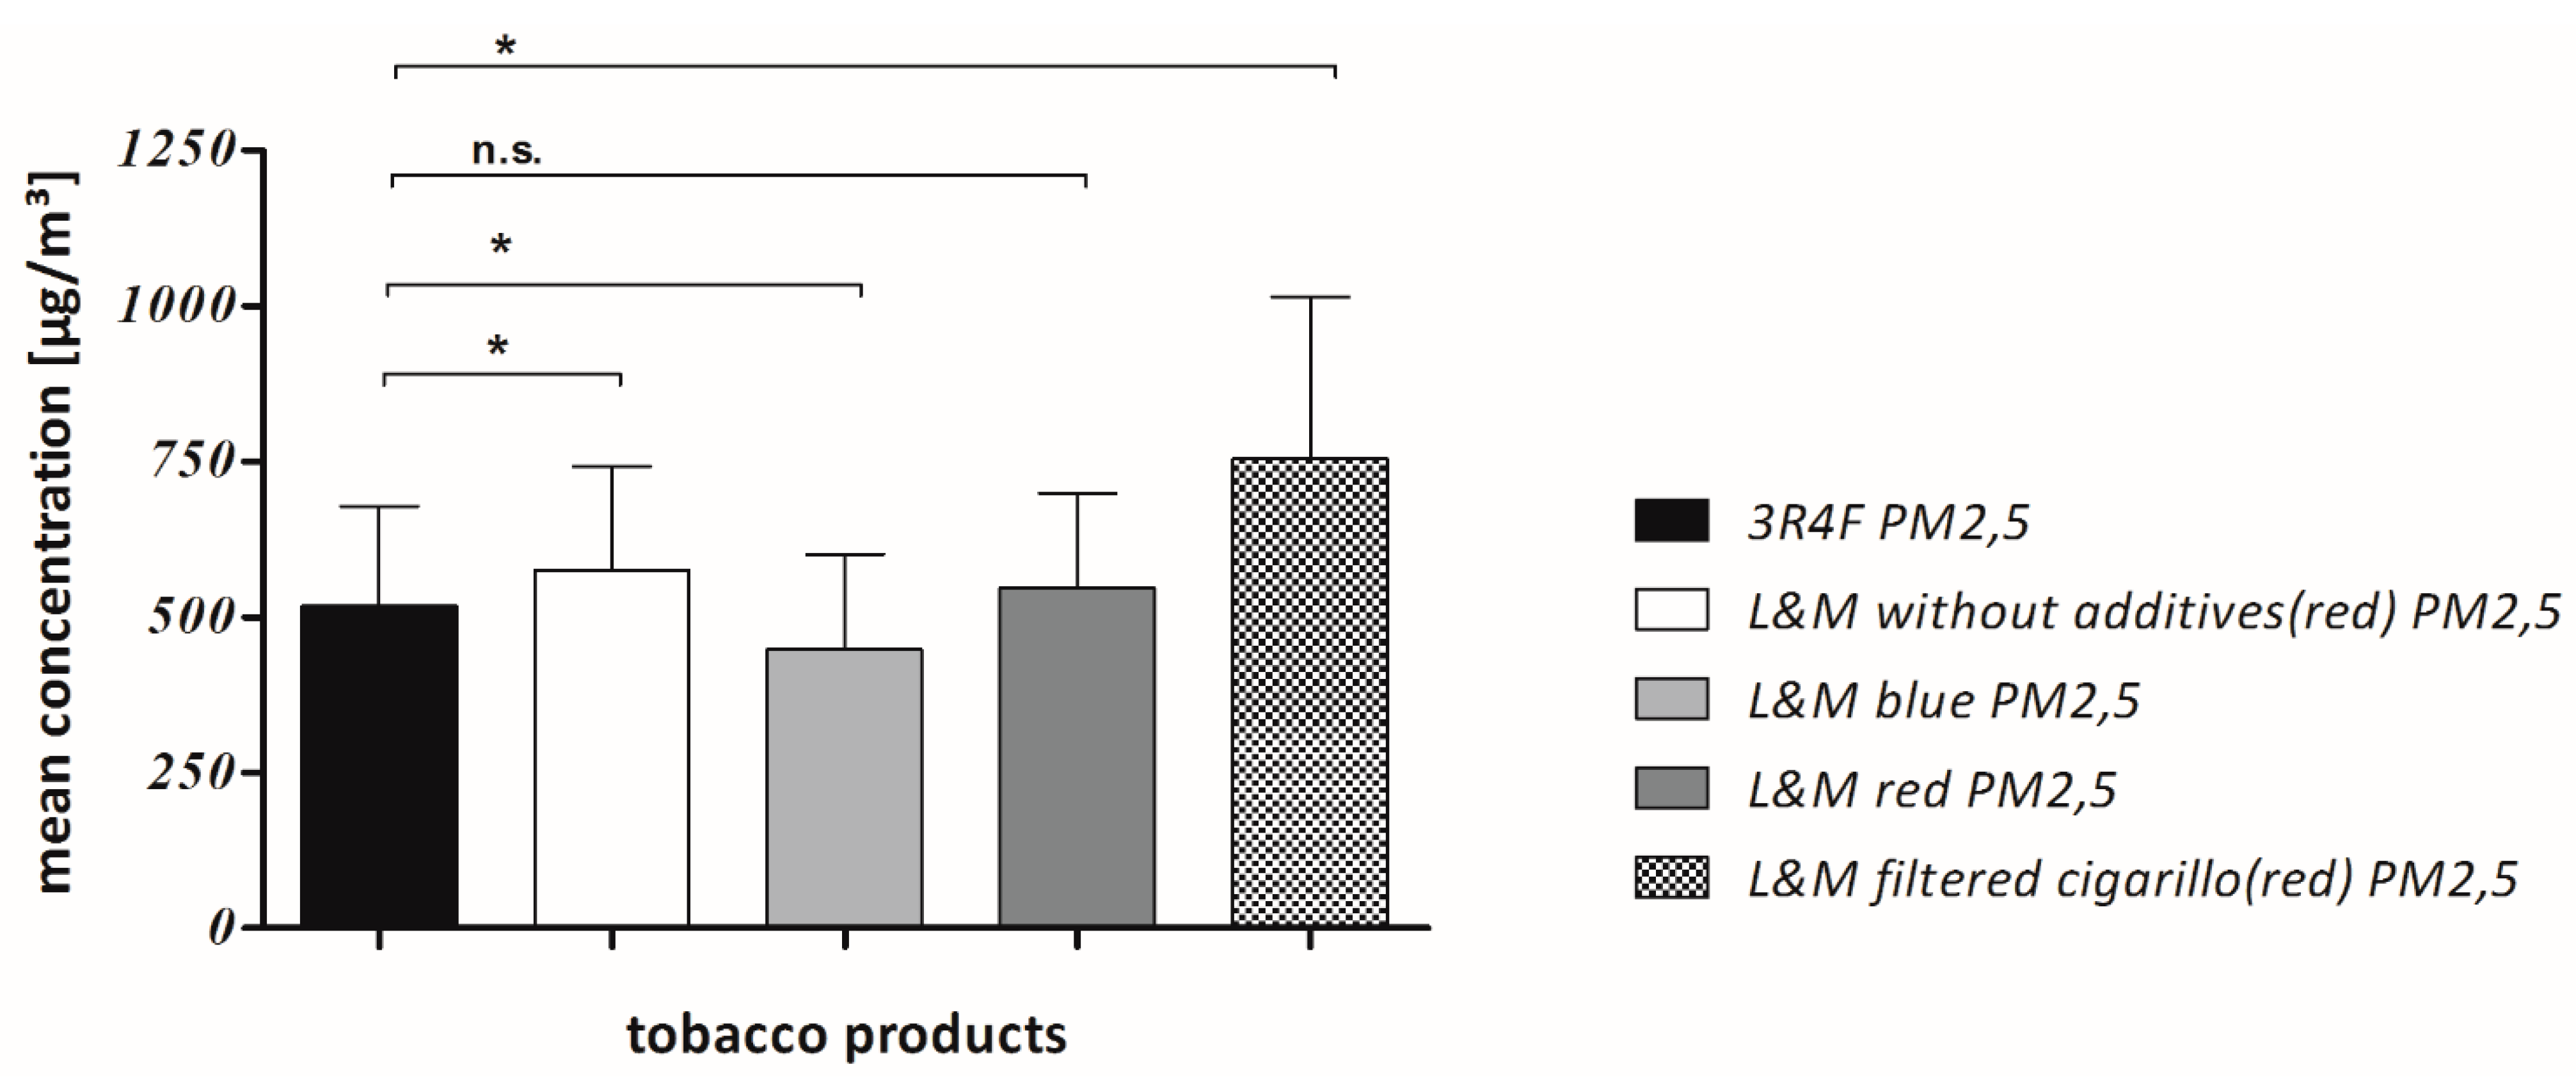
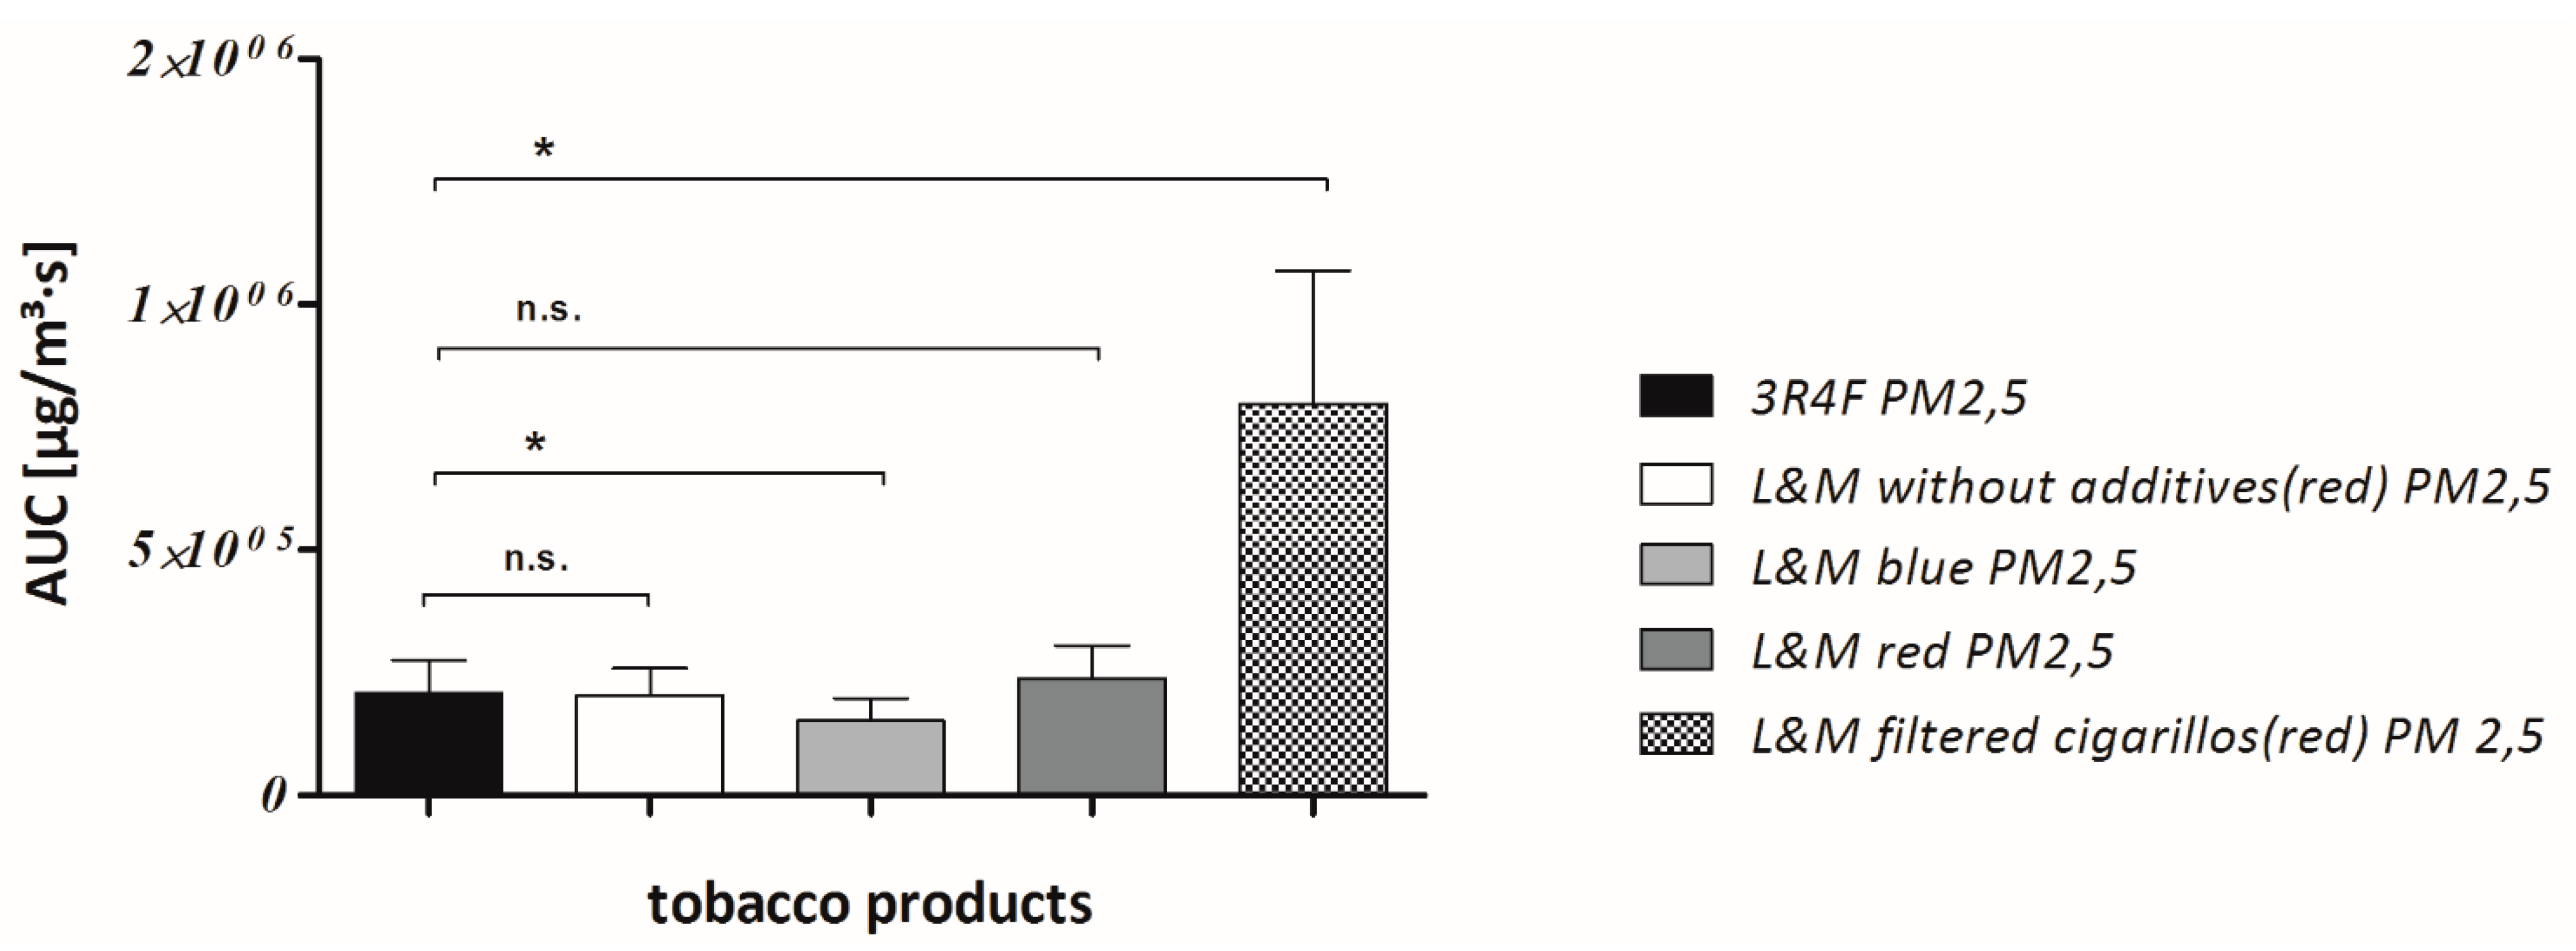
| PM2.5-Values | 3R4F Reference | L&M without Additives (Red) | L&M Blue | L&M Red | L&M Filtered Cigarillo (Red) |
|---|---|---|---|---|---|
| Cmean PM2.5 (μg/m3) | 518 ± 161 | 576 ± 166 | 448 ± 154 | 547 ± 153 | 755 ± 259 |
| AUC PM2.5 (μg/m3·s) | 208,214 ± 67,324 | 204,629 ± 55,191 | 152,718 ± 45,183 | 238,098 ± 67652 | 796,909 ± 271710 |
4. Conclusions
Acknowledgments
Author Contributions
Conflicts of Interest
References
- Philip_Morris_International. Our Brands. Available online: http://www.pmi.com/eng/our_products/pages/our_brands.aspx (accessed on 15 April 2015).
- Chen, C.M.; Chang, K.L.; Lin, L.; Lee, J.L. Brand switching or reduced consumption? A study of how cigarette taxes affect tobacco consumption. Eur. J. Health Econ. 2014, 15, 991–998. [Google Scholar] [CrossRef] [PubMed]
- Saenz de Miera Juarez, B.; Thrasher, J.F.; Reynales Shigematsu, L.M.; Hernandez Avila, M.; Chaloupka, F.J. Tax, price and cigarette brand preferences: A longitudinal study of adult smokers from the itc mexico survey. Tob. Control 2014, 23. [Google Scholar] [CrossRef] [PubMed]
- EPA; United_States_Environmental_Protection_Agency. Particulate Matter (PM). Available online: http://www.epa.gov/pm/ (accessed on 12 December 2014).
- Vardavas, C.I.; Karabela, M.; Agaku, I.T.; Matsunaga, Y.; Myridakis, A.; Kouvarakis, A.; Stephanou, E.G.; Lymperi, M.; Behrakis, P.K. Secondhand smoke exposure within semi-open air cafes and tobacco specific 4-(methylnitrosamino)-1-(3-pyridyl)-1-butanol (nnal) concentrations among nonsmoking employees. Int. J. Occup. Med. Environ. Health 2014, 27, 875–881. [Google Scholar] [CrossRef] [PubMed]
- Atkinson, R.W.; Anderson, H.R.; Sunyer, J.; Ayres, J.; Baccini, M.; Vonk, J.M.; Boumghar, A.; Forastiere, F.; Forsberg, B.; Touloumi, G.; et al. Acute effects of particulate air pollution on respiratory admissions: Results from aphea 2 project. Air pollution and health: A european approach. Am. J. Respir. Crit. Care Med. 2001, 164, 1860–1866. [Google Scholar] [CrossRef] [PubMed]
- Moldoveanu, S.C.; St.Charles, F.K. Differences in the chemical composition of the particulate phase of inhaled and exhaled cigarette mainstream smoke. Contrib. Tob. Res. 2007, 22, 290–302. [Google Scholar]
- Bell, M.L.; Ebisu, K.; Peng, R.D.; Walker, J.; Samet, J.M.; Zeger, S.L.; Dominici, F. Seasonal and regional short-term effects of fine particles on hospital admissions in 202 US counties, 1999–2005. Am. J. Epidemiol. 2008, 168, 1301–1310. [Google Scholar] [CrossRef] [PubMed]
- Brook, R.D.; Rajagopalan, S.; Pope, C.A., 3rd; Brook, J.R.; Bhatnagar, A.; Diez-Roux, A.V.; Holguin, F.; Hong, Y.; Luepker, R.V.; Mittleman, M.A.; et al. Particulate matter air pollution and cardiovascular disease: An update to the scientific statement from the american heart association. Circulation 2010, 121, 2331–2378. [Google Scholar] [CrossRef] [PubMed]
- Turner, M.C.; Krewski, D.; Pope, C.A., 3rd; Chen, Y.; Gapstur, S.M.; Thun, M.J. Long-term ambient fine particulate matter air pollution and lung cancer in a large cohort of never-smokers. Am. J. Respir. Crit. Care Med. 2011, 184, 1374–1381. [Google Scholar] [CrossRef] [PubMed]
- Brook, R.D.; Xu, X.; Bard, R.L.; Dvonch, J.T.; Morishita, M.; Kaciroti, N.; Sun, Q.; Harkema, J.; Rajagopalan, S. Reduced metabolic insulin sensitivity following sub-acute exposures to low levels of ambient fine particulate matter air pollution. Sci. Total Environ. 2013, 448, 66–71. [Google Scholar] [CrossRef] [PubMed]
- Chen, H.; Burnett, R.T.; Kwong, J.C.; Villeneuve, P.J.; Goldberg, M.S.; Brook, R.D.; van Donkelaar, A.; Jerrett, M.; Martin, R.V.; Brook, J.R.; et al. Risk of incident diabetes in relation to long-term exposure to fine particulate matter in Ontario, Canada. Environ. Health Perspect. 2013, 121, 804–810. [Google Scholar] [CrossRef] [PubMed]
- Beelen, R.; Raaschou-Nielsen, O.; Stafoggia, M.; Andersen, Z.J.; Weinmayr, G.; Hoffmann, B.; Wolf, K.; Samoli, E.; Fischer, P.; Nieuwenhuijsen, M.; et al. Effects of long-term exposure to air pollution on natural-cause mortality: An analysis of 22 European cohorts within the multicentre escape project. Lancet 2014, 383, 785–795. [Google Scholar] [CrossRef]
- Wang, B.; Xu, D.; Jing, Z.; Liu, D.; Yan, S.; Wang, Y. Effect of long-term exposure to air pollution on type 2 diabetes mellitus risk: A systemic review and meta-analysis of cohort studies. Eur. J. Endocrinol. 2014, 171, R173–R182. [Google Scholar] [CrossRef] [PubMed]
- Chen, R.; Zhao, Z.; Sun, Q.; Lin, Z.; Zhao, A.; Wang, C.; Xia, Y.; Xu, X.; Kan, H. Size-fractionated particulate air pollution and circulating biomarkers of inflammation, coagulation, and vasoconstriction in a panel of young adults. Epidemiolology 2015, 26, 328–336. [Google Scholar] [CrossRef] [PubMed]
- Valavanidis, A.; Fiotakis, K.; Vlachogianni, T. Airborne particulate matter and human health: Toxicological assessment and importance of size and composition of particles for oxidative damage and carcinogenic mechanisms. J. Environ. Sci. Health Part C Environ. Carcinog. Ecotoxicol. Rev. 2008, 26, 339–362. [Google Scholar] [CrossRef] [PubMed]
- Siponen, T.; Yli-Tuomi, T.; Aurela, M.; Dufva, H.; Hillamo, R.; Hirvonen, M.R.; Huttunen, K.; Pekkanen, J.; Pennanen, A.; Salonen, I.; et al. Source-specific fine particulate air pollution and systemic inflammation in ischaemic heart disease patients. Occup. Environ. Med. 2014, 72, 227–283. [Google Scholar] [CrossRef] [PubMed]
- Baker, F.; Dye, J.T.; Denniston, M.M.; Ainsworth, S.R. Risk perception and cigar smoking behavior. Am. J. Health Behav. 2001, 25, 106–114. [Google Scholar] [CrossRef] [PubMed]
- Rickert, W.S.; Wright, W.G.; Trivedi, A.H.; Momin, R.A.; Lauterbach, J.H. A comparative study of the mutagenicity of various types of tobacco products. Regul. Toxicol. Pharmacol. 2007, 48, 320–330. [Google Scholar] [CrossRef] [PubMed]
- Gerber, A.; Hofen-Hohloch, A.V.; Schulze, J.; Groneberg, D.A. Tobacco smoke particles and indoor air quality (topiq-ii)-a modified study protocol and first results. J. Occup. Med. Toxicol. 2015, 10. [Google Scholar] [CrossRef] [PubMed]
- Wertz, M.S.; Kyriss, T.; Paranjape, S.; Glantz, S.A. The toxic effects of cigarette additives. Philip Morris’ project mix reconsidered: An analysis of documents released through litigation. PLoS Med. 2011, 8. [Google Scholar] [CrossRef] [PubMed]
- Gerber, A.; Bigelow, A.; Schulze, M.; Groneberg, D.A. Brand cigarillos—A cheap and less harmful alternative to cigarettes? Particulate matter emissions suggest otherwise. Int. J. Environ. Res. Public Health 2015, 12, 428–438. [Google Scholar] [CrossRef] [PubMed]
- WHO Tobacco_Free_Initiative_Tobacco_Laboratory_Networt_(TobLabNet). Standard Operatin Procedure for Intense Smoking of Cigarettes who Toblabnet Official Method Sop 01; WHO: Geneva, Switzerland, 2012. [Google Scholar]
- Nil, R.; Buzzi, R.; Bättig, K. Analyse des rauchverhaltens bei zigarettenrauchern. Méd. Sociale et Préventive 1981, 26, 328–329. [Google Scholar] [CrossRef]
- Hammond, D.; Wiebel, F.; Kozlowski, L.T.; Borland, R.; Cummings, K.M.; O’Connor, R.J.; McNeill, A.; Connolly, G.N.; Arnott, D.; Fong, G.T. Revising the machine smoking regime for cigarette emissions: Implications for tobacco control policy. Tob. Control 2007, 16, 8–14. [Google Scholar] [CrossRef] [PubMed]
- Baker, R. The development and significance of standards for smoking-maschine methodology. Contrib. Tob. Res. 2002, 20, 23–41. [Google Scholar]
- Sureda, X.; Fernandez, E.; Lopez, M.J.; Nebot, M. Secondhand tobacco smoke exposure in open and semi-open settings: A systematic review. Environ. Health Perspect. 2013, 121, 766–773. [Google Scholar] [CrossRef] [PubMed]
- Gerber, A.; Bohn, J.; Groneberg, D.A.; Schulze, J.; Bundschuh, M. Airborne particulate matter in public transport: A field study at major intersection points in Frankfurt am Main (Germany). J. Occup. Med. Toxicol. 2014, 9. [Google Scholar] [CrossRef] [PubMed]
- Sendzik, T.; Fong, G.T.; Travers, M.J.; Hyland, A. An experimental investigation of tobacco smoke pollution in cars. Nicotine Tob. Res. 2009, 11, 627–634. [Google Scholar] [CrossRef] [PubMed]
© 2015 by the authors; licensee MDPI, Basel, Switzerland. This article is an open access article distributed under the terms and conditions of the Creative Commons Attribution license (http://creativecommons.org/licenses/by/4.0/).
Share and Cite
Wasel, J.; Boll, M.; Schulze, M.; Mueller, D.; Bundschuh, M.; Groneberg, D.A.; Gerber, A. Brand Cigarillos: Low Price but High Particulate Matter Levels—Is Their Favorable Taxation in the European Union Justified? Int. J. Environ. Res. Public Health 2015, 12, 9141-9153. https://doi.org/10.3390/ijerph120809141
Wasel J, Boll M, Schulze M, Mueller D, Bundschuh M, Groneberg DA, Gerber A. Brand Cigarillos: Low Price but High Particulate Matter Levels—Is Their Favorable Taxation in the European Union Justified? International Journal of Environmental Research and Public Health. 2015; 12(8):9141-9153. https://doi.org/10.3390/ijerph120809141
Chicago/Turabian StyleWasel, Julia, Michael Boll, Michaela Schulze, Daniel Mueller, Matthias Bundschuh, David A. Groneberg, and Alexander Gerber. 2015. "Brand Cigarillos: Low Price but High Particulate Matter Levels—Is Their Favorable Taxation in the European Union Justified?" International Journal of Environmental Research and Public Health 12, no. 8: 9141-9153. https://doi.org/10.3390/ijerph120809141
APA StyleWasel, J., Boll, M., Schulze, M., Mueller, D., Bundschuh, M., Groneberg, D. A., & Gerber, A. (2015). Brand Cigarillos: Low Price but High Particulate Matter Levels—Is Their Favorable Taxation in the European Union Justified? International Journal of Environmental Research and Public Health, 12(8), 9141-9153. https://doi.org/10.3390/ijerph120809141