
Diverse Land Use and the Impact on (Irrigation) Water Quality and Need for Measures — A Case Study of a Norwegian River

Abstract
:1. Introduction
2. Experimental Section
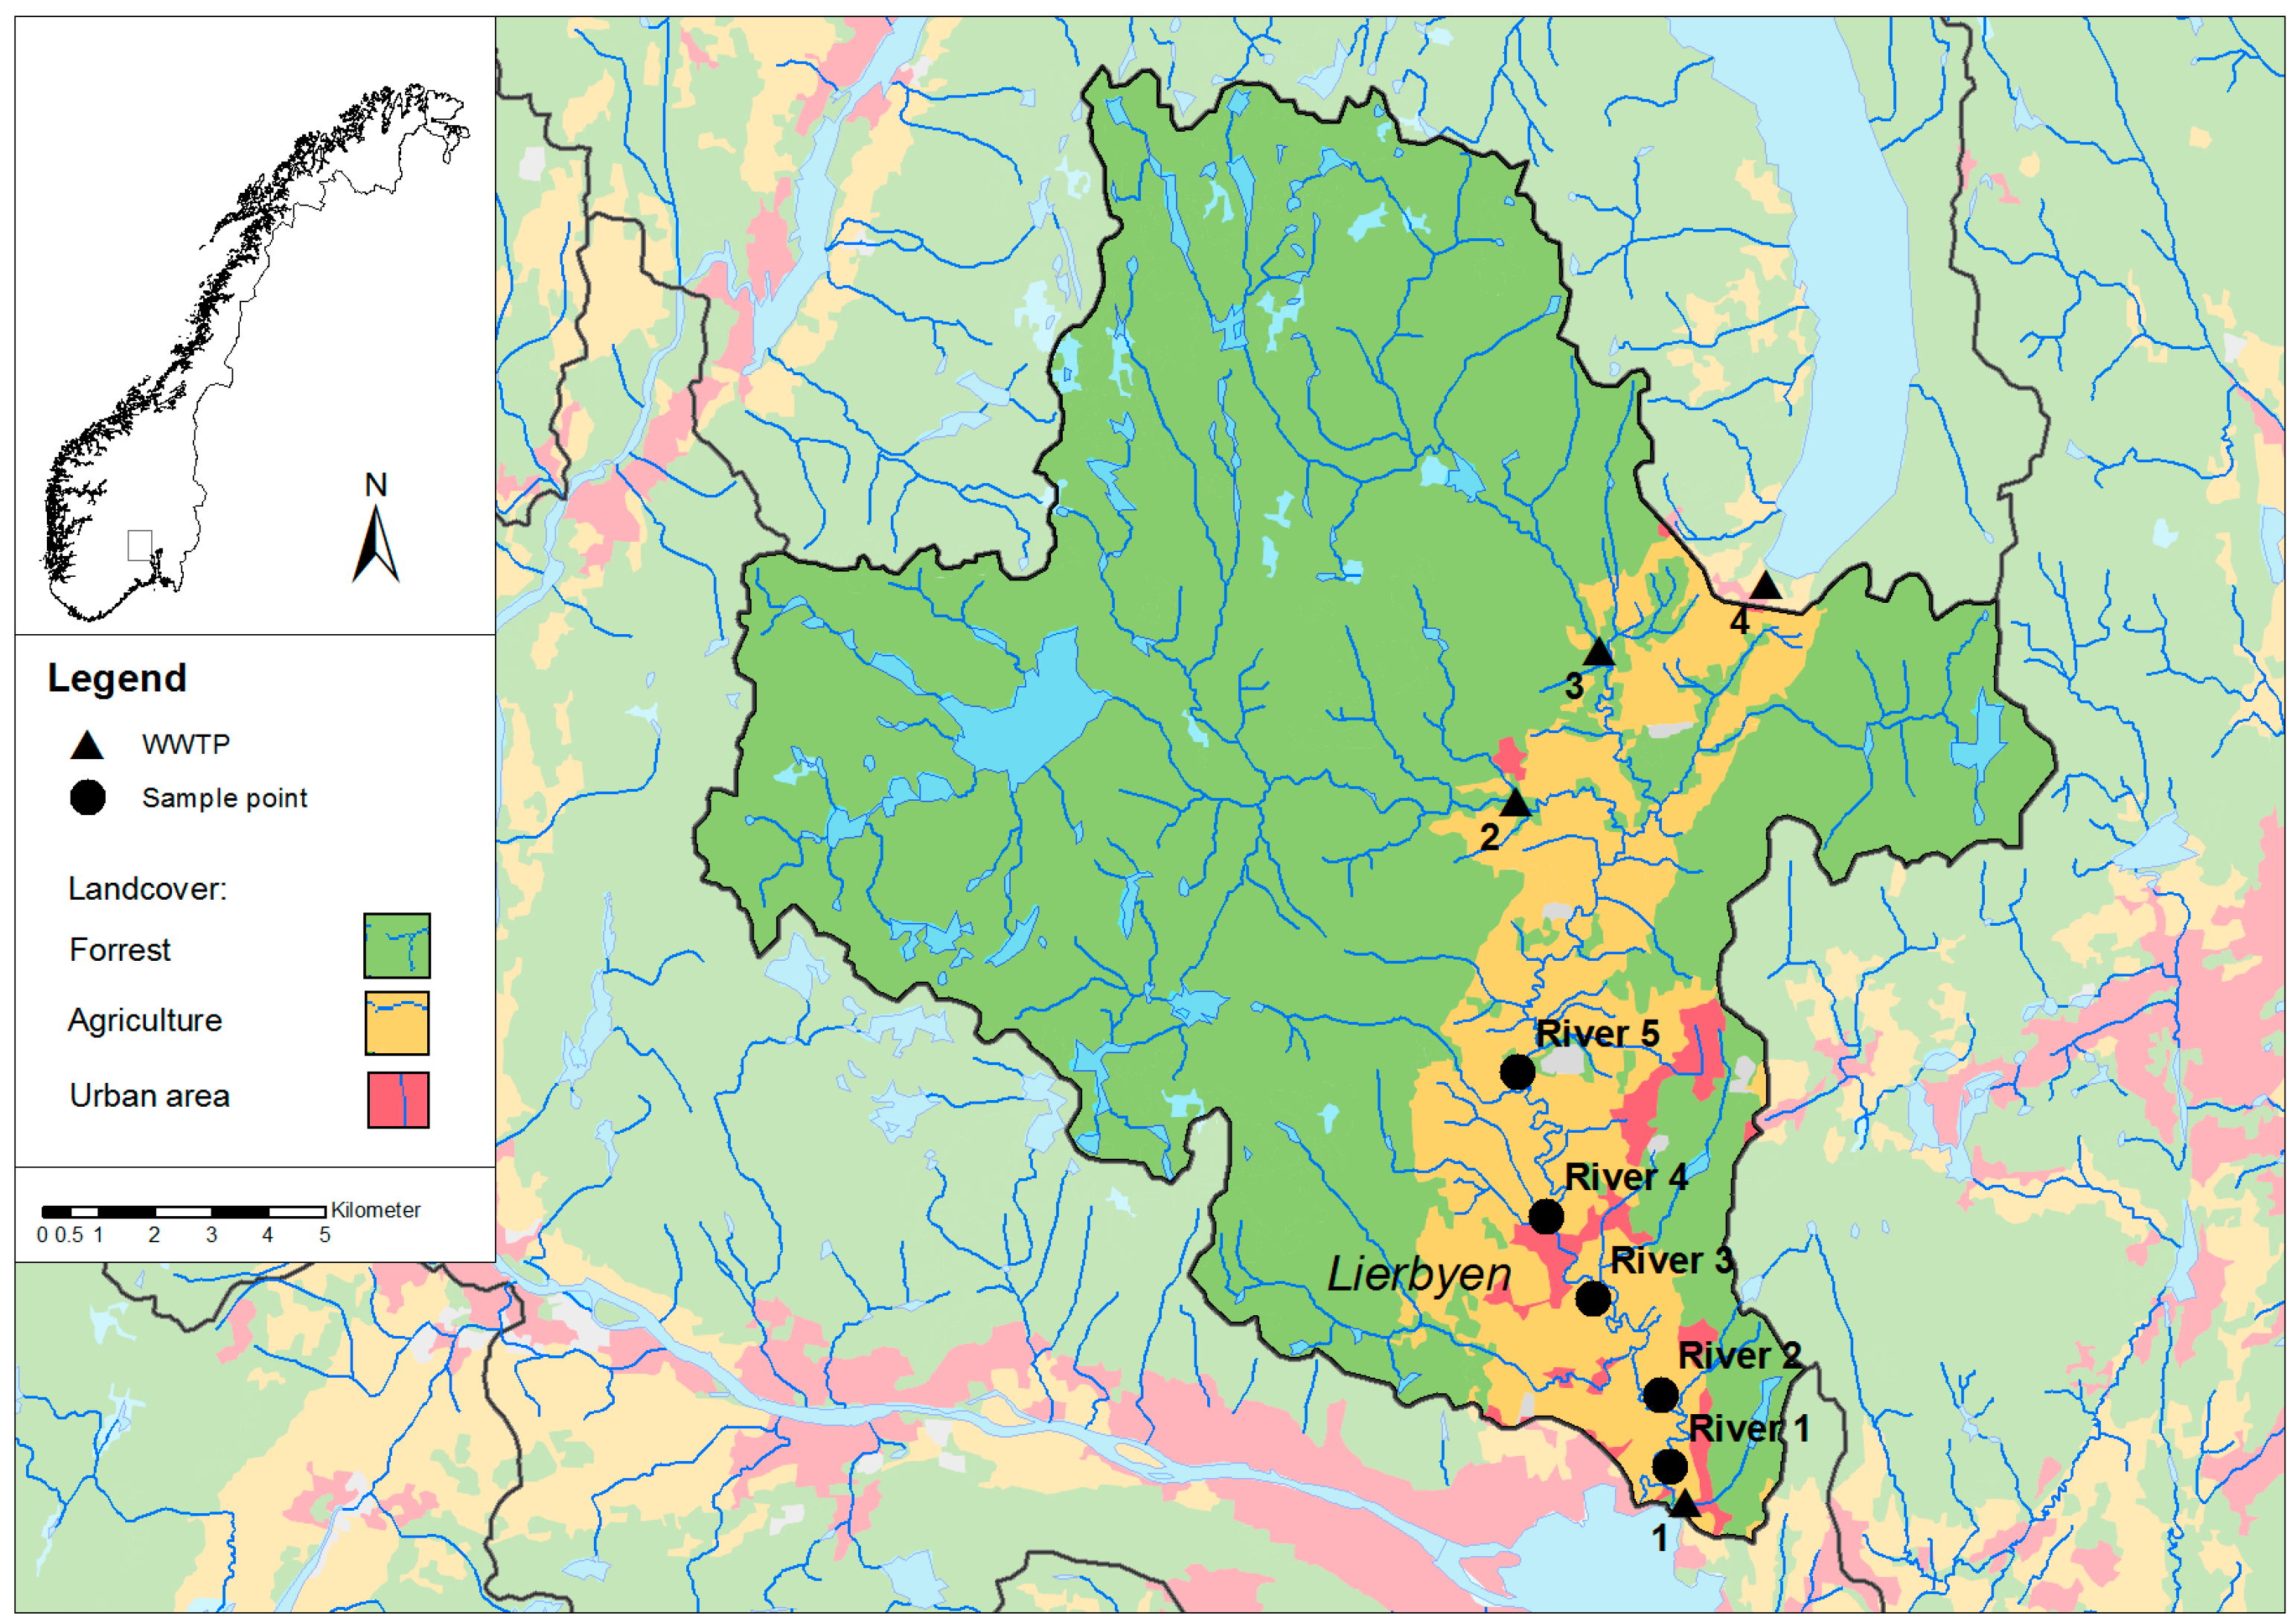
2.1. Study Area
2.2. Water Samples


| Farms | Sampling Period | Indicator Bacteria | Pathogens | Total Number of Samples Per Farm Per Year | ||
|---|---|---|---|---|---|---|
| Pres. E. coli * | E. coli | Campylobacter | Salmonella | |||
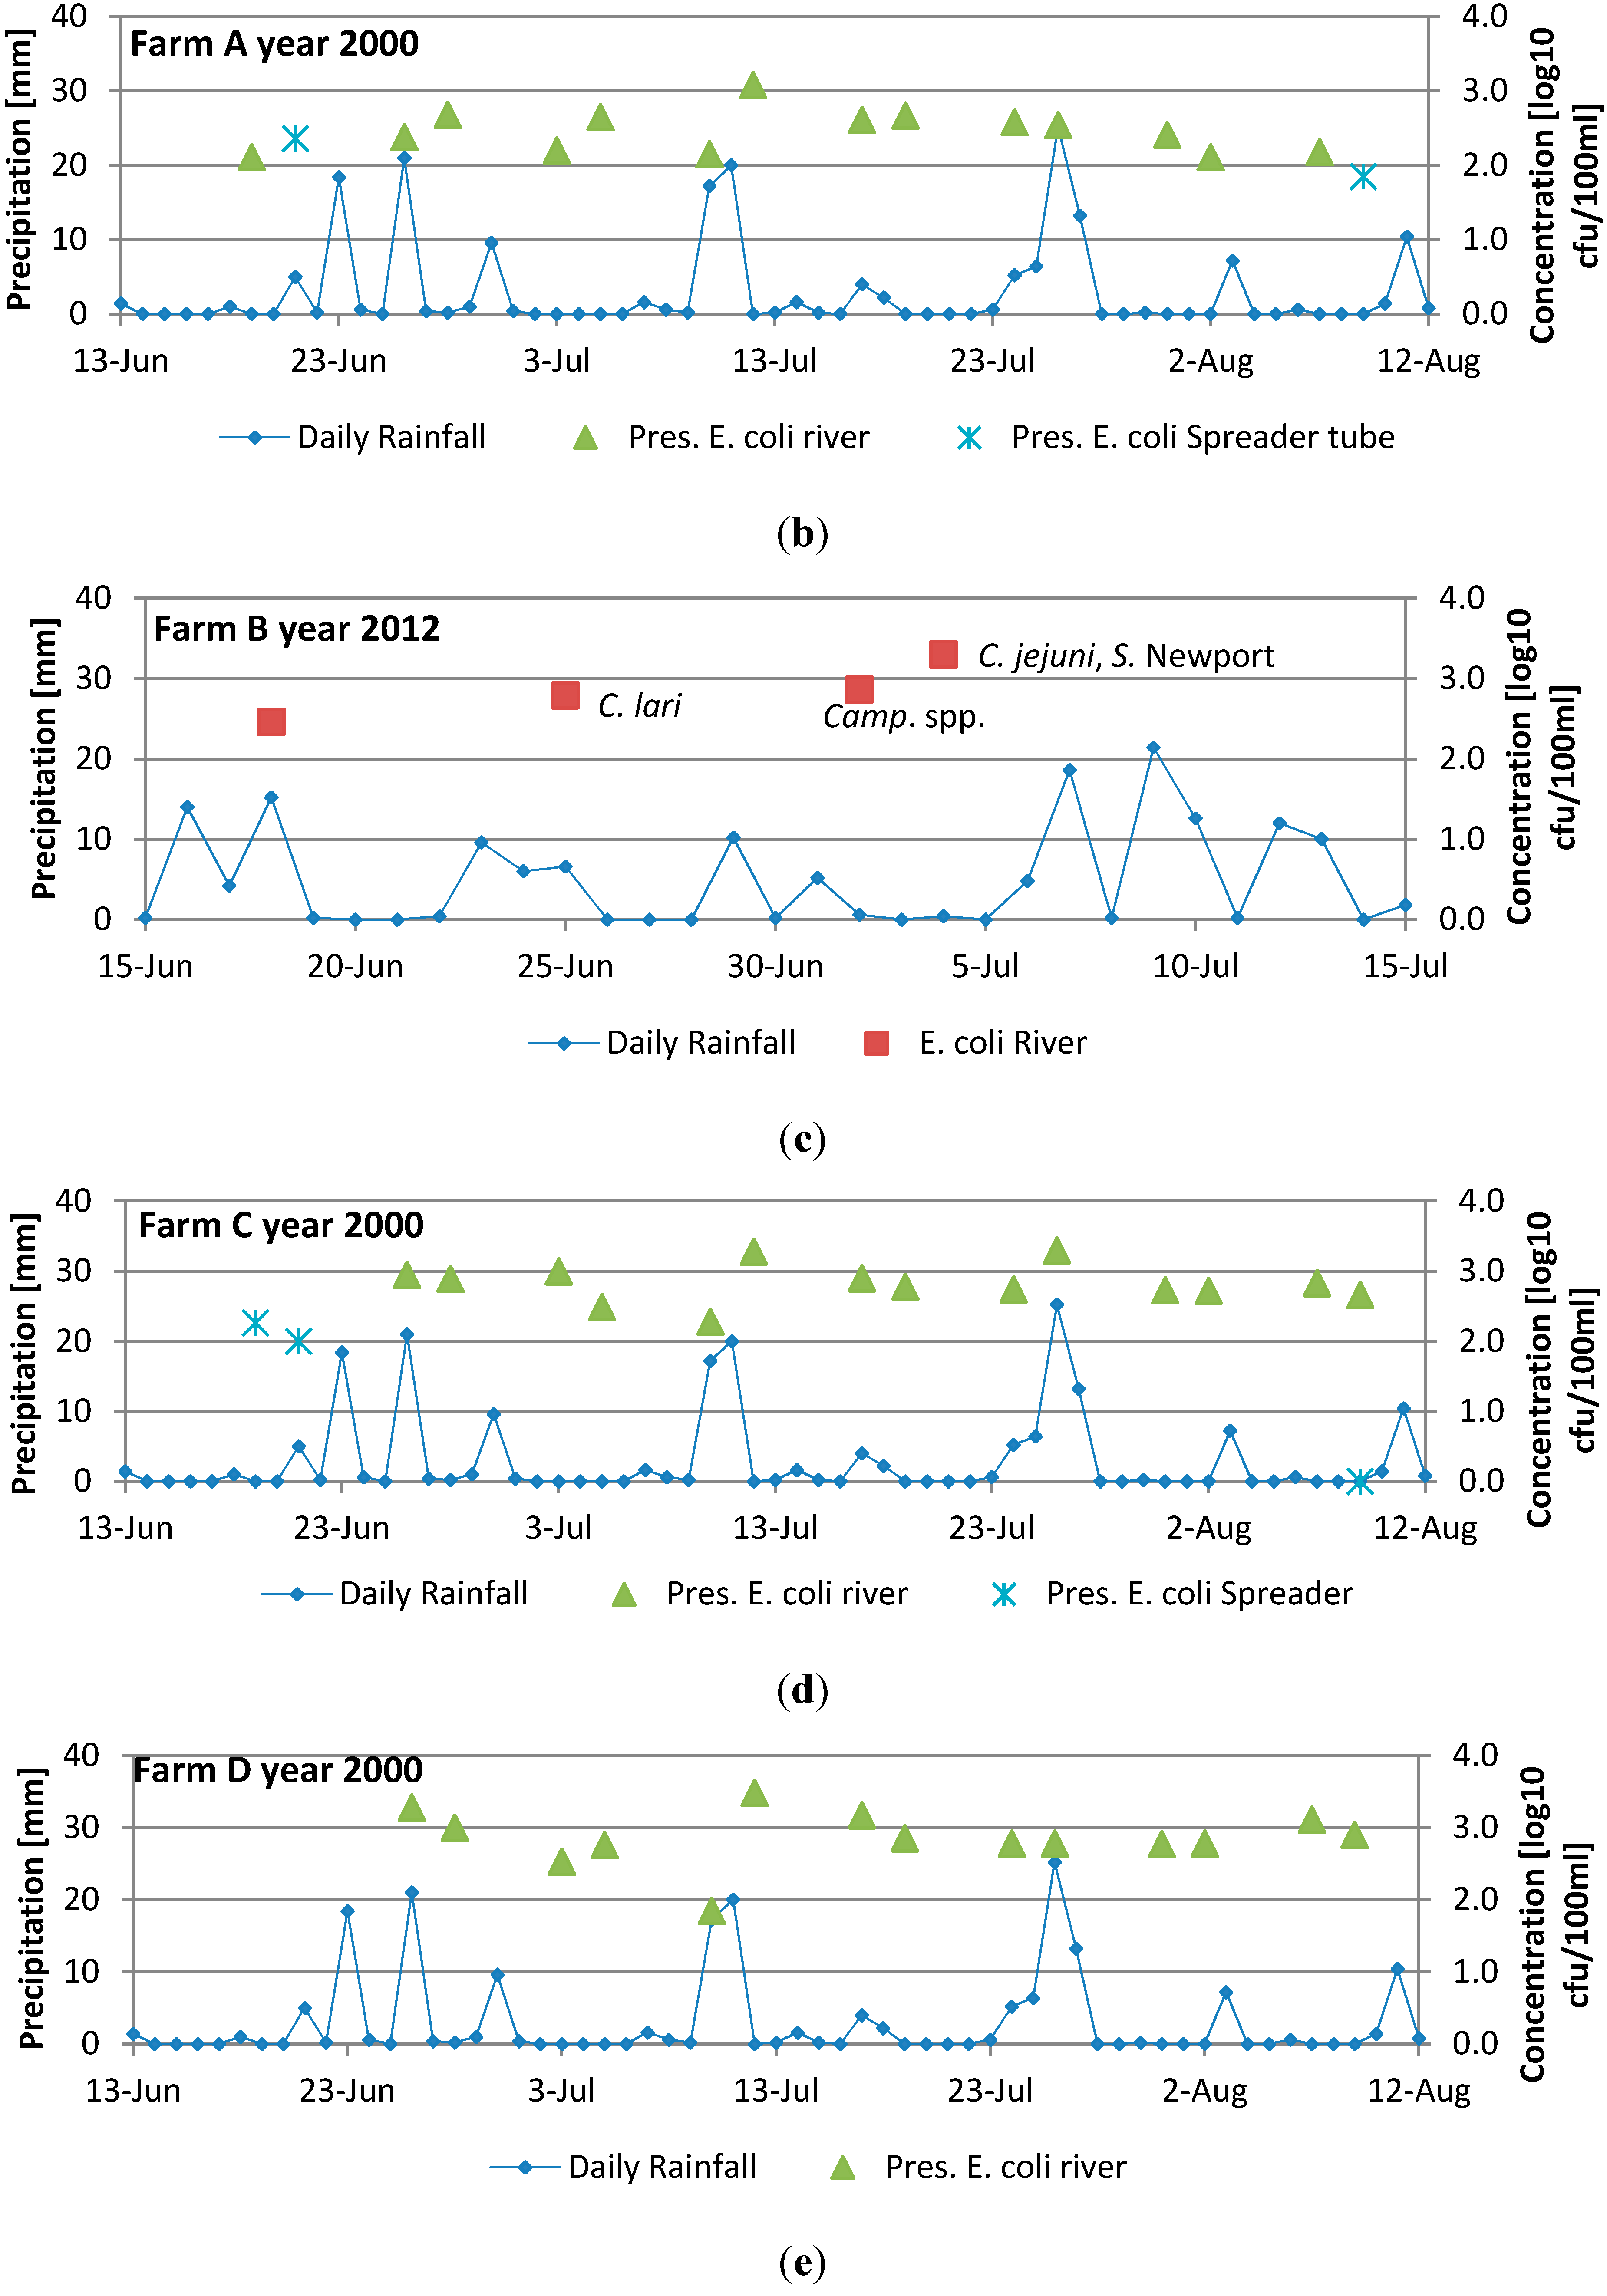
| Farm A | 19 06–09 08 2000 | x | ND ** | ND | X why different? | 16 |
| 29 05–28 08 2006 | ND | x | x | X | 19 | |
| Farm B | 18 06–04 07 2012 | ND | x | x | X | 4 |
| Farm C | 19 06–09 08 2000 | x | ND | ND | X | 17 |
| Farm D | 19 06–09 08 2000 | x | ND | ND | X | 16 |
| 21 05–24 09 2012 | ND | x | x | X | 7 | |
2.3. Bacteriological Methods
2.4. Population, Land Use, and Meteorological Data
2.5. Statistical Analysis
3. Results
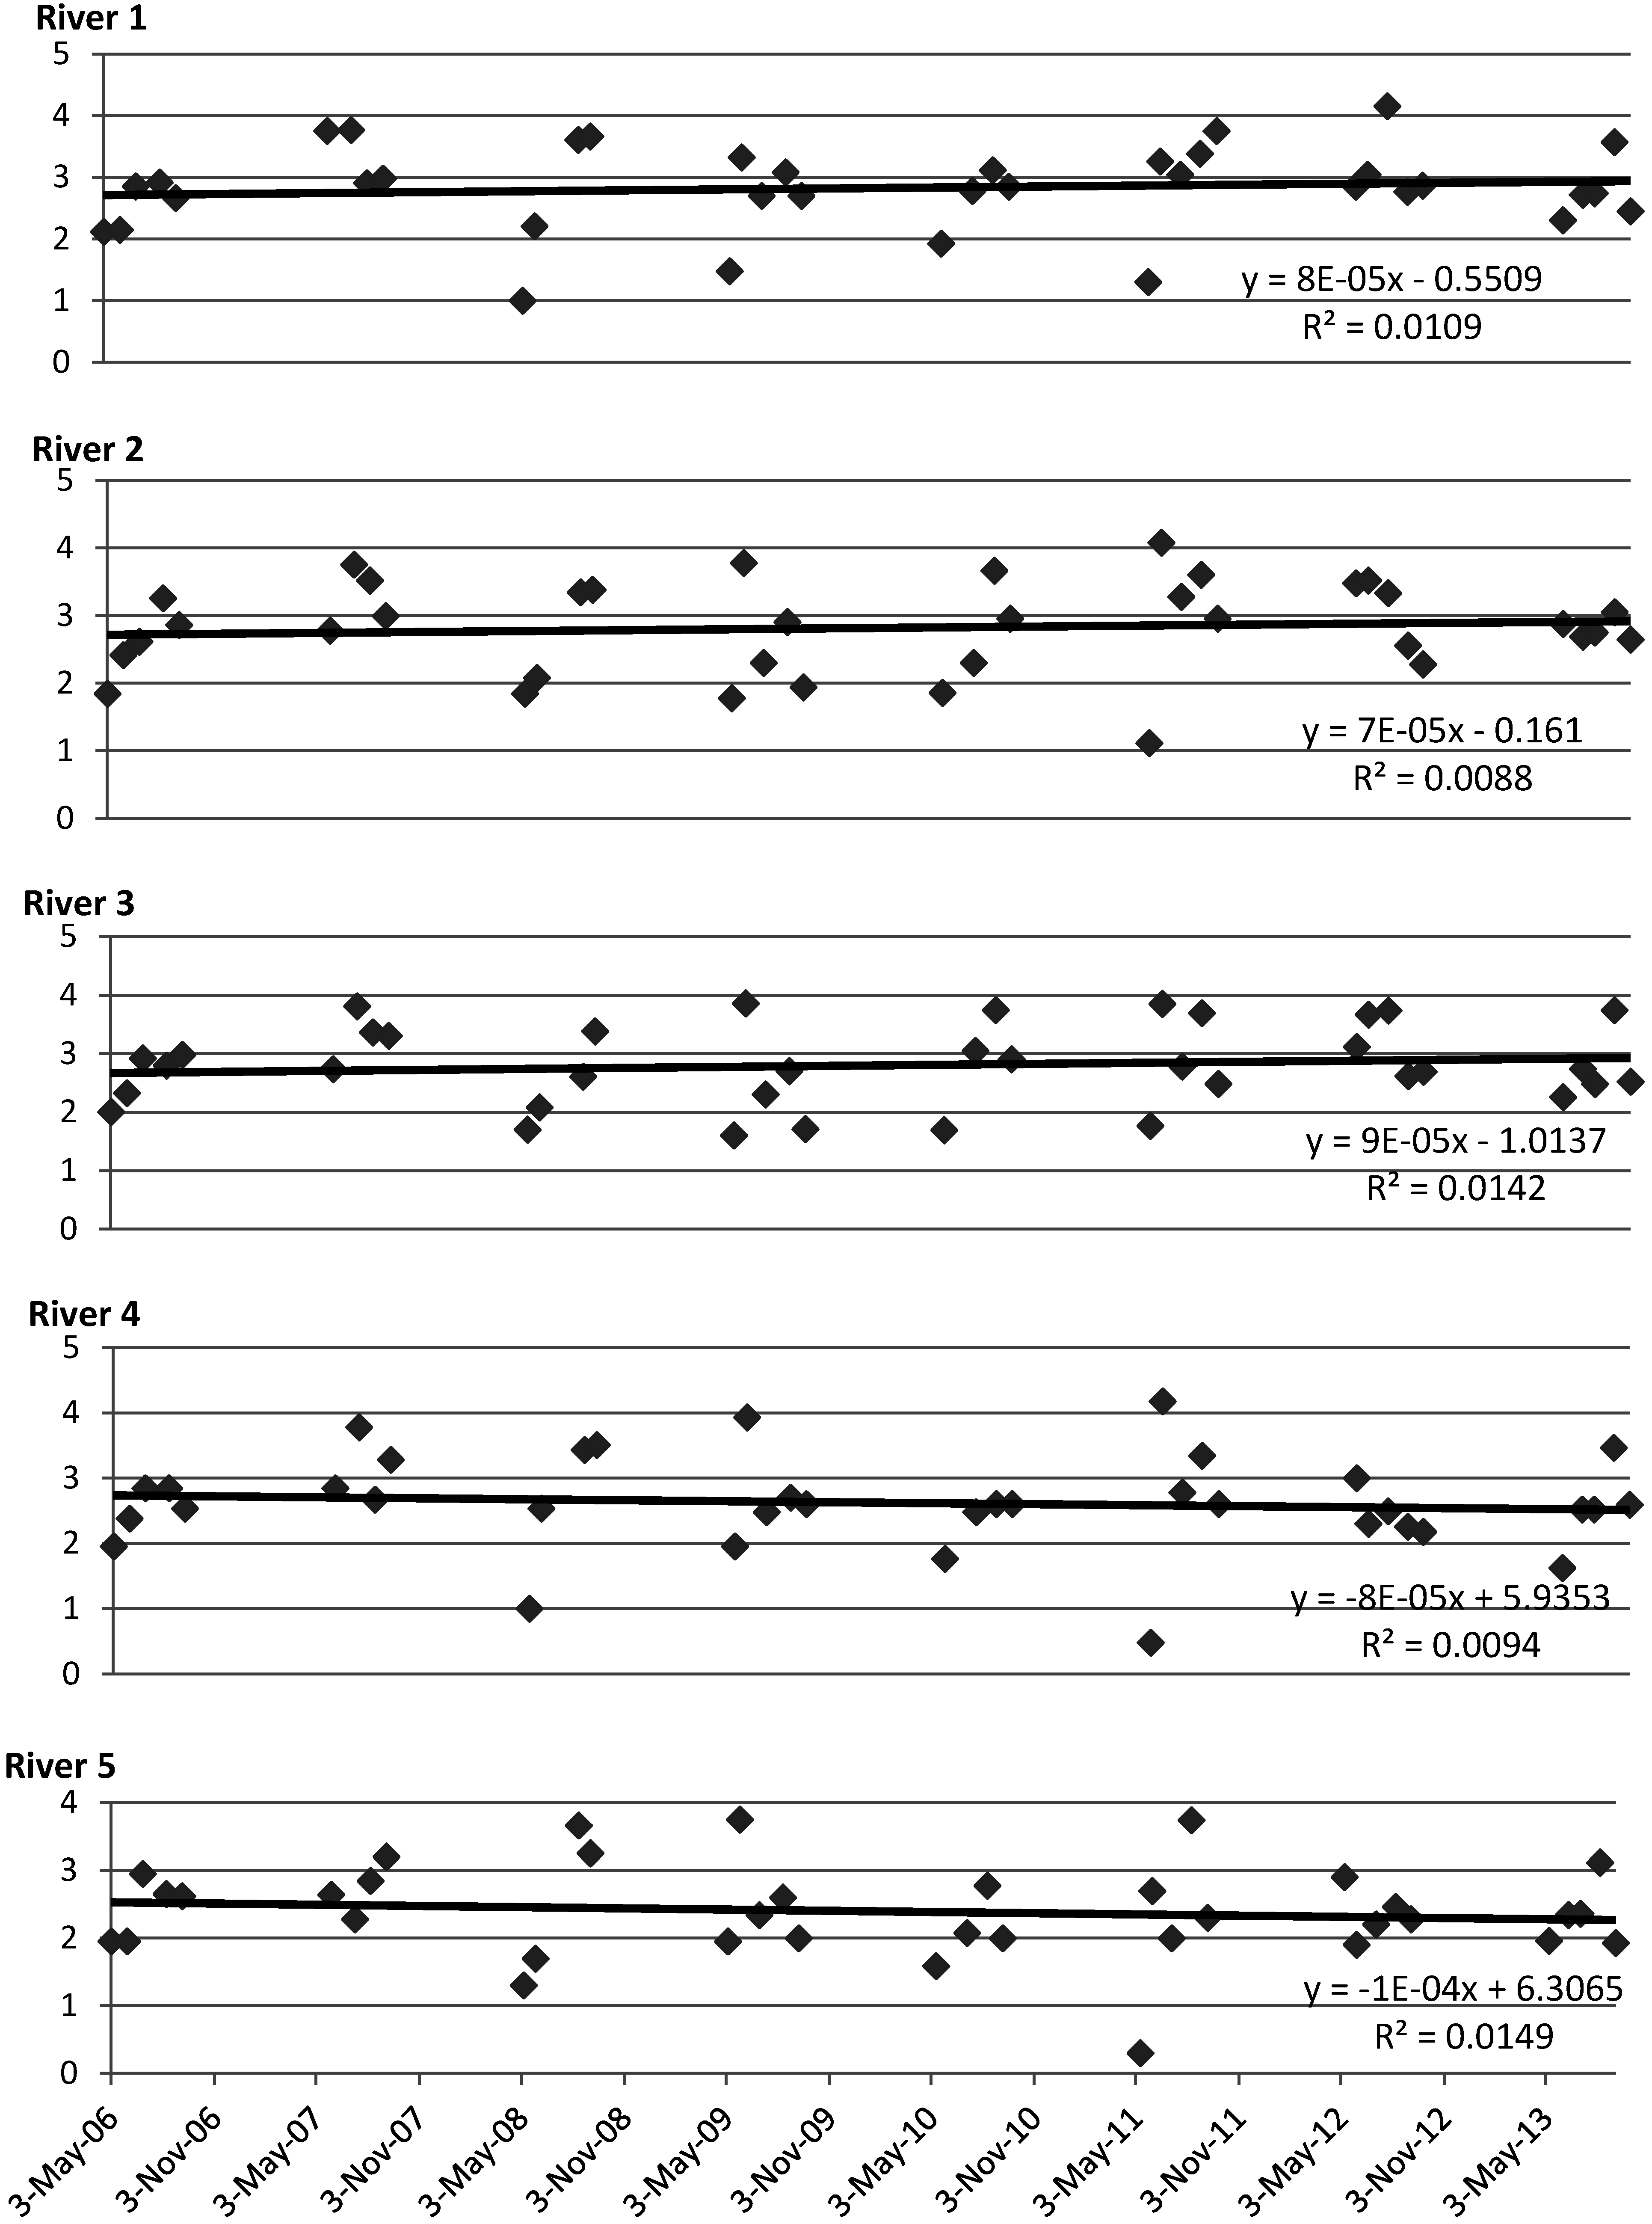
3.1. Water Quality Trends in Lier River

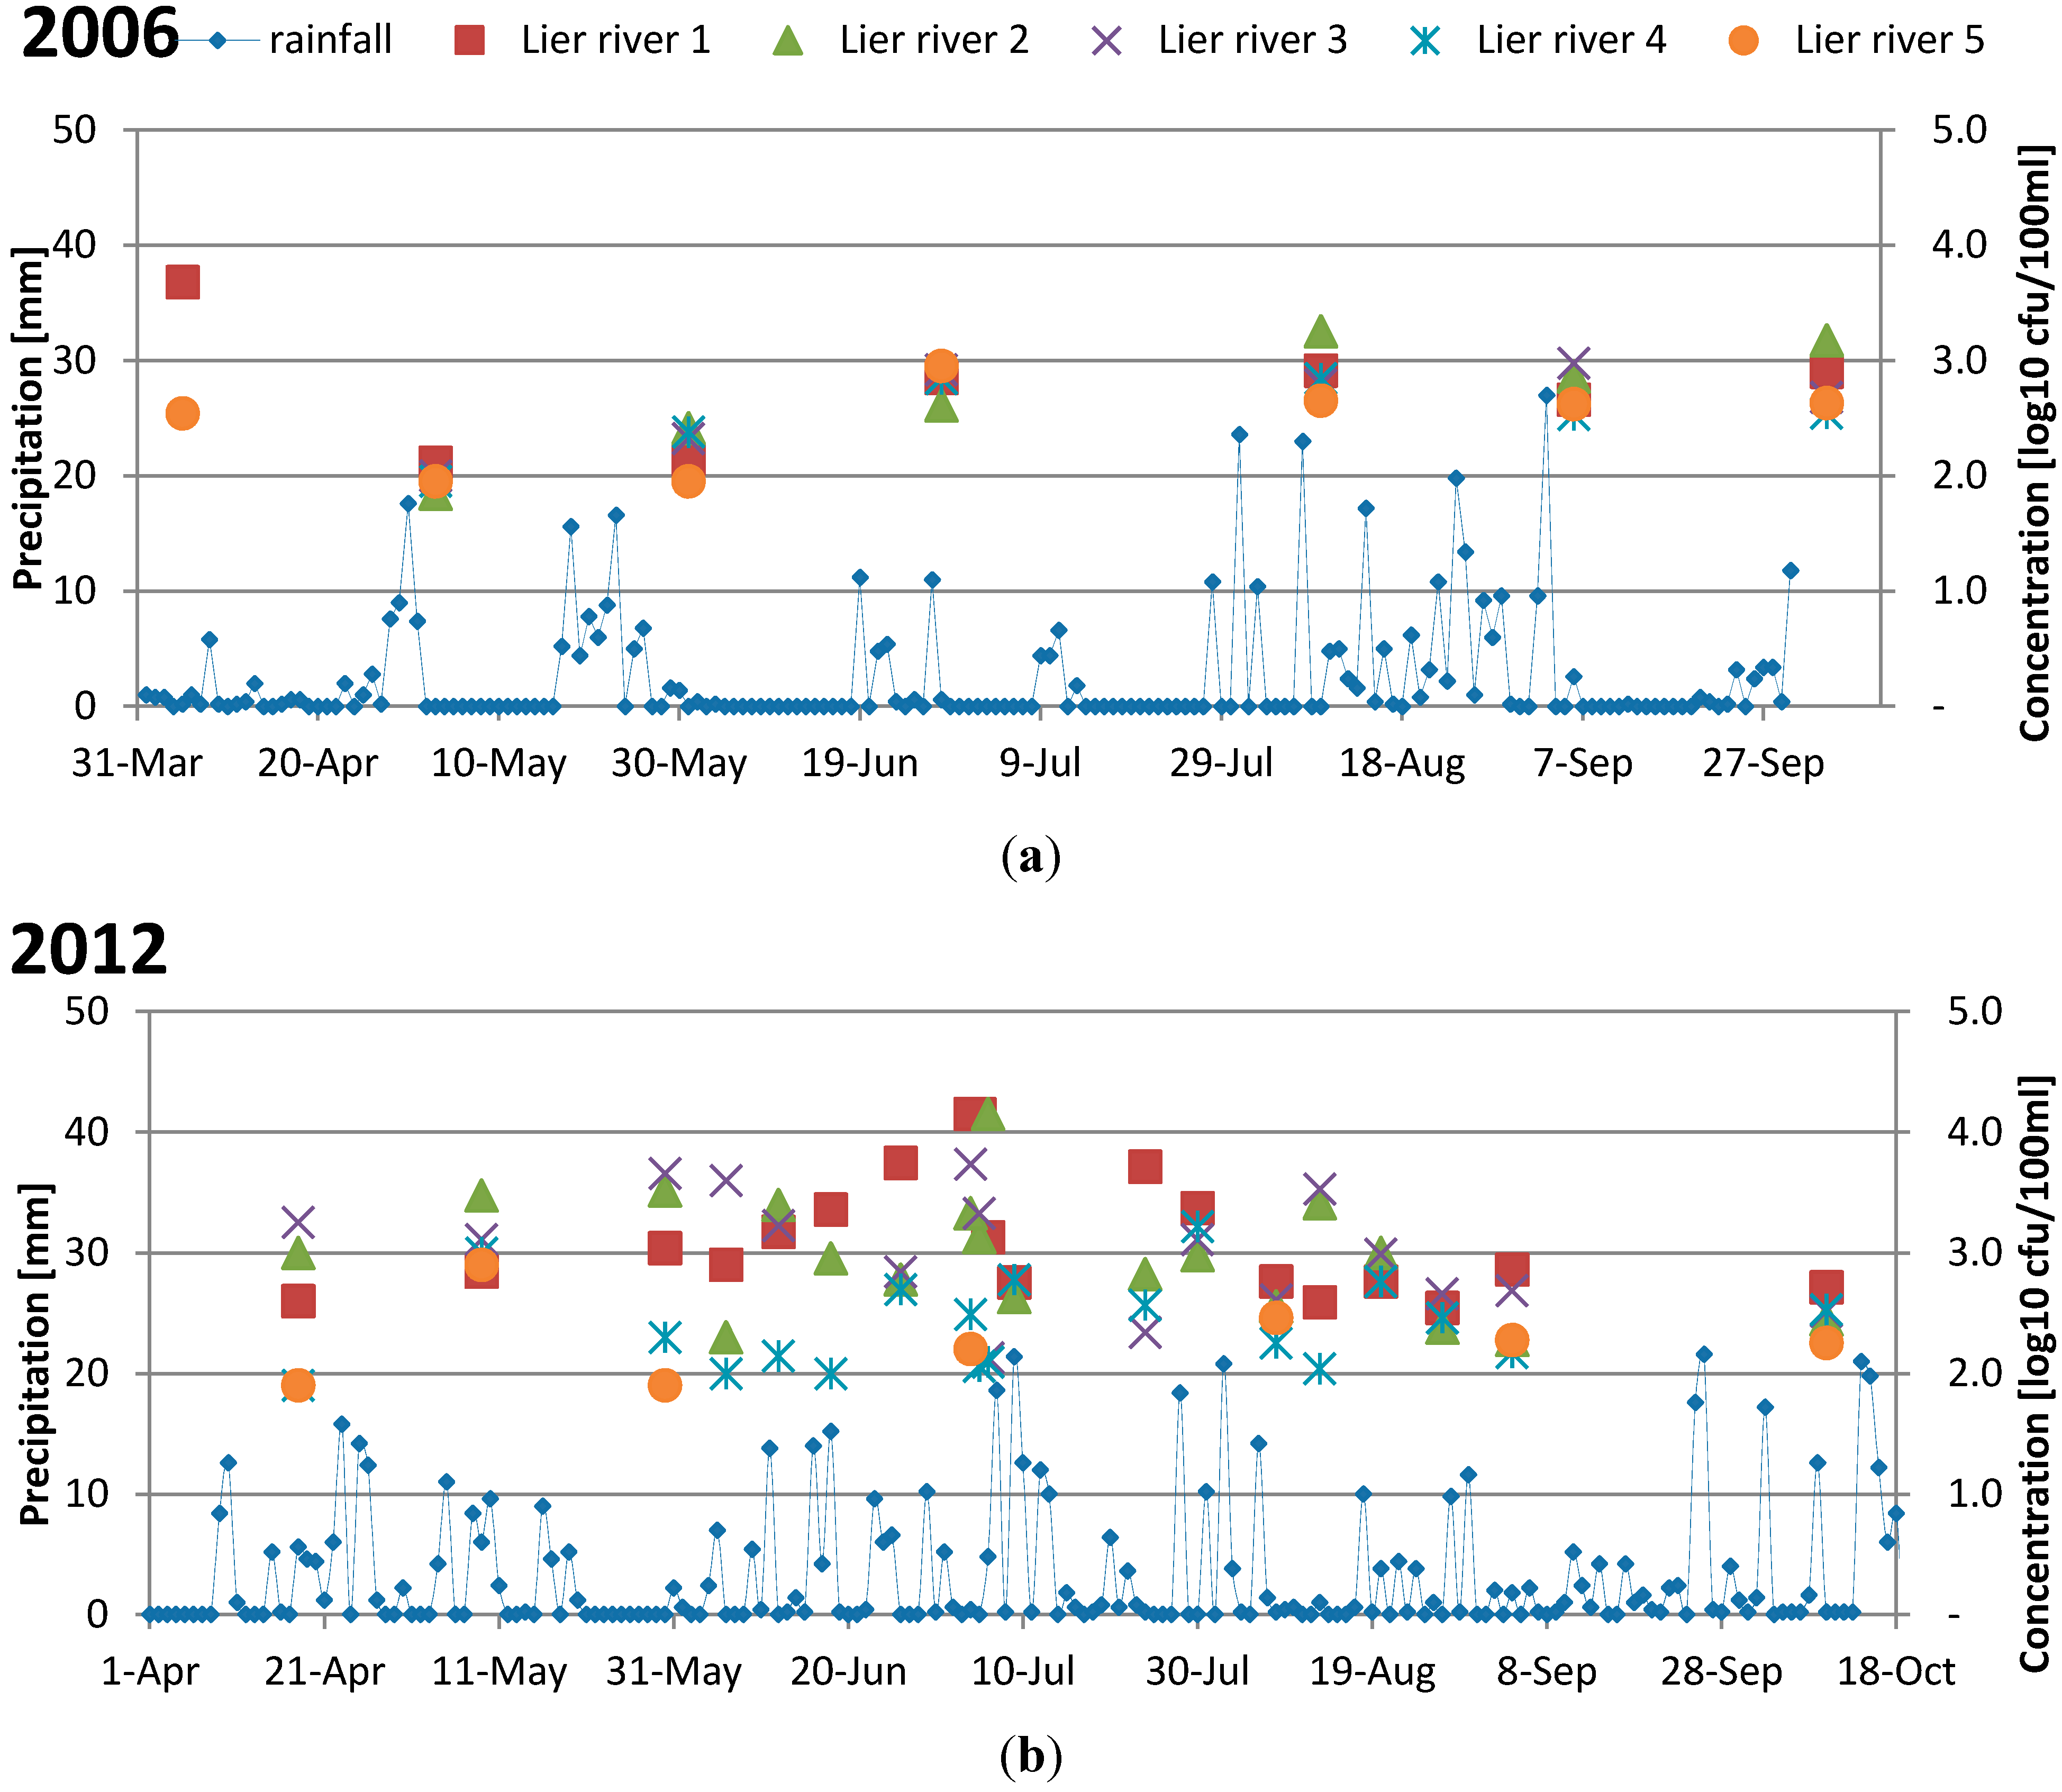
| Samples | Average | Variance | a | b | R2 | R | t obs | Significant t = ±1.69 |
|---|---|---|---|---|---|---|---|---|
| River 1 | 2.83 | 1.0–4.2 | 8 × 10⁻⁵ | −0.55 | 0.0109 | 0.10 | 0.58 | no |
| River 2 | 2.82 | 1.1–4.1 | 7 × 10⁻⁵ | −0.16 | 0.0088 | 0.09 | 1.96 | yes |
| River 3 | 2.80 | 1.6–3.9 | 9 × 10⁻⁵ | −1.01 | 0.0142 | 0.12 | 1.55 | no |
| River 4 | 2.62 | 0.5–4.2 | −8 × 10⁻⁵ | 5.94 | 0.0094 | 0.10 | −1.80 | yes |
| River 5 | 2.40 | 0.3–3.7 | −1 × 10⁻⁴ | 6.31 | 0.0149 | 0.12 | −1.35 | no |
| Samples | Average | Variance | a | b | R2 | R | t obs | Significant t = ±1.734 |
|---|---|---|---|---|---|---|---|---|
| River 1 | 2.5 | 1.0–4.2 | 3 × 10⁻³ | −8.39 | 0.101 | 0.317 | 0.094 | No |
| River 2 | 2.47 | 1.1–3.5 | 1 × 10⁻⁴ | 2.25 | 0.022 | 0.148 | 11.160 | Yes |
| River 3 | 2.54 | 1.6–3.7 | 2 × 10⁻⁴ | −4.58 | 0.047 | 0.217 | 1.616 | No |
| River 4 | 2.26 | 0.5–3.3 | −5 × 10⁻⁵ | 4.19 | 0.004 | 0.065 | −3.537 | Yes |
| River 5 | 2.03 | 0.3–3.2 | −2 × 10⁻⁴ | 8.11 | 0.046 | 0.213 | −2.940 | Yes |
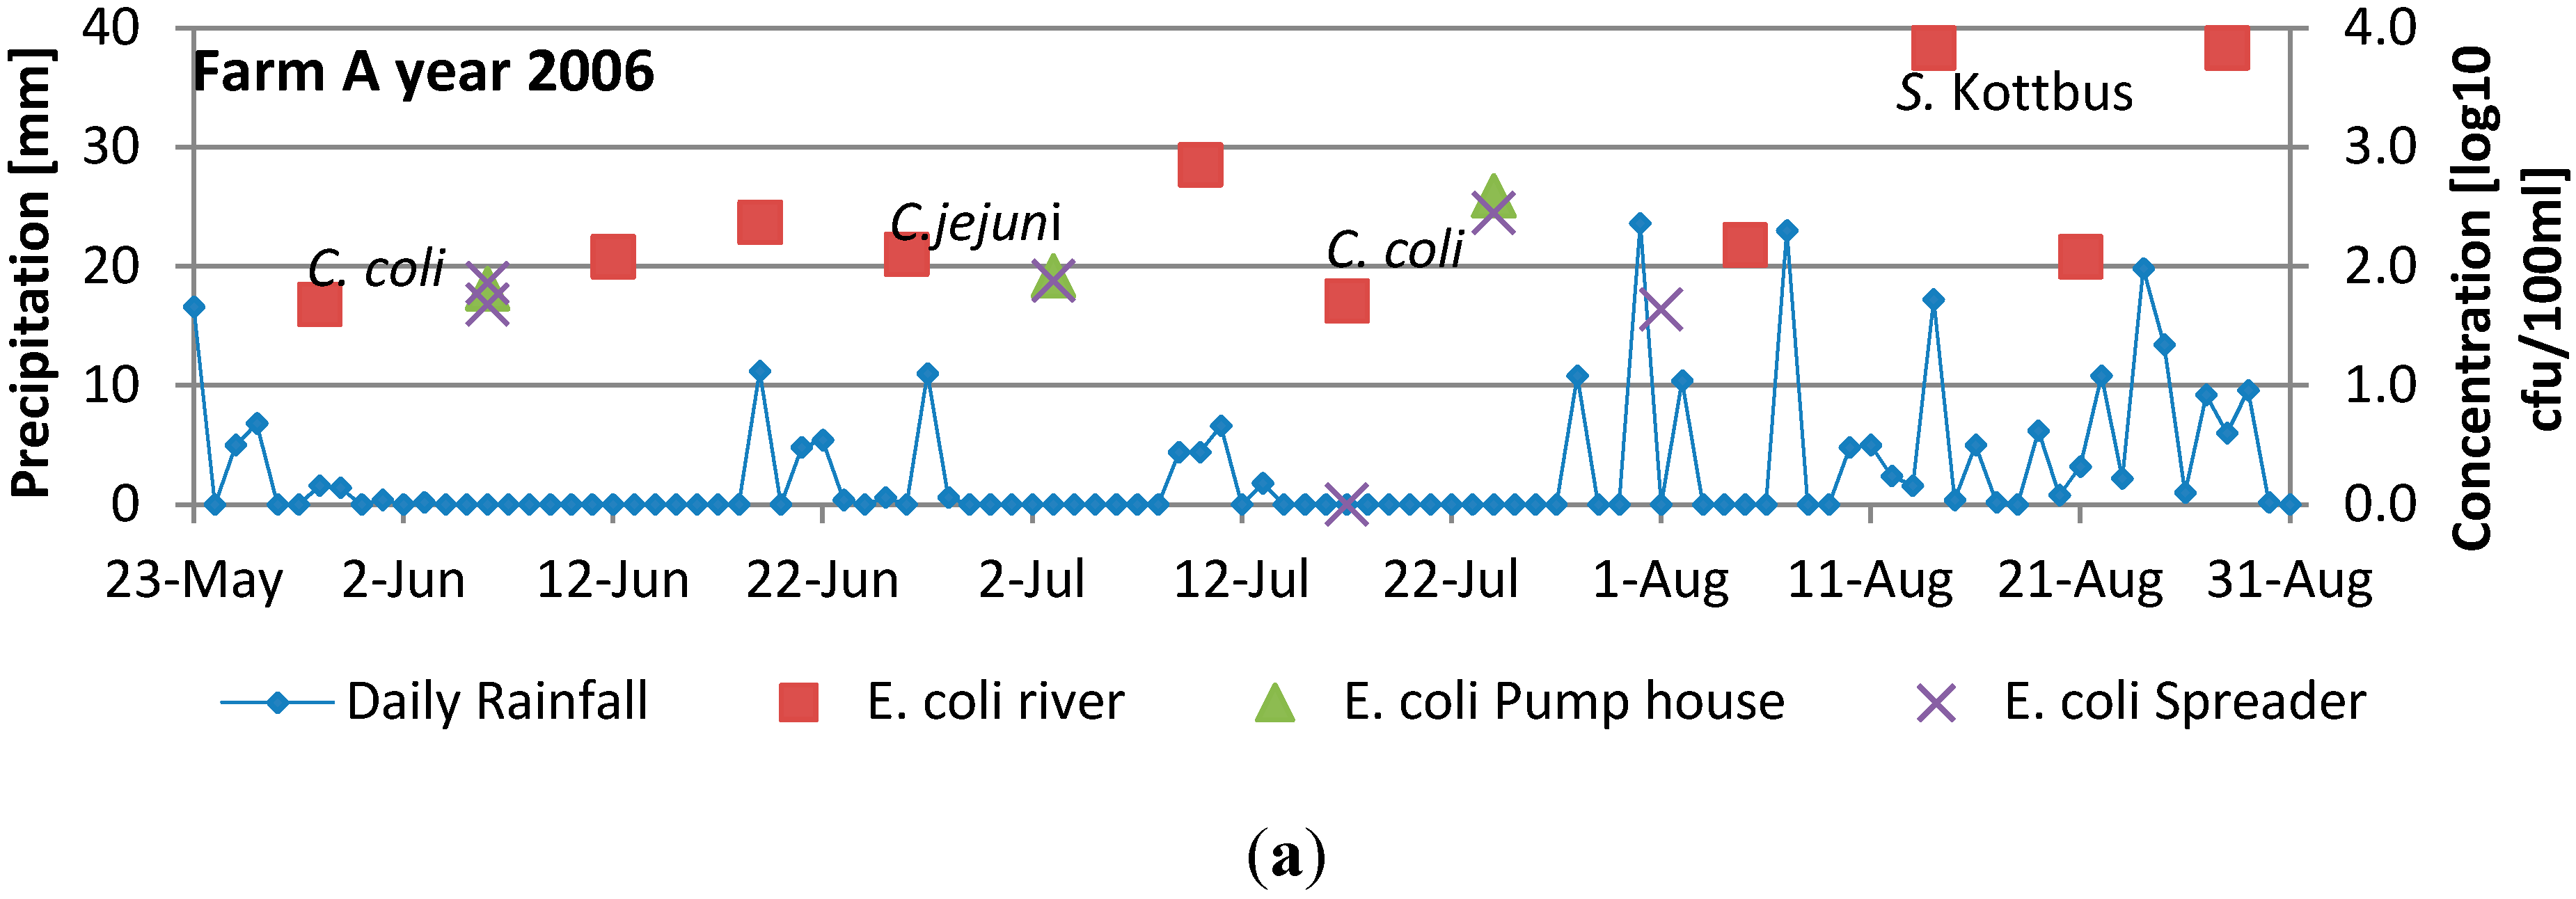
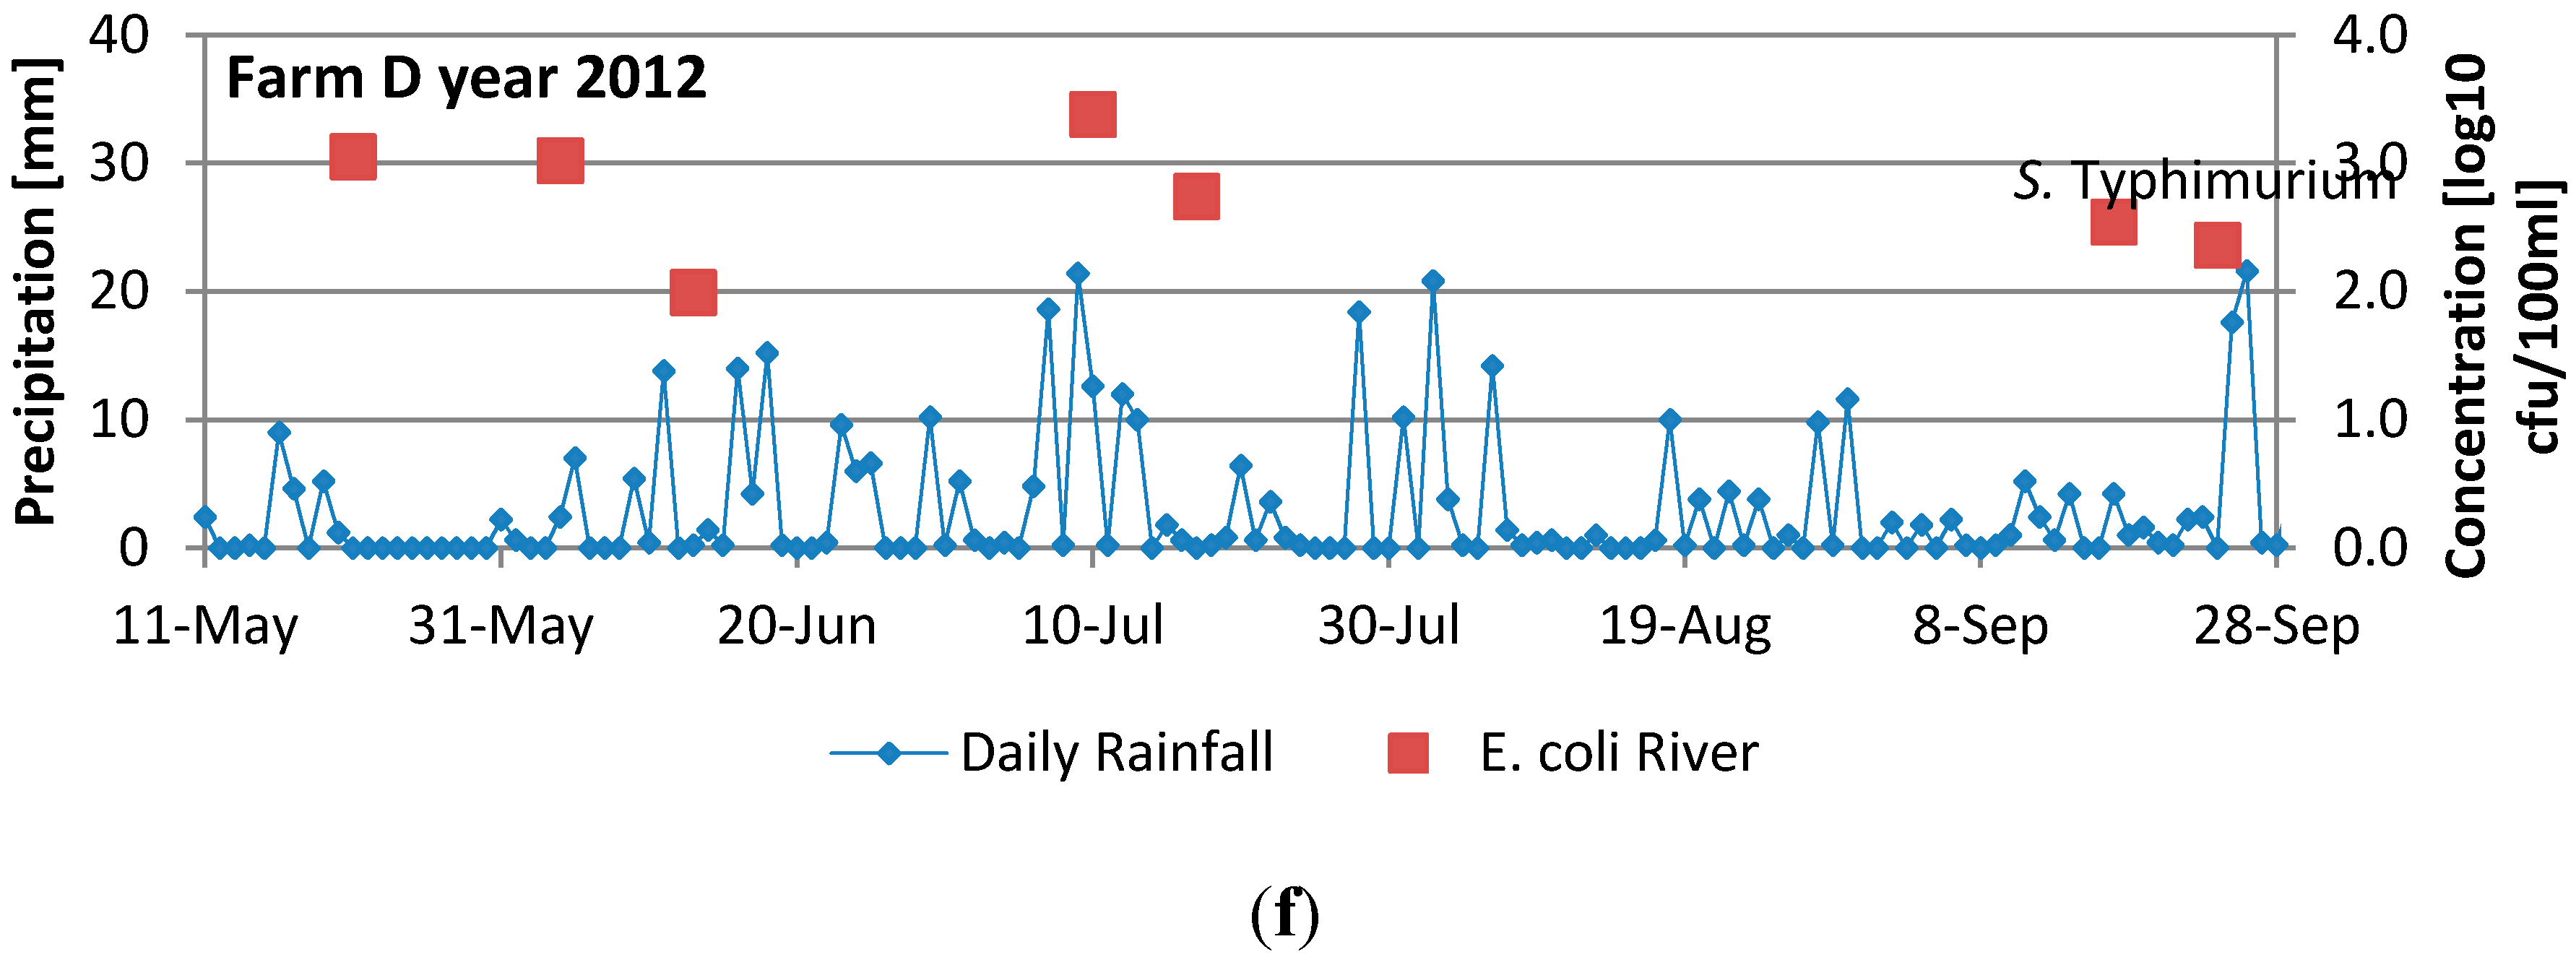
3.2. Results from Analysis of Irrigation Water


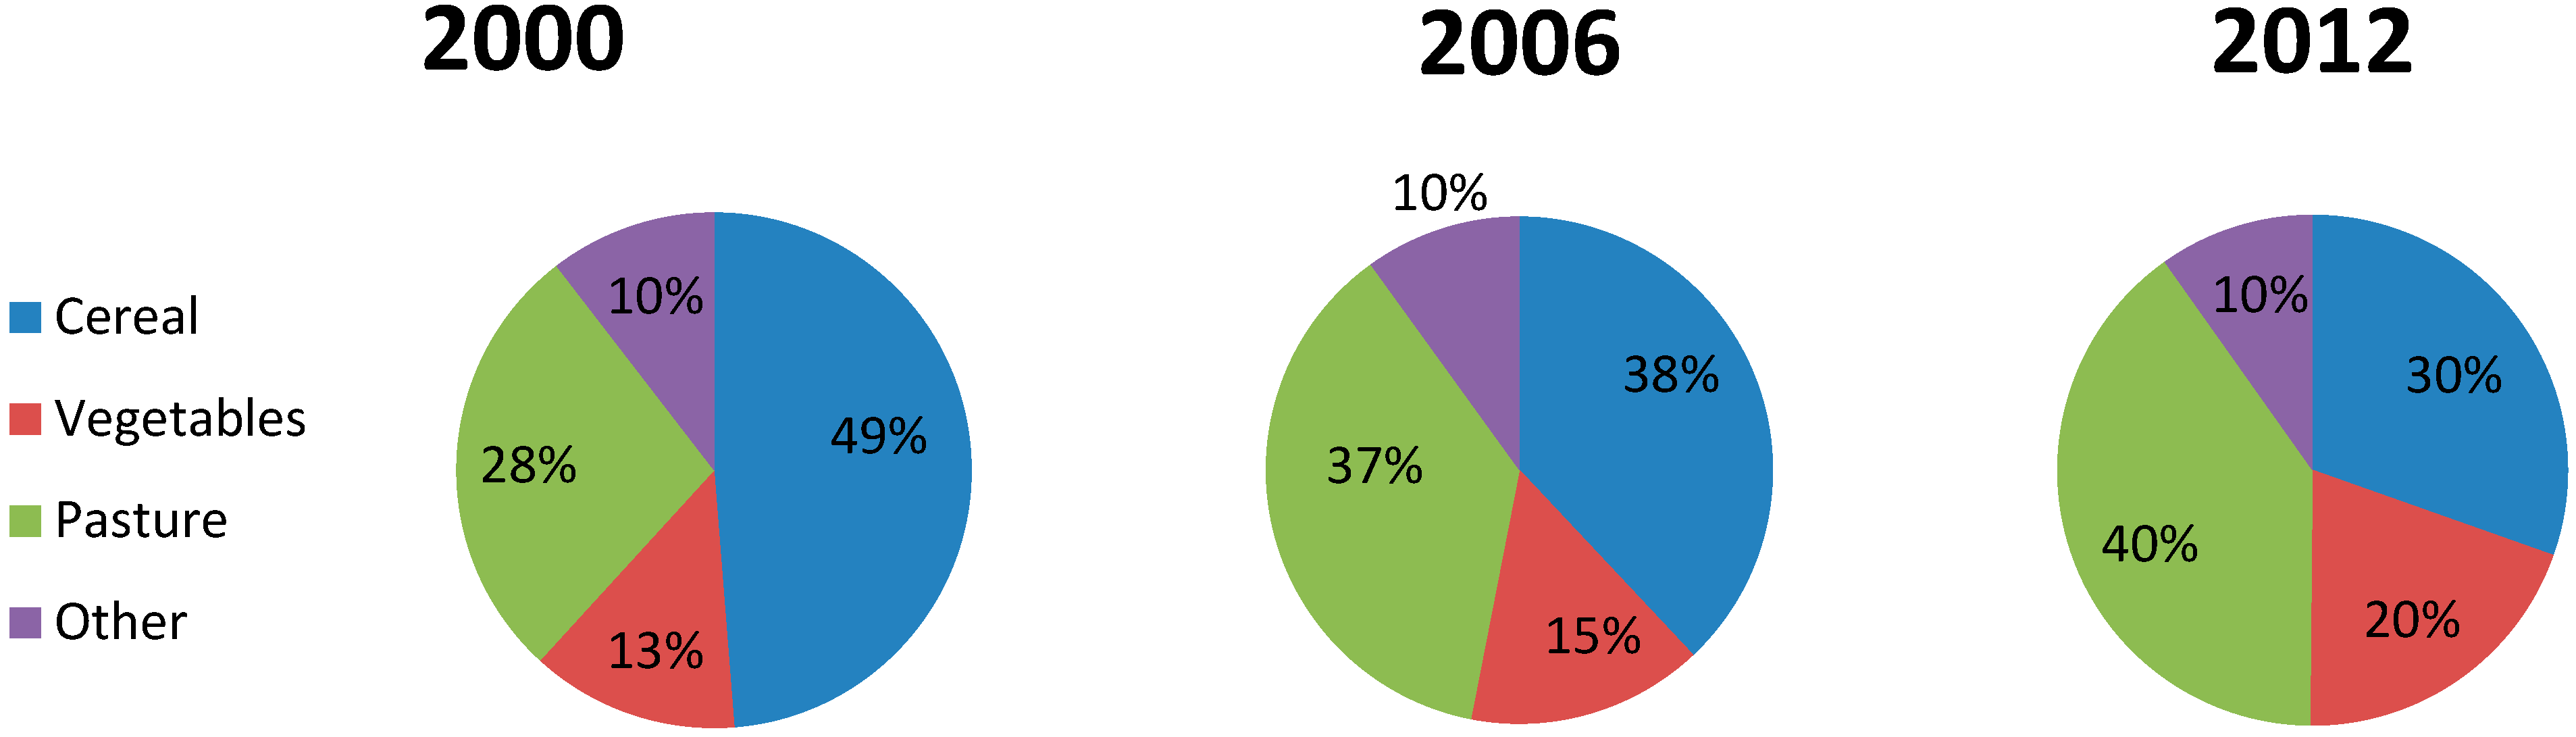
3.3. Trends in Land Use
3.3.1. Pollution Source: Farm Animals—Grazing Lands
| 2000 | 2006 | 2012 | |
|---|---|---|---|
| Population Lier municipality | 21,308 | 22,700 | 24,177 |
| Urban areas | 16,395 | 17,295 | 19,190 |
| Number of farms | 273 | 198 | 164 |
| Number of farms with vegetable production | 58 | 48 | 31 |
| Number of farms with animals | 98 | 78 | 71 |
| Cattle (total)(winter) | 2006 | 2126 | 1841 |
| Cattle dairy production | 460 | 412 | 310 |
| Sheep (Winter) | 2147 | 2722 | 3055 |
| Chickens | 7367 | 5728 | 0 |
3.3.2. Pollution Source: Municipal
3.4. Measures Taken to Improve Water Quality in the River
| Situation | Risk-assessment | Identified Measure * | Benefits/Feasibility | Costs |
|---|---|---|---|---|
| WWTP 2 biochemical treatment: Sewage from 560 IE. | Sludge brought to WWTP 1 for hygienic treatment. Low risk | Plans have been adopted for adding a dewatering component to the treatment plant. | High benefits of having a WWTP in the municipality. | High costs for Lier Municipality |
| WWTP 3 sludge separator: Sewage from 100 IE. | High risk of effluents with bacteria through discharge of waste water | A new WWTP 3 is planned, treatment steps will include biochemical treatment. | High benefits of having a modern effective treatment plant. | High cost for Lier Municipality. |
| Pipes from private houses are the owners’ responsibility | Risk of leakage, level of discharge depends on location of leakage. | Frequent monitoring. Replace all old pipes and pipes with poor quality. | Will contribute to the reduction of E. coli. | Costs will be on private owners. Costs relatively high. |
| Leakage from pumping stations | Reduced risk due to the alarm systems to signal leakage. | Alarm systems have been installed, and pump stations have been modernized. Shorter action time can be implemented (presently 8 h). | Will contribute to the reduction of E. coli. | Relatively high costs |
| Leakage from old/poor quality pipes. Combined sewage overflow (CSO) | Presently reduced risk as most old pipes have been replaced. Increased risk with rain and heavy rain. | Replacement of old municipal pipes. All CSO should be replaced with a separate system by 2015 according to the municipality plan. | A modern sewerage system reduces E coli. | High cost for the municipality. More than 5 M US $ annually |
| Private Sewage system: Discharge of waste water from 700 sludge separators (SS) mechanical treatment. Septic tanks are emptied by the municipality. | Discharge of E. coli depends on conditions for infiltration in the ground/soil. Ground/soil conditions in Lier are generally not suited; Risk of leakage from septic tanks; Risk depends on distance from SS to stream/river. | All sludge separators and ground conditions are mapped. A certified company for emptying septic tanks. Unnoticed controls. A fine if rules broken. | Measures will reduce bacteria levels, but discharge can still be high. | Costs are taken by the municipality, works tasks are regulated by the Pollution Act. |
| Emptying septic tanks more frequently. | Important benefits if tanks leak. | Costs are on private households, experienced costs vary. | ||
| Add treatment steps to SS, organic, chemical and or hygienic treatment. | All treatment steps highly beneficial. Supervision of several systems needed | Intermediate direct cost level, but high costs on monitoring of the different systems. | ||
| Replace old SS with on-site biochemical and hygienic treatment plants | Assuming good supervision, this action will greatly reduce E. coli levels. | Experienced costs vary among households, costs about $16,500 per plant | ||
| Connect the private sewage systems to centralized sewage system. | Removal of local discharge of E. coli to streams. | Relatively high private direct costs. Municipality cost of installing pipes. | ||
| On-site biological WWTP (removes 60% E. coli) (2 in the basin); | 2/3 of the private treatment plants were established before the Pollution Control regulation, these have unacceptable discharge to rivers and streams; | Requirements for operating supervision of treatment plants. According to the municipal documents: Those with unacceptable treatment will have to either: 1. Add an extra cleansing step, or 2. Replace the plant with a new treatment plant, or 3. connect to centralized system. Building permits for new houses requires that sewage is connected to centralized sewage, or satisfactorily treatment of on-site sewage | Private treatment plants which includes all treatment steps, with an authorized supervision has acceptable treatment. | Treatment plants with several different add-on-systems will require several different supervising agreements which can be costly. |
| On-site chemical WWTP (removes 99% E. coli) (5 in the basin); On-site biochemical WWTP (99% E. coli) 51 in basin); | Risk of high effluents to the river dependent on distance to stream/river; | |||
| On-site with hygienic treatment WWTP (20 in the basin) | Risk dependent on supervision and management of private plants. | |||
| Animals grazing, trampling and depositing feces nearby, or in the stream/river. | Significant risks where animals can go down to river/stream to drink and deposit faeces; Increased risk during rainfall; Risk level reduced with long distance to river and to area for water abstraction; Risk level dependent on the ratio, animals and river water flow. | Fencing stretch of river | Potentially a significant benefit for reducing fecal bacteria levels [38]. | Costs of setting up the fence, and of providing alternative drinking source for livestock. Relatively high costs. |
| Provide drinking water for animals away from the stream | If placed in the right place, this will reduce deposits of faeces along streams. | Costs refer to that of providing an alternative water source sufficiently away from the river. Mainly onetime cost, comparatively low. | ||
| Place salt stone away from stream and river | Some impact. | Low | ||
| Provide fodder away from stream and river | Low | |||
| Horse riding along streams. Around 100 horses in Lier | Horse excreta contribute to E. coli in the river. | Facilitate for horse tracks away from stream and rivers. | Will reduce the contribution of E. coli to the river. | Cost is comparatively low |
| Run off from barns and stables | Risk depends on distance to stream/river. | Sufficient and closed storage | High | Capital cost to ensuring satisfactorily storage |
| Runoff from fertilized fields to stream/river; Emptying fertilizer containers | Risk depends on distance to streams/river, and practices of applying manure. | Vegetated buffer strips, Pond systems; Applying manure in dry weather, and avoid irrigation periods | Relatively high benefits [39]. | The main cost refers to the “loss” of land area for reforestation. |
4. Discussion
4.1. Water Results
4.2. Measures Identified to Improve the Water Quality
4.2.1. The Wastewater Sector
4.2.2. Agriculture Sector
5. Conclusions
Acknowledgments
Author Contributions
Conflicts of Interest
References
- Kistemann, T.; Claβen, T.; Koch, C.; Dagendorf, F.; Fischeder, R.; Gebel, J.; Vacata, V.; Exner, M. Microbial load of drinking water reservoir tributaries during extreme rainfall and runoff. Appl. Environ. Microbiol. 2002, 68, 2188–2197. [Google Scholar] [CrossRef] [PubMed]
- Tryland, I.; Robertson, L.; Blankenberg, A.G.B.; Lindholm, M.; Rohrlack, T.; Liltved, H. Impact of rainfall on microbial contamination of surface water. Int. J. Clim. Change Strat. Manag. 2011, 5, 361–373. [Google Scholar]
- Hoxie, N.J.; Davis, J.P.; Vergeront, J.M.; Nashold, R.D.; Blair, K.A. Cryptosporidiosis-associated mortality following a massive waterborne outbreak in Milwaukee, Wisconsin. Am. J. Public Health 1997, 87, 2032–2035. [Google Scholar] [CrossRef] [PubMed]
- Waterborne outbreak of gastroenteritis associated with a contaminated municipal water supply, Walkerton, Ontario, May–June 2000. Can. Commun. Dis. Rep. 2000, 26, 170–173.
- Steele, M.; Odumero, J. Irrigation water as source of foodborne pathogens on fruit and vegetables. J. Food Prot. 2004, 67, 2839–2849. [Google Scholar] [PubMed]
- Center for Produce Safety. Agricultural Water. Center for Produce Safety Five Year Research Review. Version 1.1; Available online: http://www.pma.com/~/media/pma-files/food-safety/cps/cps-research-reportag-water-200813version-11final.pdf (accessed on 10 February 2015).
- Söderström, A.; Osterberg, P.; Lindqvist, A.; Jönsson, B.; Lindberg, A.; Blide Ulander, S.; Welinder-Olsson, C.; Löfdahl, S.; Kaijser, B.; de Jong, B.; et al. A large Escherichia coli O157 outbreak in Sweden associated with locally produce lettuce. Foodborne Pathog. Dis. 2008, 5, 339–349. [Google Scholar] [CrossRef] [PubMed]
- KSL. Quality Assurance in Agriculture. Available online: www.matmerk.no/ksl (accessed on 21 April 2015). (In Norwegian)
- EEC. EEC Council Directive 2000/60/EC of 23 October 2000 Establishing a Framework for Community Action in the Field of Water Policy; EEC (European Economic Community): Brussels, Belgium, 2000. [Google Scholar]
- EEC. Council Directive 91/271/EEC of 21 May 1991 Concerning Urban Waste Water Treatment, Amended by Commission Directive 98/15/EC of 27.02.1998, OJ L 67 of 07.03; EEC (European Economic Community): Brussels, Belgium, 1998. [Google Scholar]
- EEC. Council Directive 91/676/EEC of 12 December 1991 Concerning the Protection of Waters Against Pollution Caused by Nitrates from Agricultural Sources; EEC (European Economic Community): Brussels, Belgium, 1998. [Google Scholar]
- EEC. Council Directive 76/160/EEC of 8 December 1975 Concerning the Quality of Bathing Water, Amended by Council Directive 91/692/EEC (Further Amended by Council Regulation 1882/2003/EC), and Council Regulation 807/2003/EC; EEC (European Economic Community): Brussels, Belgium, 2006. [Google Scholar]
- Pollution Control Act. Act 1981-03-13 No. 6 (Last Revised 2014-08-29 No. 62). 1981. Available online: https://www.regjeringen.no/en/dokumenter/pollution-control-act/id171893/(accessed on 30 March 2015). (In Norwegian)
- Pollution Control Regulations. Regulation 2004-06-01 No. 931. 2004. Available online: https://www.regjeringen.no/en/dokumenter/pollution-regulations/id512074/(accessed on 30 March 2015). (In Norwegian)
- Water Resources Act. Act 2000-11-24 Nr. 82. 2000. Available online: http://www.regjeringen.no/nb/dok/lover_regler/lover/vannressursloven.html?id=506923(accessed on 30 March 2015). (In Norwegian)
- Planning and Building Act. Act of 27 June 2008 No. 71 Relating to Planning and the Processing of Building Applications. 2008. Available online: https://www.regjeringen.no/en/dokumenter/planning-building-act/id570450/(accessed on 30 March 2015). (In Norwegian)
- Rules, Fertilizers—Quality, Storage and Use. 2003. Available online: http://www.regelhjelp.no/Emner-A---A-/Gjodsel---kvalitet-lagring-og-bruk/ (accessed on 30 March 2015). (In Norwegian)
- Regulation for the Use of Organic Manure. Regulation 2003-07-04 No. 951. 2003. Available online: https://lovdata.no/dokument/SF/forskrift/2003-07-04-951 (accessed on 30 March 2015). (In Norwegian)
- Regulations for Water and Sewage Fees, Lier Municipality, Regulation 2005-12-12 No.1807. 2005. Available online: https://lovdata.no/dokument/OV/forskrift/2005-12-12-1807 (accessed on 30 March 2015). (In Norwegian)
- Norwegian Meterological Institute. eKlima. Available online: http://sharki.oslo.dnmi.no/portal/page?_pageid=73,39035,73_39049&_dad=portal&_schema=PORTAL (accessed on 15 April 2015).
- Vest-Viken Water Area Authority. Chapter 13.13 Lier River Water Area. In Principal Questions of Water Management; Version 14; June 2012; Available online: http://www.vannportalen.no/lierelva (accessed on 30 October 2014). (In Norwegian)
- Lier Municipality. About Lier Municipality. Version 5; February 2015; Available online: http://www.lier.kommune.no/organisasjon/om-lier/#sthash.YYCm7byT.dpuf (accessed on 30 October 2014). (In Norwegian)
- Norwegian Water Resources and Energy Directorate. Hydrological Data Station 11.6.0.1001.1 Oppsal. Available online: http://www.nve.no/no/Vann-og-vassdrag/Data-databaser/Data-i-Hydra-II-databasen/ (accessed on 2 March 2015). (In Norwegian)
- Norwegian Environment Agency. Database on Water Environment. Available online: http://vannmiljo.miljodirektoratet.no/ (accessed on 13 February 2015). (In Norwegian)
- Standard Norway. Water Analysis—Thermotolerant Coliforme Bacteria and Presumptive E. coli. Membrane Filtration Method; Norwegian Standard 4792:1990; Standard Norway: Oslo, Norway, 1990. [Google Scholar]
- International Organization for Standardization. Water Quality—Enumeration of Escherichia coli and Coliform Bacteria—Part 2: Most Probable Number Method; ISO 9308–2:2012; International Organization for Standardization: Geneva, Switzerland, 2012. [Google Scholar]
- NMKL. Thermotolerant Campylobacter. Detection, Semi-quantitative and Quantitative Determination in Foods and Drinking Water, NMKL 119, 3rd ed.; NMKL (Nordic Committee on Food Analysis): Oslo, Norway, 2007. [Google Scholar]
- NMKL. Salmonella. Detection in Foods, NMKL 71, 5th ed.; NMKL (Nordic Committee on Food Analysis): Oslo, Norway, 1999. [Google Scholar]
- Statistics Norway. Tables 07459: Population, by Sex and One-Year Age Groups. 1 January (M), 04861: Area and Population of Urban Settlements (M), 08646: Holdings, Total, and Holdings with Various Crops (M), 06459: Holdings Keeping Domestic Animals of Various Kinds (M), 06447: Domestic Animals, by Kind (M), 06462: Agricultural Area, by Use (decare) (M). Available online: http://www.ssb.no/en (accessed on 13 February 2015).
- Norwegian Forest and Landscape Institute. Map AR50: Area Resources. Available online: http://kilden.skogoglandskap.no/map/kilden/index.jsp?theme=AR50 (accessed on 13 February 2015). (In Norwegian)
- Sweco. Lier Action Plan for Sewage. Revision; March 2010; Available online: http://www.lier.kommune.no/politikk-og-samfunnsutvikling/samfunnsutvikling/planer-og-rapporter/#temaplan-vann-og-avl-p (accessed on 30 October 2014). (In Norwegian)
- Vest-Viken Water Area Authority. Lier River Water Area. Analysis of Local Measures. Available online: http://www.vannportalen.no/lierelva (accessed on 30 October 2014). (In Norwegian)
- Norwegian Institute for Agricultural and Environmental Research. Agriculture Meteorological Service (LMT) Station Lier. Available online: http://lmt.bioforsk.no/agrometbase/getweatherdata_new.php (accessed on 2 March 2015). (In Norwegian)
- Johannessen, G.S.; Loncarevic, S. Bacteriological analysis of irrigation water and lettuce. In Proceedings of the Xth International Congress of Bacteriology and Applied Microbiology, IUMS, Paris, France, 27 July–1 August 2002.
- Johannessen, G.S.; Eckner, K.F.; Heiberg, N.; Monshaugen, M.; Begum, M.; Økland, M.; Høgåsen, H.R. Occurrence of Escherichia coli, Campylobacter, Salmonella and Shiga-toxin producing E. coli in Norwegian primary Strawberry Production. Int. J. Environ. Res. Public Health 2015. [Google Scholar] [CrossRef]
- Norwegian Institute for Agricultural and Environmental Research. Small WWTP Solutions. Description of Different Treatment Solutions. Available online: http://www.bioforsk.no/ikbViewer/page/prosjekt/tema?p_dimension_id=19541&p_menu_id=&p_sub_id=&p_dim2=19548 (accessed on 28April 2015). (In Norwegian)
- Municipal Agricultural Office. Personal Communication, 23 March 2015.
- Schoumans, O.F.; Chardon, W.J.; Bechmann, M.E.; Gascuel-Odoux, C.; Hofman, G.; Kronvang, B.; Rubæk, G.H.; Uléng, B.; Dorioz, J.-M. Mitigation options to reduce phosphorus losses from the agricultural sector and improve surface water quality: A review. Sci. Total Environ. 2014, 468, 1255–1266. [Google Scholar] [CrossRef] [PubMed]
- Hoffman, C.C.; Kjaergaard, C.; Uusi-Kämppä, J.; Bruun Hansen, H.C.; Kronvang, B. Phosphorus retention in riparian buffers: Review of their efficiency. J. Environ. Qual. 2009, 38, 1942–1955. [Google Scholar] [CrossRef] [PubMed]
- Strawn, L.K.; Fortes, E.D.; Bihn, E.A.; Nightingale, K.K.; Gröhn, Y.T.; Worobo, R.T.; Wiedmann, M.; Bergholz, P.W. Landscape and meteorological factors affecting prevalence of three food-borne pathogens in fruit and vegetable farms. Appl. Environ. Microbiol. 2013, 79, 588–600. [Google Scholar] [CrossRef] [PubMed]
- Holvoet, K.; Sampers, I.; Seynnaeve, M.; Uyttendaele, M. Relationships among hygiene indicators and enteric pathogens in irrigation water, soil and lettuce and the impact of climatic conditions on contamination in the lettuce primary production. Int. J. Food. Microbiol. 2014, 171, 21–31. [Google Scholar] [CrossRef] [PubMed]
- Delbeke, S.; Ceuppens, S.; Hessel, C.T.; Castro, I.; Jacxens, L.; de Zutter, L.; Uyttendaele, M. Microbial safety and sanitary quality of strawberry primary production in Belgium: Risk factors for Salmonella and Shiga toxin-producing Escherichia coli contamination. Appl. Environ. Microbiol. 2015, 81, 2562–2570. [Google Scholar] [CrossRef] [PubMed]
- Pagadala, S.; Marine, S.C.; Micallef, S.A.; Wang, F.; Pahl, D.M.; Melendez, M.V.; Kline, W.L.; Oni, R.A.; Walsh, C.S.; Everts, K.L.; et al. Assessment of region, farming system, irrigation source and sampling time as food safety risk factors for tomatoes. Int. J. Food Microbiol. 2015, 196, 98–108. [Google Scholar] [CrossRef] [PubMed]
- Johannessen, G.S.; Frøseth, R.B.; Solemdal, L.; Jarp, J.; Wasteson, Y.; Rørvik, L.M. Influence of bovine manure as fertilizer on the bacteriological quality of organic Iceberg lettuce. J. Appl. Microbiol. 2004, 96, 787–794. [Google Scholar] [CrossRef] [PubMed]
- Bihn, E.A.; Smart, C.D.; Hoepting, C.A.; Worobo, R.W. Use of surface water in the production of fresh fruits and vegetables: A survey of fresh produce growers and their water management practices. Food Prot. Trends. 2013, 33, 307–314. [Google Scholar]
- Crowther, J.; Kay, D.; Wyer, M.D. Faecal-indicator concentration in waters draining lowland pastoral catchments in the UK: Relationships with land use and farming practices. Water Res. 2002, 36, 1725–1734. [Google Scholar] [CrossRef]
- Servais, P.; Garcia-Armisen, T.; George, I.; Billen, G. Fecal bacteria in the rivers of the Seine drainage network (France): Sources, fate and modelling. Sci. Total Environ. 2007, 375, 152–167. [Google Scholar] [CrossRef] [PubMed]
- Blackstock, K.L.; Ingram, J.; Burton, R.; Brown, K.M.; Slee, B. Understanding and influencing behaviour change by farmers to improve water quality. Sci. Total Environ. 2010, 408, 5631–5638. [Google Scholar] [CrossRef] [PubMed]
- Hunter, C.; Perkins, J.; Tranter, J.; Gunn, J. Agricultural land-use effects on the indicator bacterial quality of an upland stream in the Derbyshire Peak District in the U.K. Water Res. 1999, 33, 3577–3586. [Google Scholar] [CrossRef]
- Trevisan, D.; Vansteelant, J.Y.; Dorioz, J.M. Survival and leaching of fecal bacteria after slurry spreading on mountain hay meadows: Consequences for the management of water contamination risk. Water Res. 2002, 36, 275–283. [Google Scholar] [CrossRef]
- Kay, D.; Crowther, J.; Fewtrell, L.; Francis, C.A.; Hopkins, M.; Kay, C.; McDonald, A.T.; Stapleton, C.M.; Watkins, J.; Wilkinson, J.; et al. Quantification and control of microbiological pollution from agriculture: A new policy challenge. Environ. Sci. Pol. 2008, 11, 1711–1784. [Google Scholar] [CrossRef]
- Kay, D.; Crowther, J.; Kay, C.; Mcdonald, A.T.; Christobel Ferguson, C.; Stapleton, C.M.; Wyer, M.D. Effectiveness of best management practices for attenuating the transport of livestock-derived pathogens within catchments World Health Organization (WHO). In Animal Waste, Water Quality and Human Health; Dufour, A., Bartram, J., Bos, R., Gannon, V., Eds.; IWA Publishing: London, UK, 2012. [Google Scholar]
© 2015 by the authors; licensee MDPI, Basel, Switzerland. This article is an open access article distributed under the terms and conditions of the Creative Commons Attribution license (http://creativecommons.org/licenses/by/4.0/).
Share and Cite
Johannessen, G.S.; Wennberg, A.C.; Nesheim, I.; Tryland, I. Diverse Land Use and the Impact on (Irrigation) Water Quality and Need for Measures — A Case Study of a Norwegian River. Int. J. Environ. Res. Public Health 2015, 12, 6979-7001. https://doi.org/10.3390/ijerph120606979
Johannessen GS, Wennberg AC, Nesheim I, Tryland I. Diverse Land Use and the Impact on (Irrigation) Water Quality and Need for Measures — A Case Study of a Norwegian River. International Journal of Environmental Research and Public Health. 2015; 12(6):6979-7001. https://doi.org/10.3390/ijerph120606979
Chicago/Turabian StyleJohannessen, Gro S., Aina C. Wennberg, Ingrid Nesheim, and Ingun Tryland. 2015. "Diverse Land Use and the Impact on (Irrigation) Water Quality and Need for Measures — A Case Study of a Norwegian River" International Journal of Environmental Research and Public Health 12, no. 6: 6979-7001. https://doi.org/10.3390/ijerph120606979
APA StyleJohannessen, G. S., Wennberg, A. C., Nesheim, I., & Tryland, I. (2015). Diverse Land Use and the Impact on (Irrigation) Water Quality and Need for Measures — A Case Study of a Norwegian River. International Journal of Environmental Research and Public Health, 12(6), 6979-7001. https://doi.org/10.3390/ijerph120606979