
Relationship between Urinary Pesticide Residue Levels and Neurotoxic Symptoms among Women on Farms in the Western Cape, South Africa

Abstract
:1. Introduction
2. Methods and Materials
2.1. Study Design, Population and Sampling

2.2. Questionnaire
2.3. Urinary Pesticide Metabolites Determination
2.4. Variables
2.5. Statistical Analysis
3. Results
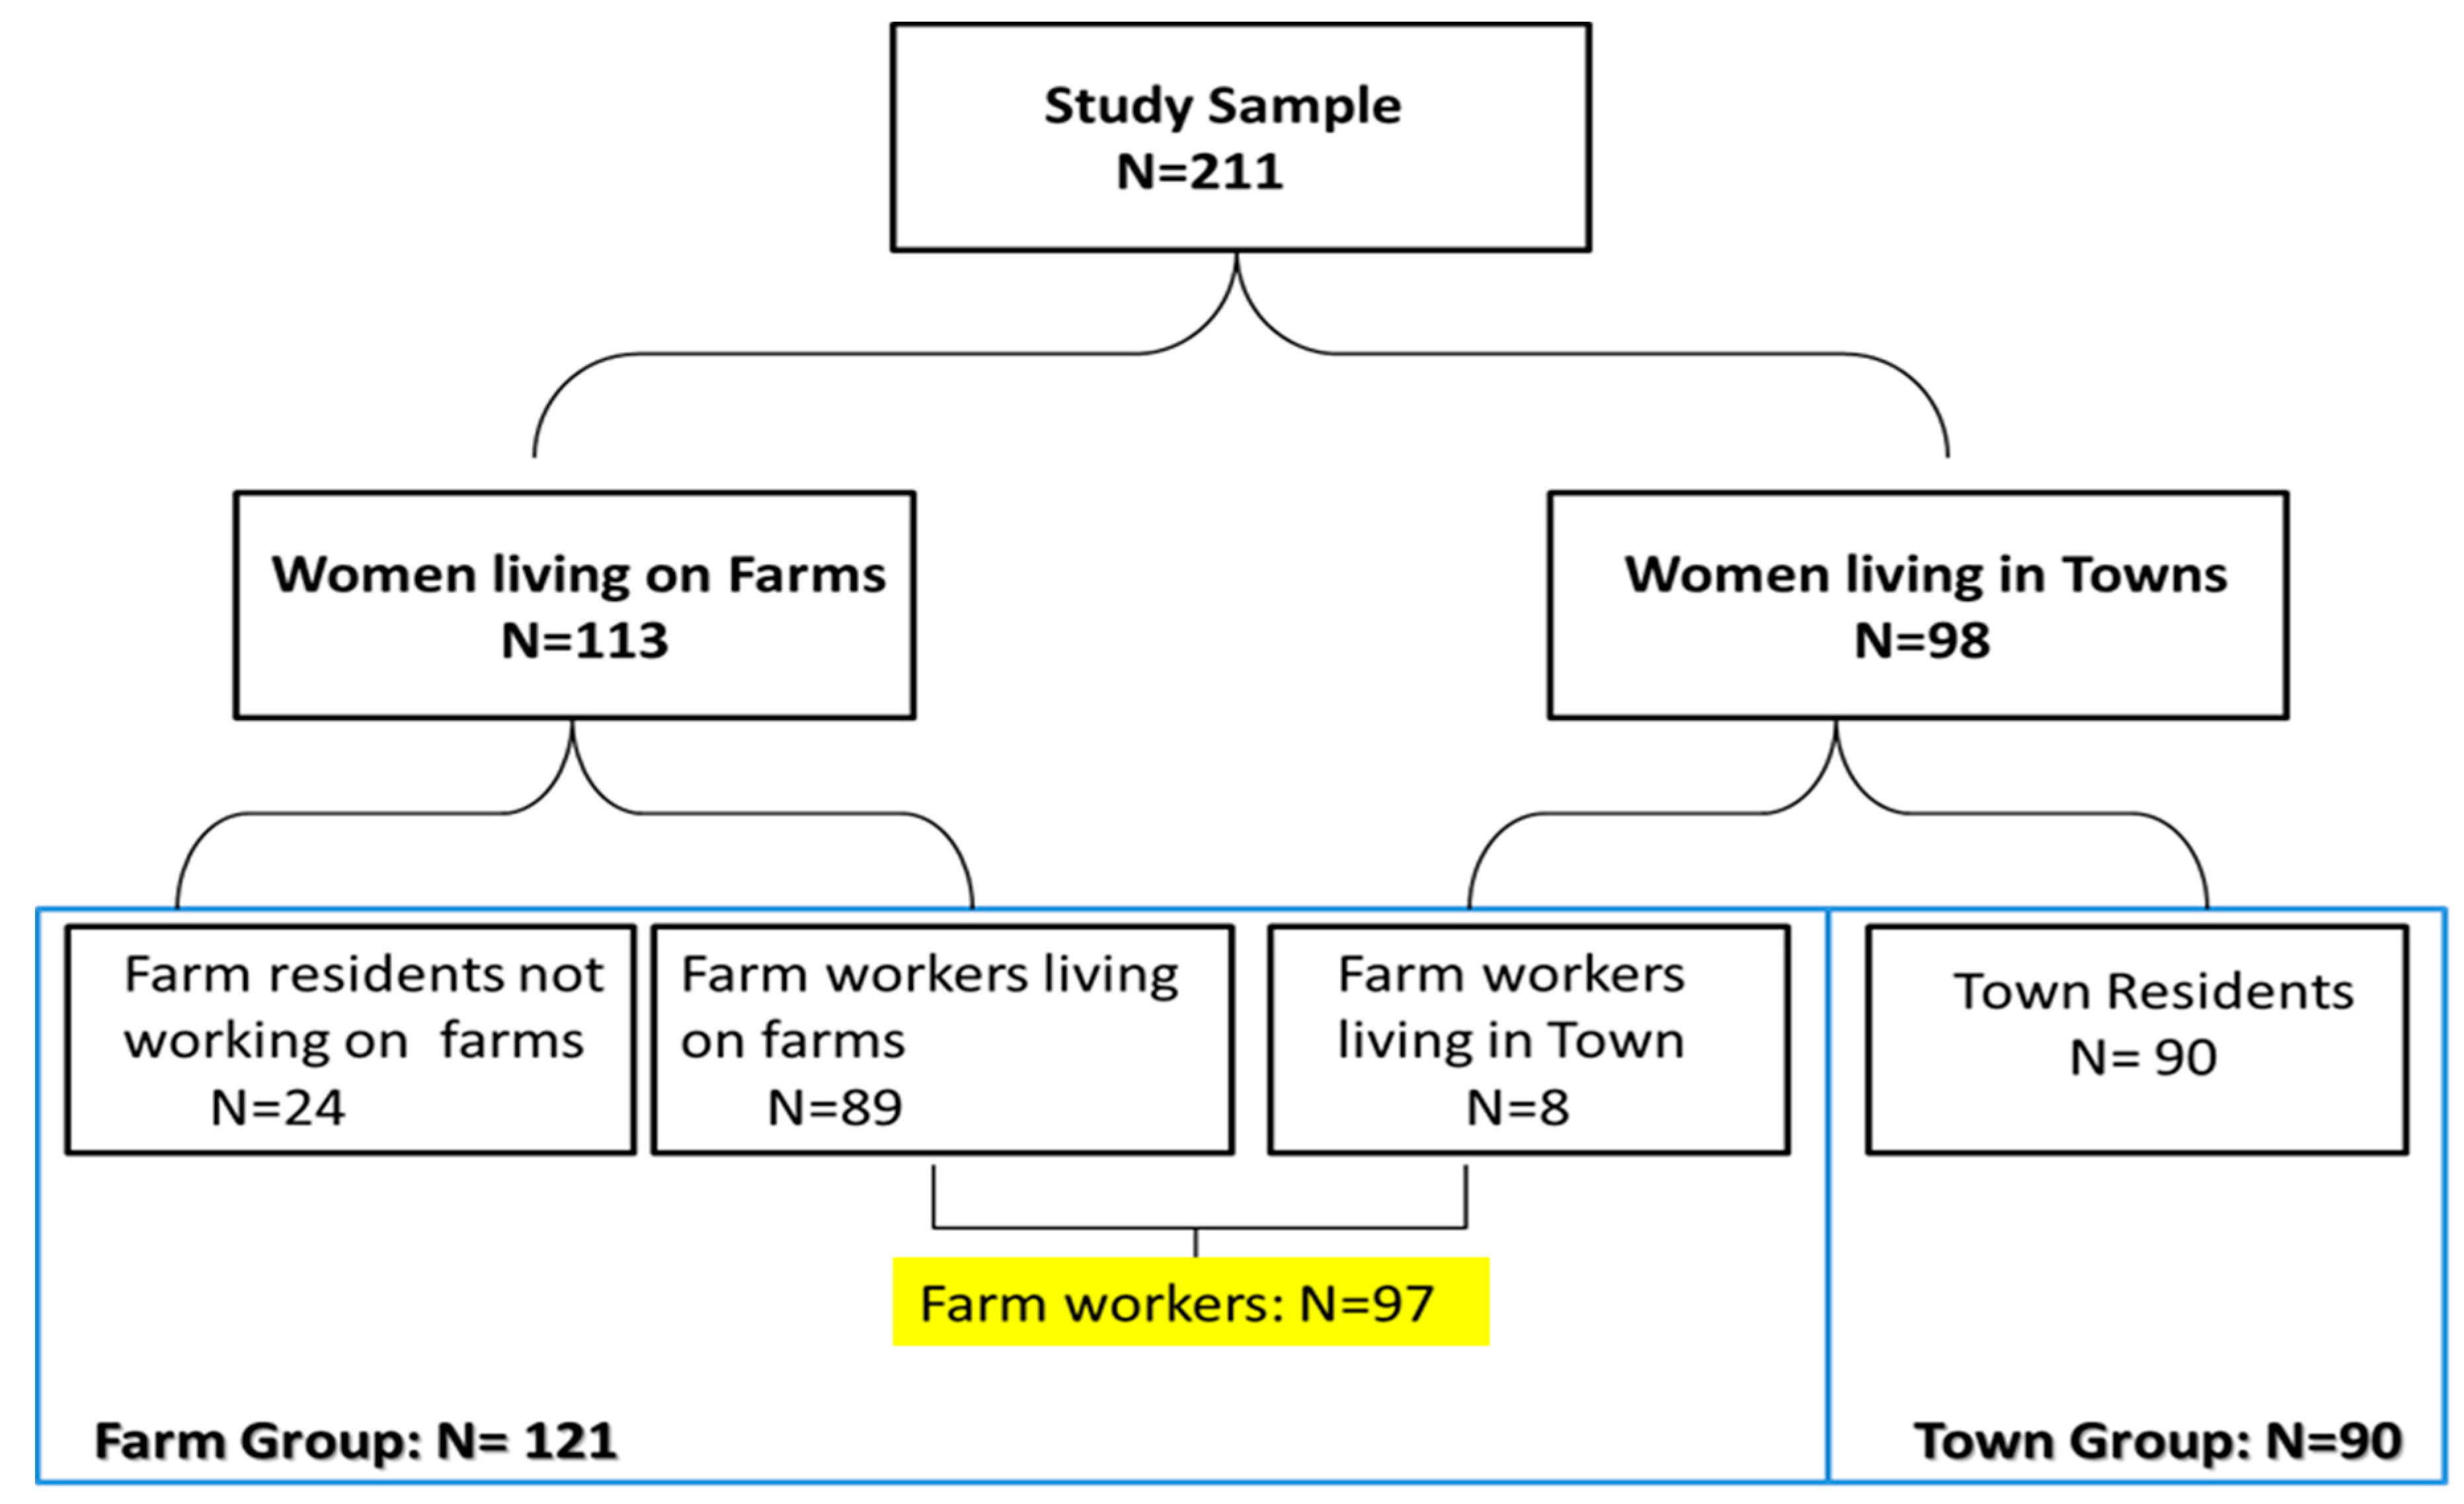
3.1. Participants
3.2. Demographic Information, Socio-Economic Status, Lifestyle Factors and Self-Reported Pesticide Exposure

| Characteristic | Farm Group (n = 121) | Town Group (n = 90) | Total (n = 211) |
|---|---|---|---|
| Demographic Characteristics: | |||
| Age (years; Median, IQR) | 33.0 (27.0–40.0) | 40.5 (31.0–49.0) | 37.0 (28.3–45.0) |
| Weight (Kg; n = 207; Median, IQR) | 61.0 (51.0–72.1) | 70.0 (58.3–81.1) | 65.0 (54.0–75.1) |
| Home language n (%) English Afrikaans IsiXhosa | 0 (0%) 119 (98%) 2 (2%) * | 1 (1.1%) 79 (88%) 10 (11%) | 1 (0.5%) 198 (94%) 12 (6%) |
| Level of Education: n (%) No schooling Matriculated | 4 (3%) 1 (1%) * | 4 (4%) 3 (3%) | 8 (4%) 4 (2%) |
| Length of stay in current residence (years; Median, IQR) | 15.0 (8–24) | 21.5 (12–41) | 17 (9–29) |
| Born on a farm: n (%) | 83 (69) | 13 (14) | 96 (46) |
| History of ever living or working on farms | 121 (100) * | 26 (29) | 147 (70) |
| Socioeconomic Status | |||
| Unemployment: n (%) | 20 (17) | 65 (71) | 85(40) |
| Household income/month ($US) (Median, IQR) | 270.0 (188–500) * | 378.7 (221–744) | 324.0 (199–600) |
| Lifestyle Factors n (%) | |||
| Current cigarette smoker | 69 (57) | 36 (40) | 105 (50) |
| Current alcohol consumption | 79 (65) | 39 (43) | 118 (56) |
| Use drugs | 0 (0) | 2 (2) | 2 (0.01) |
| Pesticide Exposure Household Pesticide Exposure | Farm Group N (%) | Town Group N (%) | Total N (%) |
|---|---|---|---|
| Use pesticides at home | 67 (55) | 56 (62) | 123 (58) |
| Member of the family works as a pesticide applicator | 36 (30) | 1 (1) | 37 (18) |
| Pesticide contaminated clothing washed at home | 58 (48) | 1 (1.1) | 59 (28) |
| Clothing washed with rest of washing | 39 (32) | 0 (0.0) | 39 (18) |
| Use of empty pesticide containers at home for drinking | 10 (8) | 0 (0.0) | 10 (5) |
| Pesticide Poisoning | |||
| Pesticide poisoning confirmed by a doctor | 6 (5) | 1 (1) | 7 (3) |
| Farm worker status (n = 208) | |||
| Permanent Seasonal | 53 (45) * 40 (34) * | 0 (0) 4 (4) | 53 (25) 44 (21) |
| Re-entry into sprayed fields Delayed re-entry a Immediate re-entry b | 33 (27) * 81 (67) * | 1 (1) 0 (0) | 34 (16) 81 (38) |
3.3. Urinary Pesticide Metabolite Results
| Pesticide Metabolites | Farm Group | Town Group | Total |
|---|---|---|---|
| Median (IQR) | |||
| Corrected for Creatinine (µg/g Creatinine) | |||
| Organophosphate Metabolites n = 101 n = 77 n = 178 | |||
| ∑DAP | 141.42 (37.4–249.83) | 132 (45.64–204.45) | 133.59 (41.86–229.09) |
| DMP | 32.91 (13.50–55.75) | 26.19 (14.33–52.36) | 29.63 (14.06–53.22) |
| DMTP | 13.41 (3.05–62.45) | 36.44 (6.11–71.85) | 21.87 (4.03–65.85) |
| DMDTP | 5.70 (0.83–51.51) | 9.57 (0.87–66.22) | 6.87 (0.85–61.77) |
| DEP | 5.01 (1.37–12.90) | 4.13 (0.59–9.47) | 4.27 (1.08–10.04) |
| DETP | 3.70 (1.15–26.98) | 3.94 (1.35–26.18) | 3.87 (1.20–26.98) |
| DEDTP | 1.99 (0.55–5.10) | 1.70 (0.60–8.02) | 1.89 (0.58–6.44) |
| Chlorpyrifos Metabolite n = 104 n = 82 n = 186 | |||
| TCPY | 6.15 (3.50–10.64) * | 4.14 (2.70–7.57) | 5.16 (2.84–9.24) |
| Pyrethroid Metabolites n = 101 n = 82 n = 183 | |||
| ∑Pyrethroids | 6.60 (3.61–9.96) | 5.26 (2.74–8.42) | 6.01 (3.24–9.67) |
| cis-DCCA | 0.71 (0.27–1.28) | 0.56 (0.23–1.13) | 0.62 (0.26–1.24) |
| trans-DCCA | 0.85 (0.47–1.29) * | 0.59 (0.28–1.02) | 0.70 (0.37–1.22) |
| DBCA | 0.31 (0.05–0.63) | 0.30 (0.04–0.60) | 0.30 (0.04–0.62) |
| 4F3PBA | 0.73 (0.31–1.32) | 0.70 (0.33–1.30) | 0.73 (0.32–1.32) |
| 3PBA | 3.61 (2.11–6.25) | 3.34 (2.27–5.92) | 3.40 (2.18–6.00) |
| Neurotoxic Symptom | Farm Group N = 121 (57) | Town Group N = 90 (43) | Total N = 211 (100) |
|---|---|---|---|
| Are you abnormally tired? (tired) | 81 (77) * | 37 (41) | 118 (56) |
| Do you have palpitations of the heart when you do not exert yourself? (heart palpitations) | 60 (50) * | 26 (29) | 86 (41) |
| Do you often have painful tingling in some part of your body? (tingling) | 55 (46) * | 24 (27) | 79 (37) |
| Do you often feel irritated without any particular reason? (irritated) | 59 (49) * | 22 (24) | 81 (38) |
| Do you often feel depressed without any particular reason? (depressed) | 62 (51) * | 30 (33) | 92 (44) |
| Do you often have problems concentrating? (poor concentration) | 34 (28) | 20 (22) | 54 (26) |
| Do you have a short memory? (short memory) | 59 (49) * | 28 (31) | 87 (41) |
| Do you often perspire without any particular reason? (perspire) | 30 (25) | 15 (17) | 45 (21) |
| Do you have any problems with buttoning and unbuttoning? (button) | 6 (5) | 4 (4) | 10 (5) |
| Do you generally find it hard to get the meaning from reading newspapers and books? (reading) | 31 (26) | 16 (18) | 47 (22) |
| Have your relatives told you that you have a short memory? (family member) | 32 (26) | 18 (20) | 50 (24) |
| Do you sometimes feel a heavy feeling on your chest? (chest) | 48 (40) * | 17 (19) | 65 (31) |
| Do you often have to make notes about what you must remember? (notes) | 36 (30) * | 14 (16) | 50 (24) |
| Do you often have to go back and check things you have done such as locking the door? (check door) | 64 (53) * | 26 (29) | 90 (43) |
| Do you have a headache at least once a week? (headache) | 105 (87) * | 42 (47) | 147 (70) |
| Do you think that you have less sex than most persons of your age? (less-sex) | 53 (44) | 35 (39) | 88 (42) |
| Total Score (median, range) (q16 score) | 7 (0–16) * | 2.5 (0–15) | 5 (0–16) |
| * p < 0.05 comparing Farm group to Town group | |||
3.4. Response to Q16 Questionnaire
3.5. Multivariate Associations between Pesticides Exposure Indices and Q16 Questionnaire Items
4. Discussion
| Pesticide Exposure. Odds Ratio/Regression Coefficient (95% Confidence Interval) | ||||
|---|---|---|---|---|
| History of ever Living and/or Workingon Farm | Born on Farm | Household Pesticides | Farm vs. Town Group | |
| Q16 Outcomes | ||||
| Tired | 3.3 (1.46–7.36) | 0.95 (0.50–1.78) | 0.61 (0.07–4.77) | 4.03 (2.07–7.86) |
| Heart palpitations | 4.73 (1.98–11.31) | 1.29 (0.66–2.41) | 0.44 (0.04–4.59) | 3.40 (1.70–6.78) |
| Tingling | 4.72 (1.94–11.50) | 0.85 (0.44–1.62) | 0.46 (0.04–5.07) | 3.81 (1.88–7.74) |
| Irritated | 4.25 (1.82–9.95) | 0.77 (0.41–1.45) | 1 (omitted) | 4.17 (2.08–8.36) |
| Depression | 1.89 (0.87–4.11) | 0.91 (0.49–1.69) | 0.40 (0.04–4.10) | 2.60 (1.38–4.88) |
| Poor concentration | 4.15 (1.59–10.80) | 1.36 (0.67–2.77) | 0.95 (0.09–9.95) | 1.96 (0.93–4.12) |
| Short term memory | 2.94 (1.34–6.45) | 1.48 (0.78–2.79) | 1.54 (0.20–11.73) | 3.03 (1.56–5.80) |
| Perspire | 4.35 (1.42–13.31) | 1.05 (0.49–2.29) | 0.76 (0.07–8.20) | 1.69 (0.78–3.66) |
| Button | 5.83 (0.56–60.74) | 1.17 (0.28–4.94) | 10.35 (1.73–146.18) | 0.78 (0.19–3.25) |
| Reading | 2.16 (0.79–5.86) | 1.05 (0.51–2.32) | 2.70 (0.34–21.37) | 1.67 (0.76–3.65) |
| Fam mem | 1.34 (0.54–3.36) | 1.93 (0.88–4.25) | 4.57 (0.58–35.88) | 1.92 (0.88–4.16) |
| Chest | 5.21 (1.90–14.25) | 0.63 (0.31–1.29) | 2.37 (0.30–18.91) | 3.84 (1.77–8.33) |
| Notes | 1.55 (0.64–3.77) | 1.03 (0.49–2.19) | 0.84 (0.08–9.05) | 2.47 (1.12–5.48) |
| Check door | 1.90 (0.85–4.23) | 1.34 (0.71–2.54) | 1.20 (0.16–9.30) | 3.10 (1.60–6.00) |
| Headache | 2.13 (0.91–5.00) | 0.79 (0.40–1.56) | 0.39 (0.05–3.03) | 9.41 (4.34–20.40) |
| Less sex | 1.70 (0.78–3.73) | 0.71 (0.38–1.32) | 0.49 (0.05–5.02) | 1.29 (0.70–2.40) |
| Q16 score | 2.69 (1.71–10.14) | 2.10 (0.72–6.10) | 0.07 (0.01–0.60) | 60.41 (6.96–524.51) |
| Q16 score50 | 5.31 (2.22–12.69) | 0.79 (0.42–1.51) | 1.03 (0.13–7. 92) | 5.27 (2.62–10.59) |
| Q16 score75 | 5.01 (1.76–14.25) | 1.68 (0.77–3.54) | 2.52 (0.32–19.72) | 3.05 (1.39–6.87) |
| Organophosphate Metabolites | |||||||
|---|---|---|---|---|---|---|---|
| Dialkyl Phosphates. Odds Ratio Regression Coefficient (95% Confidence Interval) | Chlorpyrifos Metabolite | ||||||
| DMP | DMTP | DMDTP | DEP | DETP | DEDTP | TCPY | |
| Q16 outcomes | |||||||
| Tired | 0.998 (0.985–1.009) | 1.001 (0.996–1.005) | 0.998 (0.995–1.005) | 1.006 (0.995–1.022) | 0.995 (0.985–1.005) | 1.004 (0.993–1.015) | 1.005 (0.992–1.020) |
| Heart palpitations | 0.990 (0.977–1.002) | 0.999 (0.995–1.009) | 1.002 (0.998–1.006) | 1.003 (0.988–1.019) | 0.995 (0.984–1.005) | 0.997 (0.987–1.008) | 1.007 (0.989–1.026) |
| Tingling | 1.003 (0.989–1.009) | 0.999 (0.995–1.003) | 0.999 (0.995–1.004) | 1.002 (0.978–1.017) | 0.995 (0.984–1.006) | 1.000 (0.989–1.011) | 0.998 (0.988–1.007) |
| Irritated | 0.997 (0.985–1.008) | 1.001 (0.997–1.005) | 1.000 (0.996–1.005) | 1.002 (0.986–1.016) | 0.993 (0.983–1.005) | 0.995 (0.985–1.007) | 1.021 (0.997–1.046) |
| Depression | 1.002 (0.991–1.013) | 1.000 (0.996–1.004) | 0.999 (0.996–1.003) | 0.999 (0.985–1.013) | 0.994 (0.984–1.004) | 0.998 (0.987–1.008) | 1.006 (0.991–1.022) |
| Poor concentration | 1.009 (0.9971–0.022) | 1.000 (0.996–1.005) | 0.996 (0.995–1.003) | 0.994 (0.976–1.012) | 0.998 (0.987–1.010) | 0.999 (0.987–1.012) | 0.929 (0.867–0.995) |
| Short term memory | 1.005 (0.994–1.014) | 1.000 (0.996–1.005) | 1.000 (0.997–1.005) | 0.996 (0.976–1.010) | 0.989 (0.977–1.002) | 0.994 (0.982–1.007) | 1.000 (0.991–1.006) |
| Perspire | 0.999 (0.985–1.014) | 1.003 (0.998–1.007) | 0.999 (0.994–1.004) | 0.985 (0.959–1.011) | 0.991 (0.976–1.001) | 0.997 (0.981–1.012) | 1.000 (0.990–1.009) |
| Button | 1.010 (0.984–1.035) | 1.003 (0.996–1.010) | 0.994 (0.980–1.007) | 0.972 (0.907–1.045) | 1.000 (0.979–1.022) | 0.966 (0.891–1.047) | 1.000 (0.981–1.018) |
| Reading | 0.997 (0.983–1.010) | 1.005 (1.001–1.010) | 0.999 (0.995–1.005) | 0.986 (0.966–1.007) | 0.998 (0.987–1.009) | 0.995 (0.987–1.009) | 0.993 (0.969–1.018) |
| Fam mem | 0.997 (0.983–1.011) | 0.996 (0.991–1.002) | 1.002 (0.998–1.006) | 0.995 (0.976–1.015) | 0.995 (0.981–1.008) | 1.003 (0.992–1.015) | 0.991 (0.965–1.017) |
| Chest | 0.993 (0.979–1.006) | 1.001 (0.997–1.006) | 1.004 (0.999–1.009) | 0.994 (0.978–1.010) | 0.993 (0.981–1.006) | 0.996 (0.984–1.008) | 0.998 (0.990–1.005) |
| Notes | 1.009 (0.995–1.022) | 1.004 (0.999–1.009) | 0.998 (0.993–1.005) | 0.991 (0.967–1.014) | 0.996 (0.982–1.010) | 1.002 (0.989–1.015) | 0.999 (0.991–1.007) |
| Check door | 1.006 (0.995–1.018) | 0.999 (0.996–1.004) | 1.997 (0.993–1.001) | 0.992 (0.978–1.020) | 0.999 (0.990–1.009) | 1.000 (0.989–1.009) | 0.990 (0.960–1.012) |
| Headache | 0.995 (0.983–1.007) | 1.001 (0.997–1.006) | 0.999 (0.995–1.004) | 0.999 (0.983–1.015) | 1.000 (0.989–1.009) | 1.002 (0.991–1.014) | 1.011 (0.983–1.040) |
| Less sex | 0.994 (0.982–1.005) | 0.999 (0.995–1.007) | 0.996 (0.995–1.000) | 1.008 (0.993–1.024) | 0.996 (0.985–1.006) | 1.005 (0.994–1.015) | 0.998 (0.990–1.005) |
| Q16 score | 1.002 (0.984–1.020) | 1.002 (0.996–1.006) | 0.999 (0.993–1.006) | 1.007 (0.981–1.032) | 0.999 (0.985–1.010) | 1.003 (0.986–1.021) | 1.003 (0.981–1.026) |
| Q16 score50 | 1.000 (0.989–1.012) | 1.001 (0.997–1.005) | 0.999 (0.996–1.005) | 0.995 (0.975–1.007) | 0.991 (0.980–1.003) | 0.998 (0.987–1.009) | 0.998 (0.989–1.005) |
| Q16 score75 | 1.006 (0.992–1.019) | 1.002 (0.997–1.007) | 1.000 (0.995–1.005) | 0.996 (0.971–1.010) | 0.995 (0.982–1.008) | 0.998 (0.985–1.012) | 0.997 (0.981–1.01) |
| Pesticide Exposure | ||||||
|---|---|---|---|---|---|---|
| Pyrethroids. Odds Ratio Regression Coefficient (95% Confidence Interval) | ||||||
| cis-DCCA | trans-DCCA | DBCA | 4F3PBA | 3PBA | ||
| Neurotoxic outcomes | ||||||
| Tired | 1.22 (0.74–2.00) | 1.44 (0.81–2.56) | 1.91 (0.80–4.55) | 1.16 (0.80–1.68) | 1.00 (0.98–1.02) | |
| Heart palpitations | 1.03 (0.63–1.66) | 1.17 (0.72–1.89) | 1.14 (0.49–2.64) | 0.92 (0.65–1.32) | 1.00 (0.98–1.02) | |
| Tingling | 0.81 (0.488–1.34) | 0.92 (0.56–1.54) | 0.82 (0.34–1.95) | 0.73 (0.46–1.14) | 1.00 (0.98–1.02) | |
| Irritated | 1.02 (0.63–1.65) | 1.18 (0.73–1.90) | 1.34 (0.58–3.07) | 0.94 (0.66–1.34) | 1.00 (0.98–1.02) | |
| Depression | 1.05 (0.67–1.66) | 1.10 (0.69–1.76) | 1.54 (0.69–3.42) | 0.96 (0.68–1.34) | 1.00 (0.98–1.02) | |
| Poor concentration | 1.06 (0.63–1.78) | 0.93 (0.55–1.59) | 1.49 (0.61–3.65) | 0.82 (0.52–1.28) | 0.97 (0.91–1.03) | |
| Short term memory | 1.00 (0.61–1.62) | 1.14 (0.70–1.85) | 1.35 (0.58–3.13) | 0.78 (0.51–1.18) | 1.00 (0.98–1.02) | |
| Perspire | 1.00 (0.55–1.74) | 1.11 (0.65–1.90) | 1.22 (0.46–3.29) | 0.72 (0.42–1.23) | 1.01 (0.99–1.03) | |
| Button | 3.03 (1.22–7.50) | 2.47 (0.94–6.45) | 8.93 (1.71–46.5) | 1.47 (0.85–2.54) | 1.02 (0.99–1.05) | |
| Reading | 1.57 (0.92–2.67) | 1.63 (0.94–2.83) | 2.95 (1.16–7.54) | 1.08 (0.74–1.57) | 1.01 (0.99–1.03) | |
| Fam mem | 1.08 (0.63–1.87) | 1.01 (0.59–1.73) | 1.45 (0.56–3.78) | 0.90 (0.56–1.45) | 1.00 (0.97–1.03) | |
| Chest | 0.96 (0.57–1.60) | 0.94 (0.57–1.57) | 1.12 (0.46–2.76) | 0.62 (0.38–1.04) | 1.00 (0.98–1.02) | |
| Notes | 1.54 (0.88–2.71) | 1.82 (1.00–3.32) | 2.82 (1.04–7.63) | 1.19 (0.81–1.75) | 1.00 (0.97–1.02) | |
| Check door | 1.17 (0.74–1.86) | 1.43 (0.85–2.39) | 1.53 (0.68–3.48) | 1.09 (0.77–1.53) | 1.00 (0.98–1.02) | |
| Headache | 1.11 (0.66–1.85) | 1.03 (0.60–1.77) | 1.04 (0.43–2.52) | 0.97 (0.67–1.39) | 0.98 (0.96–1.01) | |
| Less sex | 0.85 (0.53–1.38) | 0.88 (0.54–1.43) | 0.66 (0.28–1.54) | 0.77 (0.51–1.15) | 0.99 (0.96–1.02) | |
| Q16 score | 1.32 (0.60–2.92) | 1.35 (0.53–3.42) | 1.46 (0.38–5.63) | 0.93 (0.55–1.56) | 0.98 (0.96–1.01) | |
| Q16 score50 | 1.06 (0.66–1.71) | 1.10 (0.68–1.79) | 1.56 (0.68–3.59) | 0.82 (0.56–1.20) | 1.00 (0.98–1.02) | |
| Q16 score75 | 1.12 (0.65–1.92) | 1.29 (0.76–2.20) | 2.06 (0.80–5.25) | 0.87 (0.55–1.37) | 1.01 (0.99–1.03) | |
5. Conclusions
Acknowledgments
Author Contributions
Conflicts of Interest
References
- Bjorling-Poulsen, M.; Andersen, H.R.; Grandjean, P. Potential developmental neurotoxicity of pesticides used in Europe. Environ. Health 2008, 7, 50–69. [Google Scholar] [CrossRef] [PubMed] [Green Version]
- Ross, S.M.; McManus, I.; Harrison, V.; Mason, O. Neurobehavioral problems following low-level exposure to organophosphate pesticides: A systematic and meta-analytic review. Crit. Rev. Toxicol. 2013, 43, 21–44. [Google Scholar] [CrossRef] [PubMed]
- Costa, L.G. Current issues in organophosphate toxicology. Clin. Chim. Acta 2006, 366, 1–13. [Google Scholar] [CrossRef] [PubMed]
- Lauder, J.M.; Schambra, U.B. Morphogenetic roles of acetylcholine. Environ. Health Perspect. 1999, 107, 65–69. [Google Scholar] [CrossRef] [PubMed]
- Rother, H.A. Influences of Pesticide Risk Perception on the Health of Rural South African Women and Children. Available online: http://www.popline.org/node/185305 (accessed on 2 April 2015).
- Bazylewicz-Walczak, B.; Majczakowa, W.; Szymczak, M. Behavioral effects of occupational exposure to organophosphorous pesticides in female greenhouse planting workers. Neurotoxicology 1999, 20, 819–826. [Google Scholar] [PubMed]
- Carreón, T.; Butler, M.A.; Ruder, A.M.; Waters, M.A.; Davis-King, K.E.; Calvert, G.M.; Schulte, P.A.; Connally, B.; Ward, E.; Sanderson, W.T.; et al. Gliomas and farm pesticide exposure in women: The Upper Midwest Health Study. Environ. Health Perspect. 2005, 131, 546–551. [Google Scholar] [CrossRef]
- Barr, D.B.; Angerer, J. Potential uses of biomonitoring data: A case study using the organophosphorus pesticides chlorpyrifos and malathion. Environ. Health Perspect. 2006, 114, 1763–1769. [Google Scholar] [CrossRef] [PubMed]
- Phung, D.T.; Connell, D.; Miller, G.; Hodge, M.; Patel, R.; Cheng, R. Biological monitoring of chlorpyrifos exposure to rice farmers in Vietnam. Chemosphere 2012, 87, 294–300. [Google Scholar] [CrossRef] [PubMed]
- Eskenazi, B.; Marks, A.R.; Bradman, A.; Harley, K.; Bart, D.B.; Johnson, C.; Morga, N.; Jewell, N.P. Organophosphate pesticide exposure and neurodevelopment in young Mexican-American children. Environ. Health Perspect. 2007, 115, 792–798. [Google Scholar] [CrossRef] [PubMed]
- Bouchard, M.F.; Bellinger, D.C.; Wright, R.O.; Weisskopf, M.G. Attention-deficit/hyperactivity disorder and urinary metabolites of organophosphate pesticides. Pediatrics 2010, 125, 1270–1277. [Google Scholar] [CrossRef] [PubMed]
- Rohlman, D.S.; Ismail, A.A.; Rasoul, G.A.; Lasarev, M.; Hendy, O.; Olson, J.R. Characterizing exposures and neurobehavioral performance in Egyptian adolescent pesticide applicators. Metab. Brain Dis. 2014, 29, 845–855. [Google Scholar] [CrossRef] [PubMed]
- Khan, K.; Ismail, A.A.; Rasoul, G.A.; Bonner, M.R.; Lasarev, M.R.; Hendy, O.; Al-Batanony, M.; Crane, A.L.; Singleton, S.T.; Olson, J.R.; et al. Longitudinal assessment of chlorpyrifos exposure and self-reported neurological symptoms in adolescent pesticide applicators. BMJ Open 2014, 4. [Google Scholar] [CrossRef] [PubMed]
- Zhang, W.; Jiang, F.; Ou, J. Global pesticide consumption and pollution: With China as a focus. Proc. Int. Acad. Ecol. Environ. Sci. 2011, 2, 125–144. [Google Scholar]
- Reinecke, S.; Reinecke, A. The impact of organophosphate pesticides in orchards on earthworms in the Western Cape, South Africa. Ecotoxicol. Environ. Saf. 2007, 66, 244–251. [Google Scholar] [CrossRef] [PubMed]
- Dalvie, M.A.; Africa, A.; London, L. Disposal of unwanted pesticides in Stellenbosch, South Africa. Sci. Total Environ. 2006, 361, 8–17. [Google Scholar] [CrossRef] [PubMed]
- Dalvie, M.A.; Naik, I.; Channa, K.; London, L. Urinary dialkyl phosphate levels before and after first season chlorpyrifos spraying amongst farm workers in the Western Cape, South Africa. J. Environ. Sci. Health 2011, 46, 163–172. [Google Scholar] [CrossRef] [PubMed]
- London, L.; Nell, V.; Thompson, M.; Myers, J.E. Effects of long-term organophosphate exposures on neurological symptoms, vibration sense and tremor among South African farm workers. Scand. J. Work Environ. Health 1998, 24, 18–29. [Google Scholar] [CrossRef] [PubMed]
- Bowers, Y.; London, L.; Holtman, Z.; Messina, S.; Lindoor, B.A.E.; Rhodes, G. Obstacles to the rights of access to health care for farm worker women in the Western Cape. Crit. Health Perspect. 2009, 1, 1–4. [Google Scholar]
- Lundberg, I.; Hogberg, M.; Michelsen, H.; Nise, G.; Hogstedt, C. Evaluation of the Q16 questionnaire on neurotoxic symptoms and a review of its use. Occup. Environ. Med. 1997, 54, 343–350. [Google Scholar] [CrossRef] [PubMed]
- Keifer, M.; Rivas, F.; Moon, J.D.; Checkoway, H. Symptoms and cholinesterase activity among rural residents living near cotton fields in Nicaragua. Occup. Environ. Med. 1996, 53, 726–729. [Google Scholar] [CrossRef] [PubMed]
- Kamel, F.; Engel, L.S.; Gladen, B.C.; Hoppin, J.A.; Alavanja, M.C.; Sandler, D.P. Neurologic symptoms in licenced private pesticide applicators in the Agricultural Health Study. Enviorn. Health Perspect. 2005, 113, 877–882. [Google Scholar] [CrossRef]
- Bast-Pettersen, R. Self-reported conceptions of memory and concentration in comparison with the neuropsychological test performance of manual workers. Scand. J. Work Environ. Health 2006, 2, 32–41. [Google Scholar]
- Hardt, J.; Angerer, J. Determination of dialkyl phosphates in human urine using gas chromatography-mass spectrometry. J. Anal. Toxicol. 2000, 24, 678–684. [Google Scholar] [CrossRef] [PubMed]
- Sams, C.; Jones, K. Human volunteer studies investigating the potential for toxicokinetic interactions between the pesticides deltamethrin; pirimicarb and chlorpyrifos-methyl following oral exposure at the acceptable daily intake. Toxicol. Lett. 2011, 200, 41–45. [Google Scholar] [CrossRef] [PubMed]
- Arrebola, F.; Martı́nez-Vidal, J.; Fernández-Gutiérrez, A.; Akhtar, M. Monitoring of pyrethroid metabolites in human urine using solid-phase extraction followed by gas chromatography-tandem mass spectrometry. Anal. Chim. Acta 1999, 401, 45–54. [Google Scholar] [CrossRef]
- Rosenstock, L.; Keifer, M.; Daniell, W.E.; McConnell, R.; Claypoole, K.; Pesticide Health Effects Study Group. Chronic central nervous system effects of acute organophosphate pesticide intoxication. Lancet 1991, 338, 223–227. [Google Scholar] [CrossRef]
- Steenland, K.; Dick, R.B.; Howell, R.J.; Chrislip, D.W.; Hines, C.J.; Reid, T.M. Neurologic function among termiticide applicators exposed to chlorpyrifos. Environ. Health Perspect. 2000, 108, 293–300. [Google Scholar] [CrossRef] [PubMed]
- Wesseling, C.; Keifer, M.; Ahlbom, A.; McConnell, R.; Moon, J.; Rosenstock, L.; Hogstedt, C. Long-term neurobehavioral effects of mild poisonings with organophosphate and n-methyl carbamate pesticides among banana workers. Int. J. Occup. Environ. Health 2002, 8, 27–34. [Google Scholar] [CrossRef] [PubMed]
- Van der Schans, M.; Hulst, A.; van der Riet-van Oeveren, D.; Noort, D.; Benschop, H.; Dishovsky, C. New tools in diagnosis and biomonitoring of intoxications with organophosphorothioates: Case studies with chlorpyrifos and diazinon. Chem. Biol. Interact. 2013, 203, 96–102. [Google Scholar] [CrossRef] [PubMed]
- Ye, X.; Pierik, F.H.; Hauser, R.; Duty, S.; Angerer, J.; Park, M.M.; Burdorf, A.; Hofman, A.; Jaddoe, V.W.; Mackenbach, J.P.; et al. Urinary metabolite concentrations of organophosphorous pesticides, bisphenol A, and phthalates among pregnant women in Rotterdam, the Netherlands: The generation R study. Environ. Res. 2008, 108, 260–267. [Google Scholar] [CrossRef] [PubMed]
- Barr, D.B. Bio-monitoring of exposure to pesticides. J. Chem. Health Saf. 2008, 15, 20–29. [Google Scholar] [CrossRef]
- Trunnelle, K.J.; Bennett, D.H.; Ahn, K.C.; Schenker, M.B.; Tancredi, D.J.; Gee, S.J.; Stoecklin-Marois, T.M.; Hammock, D.B. Concentrations of the urinary pyrethroid metabolite 3-phenoxybenzoic acid in farm worker families in the MICASA study. Environ. Res. 2014, 131, 153–159. [Google Scholar] [CrossRef] [PubMed]
- Soderlund, D.M.; Clark, J.M.; Sheets, L.P.; Mullin, L.S.; Piccirillo, V.J.; Sargent, D.; Stevens, J.T.; Weiner, M.L. Mechanisms of pyrethroid neurotoxicity: Implications for cumulative risk assessment. Toxicology 2002, 171, 3–59. [Google Scholar] [CrossRef]
© 2015 by the authors; licensee MDPI, Basel, Switzerland. This article is an open access article distributed under the terms and conditions of the Creative Commons Attribution license (http://creativecommons.org/licenses/by/4.0/).
Share and Cite
Motsoeneng, P.M.; Dalvie, M.A. Relationship between Urinary Pesticide Residue Levels and Neurotoxic Symptoms among Women on Farms in the Western Cape, South Africa. Int. J. Environ. Res. Public Health 2015, 12, 6281-6299. https://doi.org/10.3390/ijerph120606281
Motsoeneng PM, Dalvie MA. Relationship between Urinary Pesticide Residue Levels and Neurotoxic Symptoms among Women on Farms in the Western Cape, South Africa. International Journal of Environmental Research and Public Health. 2015; 12(6):6281-6299. https://doi.org/10.3390/ijerph120606281
Chicago/Turabian StyleMotsoeneng, Portia M., and Mohamed A. Dalvie. 2015. "Relationship between Urinary Pesticide Residue Levels and Neurotoxic Symptoms among Women on Farms in the Western Cape, South Africa" International Journal of Environmental Research and Public Health 12, no. 6: 6281-6299. https://doi.org/10.3390/ijerph120606281
APA StyleMotsoeneng, P. M., & Dalvie, M. A. (2015). Relationship between Urinary Pesticide Residue Levels and Neurotoxic Symptoms among Women on Farms in the Western Cape, South Africa. International Journal of Environmental Research and Public Health, 12(6), 6281-6299. https://doi.org/10.3390/ijerph120606281