
Do Neighborhood Characteristics in Amsterdam Influence Adiposity at Preschool Age?


Abstract
:1. Introduction
2. Methods
2.1. Data Sources
2.2. Dependent Variables
2.3. Independent Variables: Individual and Family Level
2.4. Independent Variables: Neighborhood Level
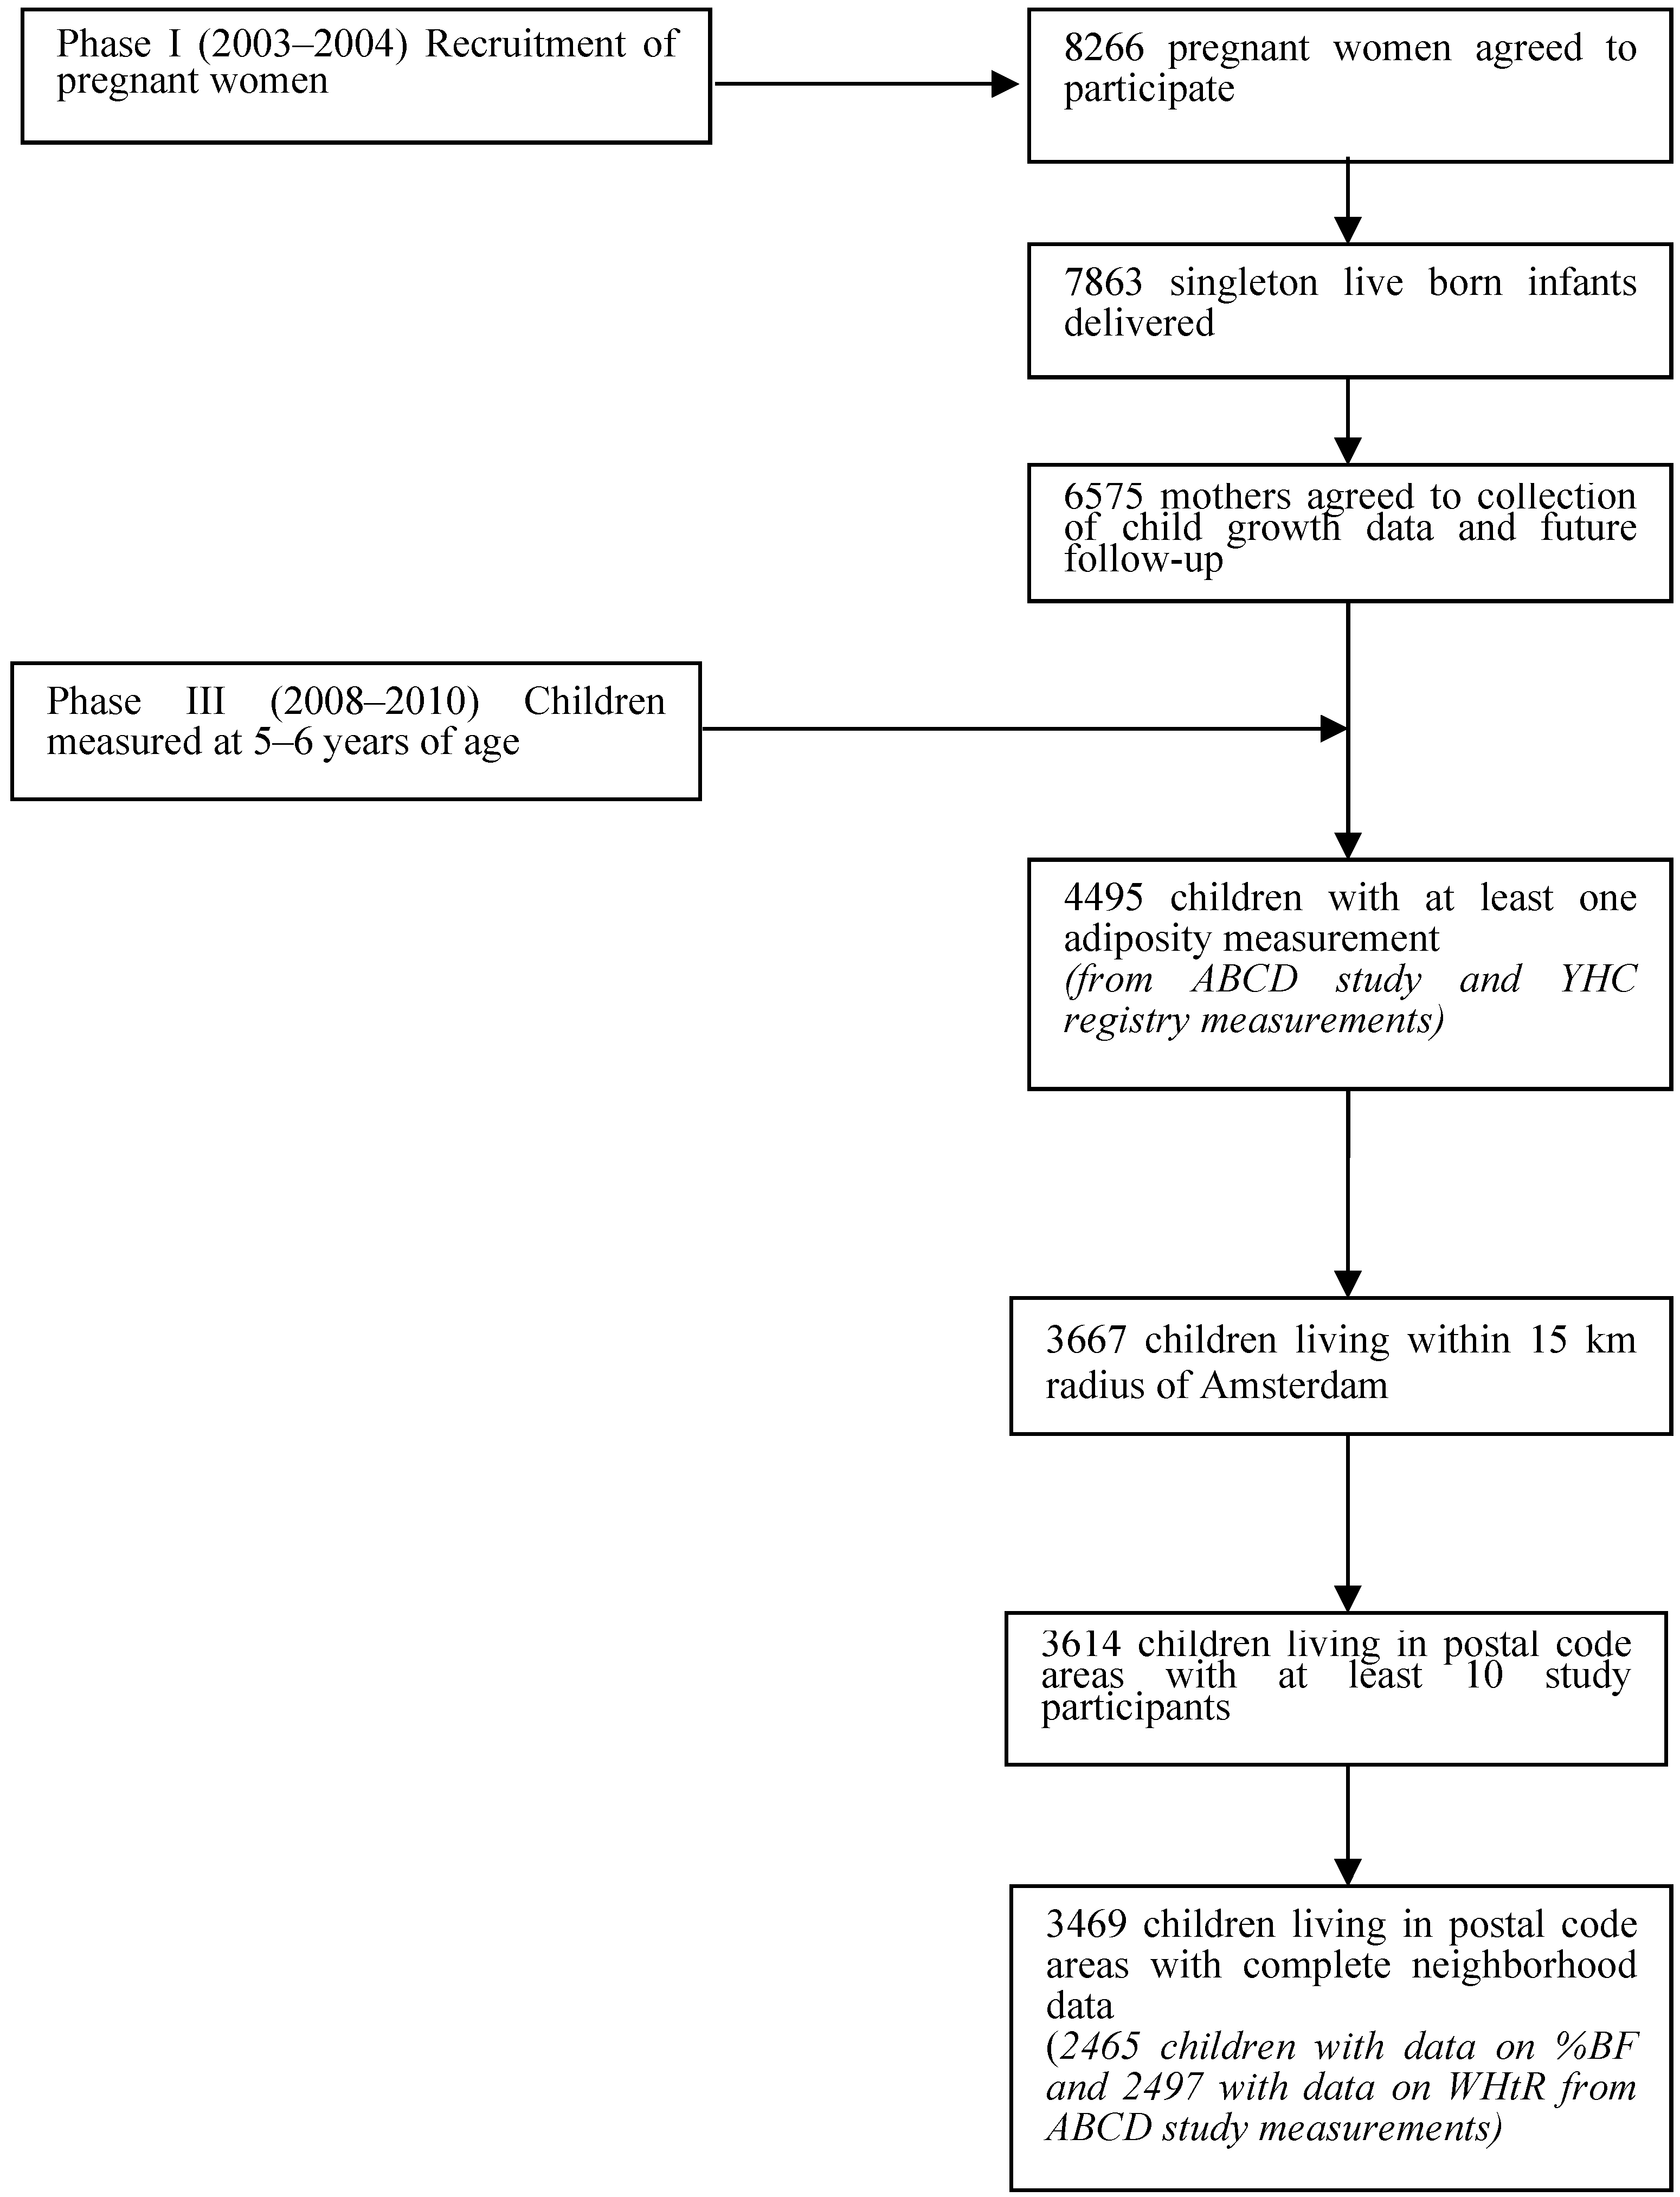
2.5. Study Sample
2.6. Statistical Analysis

3. Results

| Covariates of Interest | Number of Participants with Data | Quartile of Neighborhood Status Score | |||
|---|---|---|---|---|---|
| N | Low | Mid-Low | Mid-High | High | |
| Neighborhood characteristics | |||||
| Mean status score (SD) | 3469 | −2.6 (0.8) | −1.3 (0.3) | −0.07 (0.5) | 1.1 (0.3) |
| Mean perceived safety (SD) | 3469 | 3.6 (0.1) | 3.6 (0.2) | 3.9 (0.2) | 4.0 (0.09) |
| Mean satisfaction with green spaces (SD) | 3469 | 3.5 (0.1) | 3.6 (0.2) | 3.5 (0.2) | 3.5 (0.2) |
| Mean perceived physical disorder (SD) | 3469 | 4.1 (0.7) | 4.2 (0.8) | 3.8 (0.8) | 2.9 (0.5) |
| Family characteristics | |||||
| Maternal BMI (SD) (kg/m2) | 2368 | 25.0 (4.9) | 24.3 (4.4) | 23.2 (3.8) | 23.0 (3.6) |
| Overweight mother (BMI ≥ 25 kg/m2) (%) | 2368 | 40.8 | 35.1 | 22.1 | 20.9 |
| Paternal BMI (SD) (kg/m2) | 2237 | 25.8 (4.2) | 25.3 (3.3) | 24.8 (2.9) | 24.8 (2.8) |
| Overweight father (BMI ≥ 25 kg/m2) (%) | 2237 | 53.1 | 48.4 | 42.1 | 43.1 |
| Maternal Education | 3451 | ||||
| 29.3 | 41.6 | 59.1 | 70.5 | |
| 33.1 | 29.2 | 26.8 | 23.3 | |
| 37.6 | 29.1 | 14.2 | 6.2 | |
| Non-Western ethnicity (%) | 3469 | 60.4 | 40.2 | 18.2 | 13.5 |
| Individual history characteristics | |||||
| Child age (SD) (years) | 3469 | 5.8 (0.49) | 5.7 (0.48) | 5.6 (0.43) | 5.6 (0.45) |
| Gender (% girls) | 3469 | 49.0 | 50.4 | 45.4 | 54.9 |
| Pre-pregnancy BMI (SD) (kg/m2) | 3469 | 24.1 (4.6) | 23.5 (4.3) | 22.7 (3.8) | 22.5 (3.3) |
| Overweight mother prior to pregnancy (BMI ≥ 25 kg/m2) (%) | 3469 | 33.2 | 27.1 | 19.8 | 16.5 |
| Smoking during pregnancy (% yes) | 3468 | 12.1 | 14.8 | 11.8 | 5.0 |
| Duration of exclusive breastfeeding | 3469 | ||||
| 15.3 | 18.4 | 16.3 | 14.5 | |
| 21.5 | 22.4 | 29.6 | 31.2 | |
| 63.2 | 59.1 | 54.1 | 54.3 | |
| Introduction of solid foods before 4 months of age (%) | 3469 | 6.7 | 5.7 | 5.2 | 4.8 |
| Child Outcomes | |||||
| BMI standard deviation score (SD) | 3469 | 0.14 (1.1) | 0.10 (1.0) | −0.04 (0.98) | −0.1 (0.93) |
| Percentage body fat (%) (SD) | 2465 | 22.5 (7.2) | 21.2 (6.9) | 20.0 (6.1) | 19.6 (6.0) |
| Waist-to-height ratio (x100) (SD) | 2497 | 45.3 (3.4) | 45.2 (3.1) | 45.2 (2.9) | 45.0 (2.7) |
4. Discussion
| Child Adiposity Outcome | Change in Outcome Variable per Unit Increase in Neighborhood Characteristic Score | |||
|---|---|---|---|---|
| Model 1 a (95%CI) | Model 2 b (95%CI) | Model 3 c (95%CI) | Model 4 d (95%CI) | |
| BMI § | ||||
| ICC * = 0.014 | ||||
| Neighborhood SES | −0.06 (−0.1, −0.03) | −0.01 (−0.04, 0.02) | 0.0005 (−0.03, 0.03) | 0.008 (−0.03, 0.04) |
| ICC | 0.0096 | 0.0092 | 0.0084 | 0.0093 |
| Perceived neighborhood safety | −0.5 (−0.7, −0.3) | −0.1 (−0.3, 0.06) | −0.05 (−0.2, 0.1) | 0.06 (−0.2, 0.3) |
| ICC | 0.0073 | 0.0089 | 0.0083 | 0.0091 |
| Satisfaction with green spaces | 0.2 (−0.05, 0.5) | 0.1 (−0.08, 0.3) | 0.1 (−0.1, 0.3) | −0.002 (−0.3, 0.3) |
| ICC | 0.013 | 0.087 | 0.080 | 0.0091 |
| Physical disorder | 0.06 (0.003, 0.1) | 0.01 (−0.04, 0.06) | 0.008 (−0.04, 0.05) | 0.03 (−0.03, 0.08) |
| ICC | 0.013 | 0.0097 | 0.0087 | 0.0096 |
| Percent body fat (%) | ||||
| ICC * = 0.030 | ||||
| Neighborhood SES | −0.6 (−0.8, −0.4) | −0.2 (−0.4, −0.05) | −0.2 (−0.4, 0.001) | −0.1 (−0.4, 0.06) |
| ICC | 0.0065 | 0.0030 | 0.0034 | 0.0033 |
| Perceived neighborhood safety | −4.5 (−5.9, −3.2) | −1.4 (−2.7, −0.06) | −0.9 (−2.2, 0.4) | −0.6 (−2.1, 0.9) |
| ICC | 0.0034 | 0.0039 | 0.0044 | 0.0043 |
| Satisfaction with green spaces | 2.2 (0.4, 4.2) | 1.4 (0.04, 2.8) | 1.2 (−0.2, 2.6) | 0.6 (−1.0, 2.2) |
| ICC | 0.019 | 0.0040 | 0.040 | 0.0036 |
| Physical disorder | 0.5 (0.04, 0.9) | 0.09 (−0.2, 0.4) | 0.1 (−0.2, 0.4) | 0.1 (−0.2, 0.5) |
| ICC | 0.019 | 0.0056 | 0.0051 | 0.0048 |
| Waist-to-height ratio † | ||||
| ICC *,‡ = 0.019 | ||||
| Neighborhood SES | −0.1(−0.2, −0.04) | −0.02 (−0.1, 0.09) | 0.01 (−0.09, 0.1) | 0.03 (−0.09, 0.1) |
| ICC ‡ | 0.018 | 0.020 | 0.021 | 0.022 |
| Perceived neighborhood safety ICC ‡ | −1.0 (−1.7, −0.3) | 0.03 (−0.7, 0.8) | 0.2 (−0.5, 1.0) | 0.4 (−0.5, 1.2) |
| 0.019 | 0.020 | 0.021 | 0.021 | |
| Satisfaction with green spaces | 0.9 (0.1, 1.8) | 0.7 (−0.1, 1.4) | 0.6 (−0.2, 1.3) | 0.4 (−0.4, 1.3) |
| ICC ‡ | 0.017 | 0.018 | 0.019 | 0.020 |
| Physical disorder | 0.2 (−0.03, 0.3) | 0.04 (−0.1, 0.2) | 0.04 (−0.1, 0.2) | 0.07 (−0.1, 0.3) |
| ICC ‡ | 0.020 | 0.021 | 0.022 | 0.022 |
| BMI § | Change in Outcome Variable per Individual History or Family Characteristic |
|---|---|
| Individual history characteristics | |
| Pre-pregnancy BMI (kg/m2) | 0.03 (0.01, 0.04) |
| Smoking during pregnancy | 0.3 (0.1, 0.4) |
| Exclusive breastfeeding | |
| reference |
| 0.02 (−0.1, 0.1) |
| 0.03 (−0.08, 0.1) |
| Age at introduction of solid foods | |
| reference |
| −0.1 (−0.3, 0.05) |
| Family characteristics | |
| Maternal BMI (kg/m2) | 0.03 (0.01, 0.05) |
| Paternal BMI (kg/m2) | 0.04 (0.02, 0.05) |
| Maternal education | |
| reference |
| −0.07 (−0.2, 0.05) |
| 0.1 (−0.03, 0.3) |
| Non-Western ethnicity | 0.2 (0.04, 0.3) |
| Percent Body Fat | |
| Individual history characteristics | |
| Pre-pregnancy BMI (kg/m2) | 0.05 (−0.06, 0.2) |
| Smoking during pregnancy | 0.6 (−0.3, 1.5) |
| Exclusive breastfeeding | |
| reference |
| −0.02 (−0.8, 0.7) |
| 0.4 (−0.3, 1.1) |
| Age at introduction of solid foods | |
| reference |
| −0.7 (−1.9, 0.5) |
| Age | 2.5 (1.9, 3.1) |
| Gender | |
| 2.6 (2.1, 3.1) |
| Family Characteristics | |
| Maternal BMI (kg/m2) | 0.2 (0.1, 0.3) |
| Paternal BMI (kg/m2) | 0.1 (0.05, 0.2) |
| Maternal education | |
| reference |
| −0.1 (−0.8, 0.5) |
| 1.0 (0.05, 1.9) |
| Non-Western ethnicity | 2.4 (1.6, 3.2) |
| Waist-to-height ratio † | |
| Individual history characteristics | |
| Pre-pregnancy BMI (kg/m2) | 0.01 (−0.04, 0.06) |
| Smoking during pregnancy | 0.7 (0.2, 1.1) |
| Exclusive breastfeeding | |
| reference |
| −0.1 (−0.5, 0.3) |
| −0.06 (−0.4, 0.3) |
| Age at introduction of solid foods | |
| reference |
| −0.8 (−1.3, −0.2) |
| Age | −1.1 (−1.4, −0.8) |
| Gender | |
| −0.4 (−0.6, −0.1) |
| Family characteristics | |
| Maternal BMI (kg/m2) | 0.1 (0.06, 0.2) |
| Paternal BMI (kg/m2) | 0.03 (−0.01, 0.08) |
| Maternal education | |
| reference |
| −0.1 (−0.5, 0.2) |
| 0.3 (−0.2, 0.8) |
| Non-Western ethnicity | 0.5 (0.2, 0.9) |
4.1. Strengths and Limitations
4.2. Previous Research
4.3. Implications
5. Conclusions
Acknowledgements
Author Contributions
Conflicts of Interest
References
- EU. Eu Action Plan on Childhood Obesity 2014–2020. Available online: http://ec.europa.eu/health/nutrition_physical_activity/docs/childhoodobesity_actionplan_2014_2020_en.pdf (accessed on 5 November 2014).
- Schokker, D.F.; Visscher, T.L.; Nooyens, A.C.; van Baak, M.A.; Seidell, J.C. Prevalence of overweight and obesity in the netherlands. Obes. Rev. 2007, 8, 101–108. [Google Scholar] [CrossRef] [PubMed]
- Schonbeck, Y.; Talma, H.; van Dommelen, P.; Bakker, B.; Buitendijk, S.E.; Hirasing, R.A.; van Buuren, S. Increase in prevalence of overweight in Dutch children and adolescents: A comparison of nationwide growth studies in 1980, 1997 and 2009. PLoS One 2011. [Google Scholar] [CrossRef]
- De Hoog, M.L.; van Eijsden, M.; Stronks, K.; Gemke, R.J.; Vrijkotte, T.G. Overweight at age two years in a multi-ethnic cohort (abcd study): The role of prenatal factors, birth outcomes and postnatal factors. BMC Public Health 2011. [Google Scholar] [CrossRef]
- Cunningham, S.A.; Kramer, M.R.; Narayan, K.M. Incidence of childhood obesity in the United States. N. Engl. J. Med. 2014, 370, 1660–1661. [Google Scholar] [CrossRef] [PubMed]
- Dubois, L.; Farmer, A.; Girard, M.; Porcherie, M. Family food insufficiency is related to overweight among preschoolers. Soc. Sci. Med. 2006, 63, 1503–1516. [Google Scholar] [CrossRef] [PubMed]
- Hawkins, S.S.; Law, C. A review of risk factors for overweight in preschool children: A policy perspective. Int. J. Pediatr. Obes. 2006, 1, 195–209. [Google Scholar] [CrossRef] [PubMed]
- Parsons, T.J.; Power, C.; Logan, S.; Summerbell, C.D. Childhood predictors of adult obesity: A systematic review. Int. J. Obesity 1999, 23, 1–107. [Google Scholar] [CrossRef]
- Skouteris, H.; McCabe, M.; Swinburn, B.; Newgreen, V.; Sacher, P.; Chadwick, P. Parental influence and obesity prevention in pre-schoolers: A systematic review of interventions. Obes. Rev. 2011, 12, 315–328. [Google Scholar] [CrossRef] [PubMed]
- De Jong, E.; Schokker, D.F.; Visscher, T.L.; Seidell, J.C.; Renders, C.M. Behavioural and socio-demographic characteristics of Dutch neighbourhoods with high prevalence of childhood obesity. Int. J. Pediatr. Obes. 2011, 6, 298–305. [Google Scholar] [CrossRef] [PubMed]
- Lovasi, G.S.; Hutson, M.A.; Guerra, M.; Neckerman, K.M. Built environments and obesity in disadvantaged populations. Epidemiologic Rev. 2009, 31, 7–20. [Google Scholar] [CrossRef]
- Mackenbach, J.D.; Rutter, H.; Compernolle, S.; Glonti, K.; Oppert, J.M.; Charreire, H.; de Bourdeaudhuij, I.; Brug, J.; Nijpels, G.; Lakerveld, J. Obesogenic environments: A systematic review of the association between the physical environment and adult weight status, the spotlight project. BMC Public Health 2014. [Google Scholar] [CrossRef]
- Li, X.; Memarian, E.; Sundquist, J.; Zoller, B.; Sundquist, K. Neighbourhood deprivation, individual-level familial and socio-demographic factors and diagnosed childhood obesity: A nationwide multilevel study from sweden. Obes. Facts 2014, 7, 253–263. [Google Scholar] [PubMed]
- El-Sayed, A.M.; Scarborough, P.; Galea, S. Socioeconomic inequalities in childhood obesity in the United kingdom: A systematic review of the literature. Obes. Facts 2012, 5, 671–692. [Google Scholar] [CrossRef] [PubMed]
- Navalpotro, L.; Regidor, E.; Ortega, P.; Martinez, D.; Villanueva, R.; Astasio, P. Area-based socioeconomic environment, obesity risk behaviours, area facilities and childhood overweight and obesity: Socioeconomic environment and childhood overweight. Prev. Med. 2012, 55, 102–107. [Google Scholar] [CrossRef] [PubMed]
- Jansen, P.W.; Mensah, F.K.; Nicholson, J.M.; Wake, M. Family and neighbourhood socioeconomic inequalities in childhood trajectories of bmi and overweight: Longitudinal study of australian children. PLoS One 2013. [Google Scholar] [CrossRef]
- Burdette, H.L.; Whitaker, R.C. Neighborhood playgrounds, fast food restaurants, and crime: Relationships to overweight in low-income preschool children. Prev. Med. 2004, 38, 57–63. [Google Scholar] [CrossRef] [PubMed]
- Burdette, H.L.; Whitaker, R.C. A national study of neighborhood safety, outdoor play, television viewing, and obesity in preschool children. Pediatrics 2005, 116, 657–662. [Google Scholar] [CrossRef] [PubMed]
- Timperio, A.; Salmon, J.; Telford, A.; Crawford, D. Perceptions of local neighbourhood environments and their relationship to childhood overweight and obesity. Int. J. Obes. 2005, 29, 170–175. [Google Scholar] [CrossRef]
- Nogueira, H.; Ferrao, M.; Gama, A.; Mourao, I.; Rosado Marques, V.; Padez, C. Perceptions of neighborhood environments and childhood obesity: Evidence of harmful gender inequities among portuguese children. Health Place 2013, 19, 69–73. [Google Scholar] [CrossRef] [PubMed]
- Singh, G.K.; Siahpush, M.; Kogan, M.D. Neighborhood socioeconomic conditions, built environments, and childhood obesity. Health Affair. 2010, 29, 503–512. [Google Scholar] [CrossRef]
- Spence, J.C.; Cutumisu, N.; Edwards, J.; Evans, J. Influence of neighbourhood design and access to facilities on overweight among preschool children. Int. J. Pediatr. Obes. 2008, 3, 109–116. [Google Scholar] [CrossRef] [PubMed]
- Dunton, G.F.; Kaplan, J.; Wolch, J.; Jerrett, M.; Reynolds, K.D. Physical environmental correlates of childhood obesity: A systematic review. Obes. Rev. 2009, 10, 393–402. [Google Scholar] [CrossRef] [PubMed]
- Kimbro, R.T.; Brooks-Gunn, J.; McLanahan, S. Young children in urban areas: Links among neighborhood characteristics, weight status, outdoor play, and television watching. Soc. Sci. Med. 2011, 72, 668–676. [Google Scholar] [CrossRef] [PubMed]
- Donatiello, E.; Dello Russo, M.; Formisano, A.; Lauria, F.; Nappo, A.; Reineke, A.; Sparano, S.; Barba, G.; Russo, P.; Siani, A. Physical activity, adiposity and urbanization level in children: Results for the italian cohort of the idefics study. Public Health 2013, 127, 761–765. [Google Scholar] [CrossRef] [PubMed]
- Lovasi, G.S.; Jacobson, J.S.; Quinn, J.W.; Neckerman, K.M.; Ashby-Thompson, M.N.; Rundle, A. Is the environment near home and school associated with physical activity and adiposity of urban preschool children? J. Urban Health 2011, 88, 1143–1157. [Google Scholar] [CrossRef] [PubMed]
- Martinez, S.M.; Blanco, E.; Delva, J.; Burrows, R.; Reyes, M.; Lozoff, B.; Gahagan, S. Perception of neighborhood crime and drugs increases cardiometabolic risk in chilean adolescents. J. Adolescent Health 2014, 54, 718–723. [Google Scholar] [CrossRef]
- Dollman, J.; Ridley, K.; Magarey, A.; Martin, M.; Hemphill, E. Dietary intake, physical activity and tv viewing as mediators of the association of socioeconomic status with body composition: A cross-sectional analysis of australian youth. Int. J. Obes. 2007, 31, 45–52. [Google Scholar] [CrossRef]
- Schmidt, M.D.; Dwyer, T.; Magnussen, C.G.; Venn, A.J. Predictive associations between alternative measures of childhood adiposity and adult cardio-metabolic health. Int. J. Obes. 2011, 35, 38–45. [Google Scholar] [CrossRef]
- Savva, S.C.; Lamnisos, D.; Kafatos, A.G. Predicting cardiometabolic risk: Waist-to-height ratio or BMI. A meta-analysis. Diabetes Metab. Syndr. Obes. 2013, 6, 403–419. [Google Scholar] [CrossRef] [PubMed]
- Khoury, M.; Manlhiot, C.; McCrindle, B.W. Role of the waist/height ratio in the cardiometabolic risk assessment of children classified by body mass index. J. Amer. Coll. Cardiol. 2013, 62, 742–751. [Google Scholar] [CrossRef]
- Going, S.B.; Lohman, T.G.; Cussler, E.C.; Williams, D.P.; Morrison, J.A.; Horn, P.S. Percent body fat and chronic disease risk factors in U.S. Children and youth. Amer. J. Prev. Med. 2011, 41, 77–86. [Google Scholar] [CrossRef]
- Bammann, K.; Gwozdz, W.; Lanfer, A.; Barba, G.; De Henauw, S.; Eiben, G.; Fernandez-Alvira, J.M.; Kovacs, E.; Lissner, L.; Moreno, L.A.; et al. Socioeconomic factors and childhood overweight in europe: Results from the multi-centre idefics study. Pediat. Obes. 2013, 8, 1–12. [Google Scholar] [CrossRef]
- Feng, J.; Glass, T.A.; Curriero, F.C.; Stewart, W.F.; Schwartz, B.S. The built environment and obesity: A systematic review of the epidemiologic evidence. Health Place 2010, 16, 175–190. [Google Scholar] [CrossRef] [PubMed]
- Ball, K.; Timperio, A.F.; Crawford, D.A. Understanding environmental influences on nutrition and physical activity behaviors: Where should we look and what should we count? Int. J. Behav. Nutri. Phys. Activ. 2006. [Google Scholar] [CrossRef]
- Van Eijsden, M.; Vrijkotte, T.G.; Gemke, R.J.; van der Wal, M.F. Cohort profile: The Amsterdam born children and their development (abcd) study. Int. J. Epidemiol. 2011, 40, 1176–1186. [Google Scholar] [CrossRef] [PubMed]
- SCP. Statusscores. Available online: http://www.scp.nl/Onderzoek/Lopend_onderzoek/A_Z_alle_lopende_onderzoeken/Statusscores (accessed on 5 November 2014).
- SCP. About SCP. Available online: http://www.scp.nl/english/Organisation/About_SCP (accessed on 4 November 2014).
- Kramer, D.; Maas, J.; Wingen, M.; Kunst, A.E. Neighbourhood safety and leisure-time physical activity among dutch adults: A multilevel perspective. Int. J. Behav. Nutri. Phys. Activ. 2013. [Google Scholar] [CrossRef]
- Kuipers, M.A.; van Poppel, M.N.; van den Brink, W.; Wingen, M.; Kunst, A.E. The association between neighborhood disorder, social cohesion and hazardous alcohol use: A national multilevel study. Drug Alcohol Dependence 2012, 126, 27–34. [Google Scholar] [CrossRef] [PubMed]
- Janssen, S. Huisvestiging Variabelen Woon 2009; Centraal Bureau voor de Statistiek: Heerlen, The Netherlands, 2009. [Google Scholar]
- Van Dijk, A.E.; van Eijsden, M.; Stronks, K.; Gemke, R.J.; Vrijkotte, T.G. Cardio-metabolic risk in 5-year-old children prenatally exposed to maternal psychosocial stress: The abcd study. BMC Public Health 2010. [Google Scholar] [CrossRef]
- De Hoog, M.L.; van Eijsden, M.; Stronks, K.; Gemke, R.J.; Vrijkotte, T.G. The role of infant feeding practices in the explanation for ethnic differences in infant growth: The amsterdam born children and their development study. Brit. J. Nutr. 2011, 106, 1592–1601. [Google Scholar] [CrossRef] [PubMed]
- Hof, M.H.; van Dijk, A.E.; van Eijsden, M.; Vrijkotte, T.G.; Zwinderman, A.H. Comparison of growth between native and immigrant infants between 0–3 years from the dutch abcd cohort. Ann. Hum. Biol. 2011, 38, 544–555. [Google Scholar] [CrossRef] [PubMed]
- De Beer, M.; Timmers, T.; Weijs, P.J.M.; Gemke, R.J.B.J. Validation of total body water analysis by bioeletrical impedance analysis with deuterium dilution in (pre)school children. Eur. J. Clin. Nutr. Metab. 2011, 6, 223–226. [Google Scholar] [CrossRef]
- Weng, S.F.; Redsell, S.A.; Swift, J.A.; Yang, M.; Glazebrook, C.P. Systematic review and meta-analyses of risk factors for childhood overweight identifiable during infancy. Arch. Dis. Child. 2012, 97, 1019–1026. [Google Scholar] [CrossRef] [PubMed]
- CBS. Bevolking en Huishoudens; Viercijferige Postcode, 1 Januari 2009. Available online: http://statline.cbs.nl/Statweb/publication/?DM=SLNL&PA=80280NED&D1=0,21,42,63-72&D2=0-71,73-81,4075,4368&HDR=T&STB=G1&VW=T (accessed on 27 February 2015).
- Veldhuizen, E.M.; Stronks, K.; Kunst, A.E. Assessing associations between socio-economic environment and self-reported health in amsterdam using bespoke environments. PLoS One 2013. [Google Scholar] [CrossRef]
- Tromp, M.; van Eijsden, M.; Ravelli, A.C.; Bonsel, G.J. Anonymous non-response analysis in the abcd cohort study enabled by probabilistic record linkage. Paediatr. Perinat. Epidemiol. 2009, 23, 264–272. [Google Scholar] [CrossRef] [PubMed]
- CBS. Onderzoeksverantwoording WoON 2009: Dataverzameling Woningmarktmodule Versie 2.1. Available online: http://www.datawonen.nl/disco/info/woon12/2012/Doc/OnderzoeksdocumentatieWoON2012_dataprocessing.pdf (accessed on 27 February 2015).
- Chivers, P.; Hands, B.; Parker, H.; Beilin, L.; Kendall, G.; Bulsara, M. Longitudinal modelling of body mass index from birth to 14 years. Obes. Facts 2009, 2, 302–310. [Google Scholar] [CrossRef] [PubMed]
© 2015 by the authors; licensee MDPI, Basel, Switzerland. This article is an open access article distributed under the terms and conditions of the Creative Commons Attribution license (http://creativecommons.org/licenses/by/4.0/).
Share and Cite
Hrudey, E.J.; Kunst, A.E.; Stronks, K.; Vrijkotte, T.G.M. Do Neighborhood Characteristics in Amsterdam Influence Adiposity at Preschool Age? Int. J. Environ. Res. Public Health 2015, 12, 5561-5580. https://doi.org/10.3390/ijerph120505561
Hrudey EJ, Kunst AE, Stronks K, Vrijkotte TGM. Do Neighborhood Characteristics in Amsterdam Influence Adiposity at Preschool Age? International Journal of Environmental Research and Public Health. 2015; 12(5):5561-5580. https://doi.org/10.3390/ijerph120505561
Chicago/Turabian StyleHrudey, E. Jessica, Anton E. Kunst, Karien Stronks, and Tanja G.M. Vrijkotte. 2015. "Do Neighborhood Characteristics in Amsterdam Influence Adiposity at Preschool Age?" International Journal of Environmental Research and Public Health 12, no. 5: 5561-5580. https://doi.org/10.3390/ijerph120505561
APA StyleHrudey, E. J., Kunst, A. E., Stronks, K., & Vrijkotte, T. G. M. (2015). Do Neighborhood Characteristics in Amsterdam Influence Adiposity at Preschool Age? International Journal of Environmental Research and Public Health, 12(5), 5561-5580. https://doi.org/10.3390/ijerph120505561