
Unraveling Health Risk and Speciation of Arsenic from Groundwater in Rural Areas of Punjab, Pakistan


 ,
, 


Abstract
:1. Introduction
2. Experimental Section
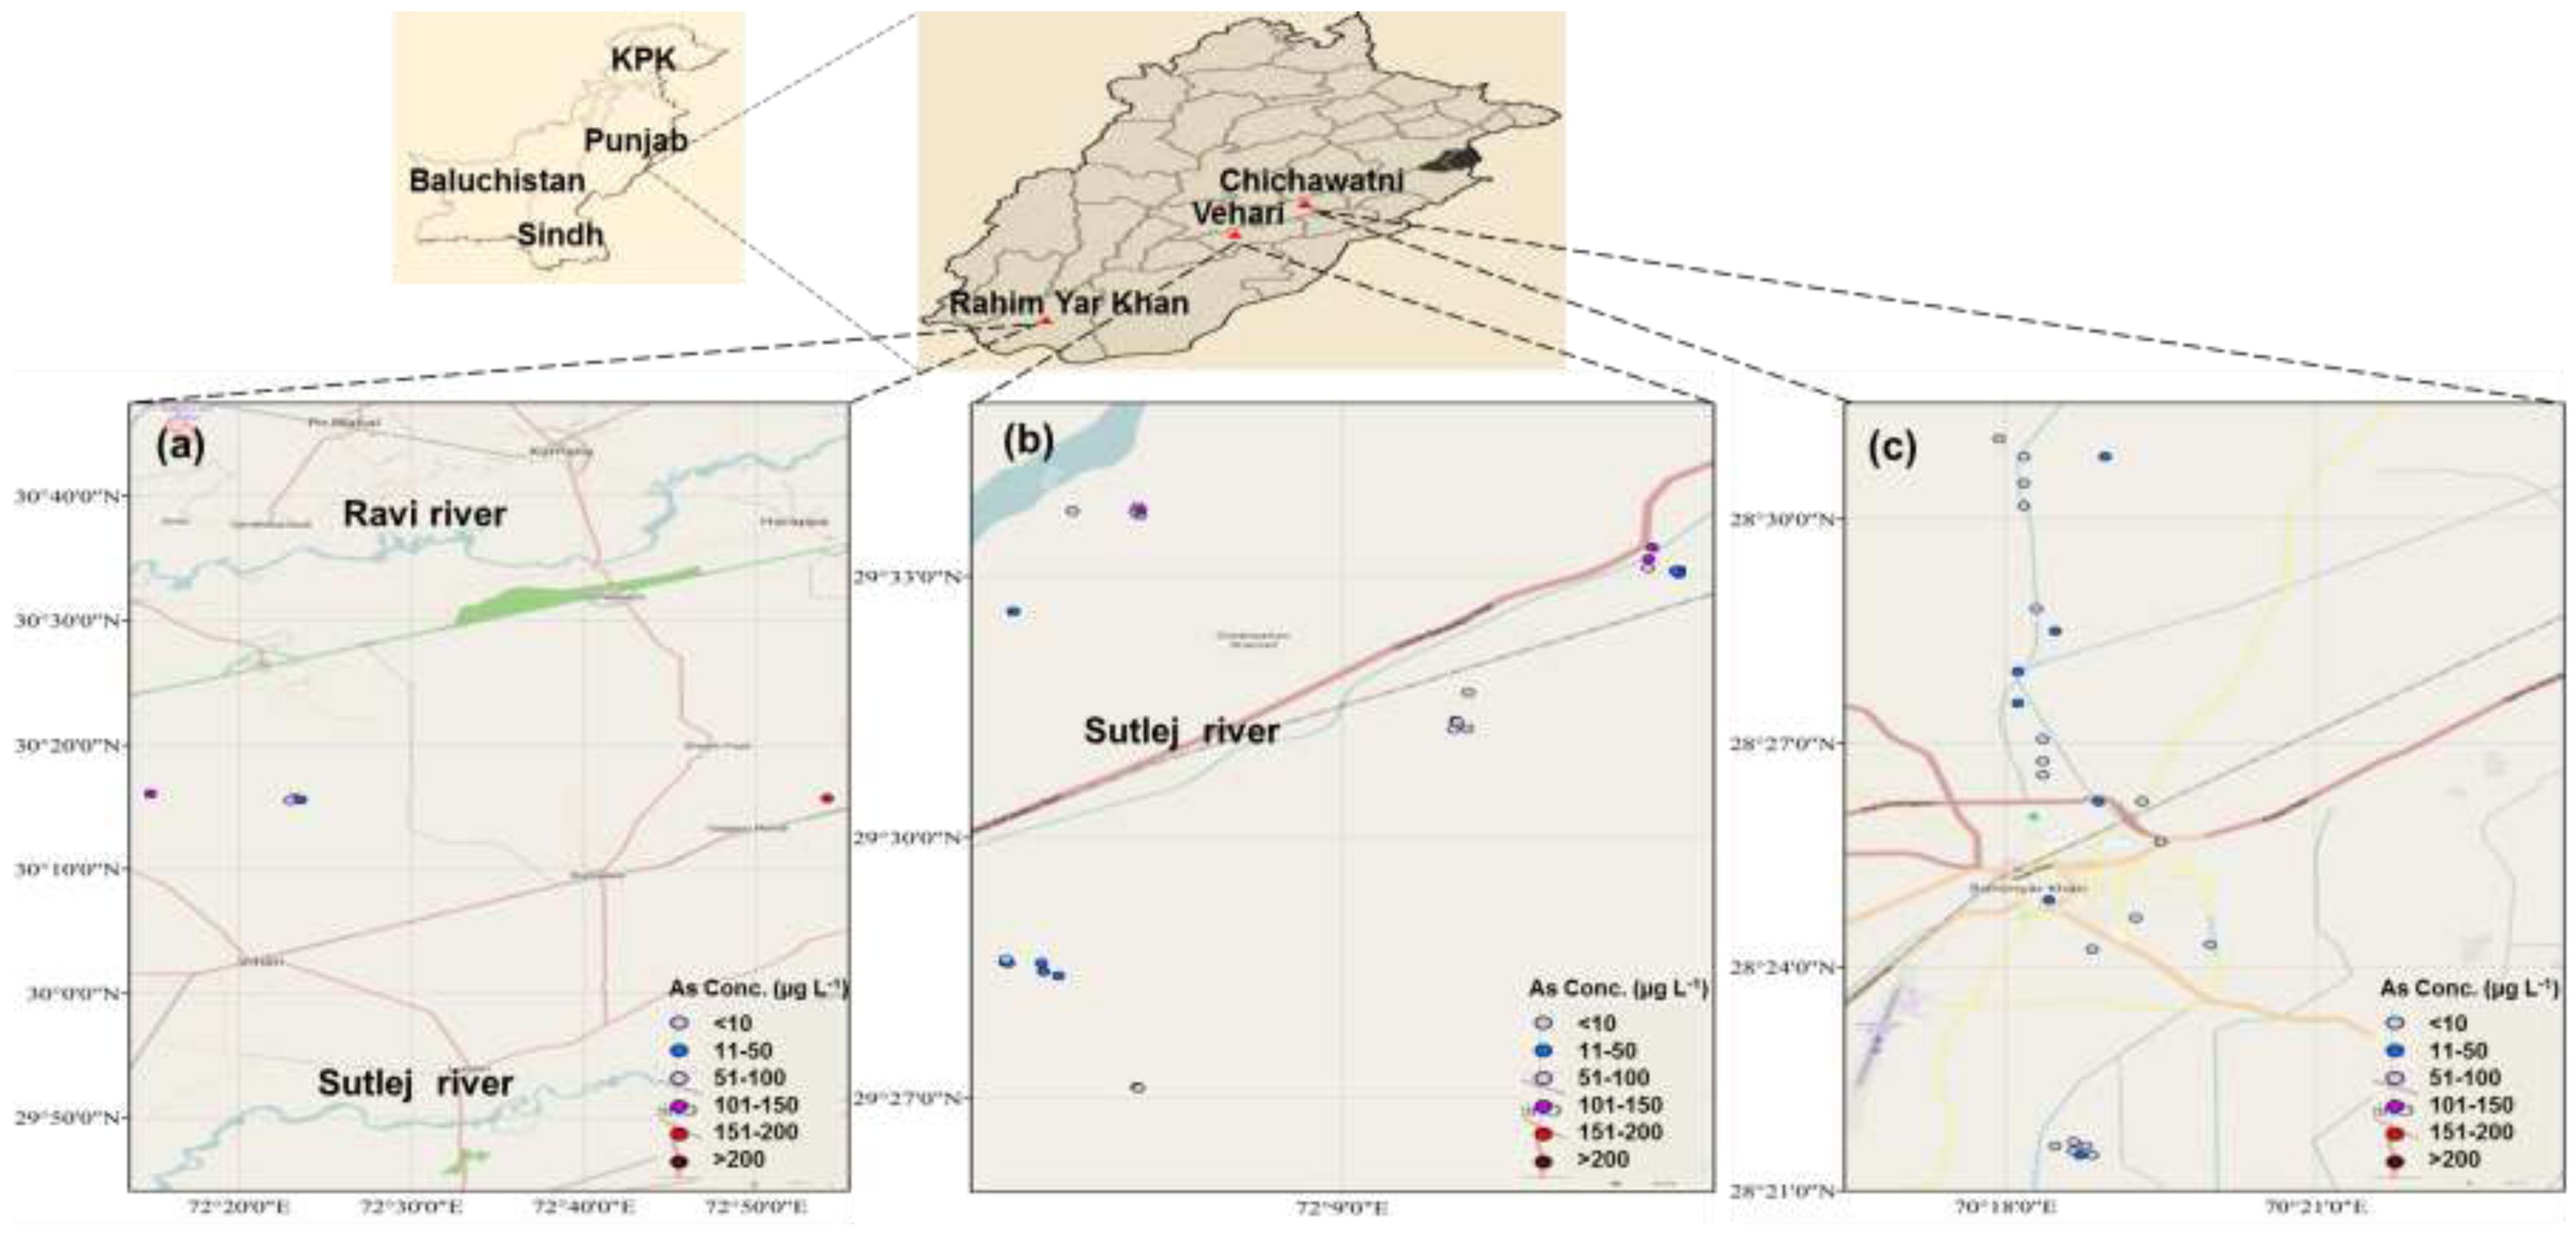
2.1. Topography
2.2. Groundwater Sampling

2.3. Analytical Methods
2.4. Quality Control
2.5. Water Consumption Patterns of People in the Study Area
2.6. Human Health Risk Assessment
2.6.1. Exposure Assessment
- C = Concentration of As in water (mg·L−1)
- IR = Water ingestion rate (L·day−1)
- ED = Exposure duration (assumed 67 years to make a comparison with previous studies from Pakistan and other countries)
- EF = Exposure frequency (365 days year−1)
- BW = Body weight (72 kg) [27]
- AT= Average life time (24,455 days)
2.6.2. Human Health Risk Assessment
2.7. Carcinogenic and Non-Carcinogenic Risk
2.8. Statistical Analysis
3. Results and Discussion
3.1. Total and Speciated As Contents

| Parameter | Chichawatni (CW, n = 8) | Vehari (Vh, n = 28) | Rahim Yar Khan (RYK, n = 26) | |||||||||
|---|---|---|---|---|---|---|---|---|---|---|---|---|
| Mean | Median | Range | S.D (±) | Mean | Median | Range | S.D (±) | Mean | Median | Range | S.D (±) | |
| As (µg·L−1) | 95 | 90 | 23–201 | 60.52 | 41.5 | 22.12 | 1.5–144 | 45.61 | 9.2 | 6 | 1.66–31 | 8 |
| pH | 6.84 | 7.4 | 2.83–7.98 | 1.65 | 7.36 | 7.52 | 3.01–8.06 | 0.87 | 7.6 | 7.7 | 6.9–8.35 | 0.4 |
| EC (dS·cm−1) | 0.17 | 0.16 | 0.14–0.3 | 0.05 | 0.1 | 0.08 | 0.03–0.5 | 0.08 | 0.08 | 0.06 | 0.02–0.34 | 0.07 |
| Ca hardness | 168 | 157 | 91–277 | 61 | 152 | 145 | 73–230 | 45.6 | 152 | 90 | 35–569 | 130 |
| Mg hardness | 148 | 152 | 80–188 | 39 | 115.5 | 105 | 12–260 | 54 | 138 | 109 | 36–339 | 93.5 |
| Total hardness | 316 | 330 | 171–461 | 91 | 268 | 254 | 85–474 | 90 | 291 | 207 | 72–908 | 213 |
| TDS | 1.77 | 1.65 | 1.44–2.82 | 0.46 | 1 | 0.8 | 0.3–5 | 0.83 | 0.8 | 0.7 | 0.23–3.35 | 0.7 |
| SAR | 5.6 | 7 | 0.006–9 | 2.8 | 2.5 | 2.2 | 0.35–6.4 | 1.3 | 4.6 | 2.9 | 0.7–16 | 4 |
| CO32− (mg·L−1) | 26.4 | 26.4 | 19–36 | 5.9 | 25.5 | 19.2 | 7.2–108 | 23.5 | 33.6 | 28.8 | 7.2–85.2 | 20.2 |
| HCO3− (mg·L−1) | 104.62 | 75.6 | 52.5–215 | 63.7 | 95 | 72.59 | 33–277 | 63 | 56.2 | 50.6 | 9.8–133 | 26.8 |
| NO3− (mg·L−1) | 1189 | 1110.6 | 632.5–2229 | 490 | 1395 | 1457 | 0–2365 | 581 | 2250.1 | 2275.3 | 0–5370 | 1309.9 |
| SO42− (mg·L−1) | 1002 | 935.5 | 751–1447 | 240.7 | 277 | 223.95 | 0–752 | 170 | 261.3 | 180.2 | 20.4–1082 | 252.9 |
| Cl− (mg·L−1) | 194 | 183.5 | 69–381 | 100 | 92 | 88.75 | 7–218 | 50.5 | 244.2 | 156.6 | 39–902 | 220.2 |
| F (mg·L−1) | 0 | 0 | 0 | 0 | 0.004 | 0 | 0–0.09 | 0.02 | 0.002 | 0 | 0–0.045 | 0.009 |
| Sample Name | As(III) (%) | As(V) (%) |
|---|---|---|
| CW1 | 29 | 71 |
| CW2 | 40 | 60 |
| CW3 | 33 | 67 |
| CW4 | 48 | 52 |
| CW5 | 46 | 54 |
| CW8 | 55 | 45 |
| Vh21 | 0 | 100 |
| Vh22 | 43 | 57 |
| Vh28 | 0 | 100 |
| Vh34 | 17 | 83 |
| RYK42 | 67 | 33 |
| RYK55 | 34 | 66 |
| RYK56 | 13 | 87 |

3.2. Groundwater Composition/Chemistry
3.3. Trace Elements
3.4. Health Risk Assessment of As Via Drinking Water
3.4.1. Potential Health Risk Assessment
3.4.2. Exposure Assessment and Cancer Risk Assessment
| Parameter | Chichawatni (CW, n = 8) | Vehari (Vh, n = 28) | Rahim Yar Khan (RYK, n = 26) | |||||||||
|---|---|---|---|---|---|---|---|---|---|---|---|---|
| Mean | Median | Range | S.D (±) | Mean | Median | Range | S.D (±) | Mean | Median | Range | S.D (±) | |
| Fe (mg·L−1) | 0.19 | 0.14 | 0.11–0.6 | 0.15 | 0.27 | 0.13 | 0.1–2 | 0.42 | 0.2 | 0.2 | 0.01–0.6 | 0.1 |
| Cr (mg·L−1) | 0.001 | 0.0009 | 0.0003–0.002 | 0.0004 | 0.0007 | 0.0006 | 0–0.001 | 0.0003 | 0.0008 | 0.001 | 0.0003–0.002 | 0.0003 |
| Si (mg·L−1) | 8.21 | 8.3 | 6.4–10 | 1.1 | 8.5 | 8.64 | 5–10.3 | 1.2 | 9 | 8.8 | 3.9–17.5 | 2.8 |
| P (mg·L−1) | 0.01 | 0.007 | 0–0.04 | 0.02 | 0.0007 | 0 | 0–0.007 | 0.001 | 0.006 | 0 | 0–0.07 | 0.01 |
| B (mg·L−1) | 0.5 | 0.55 | 0.13–0.7 | 0.2 | 0.2 | 0.17 | 0.04–0.5 | 0.1 | 0.3 | 0.2 | 0.06–1.4 | 0.3 |
| Al (mg·L−1) | 0.004 | 0.001 | 0.00008–0.02 | 0.009 | 0.004 | 0.0006 | 0–0.03 | 0.001 | 0.0002 | 0.0001 | 0–0.001 | 0.0003 |
| Ca (mg·L−1) | 67 | 62.8 | 36–111 | 24.4 | 61 | 58 | 29.3–92 | 18.3 | 61.1 | 35.8 | 14.1–228 | 51.9 |
| Mg (mg·L−1) | 36 | 37 | 19.5–46 | 9.5 | 28 | 25.5 | 3–63 | 13 | 33.5 | 26.5 | 9–82 | 22.7 |
| Na (mg·L−1) | 308.5 | 364 | 0.3–398 | 132.5 | 117.7 | 110 | 10.2–271.5 | 58 | 246.9 | 125.9 | 27–1242 | 305.8 |
| K (mg·L−1) | 16.6 | 14.37 | 10.5–36 | 8 | 16 | 9 | 1.51–85.2 | 20.4 | 12.8 | 9.2 | 3.6–31 | 8.3 |
| Pb (mg·L−1) | 0.003 | 0.002 | 0.0008–0.006 | 0.002 | 0.003 | 0.002 | 0.0005–0.01 | 0.003 | 0.004 | 0.002 | 0.0008–0.02 | 0.004 |
| Cd (mg·L−1) | 0.0002 | 0.0001 | 0.00002–0.0004 | 0.0001 | 0.00005 | 0.00003 | 0–0.0002 | 0.00006 | 0.0001 | 0.00004 | 0–0.0006 | 0.0001 |
| Cu (mg·L−1) | 0.01 | 0.02 | 0.004–0.04 | 0.01 | 0.02 | 0.009 | 0.001–0.2 | 0.04 | 0.03 | 0.02 | 0.002–0.2 | 0.04 |
| Co (mg·L−1) | 0.0005 | 0.0005 | 0.0002–0.0008 | 0.0001 | 0.0006 | 0.0004 | 0.0001–0.002 | 0.0006 | 0.0004 | 0.0003 | 0–0.002 | 0.0003 |
| Ni (mg·L−1) | 0.006 | 0.005 | 0.002–0.01 | 0.002 | 0.005 | 0.004 | 0.001–0.009 | 0.001 | 0.006 | 0.006 | 0.002–0.02 | 0.004 |
| Zn (mg·L−1) | 0.2 | 0.11 | 0.02–0.4 | 0.12 | 0.15 | 0.05 | 0.01–2 | 0.4 | 0.3 | 0.2 | 0.05–1.5 | 0.3 |
| Mn (mg·L−1) | 0.22 | 0.2 | 0.05–0.5 | 0.12 | 0.24 | 0.24 | 0.02–0.8 | 0.2 | 0.1 | 0.1 | 0.004–0.25 | 0.1 |
| S (mg·L−1) | 176.5 | 177.5 | 106–226 | 39 | 53.55 | 49 | 6.3–128.3 | 31 | 137.4 | 59 | 13.7–827 | 192.1 |
| Parameter | Chichawati (CW, n = 8) | Vehari (Vh, n = 28) | Rahim Yar Khan (RYK, n = 26) | |
|---|---|---|---|---|
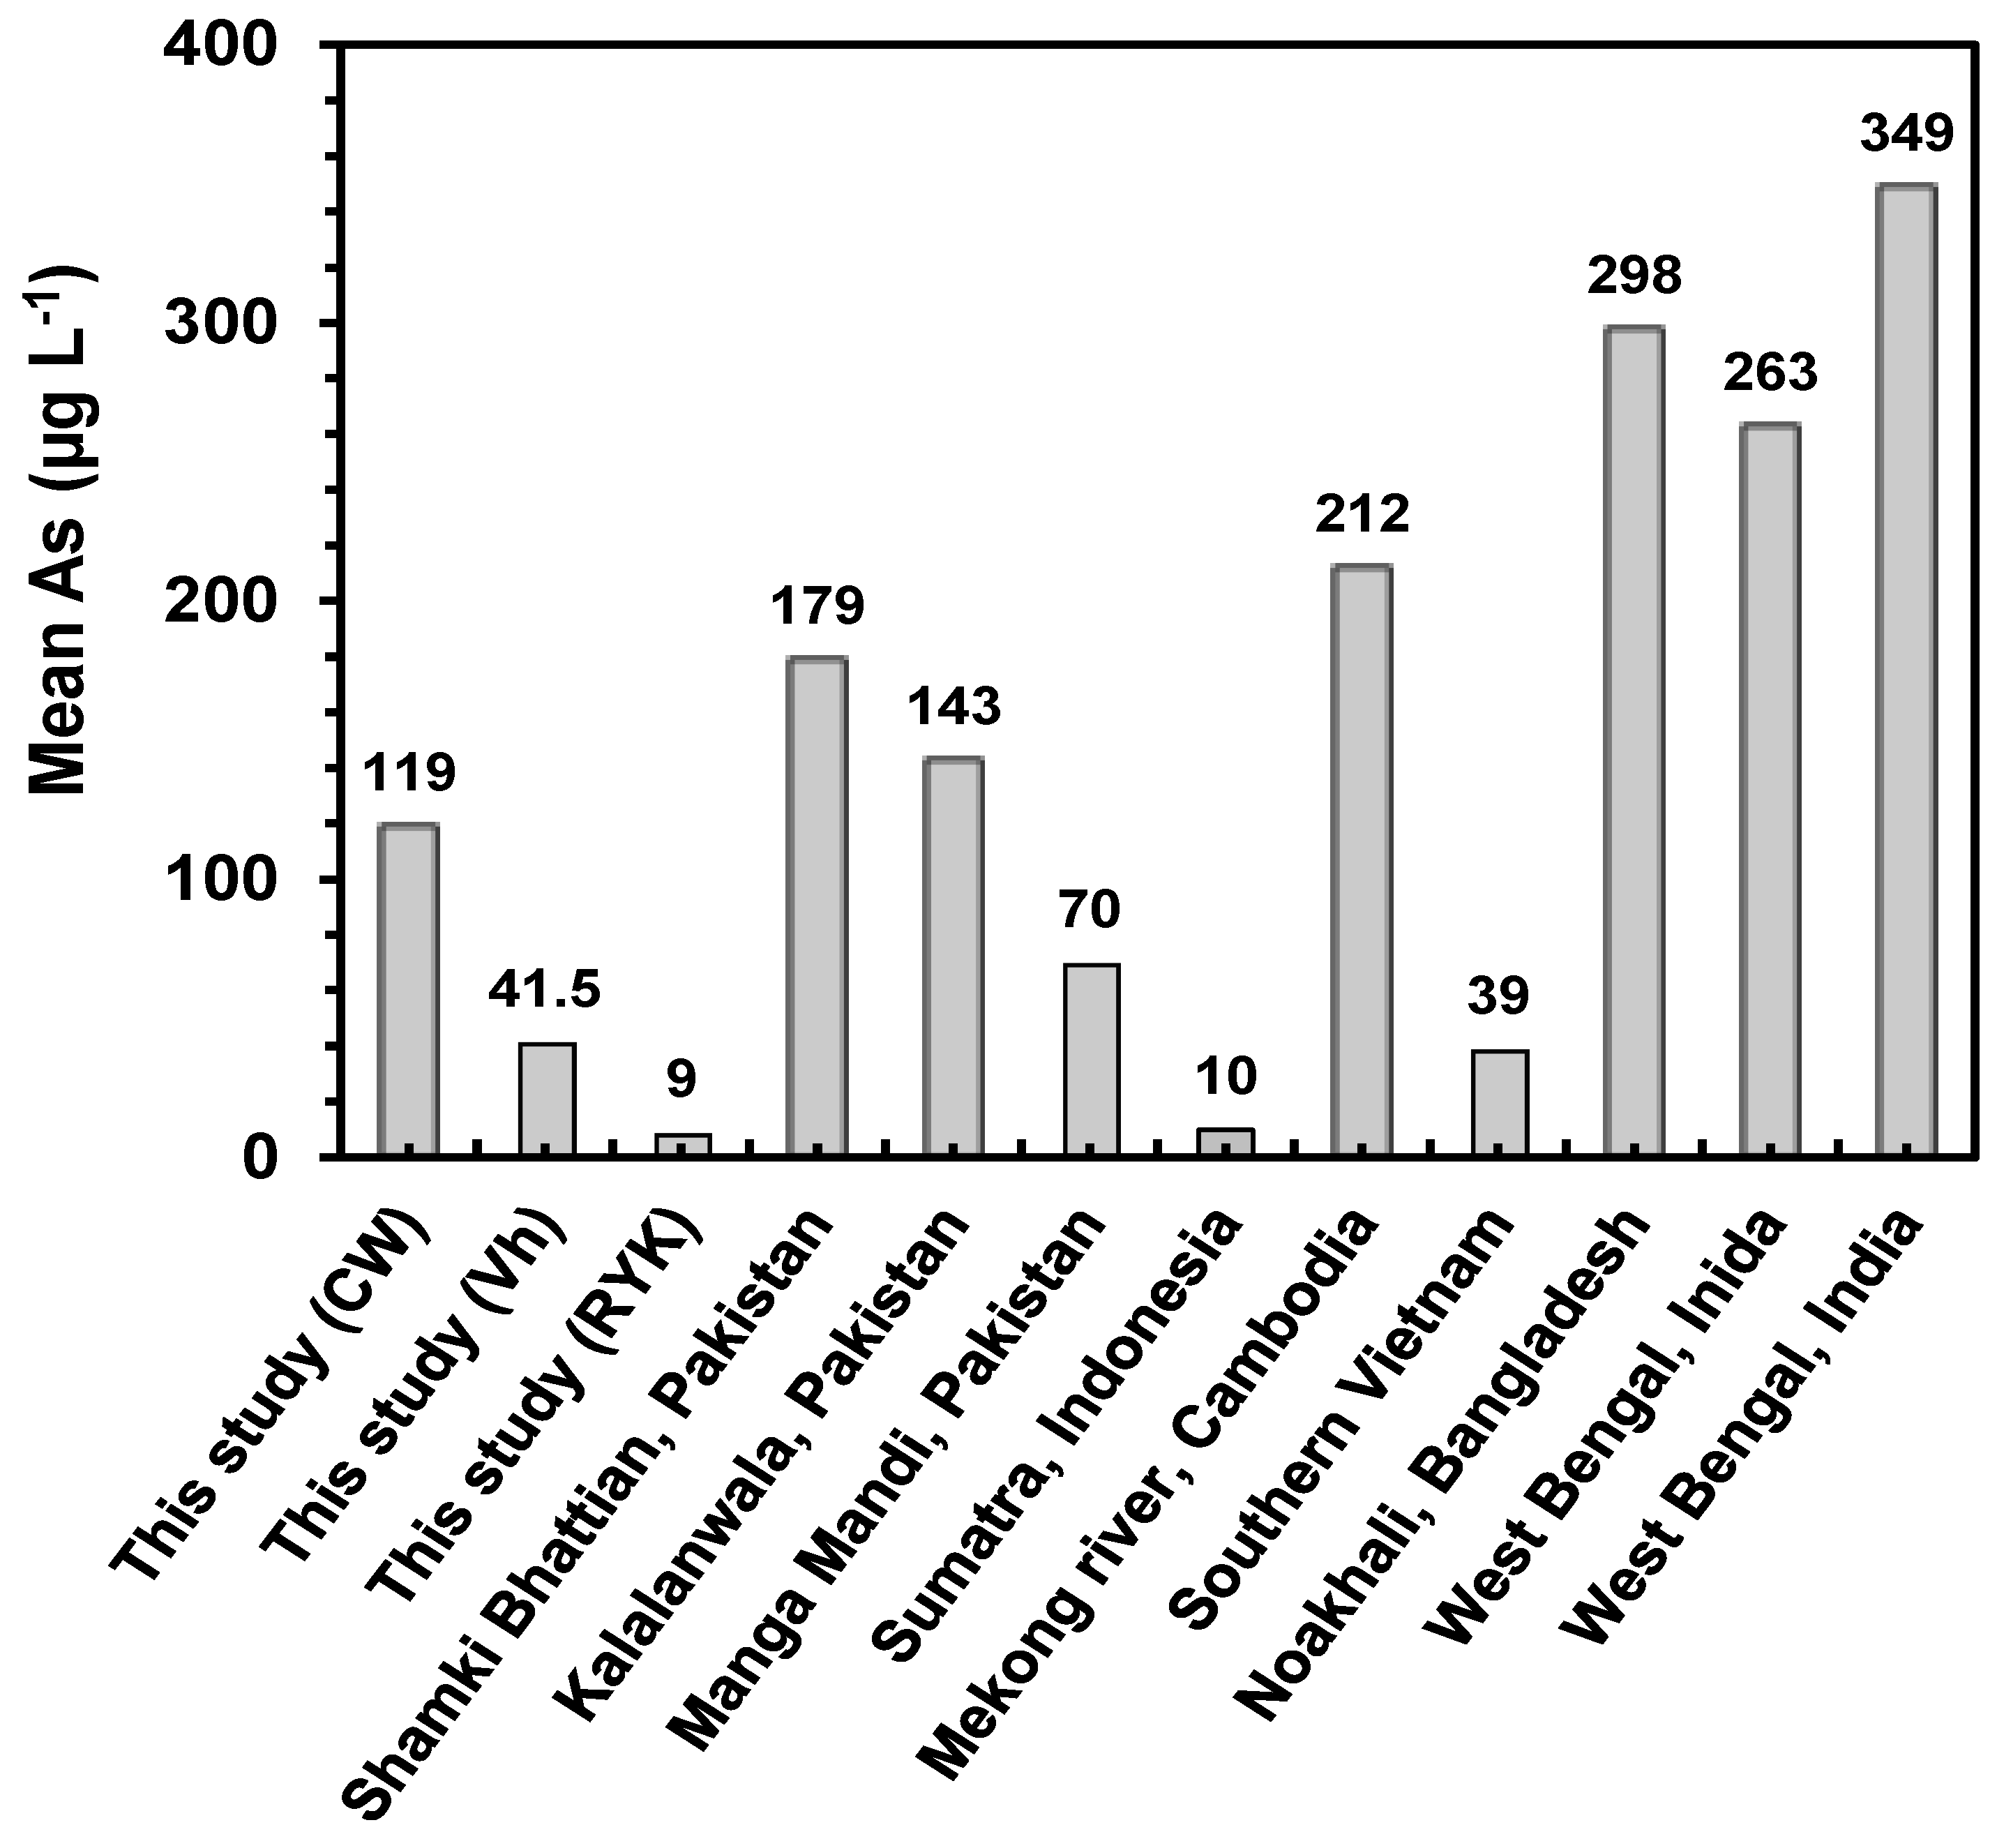
| As (µg·L−1) | Mean | 119 | 41.5 | 9.2 |
| Median | 118 | 22.12 | 6 | |
| Range | 23–201 | 1.33–144 | 1.66–31 | |
| SD (±) | 60.52 | 45.61 | 8 | |
| Average daily dose (mg−1·kg−1·day−1) | Mean | 3.3 × 10⁻³ | 1.1 × 10⁻² | 2.5 × 10⁻⁴ |
| Median | 3 × 10⁻³ | 6.2 × 10⁻⁴ | 1.6 × 10⁻⁴ | |
| Range | 6 × 10⁻⁴–5.6 × 10⁻³ | 3.69 × 10⁻⁵–4 × 10⁻³ | 4.62 × 10⁻⁵–8 × 10⁻⁴ | |
| ± S.D | 0.0017 | 0.0013 | 0.0003 | |
| Hazard quotient | Mean | 11.01 | 3.84 | 0.85 |
| Median | 10.88 | 2.05 | 0.55 | |
| Range | 2.16–18.58 | 0.13–13.36 | 0.15–2.87 | |
| ± S.D | 5.61 | 4.23 | 0.74 | |
| Carcinogenic risk | Mean | 0.005 | 0.0017 | 0.0004 |
| Median | 0.005 | 0.0009 | 0.0003 | |
| Range | 9 × 10⁻⁴–8.3 × 10⁻³ | 5.54 × 10⁻⁵–6 × 10⁻³ | 6.9 × 10⁻⁵–2 × 10⁻³ | |
| ± S.D | 0.0025 | 0.002 | 0.0003 |
3.5. Carcinogenic and Non-Carcinogenic Risks
4. Conclusions
Supplementary Files
Supplementary File 1Acknowledgments
Author Contributions
Conflicts of Interest
References
- IARC. Some drinking-water disinfectants and contaminants, including arsenic. IARC Monogr. Eval. Carcinog. Risks Hum. 2004, 84, 1–477. [Google Scholar]
- Gräfe, M.; Sparks, D.L. Solid phase speciation of arsenic. In Managing Arsenic in the Environment: From Soil to Human Health; CSIRO publishing: Victoria, Australia, 2006; Volume 3–31. [Google Scholar]
- Smedley, P.; Kinniburgh, D. A review of the source, behaviour and distribution of arsenic in natural waters. Appl. Geochem. 2002, 17, 517–568. [Google Scholar] [CrossRef]
- Rahman, M.M.; Ng, J.C.; Naidu, R. Chronic exposure of arsenic via drinking water and its adverse health impacts on humans. Environ. Geochem. Health 2009, 31, 189–200. [Google Scholar] [CrossRef] [PubMed]
- Gecol, H.; Ergican, E.; Fuchs, A. Molecular level separation of arsenic (V) from water using cationic surfactant micelles and ultrafiltration membrane. J. Memb. Sci. 2004, 241, 105–119. [Google Scholar] [CrossRef]
- Zaw, M.; Emett, M.T. Arsenic removal from water using advanced oxidation processes. Toxicol. Lett. 2002, 133, 113–118. [Google Scholar] [CrossRef]
- Niazi, N.K.; Singh, B.; van Zwieten, L.; Kachenko, A.G. Phytoremediation of an arsenic-contaminated site using Pteris vittata L. and Pityrogramma calomelanos var. austroamericana: A long-term study. Environ. Sci. Pollut. Res. 2012, 19, 3506–3515. [Google Scholar] [CrossRef] [PubMed]
- Ravenscroft, P.; Brammer, H.; Richards, K. Arsenic Pollution: A Global Synthesis; John Wiley & Sons: Oxford, UK, 2009; Volume 28. [Google Scholar]
- Rahman, M.M.; Naidu, R.; Bhattacharya, P. Arsenic contamination in groundwater in the Southeast Asia region. Environ. Geochem. Health 2009, 31, 9–21. [Google Scholar] [CrossRef] [PubMed]
- Naidu, R.; Smith, E.; Owens, G.; Bhattacharya, P.; Nadebum, P. Arsenic around the world—An overview. In Managing Arsenic in the Environment: From Soil to Human Health; CSIRO publishing: Victoria, Australia, 2006; Volume 3–31. [Google Scholar]
- WHO. Guidelines for Drinking Water Quality; World Health Organisarion: Geneva, Switzerland, 1996. [Google Scholar]
- Nickson, R.; McArthur, J.; Burgess, W.; Ahmed, K.M.; Ravenscroft, P.; Rahman, M. Arsenic poisoning of Bangladesh groundwater. Nature 1998, 395, 338–338. [Google Scholar] [CrossRef] [PubMed]
- Niazi, N.K.; Singh, B.; Minasny, B. Mid-infrared spectroscopy and partial least-squares regression to estimate soil arsenic at a highly variable arsenic-contaminated site. Int. J. Environ. Sci. Technol. 2015, 12, 1965–1974. [Google Scholar] [CrossRef]
- Chakraborti, D.; Rahman, M.M.; Das, B.; Murrill, M.; Dey, S.; Mukherjee, S.C.; Dhar, R.K.; Biswas, B.K.; Chowdhury, U.K.; Roy, S. Status of groundwater arsenic contamination in Bangladesh: A 14-year study report. Water Res. 2010, 44, 5789–5802. [Google Scholar] [CrossRef] [PubMed]
- Chakraborti, D.; Rahman, M.M.; Das, B.; Nayak, B.; Pal, A.; Sengupta, M.K.; Hossain, M.A.; Ahamed, S.; Sahu, M.; Saha, K.C. Groundwater arsenic contamination in Ganga-Meghna-Brahmaputra plain, its health effects and an approach for mitigation. Environ. Earth Sci. 2013, 70, 1993–2008. [Google Scholar] [CrossRef]
- Brammer, H.; Ravenscroft, P. Arsenic in groundwater: A threat to sustainable agriculture in South and South-east Asia. Environ. Int. 2009, 35, 647–654. [Google Scholar] [CrossRef] [PubMed]
- Sharma, P.; Goel, G.; Ashekuzzaman, S.M.; Saini, G.; Singh, R. Groundwater Arsenic in South-East Asia: Extent, Effects and Solutions. Asian J. Water Environ. Pollut. 2014, 11, 1–11. [Google Scholar]
- Wasserman, G.A.; Liu, X.; Parvez, F.; Ahsan, H.; Factor-Litvak, P.; van Geen, A.; Slavkovich, V.; Lolacono, N.J.; Cheng, Z.; Hussain, I. Water arsenic exposure and children’s intellectual function in Araihazar, Bangladesh. Environ. Health Persp. 2004, 112, 1329–1333. [Google Scholar] [CrossRef]
- Niazi, N.K.; Bishop, T.F.; Singh, B. Evaluation of spatial variability of soil arsenic adjacent to a disused cattle-dip site, using model-based geostatistics. Environ. Sci. Technol. 2011, 45, 10463–10470. [Google Scholar] [CrossRef] [PubMed]
- Caylak, E. Health risk assessment for arsenic in water sources of Cankiri Province of Turkey. CLEAN-Soil Air Water 2012, 40, 728–734. [Google Scholar] [CrossRef]
- Kavcar, P.N.; Sofuoglu, A.; Sofuoglu, S.C. A health risk assessment for exposure to trace metals via drinking water ingestion pathway. Int. J. Hyg. Environ. Health 2009, 212, 216–227. [Google Scholar] [CrossRef] [PubMed]
- Nguyen, V.A.; Bang, S.; Viet, P.H.; Kim, K.-W. Contamination of groundwater and risk assessment for arsenic exposure in Ha Nam province, Vietnam. Environ. Int. 2009, 35, 466–472. [Google Scholar] [CrossRef] [PubMed]
- Rahman, M.M.; Dong, Z.; Naidu, R. Concentrations of arsenic and other elements in groundwater of Bangladesh and West Bengal, India: Potential cancer risk. Chemosphere 2015, 139, 54–64. [Google Scholar] [CrossRef] [PubMed]
- USEPA. Guidelines for Carcinogen Risk Assessment; EPA/630/P-03/001F; Risk Assessment Forum: Washington, DC, USA, 2005.
- Muhammad, S.; Shah, M.T.; Khan, S. Arsenic health risk assessment in drinking water and source apportionment using multivariate statistical techniques in Kohistan region, northern Pakistan. Food Chem. Toxicol. 2010, 48, 2855–2864. [Google Scholar] [CrossRef] [PubMed]
- Arain, M.B.; Kazi, T.G.; Baig, J.A.; Jamali, M.K.; Afridi, H.I.; Shah, A.Q.; Jalbani, N.; Sarfraz, R.A. Determination of arsenic levels in lake water, sediment, and foodstuff from selected area of Sindh, Pakistan: Estimation of daily dietary intake. Food Chem. Toxicol. 2009, 47, 242–248. [Google Scholar] [CrossRef] [PubMed]
- Sultana, J.; Farooqi, A.; Ali, U. Arsenic concentration variability, health risk assessment, and source identification using multivariate analysis in selected villages of public water system, Lahore, Pakistan. Environ. Monit. Asess. 2014, 186, 1241–1251. [Google Scholar] [CrossRef] [PubMed]
- Nickson, R.T.; McArthur, J.M.; Shrestha, B.; Kyaw-Myint, T.O.; Lowry, D. Arsenic and other drinking water quality issues, Muzaffargarh District, Pakistan. Appl. Geochem. 2005, 20, 55–68. [Google Scholar] [CrossRef]
- Farooqi, A.; Masuda, H.; Firdous, N. Toxic fluoride and arsenic contaminated groundwater in the Lahore and Kasur districts, Punjab, Pakistan and possible contaminant sources. Environ. Pollut. 2007, 145, 839–849. [Google Scholar] [CrossRef] [PubMed]
- Farooqi, A.; Masuda, H.; Kusakabe, M.; Naseem, M.; Firdous, N. Distribution of highly arsenic and fluoride contaminated groundwater from east Punjab, Pakistan, and the controlling role of anthropogenic pollutants in the natural hydrological cycle. Geochem. J. 2007, 41, 213–234. [Google Scholar] [CrossRef]
- Farooqi, A.; Masuda, H.; Siddiqui, R.; Naseem, M. Sources of arsenic and fluoride in highly contaminated soils causing groundwater contamination in Punjab, Pakistan. Arch. Environ. Cont. Toxicol. 2009, 56, 693–706. [Google Scholar] [CrossRef] [PubMed]
- Sadun, A.A. Mitochondrial optic neuropathies. J. Neurol. Neurosurg. Psychiatry 2002, 72, 423–425. [Google Scholar] [PubMed]
- Baig, J.A.; Kazi, T.G.; Arain, M.B.; Afridi, H.I.; Kandhro, G.A.; Sarfraz, R.A.; Jamal, M.K.; Shah, A.Q. Evaluation of arsenic and other physico-chemical parameters of surface and ground water of Jamshoro, Pakistan. J. Haz. Mat. 2009, 166, 662–669. [Google Scholar] [CrossRef] [PubMed]
- Kumar, P.J.S.; James, E.J. Physicochemical parameters and their sources in groundwater in the Thirupathur region, Tamil Nadu, South India. Appl. Water Sci. 2013, 3, 219–228. [Google Scholar] [CrossRef]
- Brahman, K.D.; Kazi, T.G.; Afridi, H.I.; Naseem, S.; Arain, S.S.; Ullah, N. Evaluation of high levels of fluoride, arsenic species and other physicochemical parameters in underground water of two sub districts of Tharparkar, Pakistan: A multivariate study. Water Res. 2013, 47, 1005–1020. [Google Scholar] [CrossRef] [PubMed]
- Basharat, M. Spatial and Temporal Appraisal of Groundwater Depth and Quality in LBDC Command-Issues and Options. Pak. J. Engg. Appl. Sci. 2012, 11, 14–29. [Google Scholar]
- Pakistan-Punjab Municipal Service Improvement Project: Resettlement Action Plan. Available online: http://documents.shihang.org/curated/zh/2010/03/14102002/pakistan-punjab-municipal-services-improvement-project-resettlement-action-plan (accessed on 12 February 2015).
- Khan, F.M. Participatory appraisal and scanning surveillance based contagious diseases risk profile of district Rahim Yar Khan (Pakistan). Pak. Vet. J. 2010, 30, 198–202. [Google Scholar]
- Khan, S.; Shahnaz, M.; Jehan, N.; Rehman, S.; Shah, M.T.; Din, I. Drinking water quality and human health risk in Charsadda district, Pakistan. J. Clean. Prod. 2013, 60, 93–101. [Google Scholar] [CrossRef]
- Bednar, A.J.; Garbarino, J.R.; Ranville, J.F.; Wildeman, T.R. Preserving the distribution of inorganic arsenic species in groundwater and acid mine drainage samples. Environ. Sci. Technol. 2002, 36, 2213–2218. [Google Scholar] [CrossRef] [PubMed]
- Reitemeier, R. Semimicroanalysis of saline soil solutions. Indust. Eng. Chem. Analyt. Ed. 1943, 15, 393–402. [Google Scholar] [CrossRef]
- Spellman, F.R. Handbook of Water and Wastewater Treatment Plant Operations; CRC Press: New York, NY, USA, 2013. [Google Scholar]
- Brahman, K.D.; Kazi, T.G.; Baig, J.A.; Afridi, H.I.; Khan, A.; Arain, S.S.; Arain, M.B. Fluoride and arsenic exposure through water and grain crops in Nagarparkar, Pakistan. Chemosphere 2014, 100, 182–189. [Google Scholar] [CrossRef] [PubMed]
- Kazi, T.G.; Arain, M.B.; Baig, J.A.; Jamali, M.K.; Afridi, H.I.; Jalbani, N.; Sarfraz, R.A.; Shah, A.Q.; Niaz, A. The correlation of arsenic levels in drinking water with the biological samples of skin disorders. Sci. Total Environ. 2009, 407, 1019–1026. [Google Scholar] [CrossRef] [PubMed]
- Rahman, M.; Asaduzzaman, M.; Naidu, R. Arsenic Exposure from Rice and Water Sources in the Noakhali District of Bangladesh. Water Qual. Expo. Health 2011, 3, 1–10. [Google Scholar] [CrossRef]
- Mondal, D.; Banerjee, M.; Kundu, M.; Banerjee, N.; Bhattacharya, U.; Giri, A.K.; Ganguli, B.; Roy, S.S.; Polya, D.A. Comparison of drinking water, raw rice and cooking of rice as arsenic exposure routes in three contrasting areas of West Bengal, India. Environ. Geochem. Health 2010, 32, 463–477. [Google Scholar] [CrossRef] [PubMed]
- USEPA Arsenic, inorganic. United States Environmental Protection Agency, Integrated Risk Information System (IRIS), (CASRN 7440-38-2). 1998. Available online: http://www.epa.gov/iris/subst/0278.htm (accessed on 12 February 2015).
- IRIS. Arsenic, Integrated Risk Information System. U.S. Environmental Protection Agency: Washington, DC, USA, 2007. Available online: http://www.epa.gov/iris/subst/index.html (accessed on 12 February 2015). [Google Scholar]
- Basu, A.; Saha, D.; Saha, R.; Ghosh, T.; Saha, B. A review on sources, toxicity and remediation technologies for removing arsenic from drinking water. Res. Chem. Intermed. 2014, 40, 447–485. [Google Scholar] [CrossRef]
- Mahimairaja, S.; Bolan, N.S.; Adriano, D.; Robinson, B. Arsenic contamination and its risk management in complex environmental settings. Adv. Aron. 2005, 86, 1–82. [Google Scholar]
- Winkel, L.; Berg, M.; Stengel, C.; Rosenberg, T. Hydrogeological survey assessing arsenic and other groundwater contaminants in the lowlands of Sumatra, Indonesia. Appl. Geochem. 2008, 23, 3019–3028. [Google Scholar] [CrossRef]
- Buschmann, J.; Berg, M.; Stengel, C.; Sampson, M.L. Arsenic and manganese contamination of drinking water resources in Cambodia: Coincidence of risk areas with low relief topography. Environ. Sci. Technol. 2007, 41, 2146–2152. [Google Scholar] [CrossRef] [PubMed]
- Adams, S.; Titus, R.; Pietersen, K.; Tredoux, G.; Harris, C. Hydrochemical characteristics of aquifers near Sutherland in the Western Karoo, South Africa. J. Hydrol. 2001, 241, 91–103. [Google Scholar] [CrossRef]
- Schettler, G.; Oberhansli, H.; Stulina, G.; Mavlonov, A.A.; Naumann, R. Hydrochemical water evolution in the Aral Sea Basin. Part I: Unconfined groundwater of the Amu Darya Delta—Interactions with surface waters. J. Hydrol. 2013, 495, 267–284. [Google Scholar] [CrossRef]
- Ayers, R.S.; Westcot, D.W. Water Quality for Agriculture; FAO: Rome, Italy, 1985; Volume 29. [Google Scholar]
- Rasool, A.; Farooqi, A.; Masood, S.; Hussain, K. Arsenic in groundwater and its health risk assessment in drinking water of Mailsi, Punjab, Pakistan. Hum. Ecol. Risk Assess Int. J. 2015. [Google Scholar] [CrossRef]
- Tuakuila, J.; Lison, D.; Mbuyi, F.; Haufroid, V.; Hoet, P. Elevated blood lead levels and sources of exposure in the population of Kinshasa, the capital of the Democratic Republic of Congo. J. Expo. Sci. Environ. 2013, 23, 81–87. [Google Scholar] [CrossRef] [PubMed]
- Taylor, M.P.; Winder, C.; Lanphear, B.P. Australia’s leading public health body delays action on the revision of the public health goal for blood lead exposures. Environ. Int. 2014, 70, 113–117. [Google Scholar] [CrossRef] [PubMed]
- Public Education and Supplemental Monitoring Requirements. Available online: https://www.law.cornell.edu/cfr/text/40/141.85. (accessed on 18 April 2015).
- PAK-EPA. National Standards for Drinking Water Quality (NSDWG); Pakistan Environmental Protection Agency (PAK-EPA); Ministry of Environment: Government of Pakistan, Islamabad, Pakistan, 2008.
- Karim, M.D.M. Arsenic in groundwater and health problems in Bangladesh. Water Res. 2000, 34, 304–310. [Google Scholar] [CrossRef]
© 2015 by the authors; licensee MDPI, Basel, Switzerland. This article is an open access article distributed under the terms and conditions of the Creative Commons Attribution license (http://creativecommons.org/licenses/by/4.0/).
Share and Cite
Shakoor, M.B.; Niazi, N.K.; Bibi, I.; Rahman, M.M.; Naidu, R.; Dong, Z.; Shahid, M.; Arshad, M. Unraveling Health Risk and Speciation of Arsenic from Groundwater in Rural Areas of Punjab, Pakistan. Int. J. Environ. Res. Public Health 2015, 12, 12371-12390. https://doi.org/10.3390/ijerph121012371
Shakoor MB, Niazi NK, Bibi I, Rahman MM, Naidu R, Dong Z, Shahid M, Arshad M. Unraveling Health Risk and Speciation of Arsenic from Groundwater in Rural Areas of Punjab, Pakistan. International Journal of Environmental Research and Public Health. 2015; 12(10):12371-12390. https://doi.org/10.3390/ijerph121012371
Chicago/Turabian StyleShakoor, Muhammad Bilal, Nabeel Khan Niazi, Irshad Bibi, Mohammad Mahmudur Rahman, Ravi Naidu, Zhaomin Dong, Muhammad Shahid, and Muhammad Arshad. 2015. "Unraveling Health Risk and Speciation of Arsenic from Groundwater in Rural Areas of Punjab, Pakistan" International Journal of Environmental Research and Public Health 12, no. 10: 12371-12390. https://doi.org/10.3390/ijerph121012371
APA StyleShakoor, M. B., Niazi, N. K., Bibi, I., Rahman, M. M., Naidu, R., Dong, Z., Shahid, M., & Arshad, M. (2015). Unraveling Health Risk and Speciation of Arsenic from Groundwater in Rural Areas of Punjab, Pakistan. International Journal of Environmental Research and Public Health, 12(10), 12371-12390. https://doi.org/10.3390/ijerph121012371