
Ethanol and Acetic Acid Production from Carbon Monoxide in a Clostridium Strain in Batch and Continuous Gas-Fed Bioreactors


Abstract
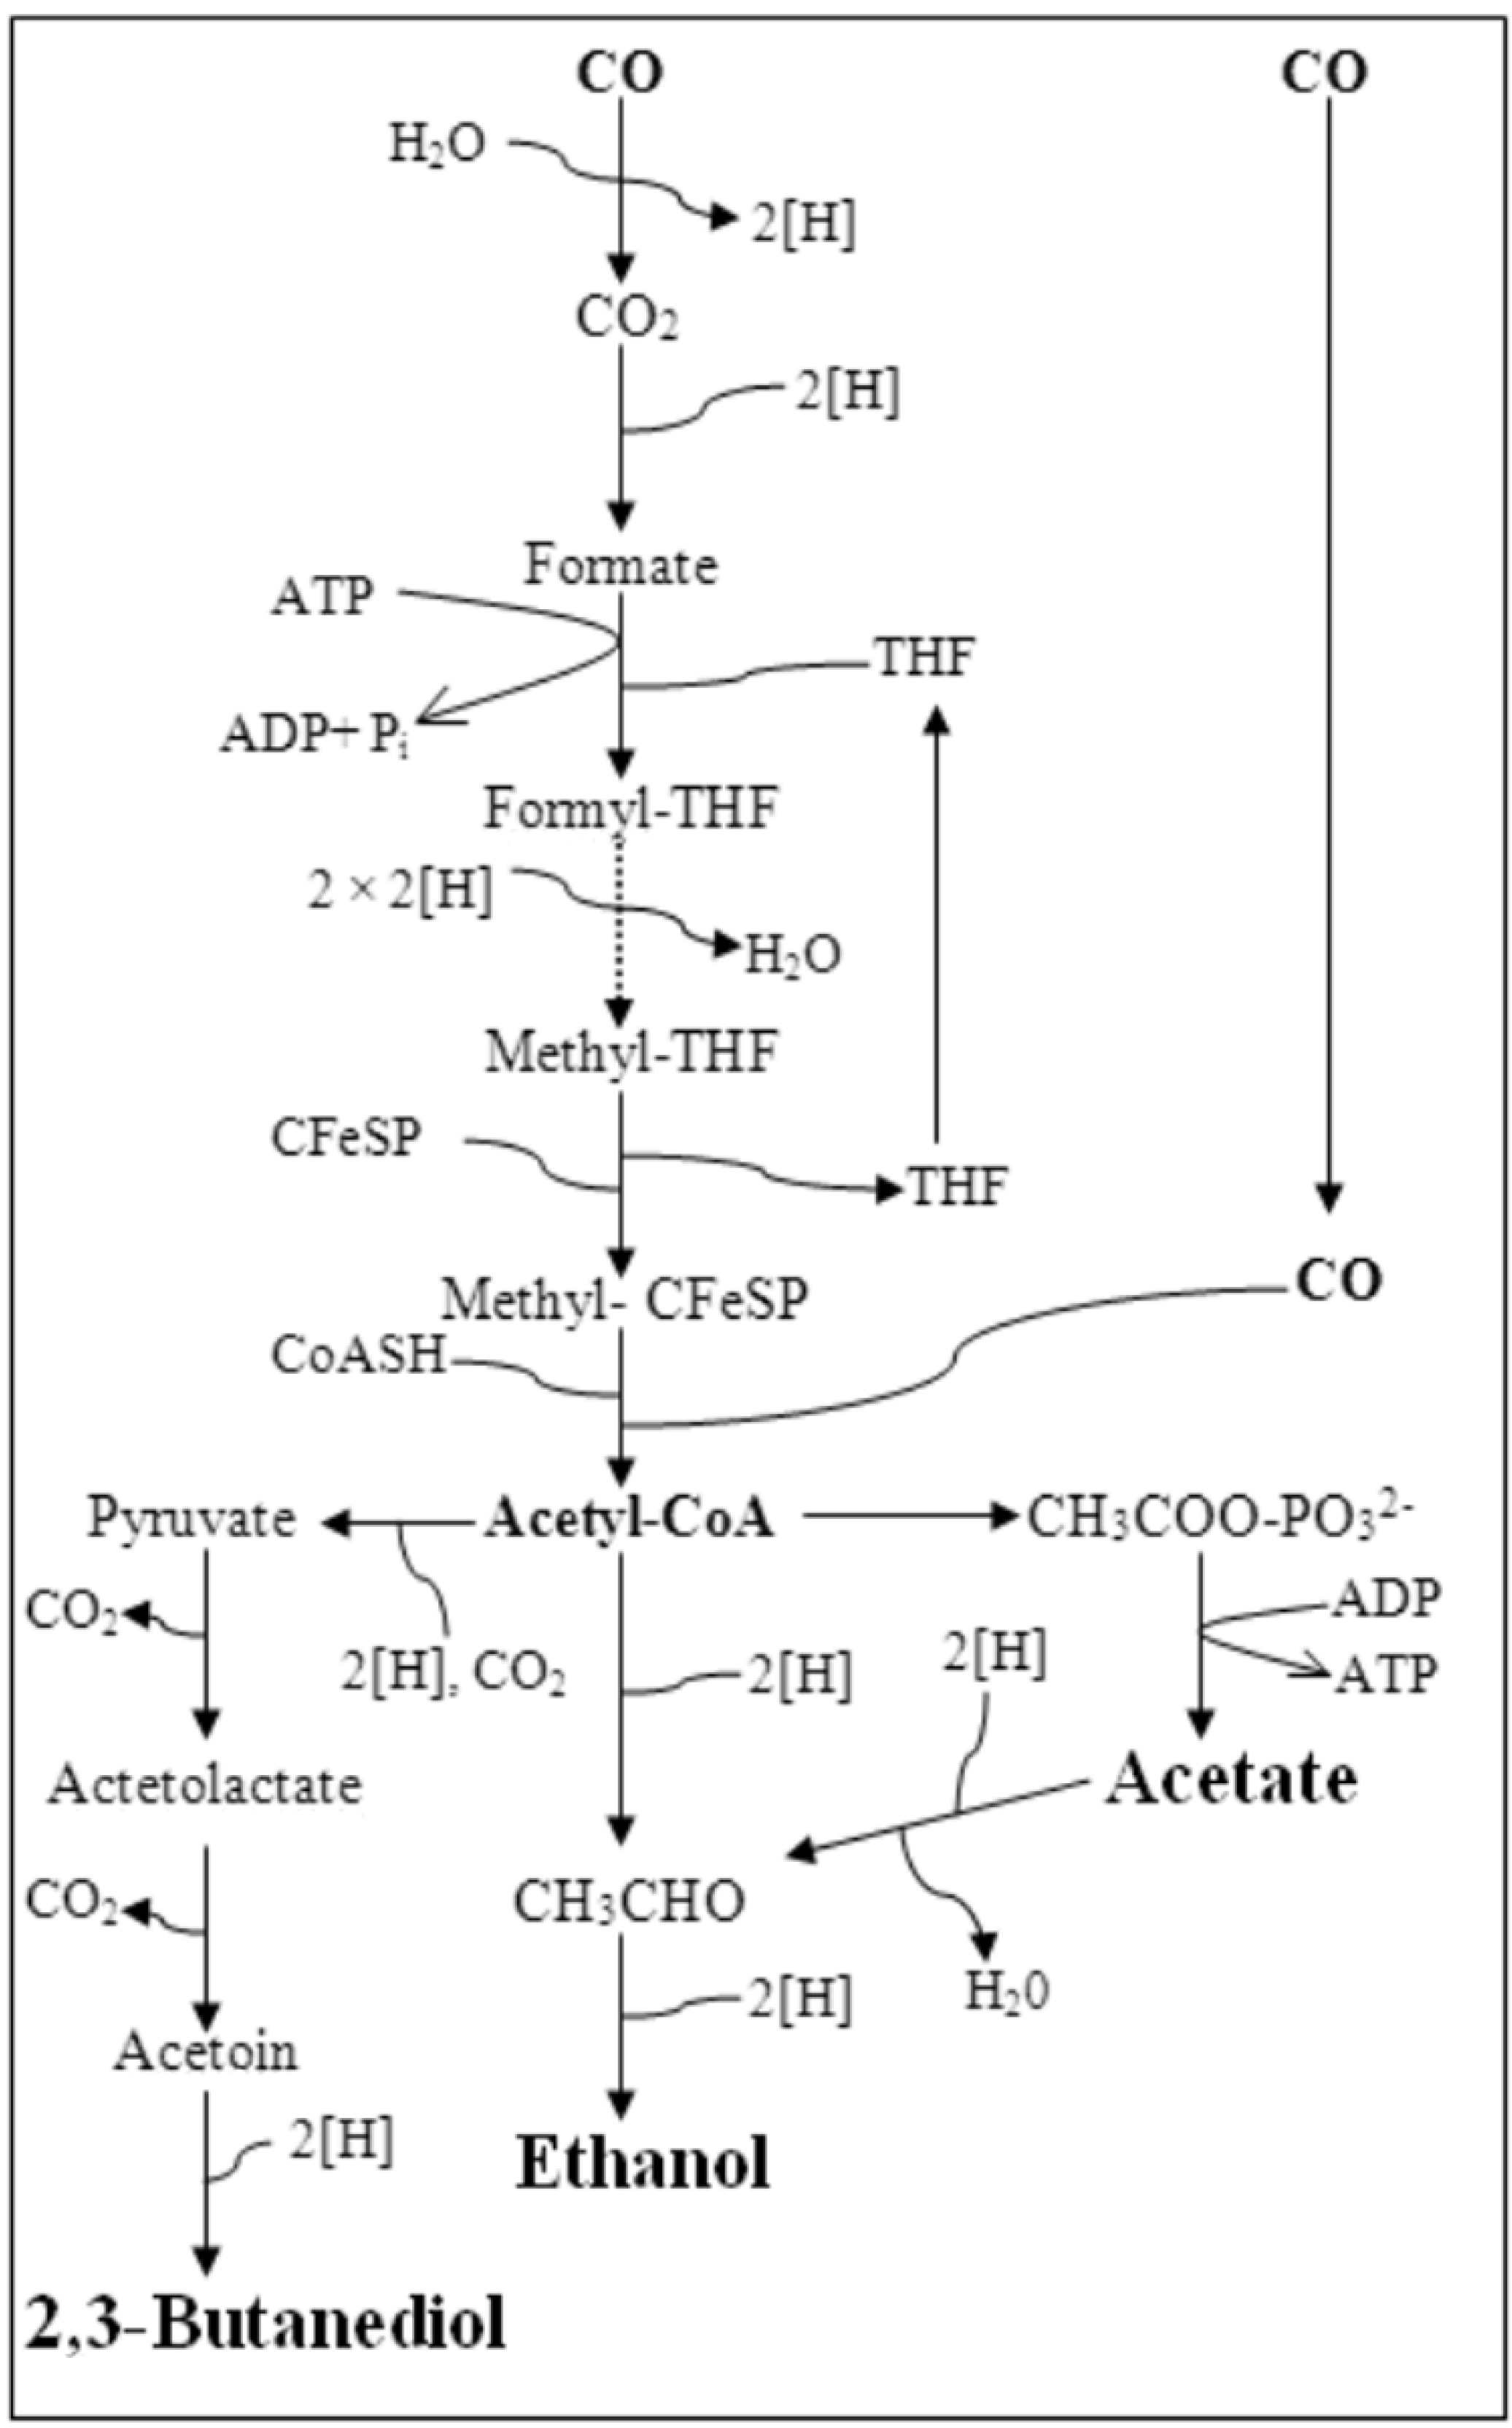
:1. Introduction
2. Experimental Section
2.1. Microorganism
2.2. Bioconversion Studies
2.2.1. Bottle Batch Experiments

| Run No | NH4Cl | Trypticase | YE | Ethanol (g/L) | Acetic Acid (g/L) | Biomass (mg/L) | Final pH |
|---|---|---|---|---|---|---|---|
| 1 | 0.2 | 0.2 | 0.10 | 0.1733 | 1.806 | 152.29 | 3.88 |
| 2 | 2.0 | 0.2 | 0.10 | 0.3032 | 1.560 | 142.81 | 3.84 |
| 3 | 0.2 | 2.0 | 0.10 | 0.2290 | 1.855 | 222.7 | 4.03 |
| 4 | 2.0 | 2.0 | 0.10 | 0.1959 | 1.663 | 244.49 | 4.00 |
| 5 | 0.2 | 0.2 | 1.00 | 0.0883 | 2.146 | 302.90 | 3.91 |
| 6 | 2.0 | 0.2 | 1.00 | 0.1048 | 2.101 | 294.80 | 3.84 |
| 7 | 0.2 | 2.0 | 1.00 | 0.1061 | 2.339 | 335.62 | 3.93 |
| 8 | 2.0 | 2.0 | 1.00 | 0.1101 | 2.226 | 320.03 | 3.94 |
2.2.2. Continuous Gas-Fed Bioreactor Experiments
2.3. Analytical Equipment and Measurement Protocols
3. Results and Discussion
3.1. Bottle Batch Experiments
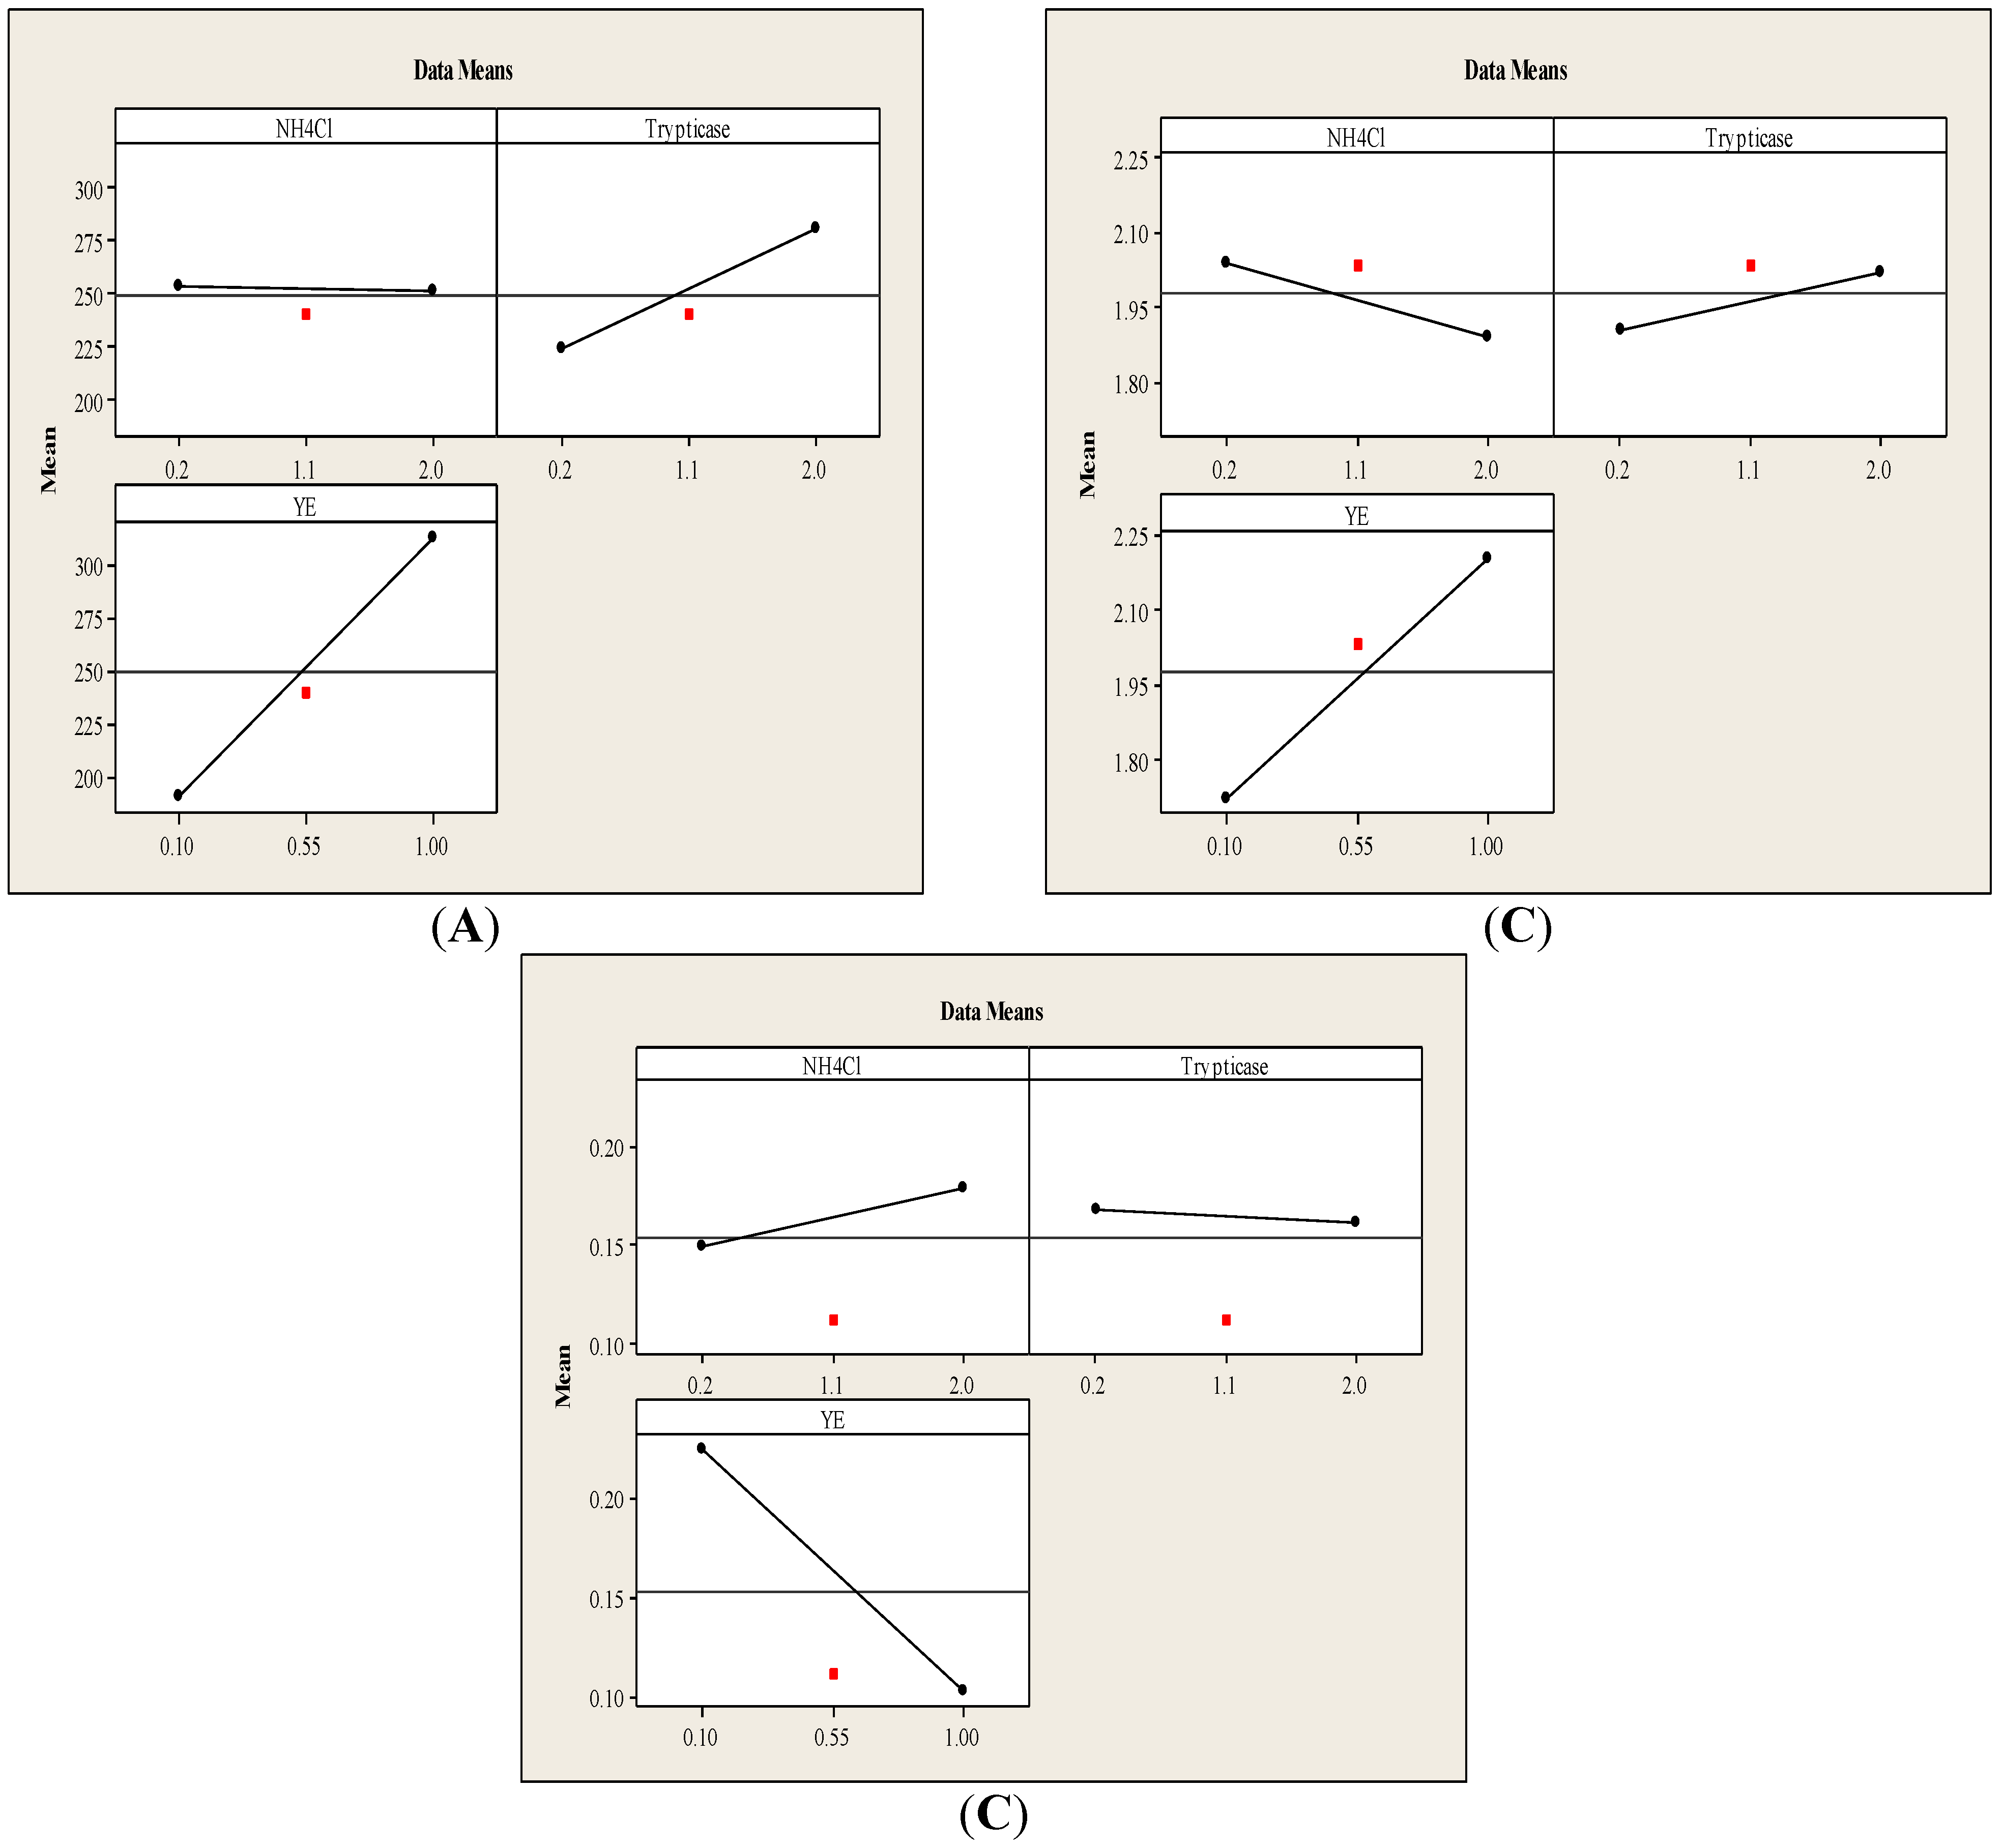
3.1.1. Main Effects Plot

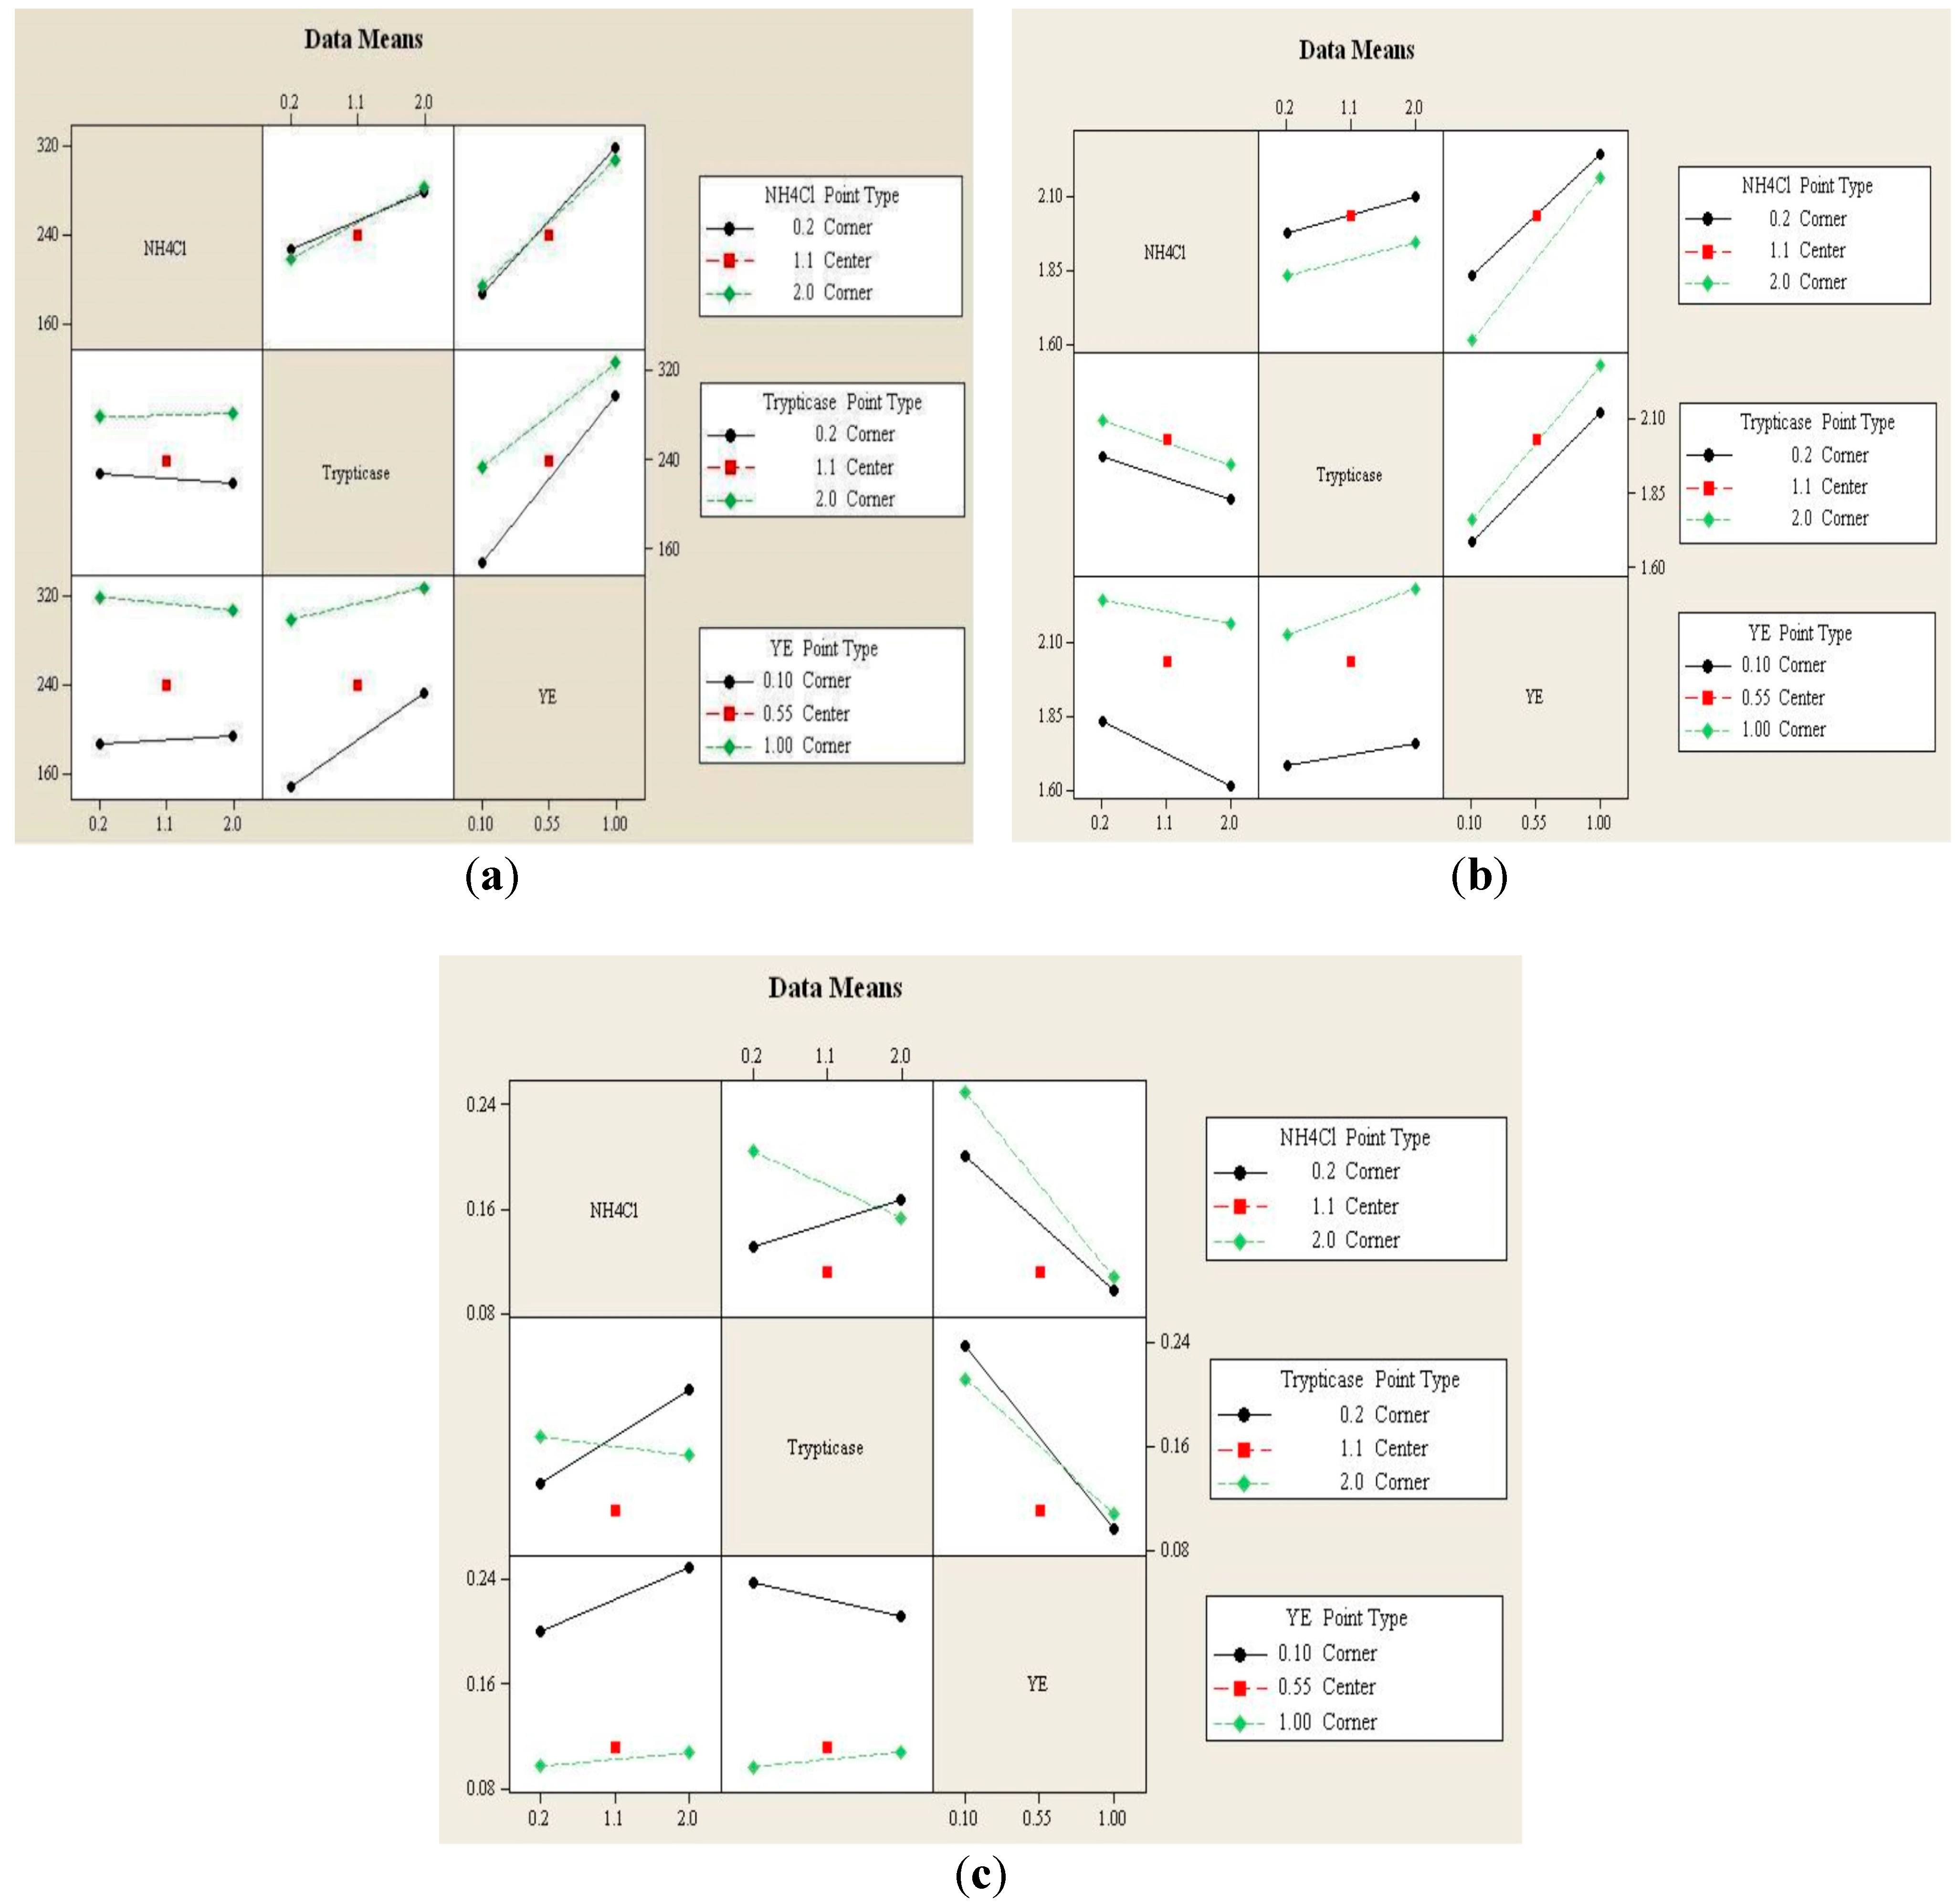
3.1.2. Interaction Effects Plot
3.1.3. Effect of Individual Sources of Nitrogen on Growth and Product Formation
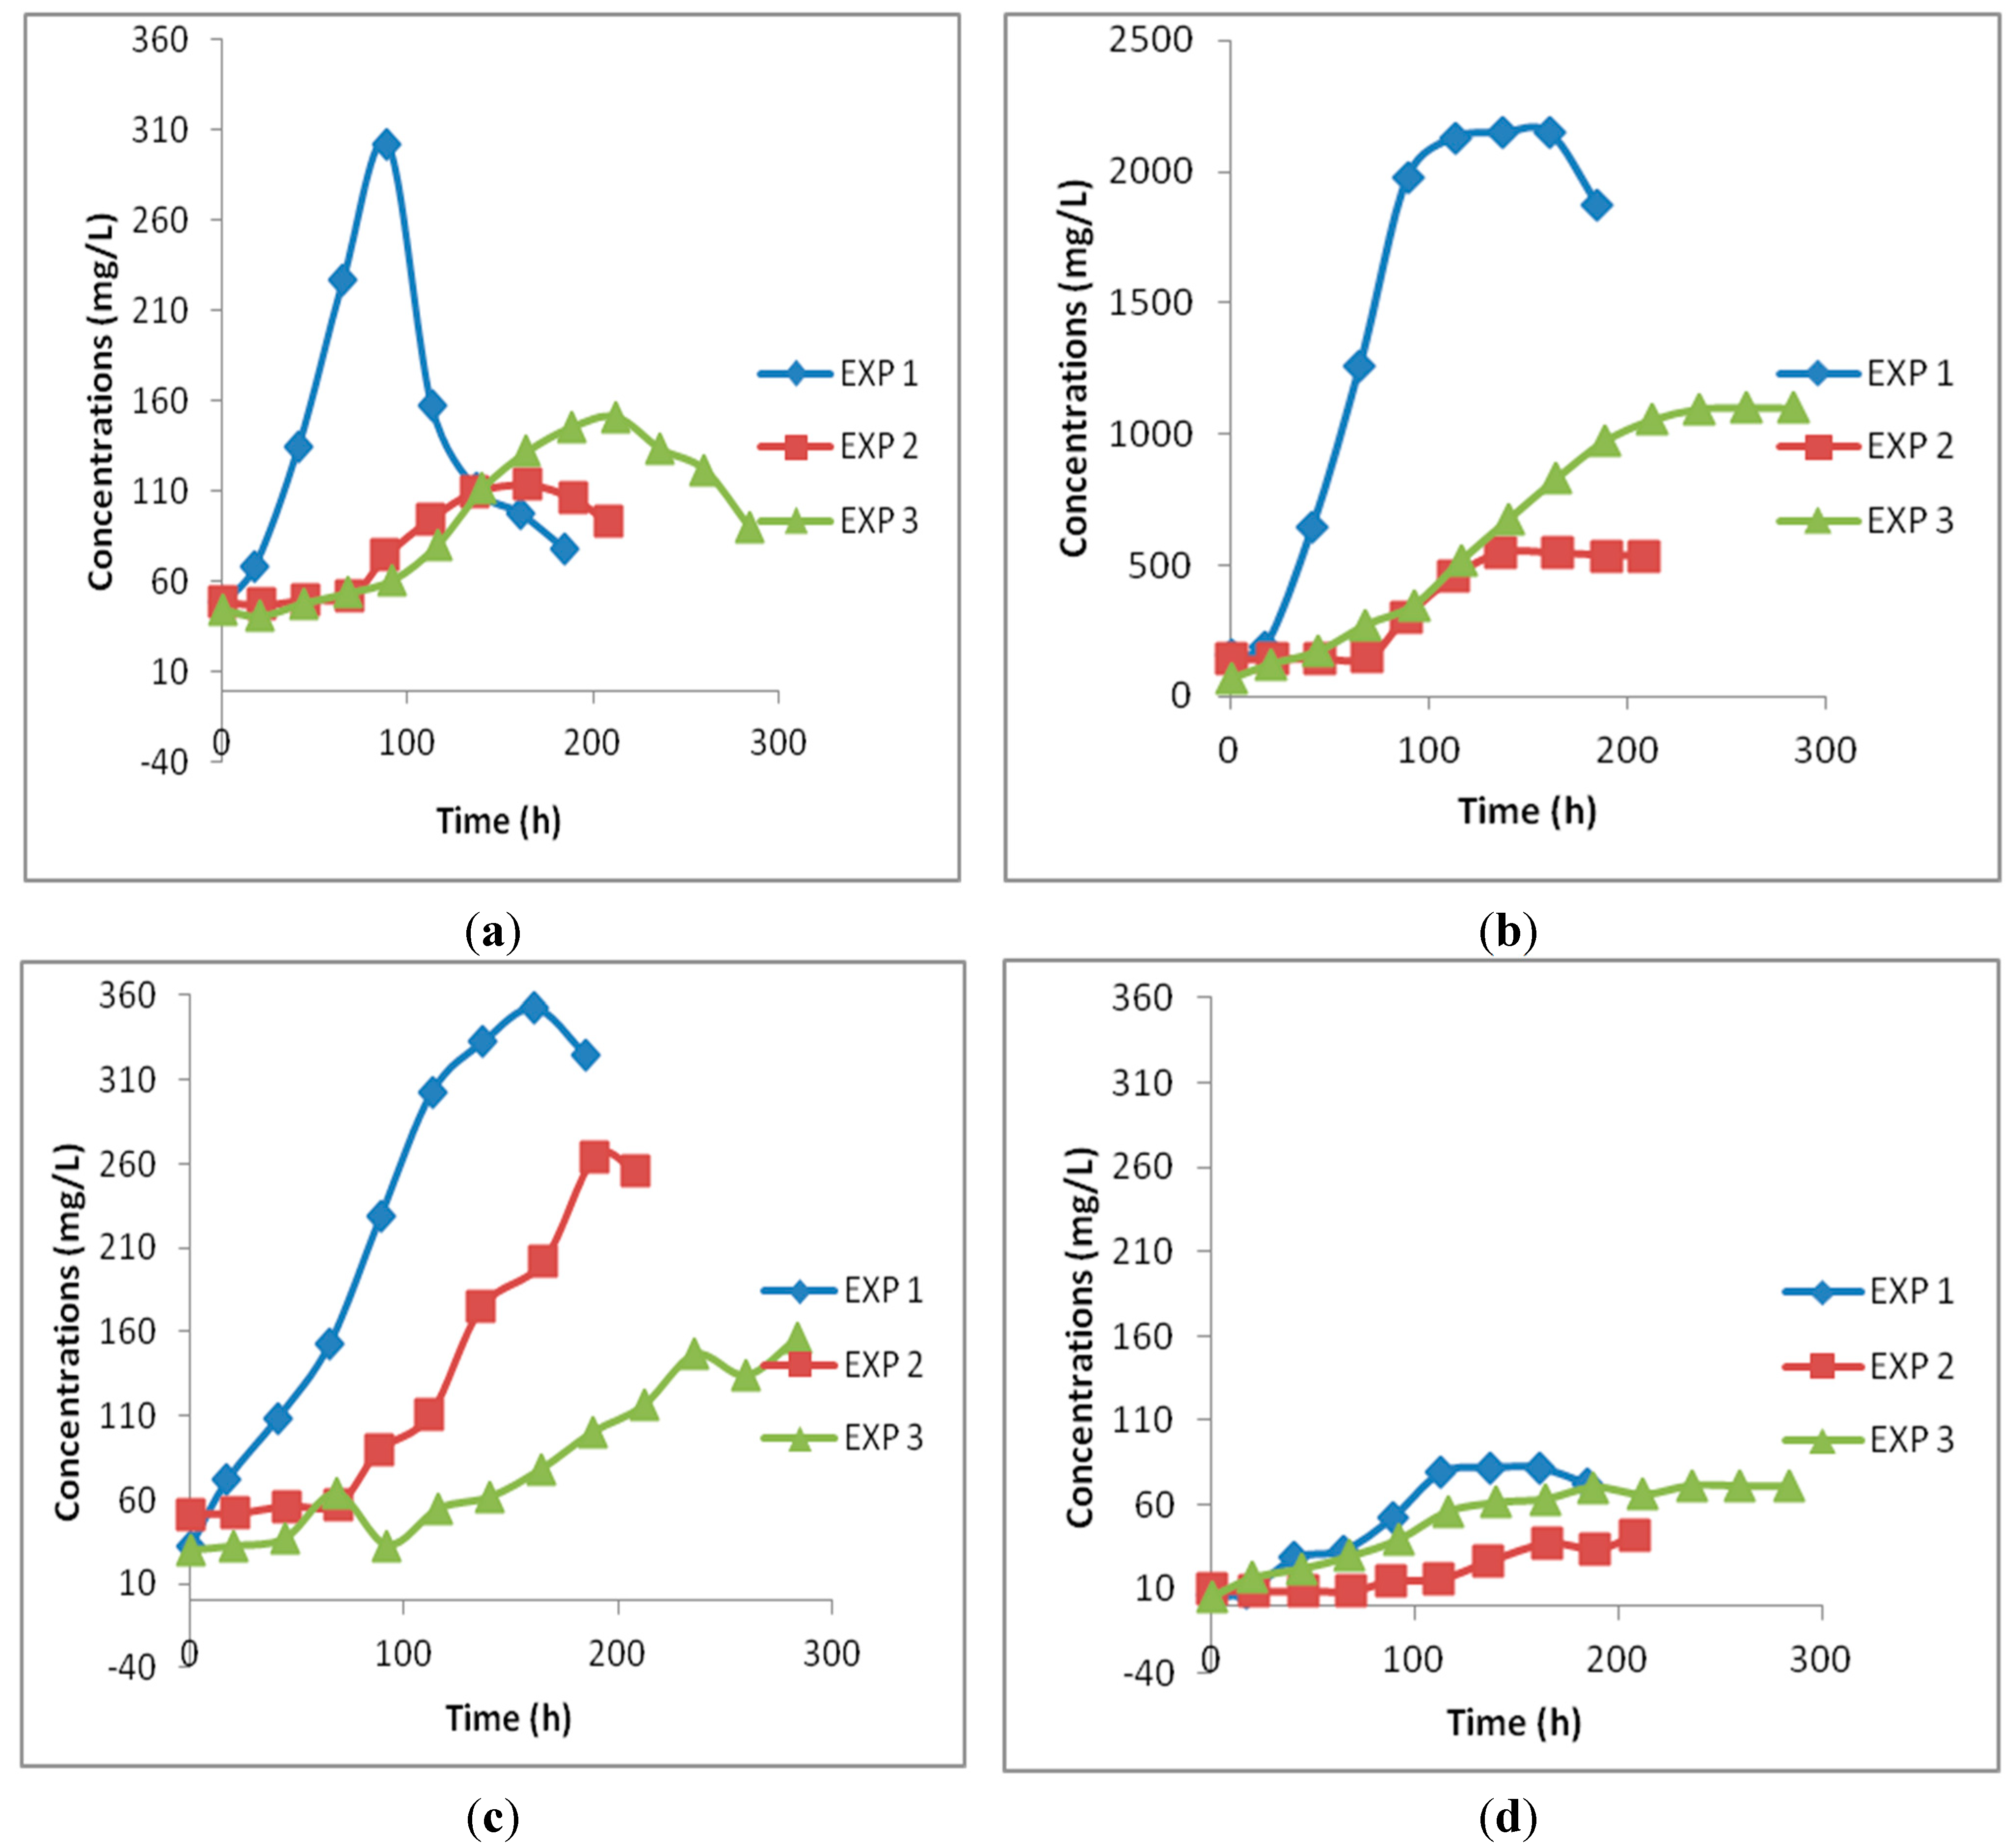
3.2. Continuous Gas-Fed Bioreactor Experiments
4. Conclusions
Supplementary Files
Supplementary File 1Acknowledgments
Author Contributions
Conflicts of Interest
References
- Van Groenestijn, J.W.; Abubackar, H.N.; Veiga, M.C.; Kennes, C. Bioethanol. In Air Pollution Prevention and Control: Bioreactors and Bioenergy; Kennes, C., Veiga, M.C., Eds.; John Wiley & Sons, Ltd.: Chichester, UK, 2013; pp. 431–463. [Google Scholar]
- Abubackar, H.N.; Veiga, M.C.; Kennes, C. Biological conversion of carbon monoxide-rich syngas or waste gases to bioethanol. Biofuels Bioprod. Biorefin. 2011, 5, 93–114. [Google Scholar] [CrossRef]
- Bengelsdorf, F.R.; Straub, M.; Dürre, P. Bacterial synthesis gas (syngas) fermentation. Environ. Technol. 2013, 34, 1639–1651. [Google Scholar] [CrossRef] [PubMed]
- Latif, H.; Zeidan, A.A.; Nielsen, A.T.; Zengler, K. Trash to treasure: Production of biofuels and commodity chemicals via syngas fermenting microorganisms. Curr. Opin. Biotechnol. 2014, 27, 79–87. [Google Scholar] [CrossRef] [PubMed]
- Schuchmann, K.; Müller, V. Autotrophy at the thermodynamic limit of life: A model for energy conservation in acetogenic bacteria. Nat. Rev. Microbiol. 2014, 12, 809–821. [Google Scholar] [CrossRef] [PubMed]
- Kiriukhin, M.; Tyurin, M. Expression of amplified synthetic ethanol pathway integrated using Tn7-tool and powered at the expense of eliminated pta, ack, spo0A and spo0J during continuous syngas or CO2/H2 blend fermentation. J. Appl. Microbiol. 2013, 114, 1033–1045. [Google Scholar] [CrossRef] [PubMed]
- Banerjee, A.; Leang, C.; Ueki, T.; Nevin, K.P.; Lovley, D.R. Lactose-inducible system for metabolic engineering of Clostridium ljungdahlii. Appl. Environ. Microbiol. 2014, 80, 2410–2416. [Google Scholar] [CrossRef] [PubMed]
- Hurst, K.M.; Lewis, R.S. Carbon monoxide partial pressure effects on the metabolic process of syngas fermentation. Biochem. Eng. J. 2010, 48, 159–165. [Google Scholar] [CrossRef]
- Kundiyana, D.K.; Huhnke, R.L.; Wilkins, M.R. Effect of nutrient limitation and two-stage continuous fermentor design on productivities during “Clostridium ragsdalei” syngas fermentation. Bioresour. Technol. 2011, 102, 6058–6064. [Google Scholar] [CrossRef] [PubMed]
- Köpke, M.; Michalcea, C.; Liew, F.-M.; Tizard, J.H.; Ali, M.S.; Conolly, J.J.; Al-Sinawi, B.; Simpson, S.D. 2,3-butanediol production by acetogenic bacteria, an alternative route to chemical synthesis, using industrial waste gas. Appl. Environ. Microbiol. 2011, 77, 5467–5475. [Google Scholar] [CrossRef] [PubMed]
- Sim, J.H.; Kamaruddin, A.H.; Long, W.S.; Najafpour, G. Clostridium aceticum—A potential organism in catalyzing carbon monoxide to acetic acid: Application of response surface methodology. Enzyme Microb. Technol. 2007, 40, 1234–1243. [Google Scholar] [CrossRef]
- Abubackar, H.N.; Veiga, M.C.; Kennes, C. Biological conversion of carbon monoxide to ethanol: Effect of pH, gas pressure, reducing agent and yeast extract. Bioresour. Technol. 2012, 114, 518–522. [Google Scholar]
- Guo, Y.; Xu, J.; Zhang, Y.; Xu, H.; Yuan, Z.; Li, D. Medium optimization for ethanol production with Clostridium autoethanogenum with carbon monoxide as sole carbon source. Bioresour. Technol. 2010, 101, 8784–8789. [Google Scholar] [CrossRef] [PubMed]
- Cotter, J.L.; Chinn, M.S.; Grunden, A.M. Ethanol and acetate production by Clostridium ljungdahlii and Clostridium autoethanogenum using resting cells. Bioprocess Biosyst. Eng. 2009, 32, 369–380. [Google Scholar] [CrossRef] [PubMed]
- Abubackar, H.N.; Veiga, M.C.; Kennes, C. Bioconversion of Carbon Monoxide to Bioethanol: An Optimization Study. In Proceedings of the Biotechniques for Air Pollution Control and Bioenergy IV, La Coruña, Spain, 12–14 October 2011; Kennes, C., Rene, E.R., Veiga, M.C., Eds.; pp. 347–351.
- Sim, J.H.; Kamaruddin, A.H.; Long, W.S. Biocatalytic conversion of CO to acetic acid by Clostridium aceticum—Medium optimization using response surface methodology (RSM). Biochem. Eng. J. 2008, 40, 337–347. [Google Scholar] [CrossRef]
- Wang, G.; Wang, D.I.C. Elucidation of growth inhibition and acetic acid production by Clostridium thermoaceticum. Appl. Environ. Microbiol. 1984, 47, 294–298. [Google Scholar] [PubMed]
- Barik, S.; Prieto, S.; Harrison, S.B.; Clausen, E.C.; Gaddy, J.L. Biological production of alcohols from coal through indirect liquefaction. Appl. Biochem. Biotechnol. 1988, 18, 363–378. [Google Scholar] [CrossRef]
- Liu, K.; Atiyeh, H.K.; Stevenson, B.S.; Tanner, R.S.; Wilkins, M.R.; Huhnke, R.L. Continuous syngas fermentation for the production of ethanol, n-propanol and n-butanol. Bioresour. Technol. 2014, 151, 69–77. [Google Scholar] [CrossRef] [PubMed]
- Chen, X.; Jiang, S.; Zheng, Z.; Pan, L.; Luo, S. Effects of culture redox potential on succinic acid production by Corynebacterium crenatum under anaerobic conditions. Process Biochem. 2012, 47, 1250–1255. [Google Scholar] [CrossRef]
- Liu, C.-G.; Xue, C.; Lin, Y.-H.; Bai, F.-W. Redox potential control and applications in microaerobic and anaerobic fermentations. Biotech. Adv. 2013, 31, 257–265. [Google Scholar] [CrossRef]
- Ren, N.Q.; Chua, H.; Chan, S.Y.; Tsang, Y.F.; Wang, Y.J.; Sin, N. Assessing optimal fermentation type for bio-hydrogen production in continuous-flow acidogenic reactors. Bioresour. Technol. 2007, 98, 1774–1780. [Google Scholar] [CrossRef] [PubMed]
- Ballongue, J.; Amine, J.; Petitdemange, H.; Gay, R. Regulation of acetate kinase and butyrate kinase by acids in Clostridium acetobutylicum. FEMS Microbiol. Lett. 1986, 35, 295–301. [Google Scholar] [CrossRef]
- Kundiyana, D.K.; Wilkins, M.R.; Maddipati, P.B.; Huhnke, R.L. Effect of temperature, pH and buffer on syngas fermentation using Clostridium strain P11. Bioresour. Technol. 2011, 102, 5794–5799. [Google Scholar] [CrossRef] [PubMed]
- Mohammadi, M.; Najafpour, G.D.; Younesi, H.; Lahijani, P.; Uzir, M.H.; Mohamed, A.R. Bioconversion of synthesis gas to second generation biofuels: A review. Renew. Sust. Energy Rev. 2011, 15, 4255–4273. [Google Scholar] [CrossRef]
- Gaddy, J.L.; Clausen, E.C. Clostridium ljungdahlii, An Anaerobic Ethanol and Acetate Producing Microorganism. US Patent No. 5,173,429, 22 December 1992. [Google Scholar]
- Klasson, K.T.; Elmore, B.B.; Vega, J.L.; Ackerson, M.D.; Clausen, E.C.; Gaddy, J.L. Biological production of liquid and gaseous fuels from synthesis gas. Appl. Biochem. Biotech. 1990, 24–25, 857–873. [Google Scholar] [CrossRef]
© 2015 by the authors; licensee MDPI, Basel, Switzerland. This article is an open access article distributed under the terms and conditions of the Creative Commons Attribution license (http://creativecommons.org/licenses/by/4.0/).
Share and Cite
Abubackar, H.N.; Veiga, M.C.; Kennes, C. Ethanol and Acetic Acid Production from Carbon Monoxide in a Clostridium Strain in Batch and Continuous Gas-Fed Bioreactors. Int. J. Environ. Res. Public Health 2015, 12, 1029-1043. https://doi.org/10.3390/ijerph120101029
Abubackar HN, Veiga MC, Kennes C. Ethanol and Acetic Acid Production from Carbon Monoxide in a Clostridium Strain in Batch and Continuous Gas-Fed Bioreactors. International Journal of Environmental Research and Public Health. 2015; 12(1):1029-1043. https://doi.org/10.3390/ijerph120101029
Chicago/Turabian StyleAbubackar, Haris Nalakath, María C. Veiga, and Christian Kennes. 2015. "Ethanol and Acetic Acid Production from Carbon Monoxide in a Clostridium Strain in Batch and Continuous Gas-Fed Bioreactors" International Journal of Environmental Research and Public Health 12, no. 1: 1029-1043. https://doi.org/10.3390/ijerph120101029
APA StyleAbubackar, H. N., Veiga, M. C., & Kennes, C. (2015). Ethanol and Acetic Acid Production from Carbon Monoxide in a Clostridium Strain in Batch and Continuous Gas-Fed Bioreactors. International Journal of Environmental Research and Public Health, 12(1), 1029-1043. https://doi.org/10.3390/ijerph120101029