Assessing Climate Variability Effects on Dengue Incidence in San Juan, Puerto Rico

 , and
, and
Abstract
:1. Introduction
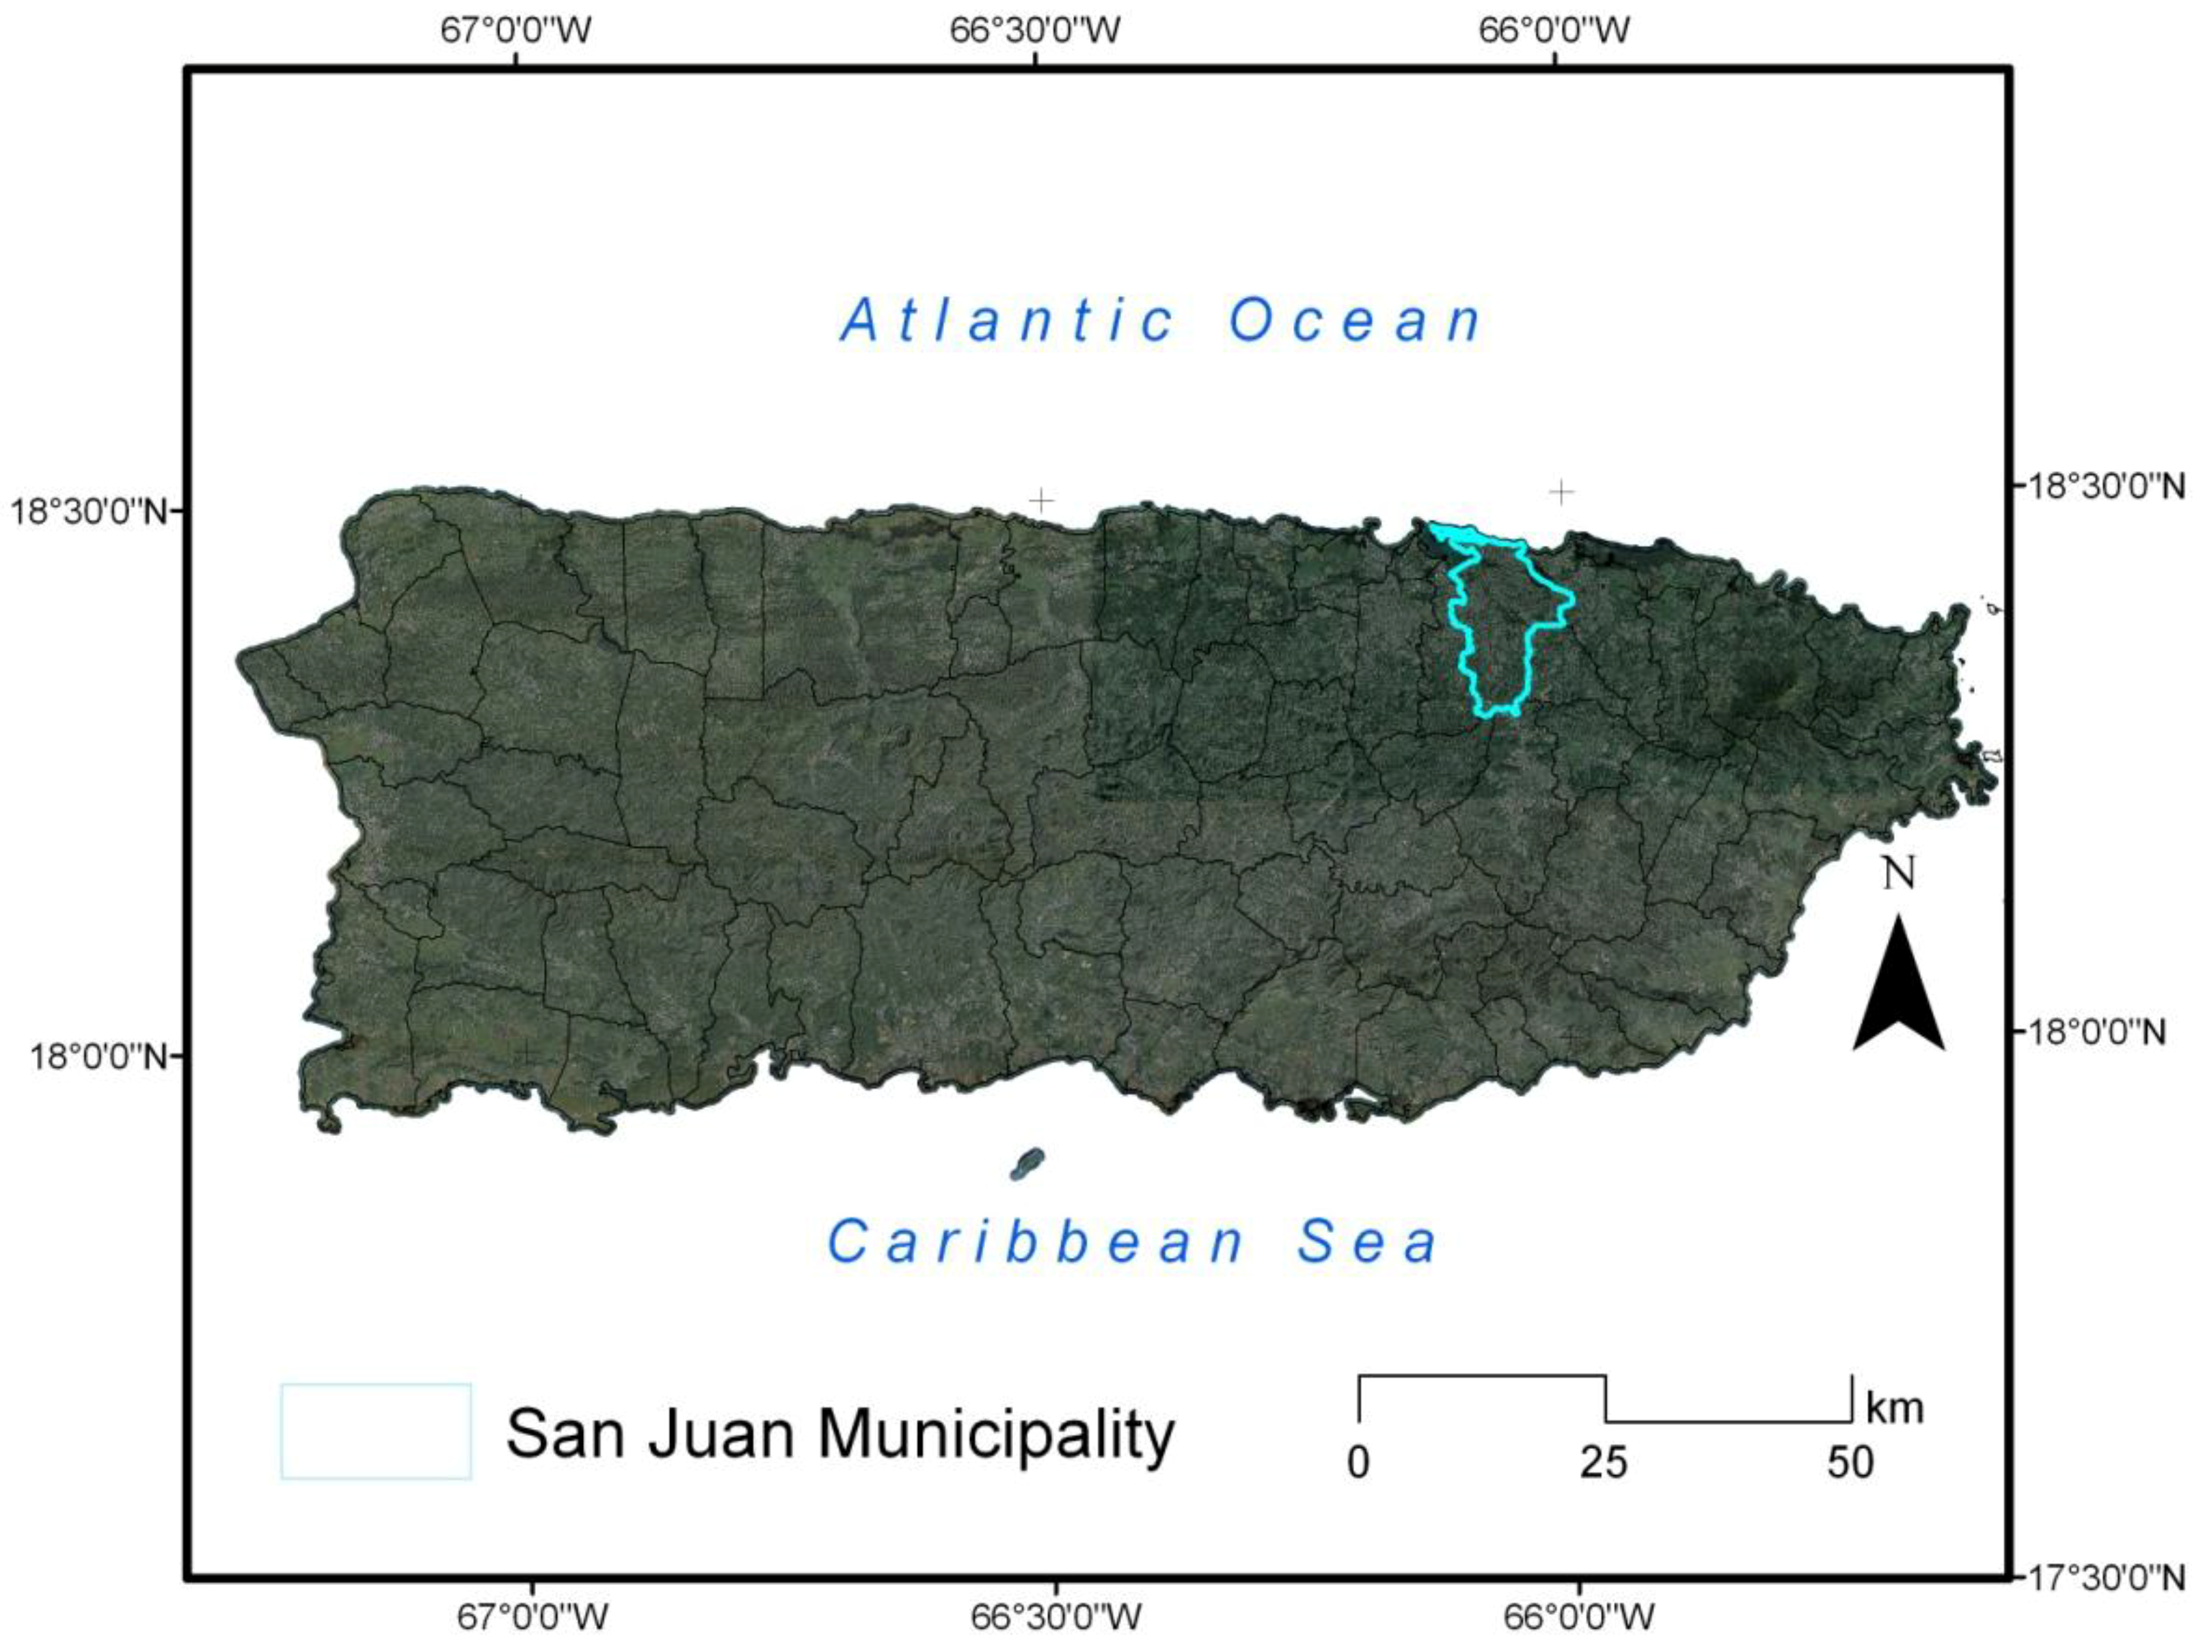
2. Study Area
3. Methods
3.1. Data Collection

| Variable | Period | Time Step |
|---|---|---|
| Dengue Cases | 1992–2011 | Daily |
| Rainfall | 1899–2011 | Daily |
| Air Surface Temperature | 1899–2011 | Daily |
| Sea Surface Temperature | 1981–2012 | Monthly |
| Sea Level Pressure | 1978–2012 | Daily |
| Wind Speed | 1978–2012 | Daily |
| Mean Sea Level | 1978–2012 | Daily |
3.2. Data Analysis
| ID | Indicator Name | Indicator Dentitions | Units |
|---|---|---|---|
| TN10p | Cool nights | Percentage of time when daily min temperature < 10th percentile | % |
| TX10p | Cool days | Percentage of time when daily max temperature < 10th percentile | % |
| TN90p | Warm nights | Percentage of time when daily min temperature > 90th Percentile | % |
| TX90p | Warm days | Percentage of time when daily max temperature > 90th percentile | % |
| WSDI | Warm spell duration indicator | Annual count when at least six consecutive days of max temperature > 90th percentile | days |
| CSDIN | Cold spell duration indicator | Annual count when at least six consecutive days of min temperature < 10th percentile | days |
| CSDIX | Cold spell duration indicator | Annual count when at least six consecutive days of max temperature < 10th percentile | days |
| PRCPTOT | Annual total wet-day precipitation | Annual total precipitation from days ≥ 1 mm | mm |
| R10 | Number of heavy precipitation days | Annual count when precipitation ≥ 10 mm | days |
| R20 | Number of very heavy precipitation days | Annual count when precipitation ≥ 20 mm | days |
| CDD | Consecutive dry days | Maximum number of consecutive days when precipitation < 1 mm | days |
| CWD | Consecutive wet days | Maximum number of consecutive days when precipitation ≥ 1 mm | days |
| R95p | Very wet days | Annual total precipitation from days > 95th percentile | mm |
| R99p | Extremely wet days | Annual total precipitation from days > 99th percentile | mm |
4. Results and Discussion
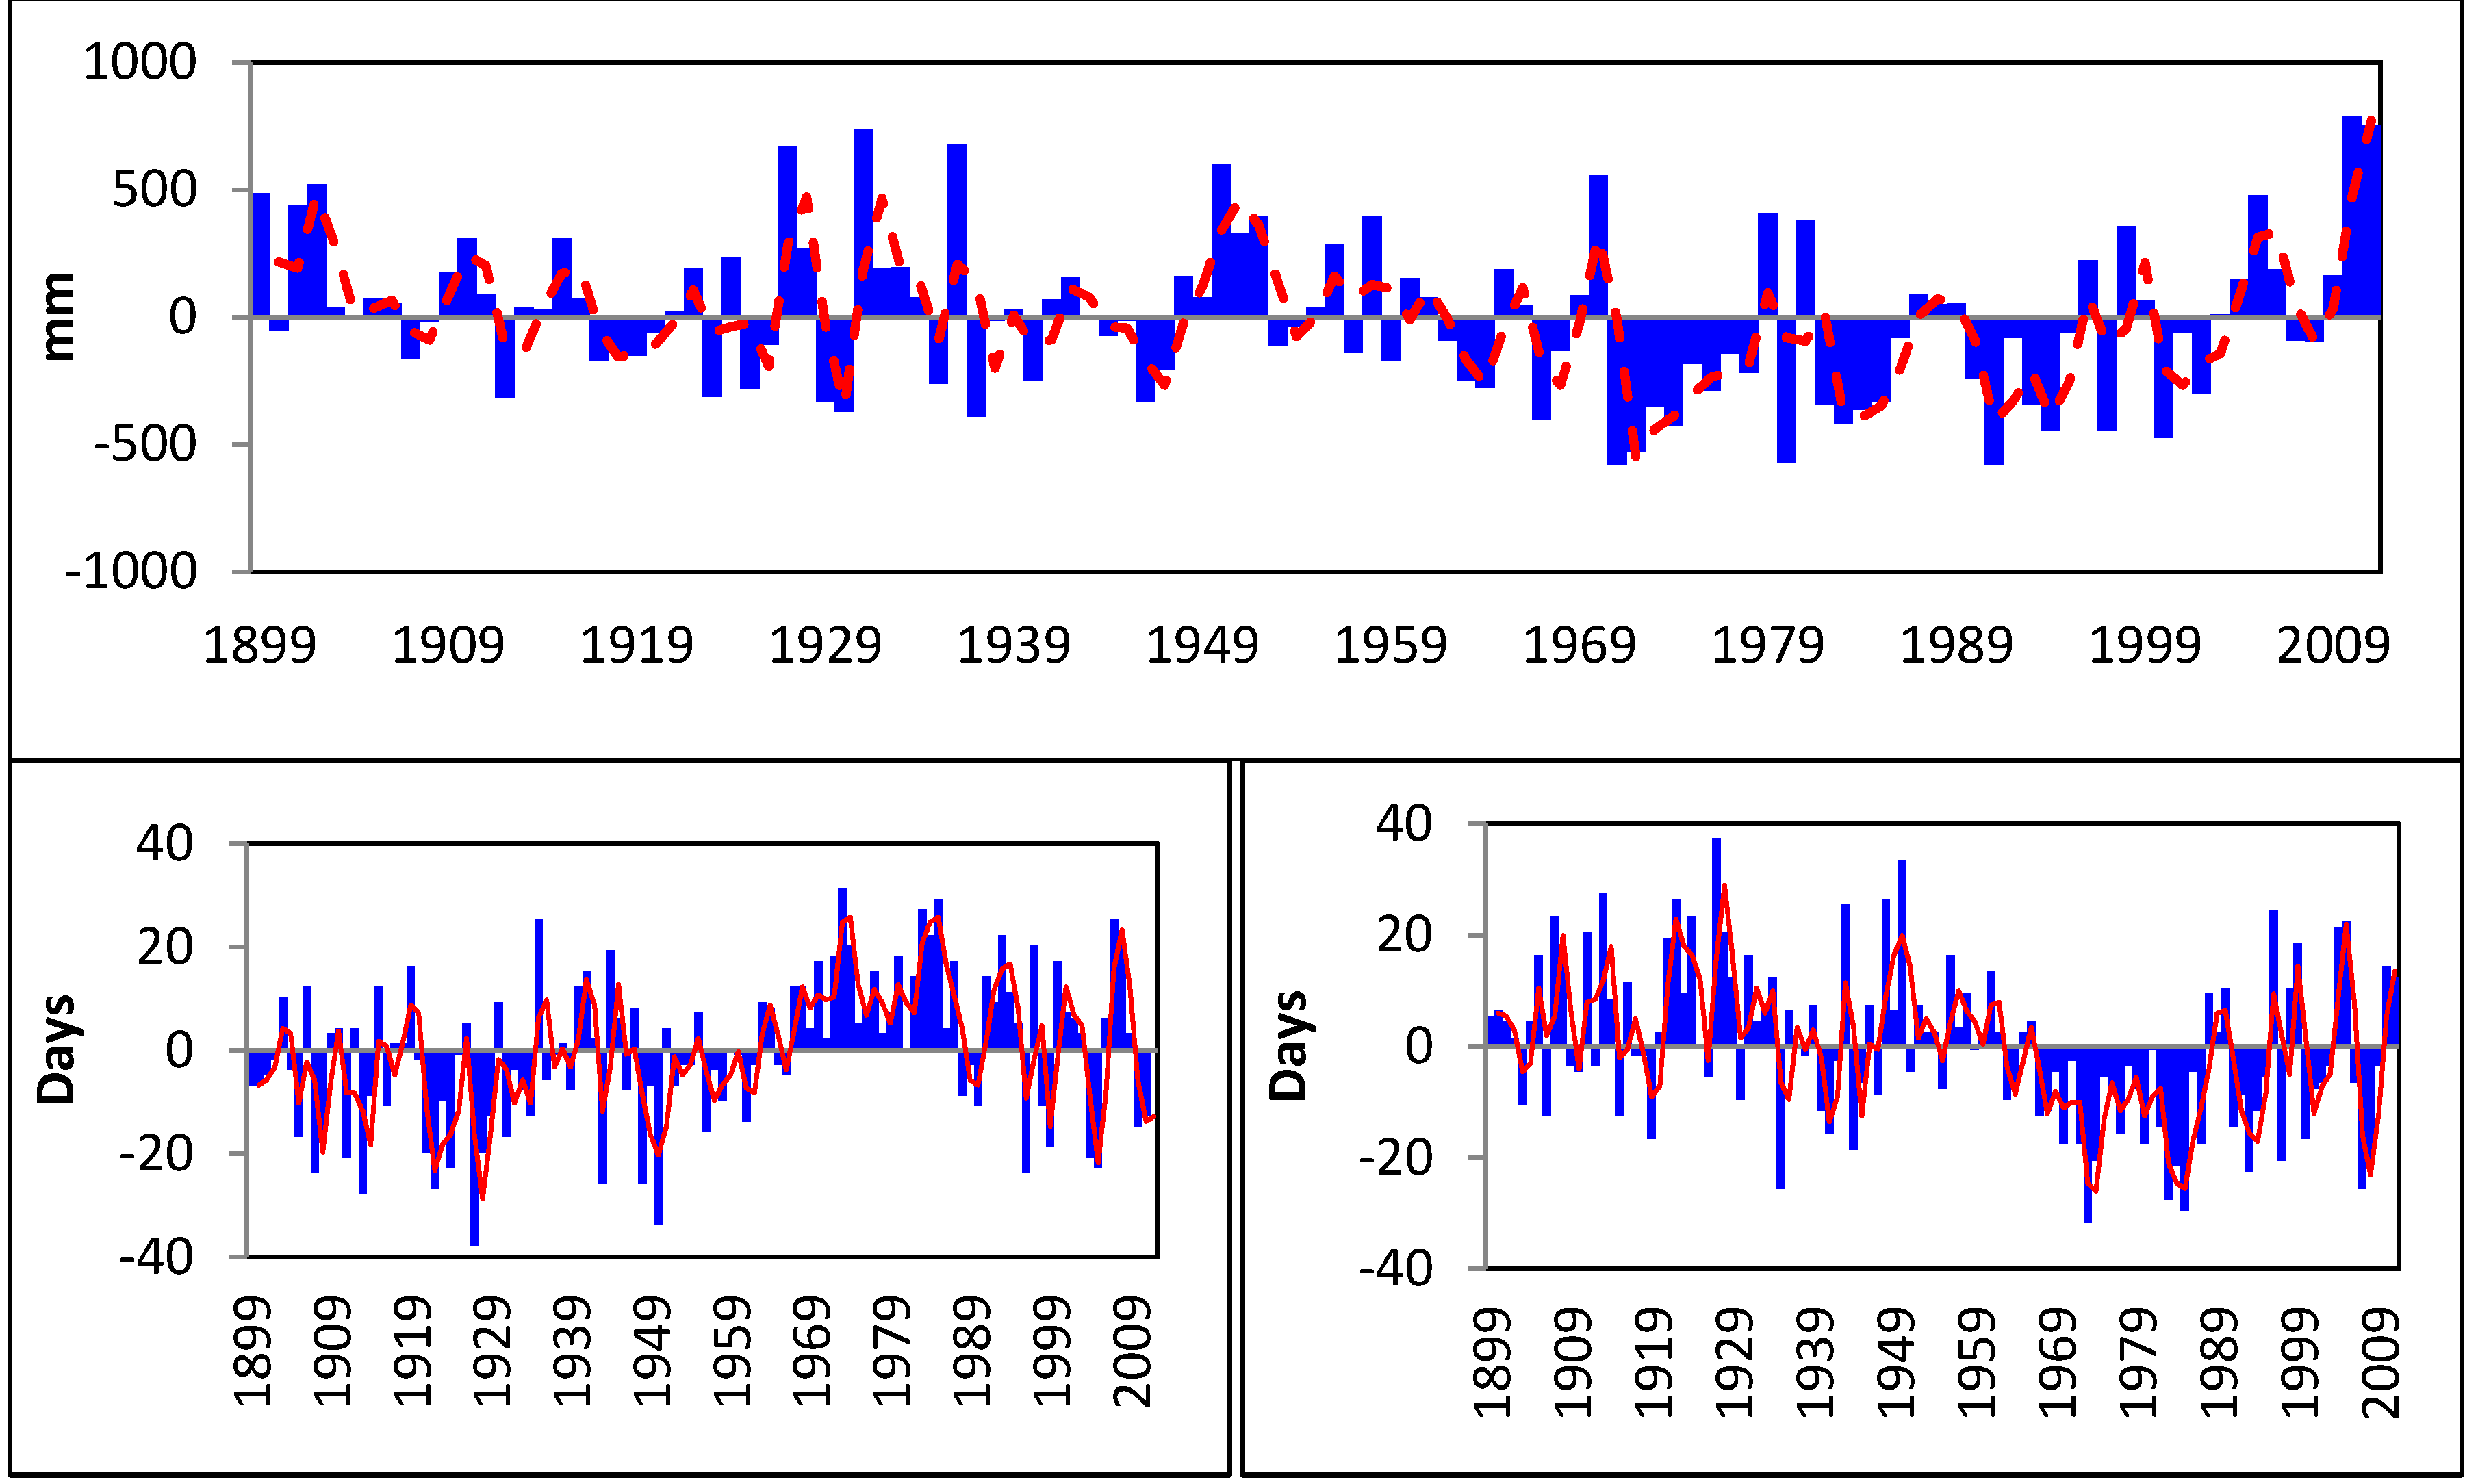
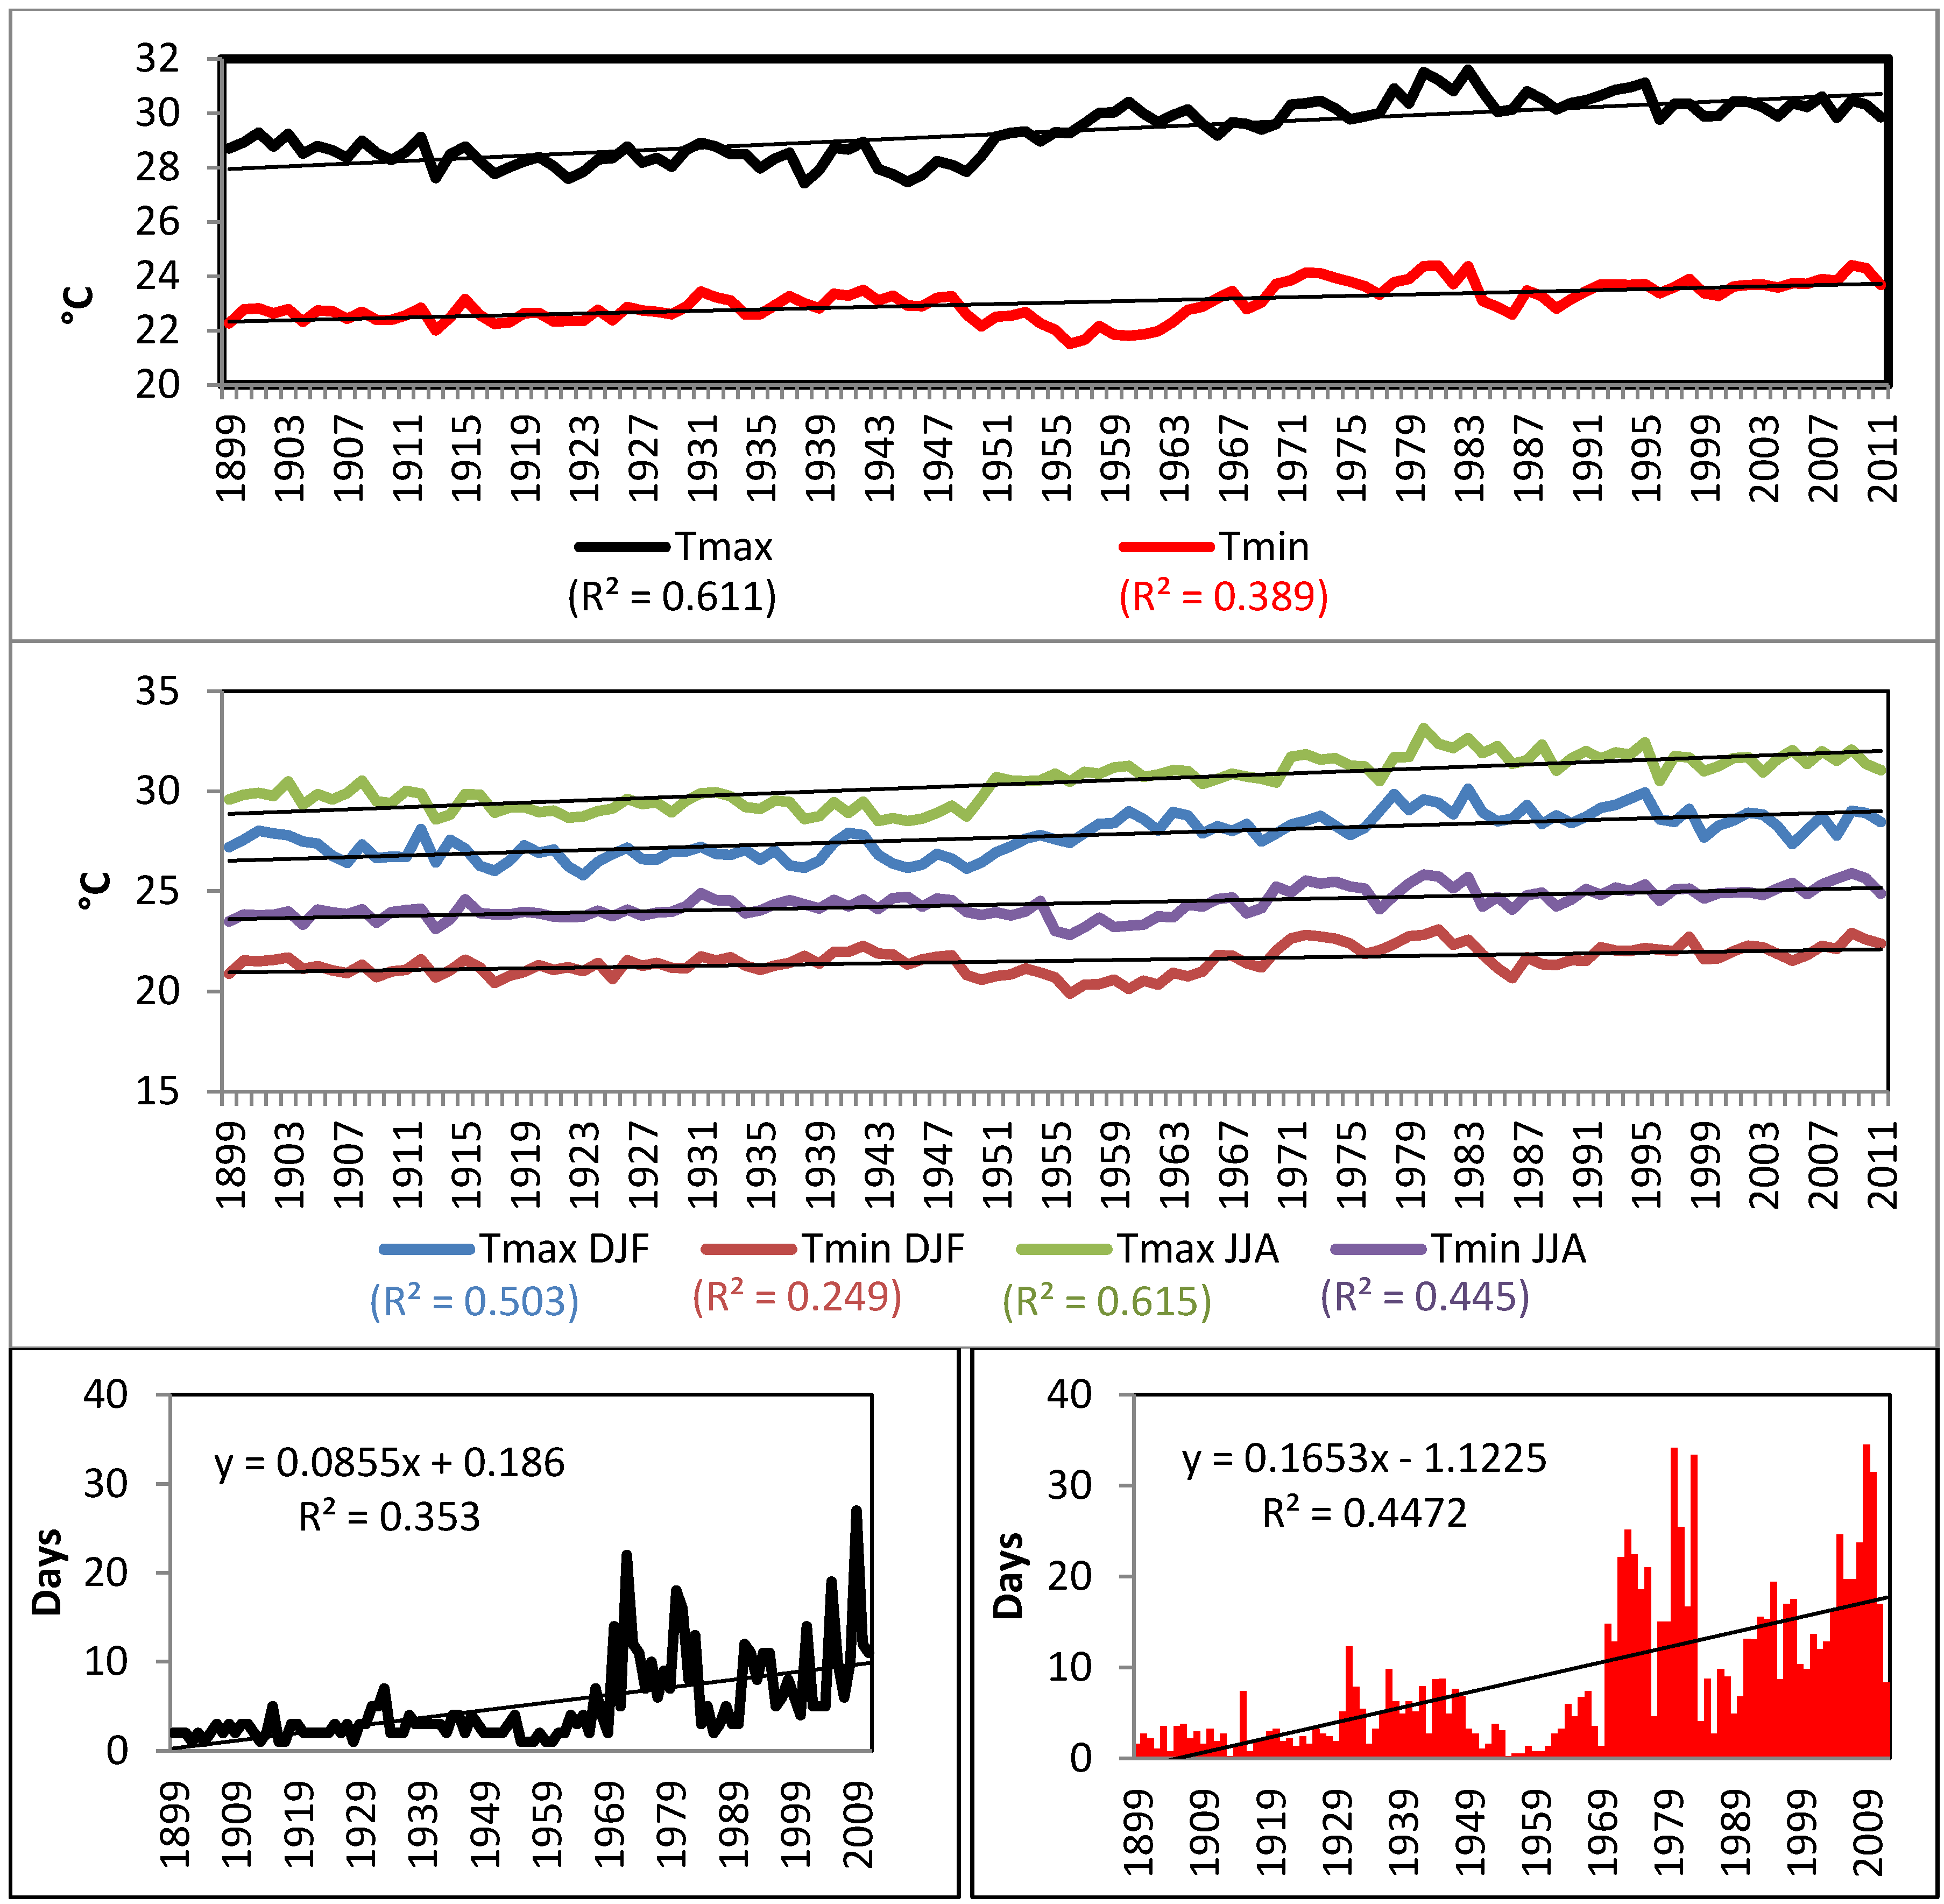
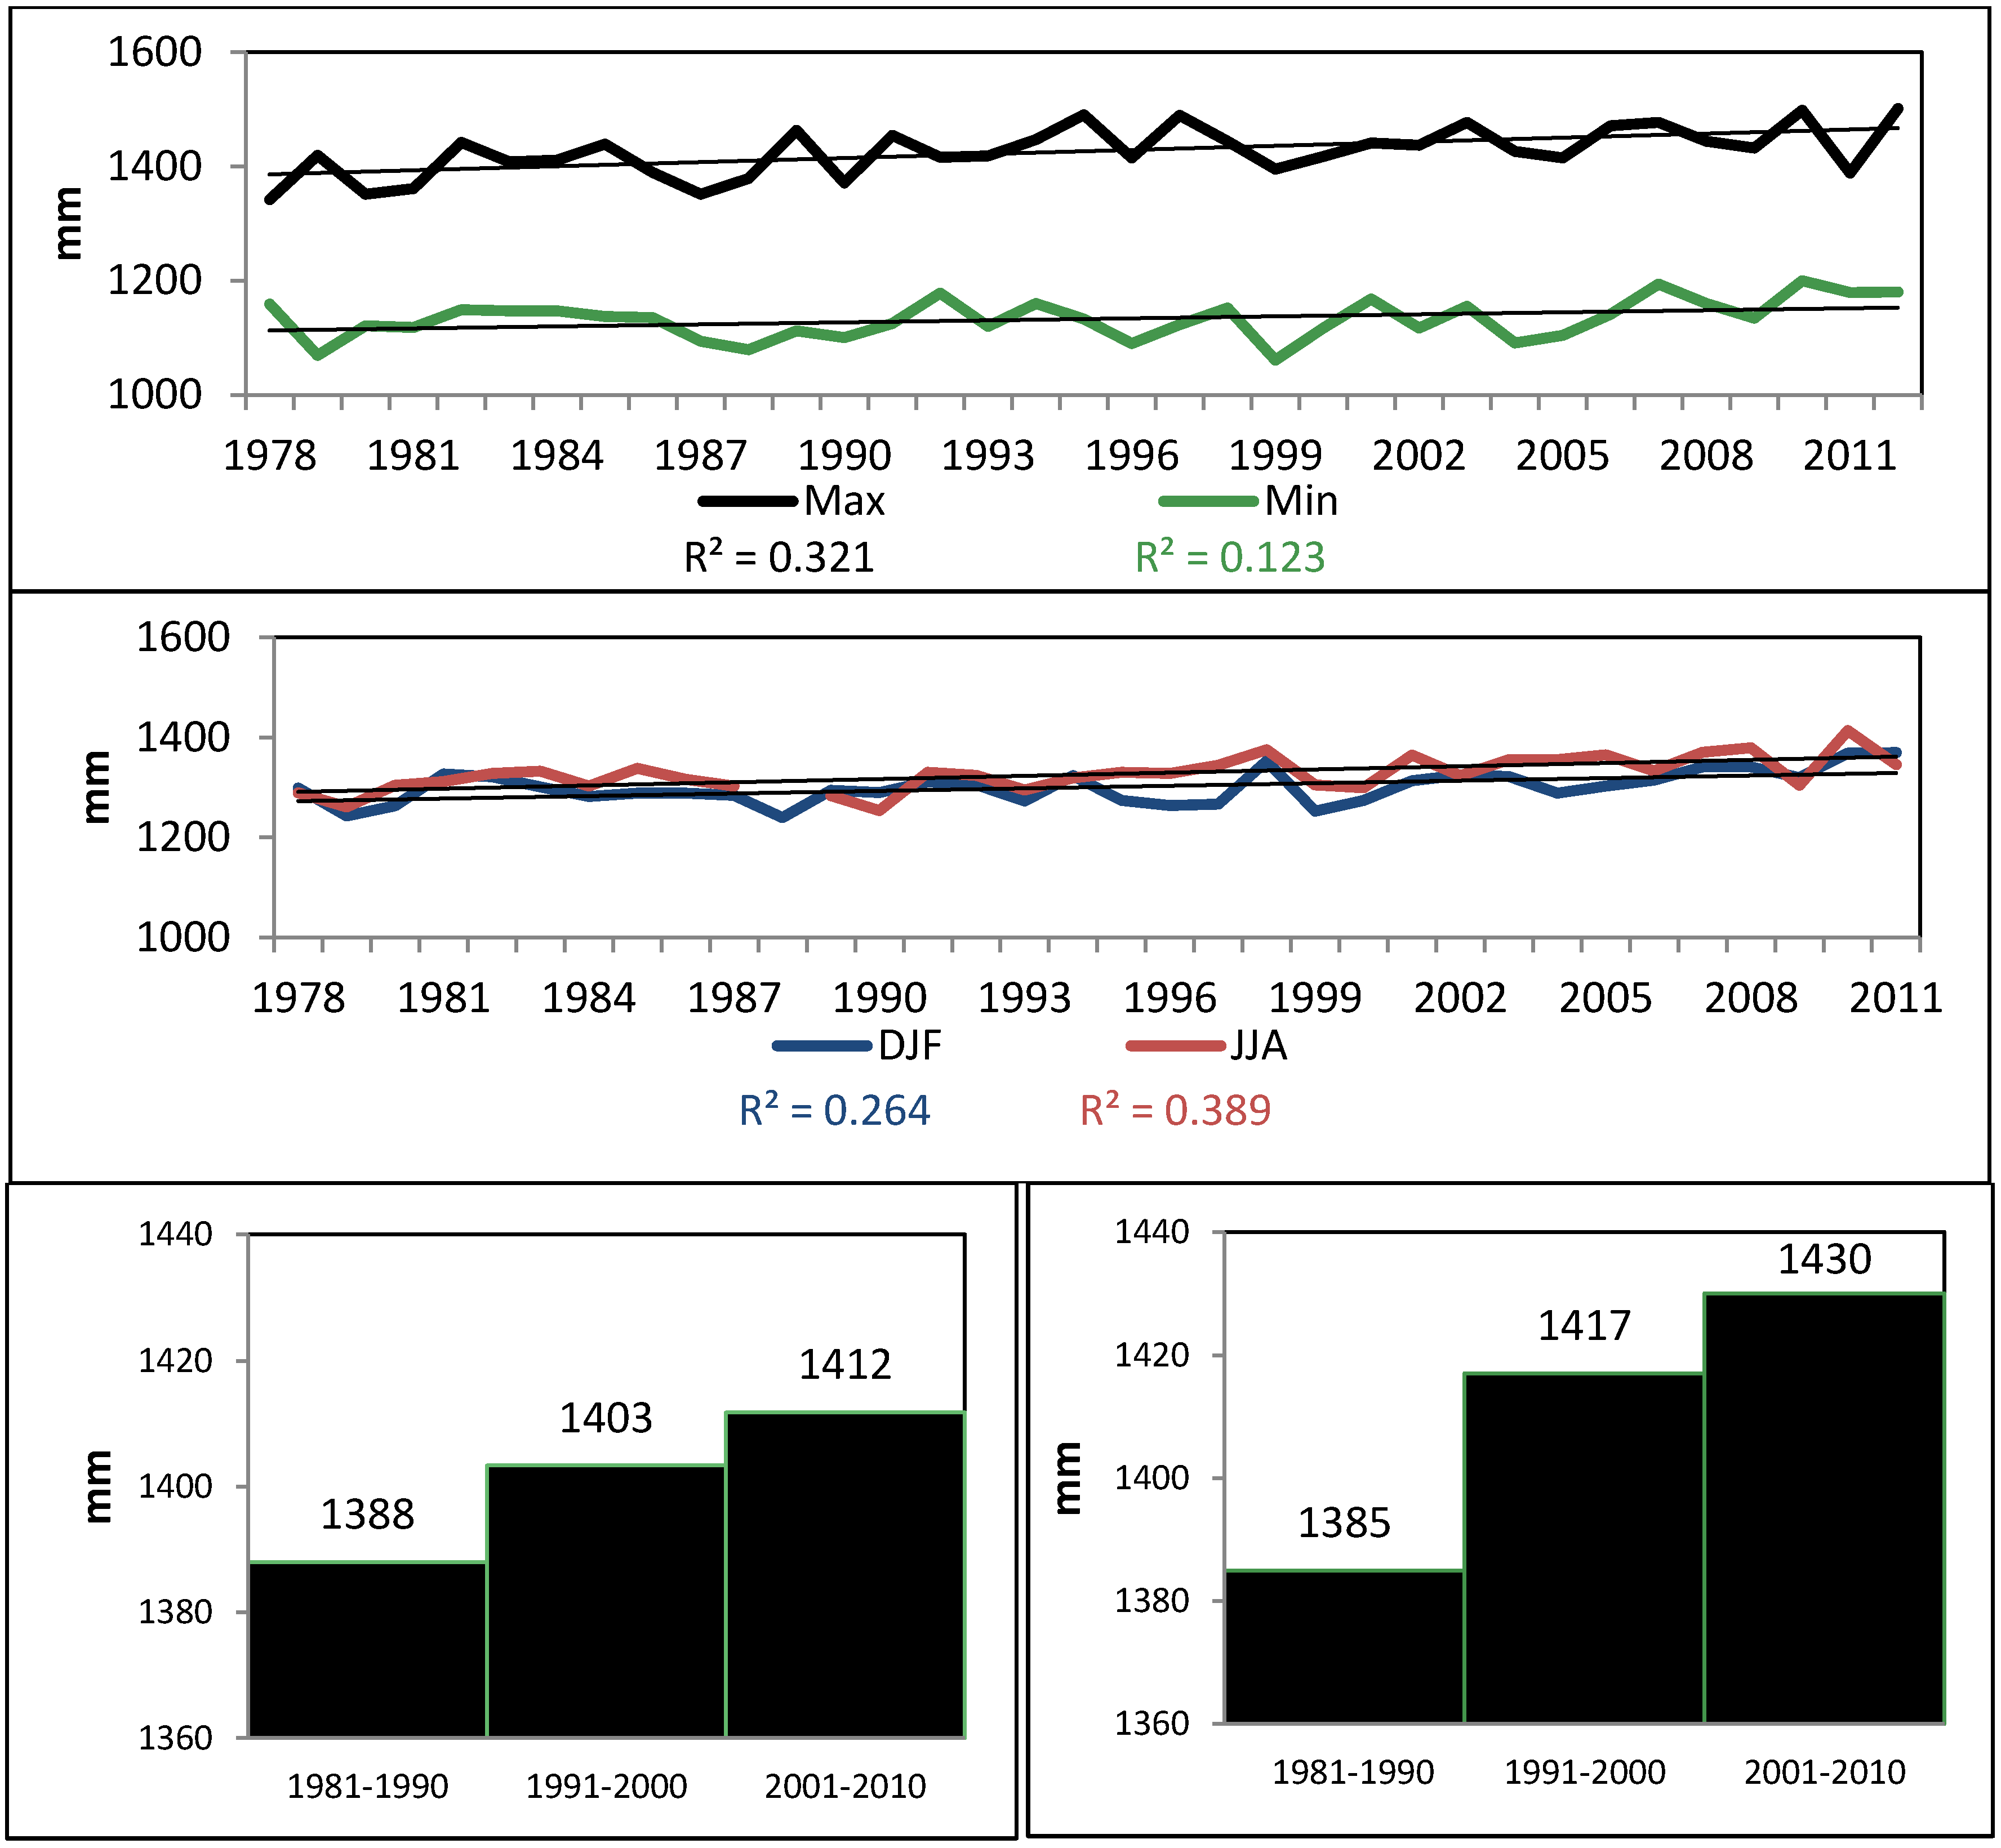
4.1. Oceanographic and Meteorological Trends (1899–2011)


| ID | S | p-value (Two-Tailed) | Test Interpretation |
|---|---|---|---|
| CWD | −195 | 0.63 | Accept H0 |
| CDD | 516 | 0.20 | Accept H0 |
| #Days > 1 mm | −1382 | 0.001 | Reject H0 |
| Max Consecutive days > 90th (13 mm) | −169 | 0.66 | Accept H0 |
| Max Consecutive days R10 mm | 66 | 0.86 | Accept H0 |
| #Days < 1 mm | 1403 | 0.001 | Reject H0 |
| R10 | −676 | 0.09 | Accept H0 |
| R20 | −407 | 0.31 | Accept H0 |
| Max Consecutive days > 95th (22.1 mm) | −412 | 0.26 | Accept H0 |
| Max Consecutive days> R20 mm | −119 | 0.75 | Accept H0 |
| Max Consecutive days > 99th (49.8 mm) | −74 | 0.82 | Accept H0 |
| #Days > 99th (49.8 mm) | 168 | 0.67 | Accept H0 |
| #Days > 95th (22.1 mm) | −544 | 0.18 | Accept H0 |
| TN10p | −1167 | 0.002 | Reject H0 |
| TX10p | −1313 | 0.001 | Reject H0 |
| TN90p | 3102 | 0.0001 | Reject H0 |
| TX90p | 3535 | 0.0001 | Reject H0 |
| WSDI | 3109 | 0.0001 | Reject H0 |
| CSDIX | −1263 | 0.001 | Reject H0 |
| CSDIN | −1124 | 0.003 | Reject H0 |
| SLP Annual Max | −310 | 0.0001 | Reject H0 |
| SLP Annual Min | 36 | 0.591 | Accept H0 |
| SLP Annual Average | −184 | 0.004 | Reject H0 |
| SLP #Days < 10th percentile | 146 | 0.014 | Reject H0 |
| SLP Monthly Max | −1816 | 0.0001 | Reject H0 |
| MSL Max | 242 | 0.0001 | Reject H0 |
| MSL Min | 212 | 0.002 | Reject H0 |
| MSL Average | 225 | 0.001 | Reject H0 |
| SST Annual Max | 219 | 0.0001 | Reject H0 |
| SST Annual Min | 99 | 0.09 | Accept H0 |
| Wind Speed Annual Average | −81 | 0.238 | Accept H0 |
| Wind Speed Annual Max | −255 | 0.0001 | Reject H0 |

4.2. Association between Dengue Fever and Ocean- and Meteorological Change (1992–2011)
| Periods | Variables | Dengue Cases | SST | SLP | Rainfall | Tmax | Tmin | MSL |
|---|---|---|---|---|---|---|---|---|
| 1992–2011 | Dengue Cases | 1 | 0.36 | −0.31 | 0.22 | 0.16 | 0.25 | 0.33 |
| SST | 0.36 | 1 | −0.63 | 0.48 | 0.63 | 0.72 | 0.74 | |
| SLP | −0.31 | −0.63 | 1 | −0.40 | −0.36 | −0.41 | −0.59 | |
| Rainfall | 0.22 | 0.48 | −0.39 | 1 | 0.19 | 0.38 | 0.29 | |
| Tmax | 0.16 | 0.63 | −0.35 | 0.19 | 1 | 0.90 | 0.47 | |
| Tmin | 0.25 | 0.72 | −0.41 | 0.38 | 0.90 | 1 | 0.53 | |
| MSL | 0.33 | 0.74 | −0.59 | 0.29 | 0.47 | 0.53 | 1 |

5. Conclusions
Acknowledgments
Author Contributions
Conflicts of Interest
References
- Moore, C.; Cline, B.; Ruiz-Tiben, E.; Lee, D.; Romney-Joseph, H.; Rivera-Correa, E. Aedes aegypti in Puerto Rico: Environmental determinants of larval abundance and relation to dengue virus transmission. Amer. Soc. Trop. Med. Hyg. 1978, 27, 1225–1231. [Google Scholar]
- Shope, R. Global climate change and infectious diseases. Environ. Health Perspect. 1991, 96, 171–174. [Google Scholar] [CrossRef]
- Githeko, A.; Lindsay, S.; Confalonieri, U.; Patz, J. Climate change and vector-borne diseases: A regional analysis. Bull. WHO. 2000, 78. Available online: http://www.who.int/bulletin/archives/78%289%291136.pdf (accessed on 2 September 2014).
- Brunkard, J.M.; Cifuentes, E.; Rothenberg, S.J. Assessing the roles of temperature, precipitation, and ENSO in dengue re-emergence on the Texas-Mexico border region. Salud Pública Mex. 2008, 50, 227–234. [Google Scholar]
- Johansson, M.A.; Dominici, F.; Glass, G.E. Local and global effects of climate on dengue transmission in Puerto Rico. PLoS Negl. Trop. Dis. 2009. [Google Scholar] [CrossRef]
- Barrera, R. Dinámica del Dengue y Aedes Aegypti en Puerto Rico. Revista Biomédica 2010, 21, 179–195. (In Spanish) [Google Scholar]
- Descloux, E.; Mangeas, M.; Menkes, C.E.; Lengaigne, M.; Leroy, A.; Tehei, T.; Guillaumot, L.; Teurlai, M.; Gourinat, A.C.; Benzler, J.; Pfannstiel, A.; Grangeon, J.P.; Degallier, N.; de Lamballerie, X. Climate-based models for understanding and forecasting dengue epidemics. PLoS Negl. Trop. Dis. 2012. [Google Scholar] [CrossRef]
- Climate Change 2013: The Physical Science Basis; Cambridge University Press: Cambridge, UK; New York, NY, USA, 2013; p. 1535.
- Méndez-Lázaro, P.; Martínez, J. Tendencias Hidroclimáticas y Cambios en el Paisaje de Puerto Rico. Análisis Hidroclimático; Editorial Académica Española: Saarbrücken, Alemania, Germany, 2012. (In Spanish) [Google Scholar]
- Alkama, R.; Decharme, B.; Douville, H.; Ribes, A. Trends in global and basin-scale runoff over the late twentieth century: Methodological issues and sources of uncertainty. J. Climate 2011, 24, 3000–3014. [Google Scholar] [CrossRef]
- Milly, P.C.D.; Betancourt, J.; Falkenmark, M.; Hirsch, R.M.; Kundzewicz, Z.W.; Lettenmaier, D.P.; Stouffer, R.J. Stationarity is dead: Whither water management? Science 2008, 319, 573–574. [Google Scholar] [CrossRef]
- Summary for policymakers. In Climate Change 2007: The Physical Science Basis. Contribution of Working Group I to the Fourth Assessment Report of the Intergovernmental Panel on Climate Change; Solomon, S.; Qin, D.; Manning, M.; Chen, Z.; Marquis, M.; Averyt, K.B.; Tignor, M.; Miller, H.L. (Eds.) Cambridge University Press: Cambridge, UK; New York, NY, USA, 2007.
- Aguilar, E.; Peterson, T.C.; Obando, P.R.; Frutos, R.; Retana, J.A.; Solera, M.; Soley, J.; García, I.G.; Araujo, R.M.; Santos, A.R.; et al. Changes in precipitation and temperature extremes in central America and northern south America, 1961–2003. J. Geophys. Res. 2005. [Google Scholar] [CrossRef]
- Muller-Karger, F.E. River discharge variability including satellite-observed plume-dispersal patterns. In Climate Change in the Intra-Americas Sea; Maul, G., Ed.; United Nations Environmental Programme (Wider Caribbean Region) and Intergovernmental Oceanographic Commissions (Caribbean and Adjacent Regions), Edward Arnold Publishers Ltd.: London, UK, 1993; Chapter 8; pp. 162–192. [Google Scholar]
- Ramasamy, R.; Surendran, S.N. Possible impact of rising sea levels on vector-borne infectious diseases. BMC Infect. Dis. 2011, 11. [Google Scholar] [CrossRef]
- Portier, C.J.; Thigpen-Tart, K.; Carter, S.R.; Dilworth, C.H.; Grambsch, A.E.; Gohlke, J.; Hess, J.; Howard, S.N.; Luber, G.; Lutz, J.T.; et al. A human health perspective on climate change: A report outlining the research needs on the human health effects of climate change. Environ. Health Perspect. 2010. [Google Scholar] [CrossRef]
- Protecting Health from Climate Change: Connecting Sciences, Policy and People; World Health Organization: Geneva, Switzerland, 2009.
- Johansson, M.A.; Cummings, D.A.T.; Glass, G.E. Multiyear climate variability and dengue—El Niño southern Oscillation, weather, and dengue incidence in Puerto Rico, Mexico, and Thailand: A longitudinal data analysis. PLoS Med. 2009. [Google Scholar] [CrossRef]
- Ramasamy, R.; Surendran, S.N. Global climate change and its potential impact on disease transmission by salinity-tolerant mosquito vectors in coastal zones. Front. Physiol. 2012. [Google Scholar] [CrossRef]
- Chen, J.; Brissette, F.P.; Leconte, R. Coupling statistical and dynamical methods for spatial downscaling of precipitation. Climatic Change 2012. [Google Scholar] [CrossRef]
- Díaz, M.H.; Rodríguez, H.R.; Rothenberg, S.J.; Gomez-Dantés, H.; Cifuentes, E. Short communication: Impact of climate variability on the incidence of dengue in Mexico. Trop. Med. Int. Health 2007. [Google Scholar] [CrossRef]
- Gonzalez-Feliciano, L.; Deseda, C.; Rivera, A.; Tomashek, K.M.; Munoz-Jordan, J.; Hunsperger, E.; Prado, O.; Santiago, L.M.; Soto, E.; Pérez, J.; et al. Notes from the field: Dengue epidemic—Puerto Rico, January–July 2010. MMWR 2010, 59, 878. Available online: http://www.cdc.gov/mmwr/preview/mmwrhtml/mm5928a4.htm (accessed on 1 September 2014). [Google Scholar]
- Tomashek, K.M.; Gregory, C.J.; Rivera Sánchez, A.; Bartek, M.A.; Garcia Rivera, E.J.; Husnperger, E.; Muñoz-Jordán, J.L.; Sun, W. Dengue deaths in Puerto Rico: Lessons learned from the 2007 epidemic. PLoS Negl. Trop. Dis. 2012, 6. [Google Scholar] [CrossRef]
- Sharp, T.M.; Hunsperger, E.; Santiago, G.A.; Muñoz-Jordan, J.L.; Santiago, L.M.; Rivera, A.; Rodríguez-Acosta, R.L.; Feliciano, L.G.; Margolis, H.; Tomashek, K.H. Virus-specific differences in rates of disease during the 2010 Dengue epidemic in Puerto Rico. PLoS Negl. Trop. Dis. 2013, 7. [Google Scholar] [CrossRef]
- Altaii, K.; Farrugia, R.N. Wind characteristics on the Caribbean island of Puerto Rico. Renewable Energy 2003, 28, 1701–1710. [Google Scholar]
- Colón-Torres, J.A. Climatología de Puerto Rico; La Editorial Universidad de Puerto Rico: Río Piedras, Puerto Rico, 2009. (In Spanish) [Google Scholar]
- Goikoetxea, N.; Borja, A.; Fontán, A.; González, M.; Valencia, V. Trends and anomalies in sea-surface temperature, observed over the last 60 years, within the southeastern Bay of Biscay. Cont. Shelf Res. 2009, 29, 1060–1069. [Google Scholar] [CrossRef]
- Pavlova, O.; Pavlov, V.; Gerland, S. The impact of winds and sea surface temperatures on the Barents Sea ice extent, a statistical approach. J. Marine Syst. 2014, 130, 248–255. [Google Scholar] [CrossRef]
- NOAA—National Climatic Data Center Climate Data. Available online: http://www.ncdc.noaa.gov/cdo-web/ (accessed on 19 September 2013).
- Alexander, L.V.; Zhang, X.; Peterson, T.C.; Caesar, J.; Gleason, B.; Klein-Tank, A.M.G.; Haylock, M.; Collins, D.; Trewin, B.; Rahimzadeh, F.; et al. Global observed changes in daily climate extremes of temperature and precipitation. J. Geophys. Res. 2006. [Google Scholar] [CrossRef]
- Zhang, X.; Alexander, L.; Hegerl, G.C.; Jones, P.; Klein Tank, A.; Peterson, T.C.; Trewin, B.; Zwiers, F. Indices for monitoring changes in extremes based on daily temperature and precipitation data. WIREs Clim. Change 2011. [Google Scholar] [CrossRef]
- Haigh, I.; Nicholls, R.; Wells, N. Assessing changes in extreme sea levels: Application to the English Channel, 1900–2006. Cont. Shelf Res. 2010, 30, 1042–1110. [Google Scholar] [CrossRef]
- Letetrel, C.; Marcos, M.; Martín Míguez, B.; Woppelmann, G. Sea level extremes in Marseille (NW Mediterranean) during 1885–2008. Cont. Shelf Res. 2010, 30, 1267–1274. [Google Scholar] [CrossRef]
- Mudersbach, C.; Wahl, T.; Haigh, I.D.; Jensen, J. Trends in high sea levels of German North Sea gauges compared to regional mean sea level changes. Cont. Shelf Res. 2013, 65, 111–120. [Google Scholar] [CrossRef]
- Wu, P.C.; Lay, J.G.; Guo, H.R.; Lin, C.Y.; Lung, S.C.; Su, H.J. Higher temperature and urbanization affect the spatial patterns of dengue fever transmission in subtropical Taiwan. Sci. Total Envir. 2009, 407, 2224–2233. [Google Scholar] [CrossRef]
- Malmgren, B.A.; Winter, A. Climate zonation in Puerto Rico based on principal components analysis and an artificial neural network. J. Climate 1999, 12, 977–985. [Google Scholar] [CrossRef]
- Pinto, E.; Coelho, M.; Oliver, L.; Massad, E. The influence of climate variables on dengue in Singapore. Int. J. Environ. Health Res. 2011. [Google Scholar] [CrossRef]
- Hales, S.; de Wet, N.; Maindonald, J.; Woodward, A. Potential effect of population and climate changes on global distribution of dengue fever. Lancet 2002. [Google Scholar] [CrossRef]
- Althouse, B.M.; Ng, Y.Y.; Cummings, D.A.T. Prediction of dengue incidence using search query surveillance. PLoS Negl. Trop. Dis. 2011. [Google Scholar] [CrossRef]
- Yue, S.; Pilon, P.; Cavadias, G. Power of Mann-Kendall and Spearman’s rho test for detecting monotonic trends in hydrological series. J. Hydrol. 2001, 259, 254–271. [Google Scholar]
- McCuen, R.H. Modeling Hydrologic Change: Statistical Methods; Lewis Publishers: Boca Raton, FL, USA, 2003. [Google Scholar]
- Kuo, Y.M.; Chu, H.J.; Pan, T.Y.; Yu, H.L. Investigating common trends of annual maximum rainfalls during heavy rainfall events in southern Taiwan. J. Hydrol. 2011, 409, 749–758. [Google Scholar] [CrossRef]
- Chollett, I.; Müller-Karger, F.E.; Heron, S.F.; Skirving, W.; Mumby, P.J. Seasonal and spatial heterogeneity of recent sea surface temperature trends in the Caribbean Sea and southeast Gulf of Mexico. Mar. Pollut. Bull. 2012. [Google Scholar] [CrossRef]
- Skansi, M.M.; Brunet, M.; Sigró, J.; Aguilar, E.; Groening, J.A.A.; Bentancur, O.J.; Castellón-Geier, Y.R.; Correa-Amaya, R.L.; Jácome, H.; Malheiros-Ramos, A.; et al. Warming and wetting signals emerging from analysis of changes in climate extreme indices over South America. Global Planet. Change 2013, 100, 295–307. [Google Scholar] [CrossRef]
- Kang, S.M.; Held, I.M.; Frierson, D.M.W.; Zhao, M. The response of the ITCZ to extratropical thermal forcing: Idealized slab-ocean experiments with a GCM. J. Climate 2008. [Google Scholar] [CrossRef]
- Fontaine, B.; Roucou, P.; Gaetani, M.; Marteau, R. Recent changes in precipitation, ITCZ convection and northern tropical circulation over North Africa (1979–2007). Int. J. Climatol. 2011. [Google Scholar] [CrossRef]
- Taylor, G.T.; Muller-Karger, F.E.; Thunell, R.C.; Scranton, M.I.; Astor, Y.; Varela, R.; Ghinaglia, L.T.; Lorenzoni, L.; Fanning, K.A.; Hameed, S.; Doherty, O. Ecosystem responses in the southern Caribbean Sea to global climate change. PNAS 2012, 109, 19315–19320. [Google Scholar] [CrossRef]
- Ceppi, P.; Hwang, Y.T.; Liu, X.; Frierson, D.M.W.; Hartmann, D. The relationship between the ITCZ and the Southern Hemispheric eddy-driven jet. J. Geophys. Res. Atmos. 2013, 118, 5136–5146. [Google Scholar]
- Walh, T.; Calafat, F.M.; Luther, M.E. Rapid changes in the seasonal sea level cycle along the U.S. Gulf coast from the late 20th century. Geophys. Res. Lett. 2014. [Google Scholar] [CrossRef]
- Banu, S.; Hu, W.; Hurst, C.; Tong, S. Dengue transmission in the Asia-Pacific region: Impact of climate change and socio-environmental factors. Trop. Med. Int. Health 2011. [Google Scholar] [CrossRef]
- Mohammed, A.; Chadee, D.D. Effects of different temperature regimens on the development of Aedes aegypti (L.) (Diptera: Culicidae) mosquitoes. Acta Tropica. 2011, 119, 38–43. [Google Scholar] [CrossRef]
- Brady, O.J.; Johansson, M.A.; Guerra, C.A.; Bhatt, S.; Golding, N.; Pigott, D.M.; Delatte, H.; Grech, M.G.; Leisnham, P.T.; de Freitas, R.M.; et al. Modelling adult Aedes aegypti and Aedes albopictus survival at different temperatures in laboratory and field settings. Parasites Vector 2013, 6. [Google Scholar] [CrossRef]
- Cook, S.; Bennett, S.N.; Holmes, E.C.; de Chesse, R.; Moureau, G.; de Lamballarie, X. Isolation of a new strain of the flavivirus cell fusing agent virus in a natural mosquito population from Puerto Rico. J. Gen. Virol. 2006. [Google Scholar] [CrossRef]
- Ramasamy, R.; Surendran, S.N.; Jude, P.J.; Dharshini, S.; Vinobaba, M. Larval development of Aedes aegypti and Aedes albopictusin peri-urban brackish water and its implications for transmission of arboviral diseases. PLoS Negl. Trop. Dis. 2011. [Google Scholar] [CrossRef]
- Jude, P.J.; Tharmasegaram, T.; Sivasubramaniyam, G.; Senthilnanthanan, M.; Kannathasan, S.; Raveendran, S.; Ramasamy, R.; Surendran, S.N. Salinity-tolerant larvae of mosquito vectors in the tropical coast of Jaffna, Sri Lanka and the effect of salinity on the toxicity of Bacillus thuringiensis to Aedes aegypti larvae. Parasites Vector 2012, 5. [Google Scholar] [CrossRef]
- Surendran, S.N.; Jude, P.J.; Thabothiny, V.; Raveendran, S.; Ramasamy, R. Pre-imaginal development of Aedes aegypti in brackish and fresh water urban domestic wells in Sri Lanka. J. Vector Ecol. 2012. [Google Scholar] [CrossRef]
- Centers for Disease Control and Prevention (CDC). Available online: http://www.cdc.gov/chikungunya/geo/united-states.html (accessed on 5 August 2014).
- Rigau-Perez, J.G.; Vorndam, A.V.; Clark, G.G. The dengue and dengue hemorrhagic fever epidemic in Puerto Rico, 1994–1995. Amer. J. Trop. Med. Hyg. 2001, 64, 67–74. [Google Scholar]
- Rigau-Pérez, J.G.; Ayala-López, A.; García-Rivera, E.J.; Hudson, S.M.; Vorndam, V.; Reiter, P.; Cano, M.P.; Clark, G.G. The reappearance of dengue-3 and a subsequent dengue-4 and dengue-1 epidemic in Puerto Rico in 1998. Amer. J. Trop. Med. Hyg. 2002, 67, 355–362. [Google Scholar]
- Tomashek, K.M.; Rivera, A.; Moños-Jordan, J.; Hunsperger, E.; Santiago, L.; Padro, O.; García, E.; Sun, W. Description of a large island-wide outbreak of dengue in Puerto Rico, 2007. Amer. J. Trop. Med. Hyg. 2009, 81, 467–474. [Google Scholar]
- Dick, O.B.; San-Martín, J.L.; Montoya, R.H.; del Diego, J.; Zambrano, B.; Dayan, G.H. Review: The history of dengue outbreaks in the Americas. Amer. J. Trop. Med. Hyg. 2012. [Google Scholar] [CrossRef]
- Larrieu, S.; Cassadou, S.; Rosine, J.; Chappert, J.L.; Blateau, A.; Ledrans, M.; Quénel, P. Lessons raised by the major 2010 dengue epidemics in the French West Indies. Acta Tropica 2014, 131, 37–40. [Google Scholar] [CrossRef]
- World Meteorological Organization. The Global Climate 2001–2010. A Decade of Climate Extremes, Summary Report, 2013. Available online: http://www.unep.org/pdf/wmo_report.pdf (accessed on 2 March 2014).
- Feltrim-Roseghini, W.F.; Mendoça, F.; Ceccato, P.; Fernandes, K. Dengue epidemics in middle-south of Brazil: Climate constraints and some social aspects. Revista. Brasileira. de Climatologia. 2011. Available online: http://ojs.c3sl.ufpr.br/ojs/index.php/revistaabclima/article/viewFile/27522/18336 (accessed on 17 February 2014).
- Regis, L.; Souza, W.V.; Furtado, A.F.; Fonseca, C.D.; Silveira Jr., J.C.; Ribeiro, P.J.; Melo-Santos, M.A.V.; Carvalho, M.S.; Monteiro, A.M.V. An entomological surveillance system based on open spatial information for participative dengue control. Anais. da Academia Brasileira. de Ciências 2009, 81, 655–662. [Google Scholar] [CrossRef]
- Burke, R.; Barrera, R.; Lewis, M.; Kluchinsky, T.; Claborn, D. Septic tanks as larval habitats for the mosquitoes Aedes aegypti and culex quinquefasciatus in Playa-Playita, Puerto Rico. Med. Vet. Entomol. 2010. [Google Scholar] [CrossRef]
- Little, E. Characterizing the urban environment of dengue mosquitoes in Patillas, Puerto Rico. Trop. Resour. Bull. 2011, 30, 36–42. [Google Scholar]
© 2014 by the authors; licensee MDPI, Basel, Switzerland. This article is an open access article distributed under the terms and conditions of the Creative Commons Attribution license (http://creativecommons.org/licenses/by/3.0/).
Share and Cite
Méndez-Lázaro, P.; Muller-Karger, F.E.; Otis, D.; McCarthy, M.J.; Peña-Orellana, M. Assessing Climate Variability Effects on Dengue Incidence in San Juan, Puerto Rico. Int. J. Environ. Res. Public Health 2014, 11, 9409-9428. https://doi.org/10.3390/ijerph110909409
Méndez-Lázaro P, Muller-Karger FE, Otis D, McCarthy MJ, Peña-Orellana M. Assessing Climate Variability Effects on Dengue Incidence in San Juan, Puerto Rico. International Journal of Environmental Research and Public Health. 2014; 11(9):9409-9428. https://doi.org/10.3390/ijerph110909409
Chicago/Turabian StyleMéndez-Lázaro, Pablo, Frank E. Muller-Karger, Daniel Otis, Matthew J. McCarthy, and Marisol Peña-Orellana. 2014. "Assessing Climate Variability Effects on Dengue Incidence in San Juan, Puerto Rico" International Journal of Environmental Research and Public Health 11, no. 9: 9409-9428. https://doi.org/10.3390/ijerph110909409
APA StyleMéndez-Lázaro, P., Muller-Karger, F. E., Otis, D., McCarthy, M. J., & Peña-Orellana, M. (2014). Assessing Climate Variability Effects on Dengue Incidence in San Juan, Puerto Rico. International Journal of Environmental Research and Public Health, 11(9), 9409-9428. https://doi.org/10.3390/ijerph110909409