3.1. Description and Evaluation of Selected Residential Areas
The description of selected residential areas (
Table 1) shows that the new residential complexes are much smaller in size even compared to Bonifacija, which is the smallest of the four older residential estates. The latter includes a local shop, community meeting facilities and a nursery with its own open area, as a part of the basic residential estate services. The plot ratio is higher in the new residential complexes than in Bonifacija, with Floor Space Index (FSI) exceeding the recommended values. Higher FSI means that a more residents will live in a given area [
24], leading to a higher demand of open spaces within the residential area, most obviously noted in the case of Celovški Dvori. The above also implies that an appropriate amount of open spaces is not provided.
FSI and the number of residents (
Table 1) show the demand for using communal playgrounds, sports facilities (
Table 2) and open green areas (
Table 3). The surface of children playgrounds is inadequate in all studied cases; the situation is worst in Mesarska with 0.70 square metres of playground area per resident and a very high share—30.00% of children in the population [
33].
Table 1.
Evaluation of residential areas: spatial mesaure “residential area”, described by different indicators.
Table 1.
Evaluation of residential areas: spatial mesaure “residential area”, described by different indicators.
| Measure | Indicator | Type of Measurement | Nova Grbina | Viška Sončava | Celovški Dvori | Mesarska | vs4 Bonifacija |
|---|
| Value |
|---|
| Residential Area | surface area | m2 | 30,700.10 | 20,443.54 | 24,364.42 | 30,299.44 | 83,744.53 |
| number of residents | number | 543.00 | 342.00 | 526.00 | 799.00 | 1613.00 |
| FSI—floor space index | gross floor surface area/site surface area | 1.14 | 1.17 | 2.79 | 1.80 | 0.68 |
| site coverage | gross ground floor surface area/site surface area | 0.33 | 0.41 | 0.27 | 0.30 | 0.20 |
Comparison also shows a very low surface of playgrounds per resident in the case of Celovški Dvori, however they do provide communal sports facilities, unlike any other studied case. Bonifacija has the largest amount of playgrounds and sports facilities, which are also of the highest quality from the aspect of landscape design: large trees, bushes, a lawn, a hill. All new playgrounds lack such landscape features; in Viška Sončava playgrounds have no landscape elements at all. This is due to the practice of implementing green areas on the roofs of underground car parks, where the thickness of the soil layer does not support trees and designing park features [
34]. One important consequence is poor or non-existent sun shelter.
Table 2.
Evaluation of residential areas: spatial measure “equipment”, described by different indicators.
Table 2.
Evaluation of residential areas: spatial measure “equipment”, described by different indicators.
| Measure | Indicator | Type of Measurement | Nova Grbina | Viška Sončava | Celovški Dvori | Mesarska | vs4 Bonifacija |
|---|
| Value |
|---|
| Equipment | children’s playgrounds | m2 | 1226.80 | 515.20 | 350.00 | 556.00 | 1867.00 |
m2/
number of residents | 2.30 | 1.51 | 0.67 | 0.70 | 1.16 |
| sports facilities | m2 | 0.00 | 0.00 | 393.00 | 0.00 | 658.00 |
m2/
number of residents | 0.00 | 0.00 | 0.75 | 0.00 | 0.41 |
| car park areas | number of parking places/apartment | 1.80 | 1.50 | 2.00 | 2.00 | 0.90 |
For the aim of this research, the active-use areas were calculated (
Table 3) excluding private areas, car parks and streets, and passive-use (private) areas. Active-use green areas are considered the ones substantially contributing to the overall quality of life and are equally accessible to all residents. The largest proportion of active-use open and green areas can be found in Bonifacija (29.48 m
2 per resident). Mesarska (14,849.14 m²) has the highest amount of these areas among the neigbourhoods, followed by Viška Sončava and Celovški Dvori. However, even these numbers do not adequately describe the actual situation, since these areas are often the least experientially diverse; fully paved or tartan-covered surfaces, with no greenery and experiential value.
Table 3.
Evaluation of residential areas: spatial mesaure “open and green areas”, described by different indicators (all open areas, functional areas—excluding private groundfloor atrium gardens, roads and external car park areas, passive areas—atriums, private use).
Table 3.
Evaluation of residential areas: spatial mesaure “open and green areas”, described by different indicators (all open areas, functional areas—excluding private groundfloor atrium gardens, roads and external car park areas, passive areas—atriums, private use).
| Measure | Indicator | Type of Measurement | Nova Grbina | Viška Sončava | Celovški Dvori | Mesarska | vs4 Bonifacija |
|---|
| Value |
|---|
| Open and Green Areas | all open areas | m2 | 20,669.51 | 12,115.06 | 14,284.42 | 20,959.14 | 66,946.51 |
| functional areas (active-use areas) | m2 | 8438.60 | 6829.84 | 12,976.17 | 14,849.14 | 47,557.51 |
| m2/number of residents | 15.54 | 19.97 | 24.67 | 18.58 | 29.48 |
| m2/residential unit | 26.70 | 27.54 | 15.58 | 21.58 | 52.61 |
| passive areas | m2 | 2426.09 | 1182.38 | 1308.25 | 6110.00 | 5190.00 |
| m2/number of residents | 4.47 | 3.46 | 2.49 | 7.65 | 3.20 |
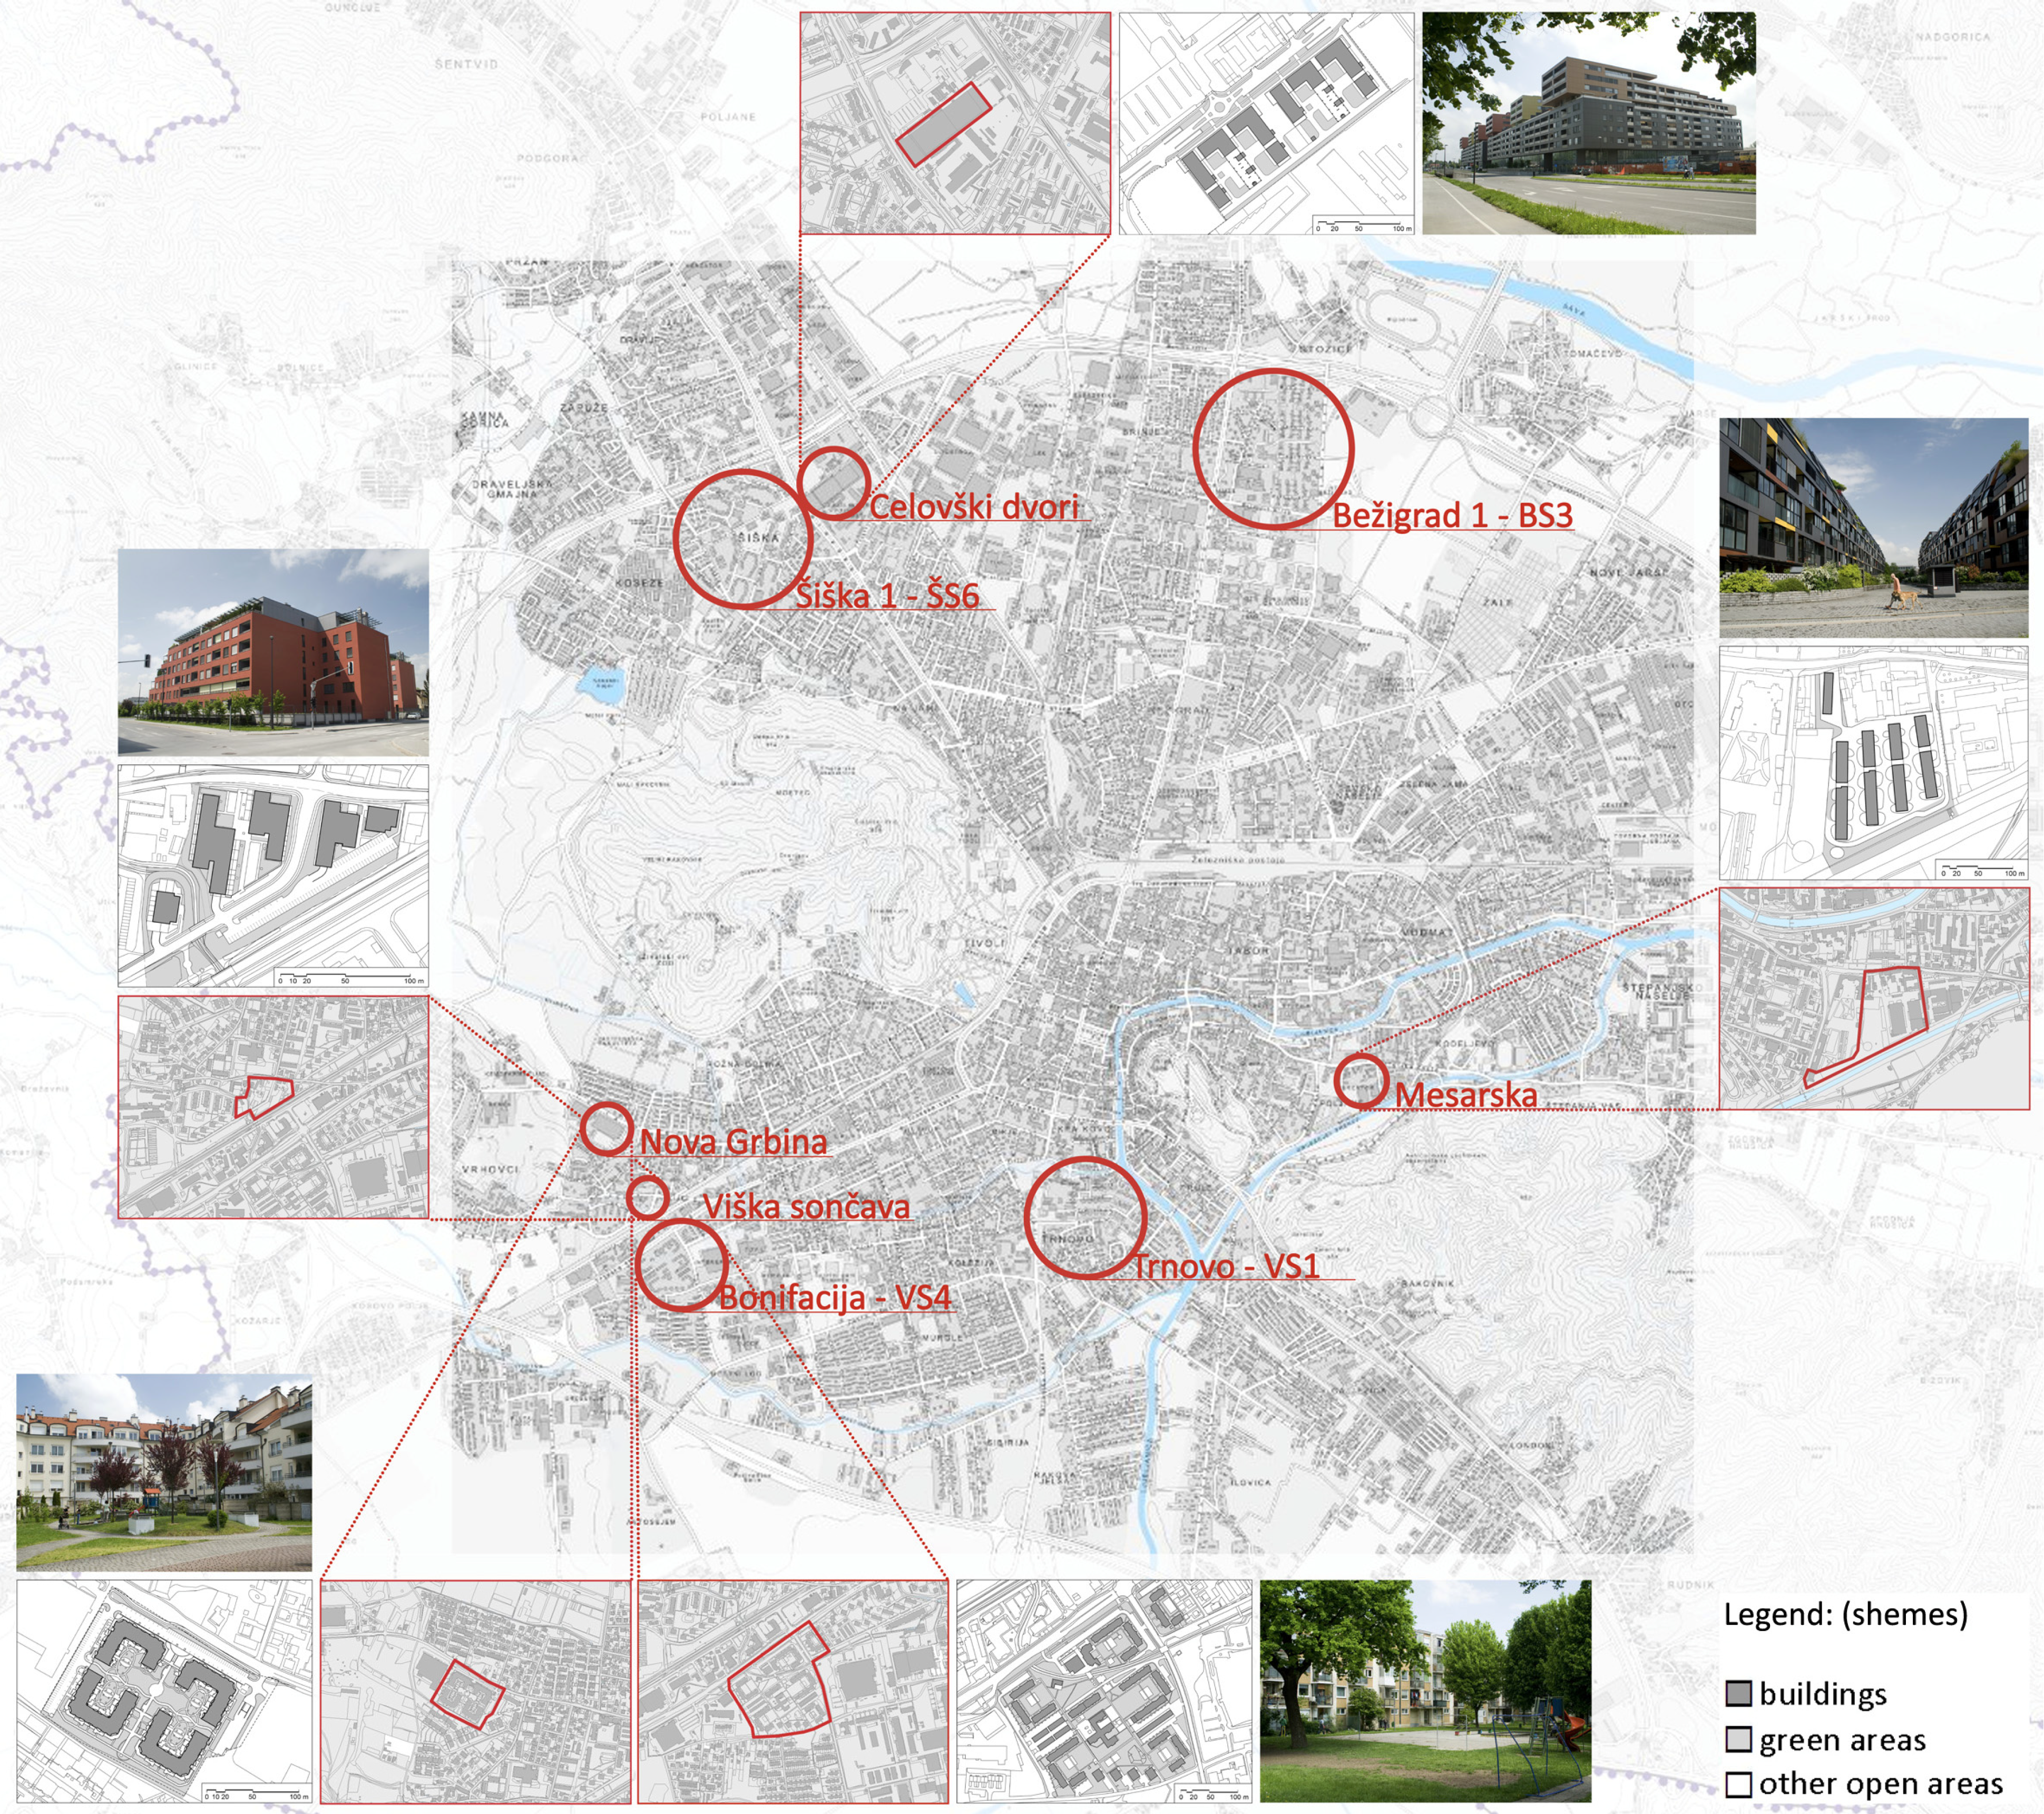
These results provide empirical evidence that the open space in post transition residential areas does not meet the standards either in terms of recommended value or in terms of comparison with older example. Bonifacija is a good practice example with its versatile urban furniture, green areas and adequate amount of open areas, offering various spatial uses and activities for all age groups. There are also differences among the new neighbourhoods: open space quality and quantity is best in Nova Grbina. Although open spaces with many children’s playgrounds and a sports field in Celovški Dvori offer a wide variety of uses, the high density of the area, and poor greenery restrict the possibilities for open space use. The open spaces of Viška Sončava and Mesarska, which lack any green areas, are the poorest examples within the selected residential areas.
3.2. Behavioural Observations and Mapping
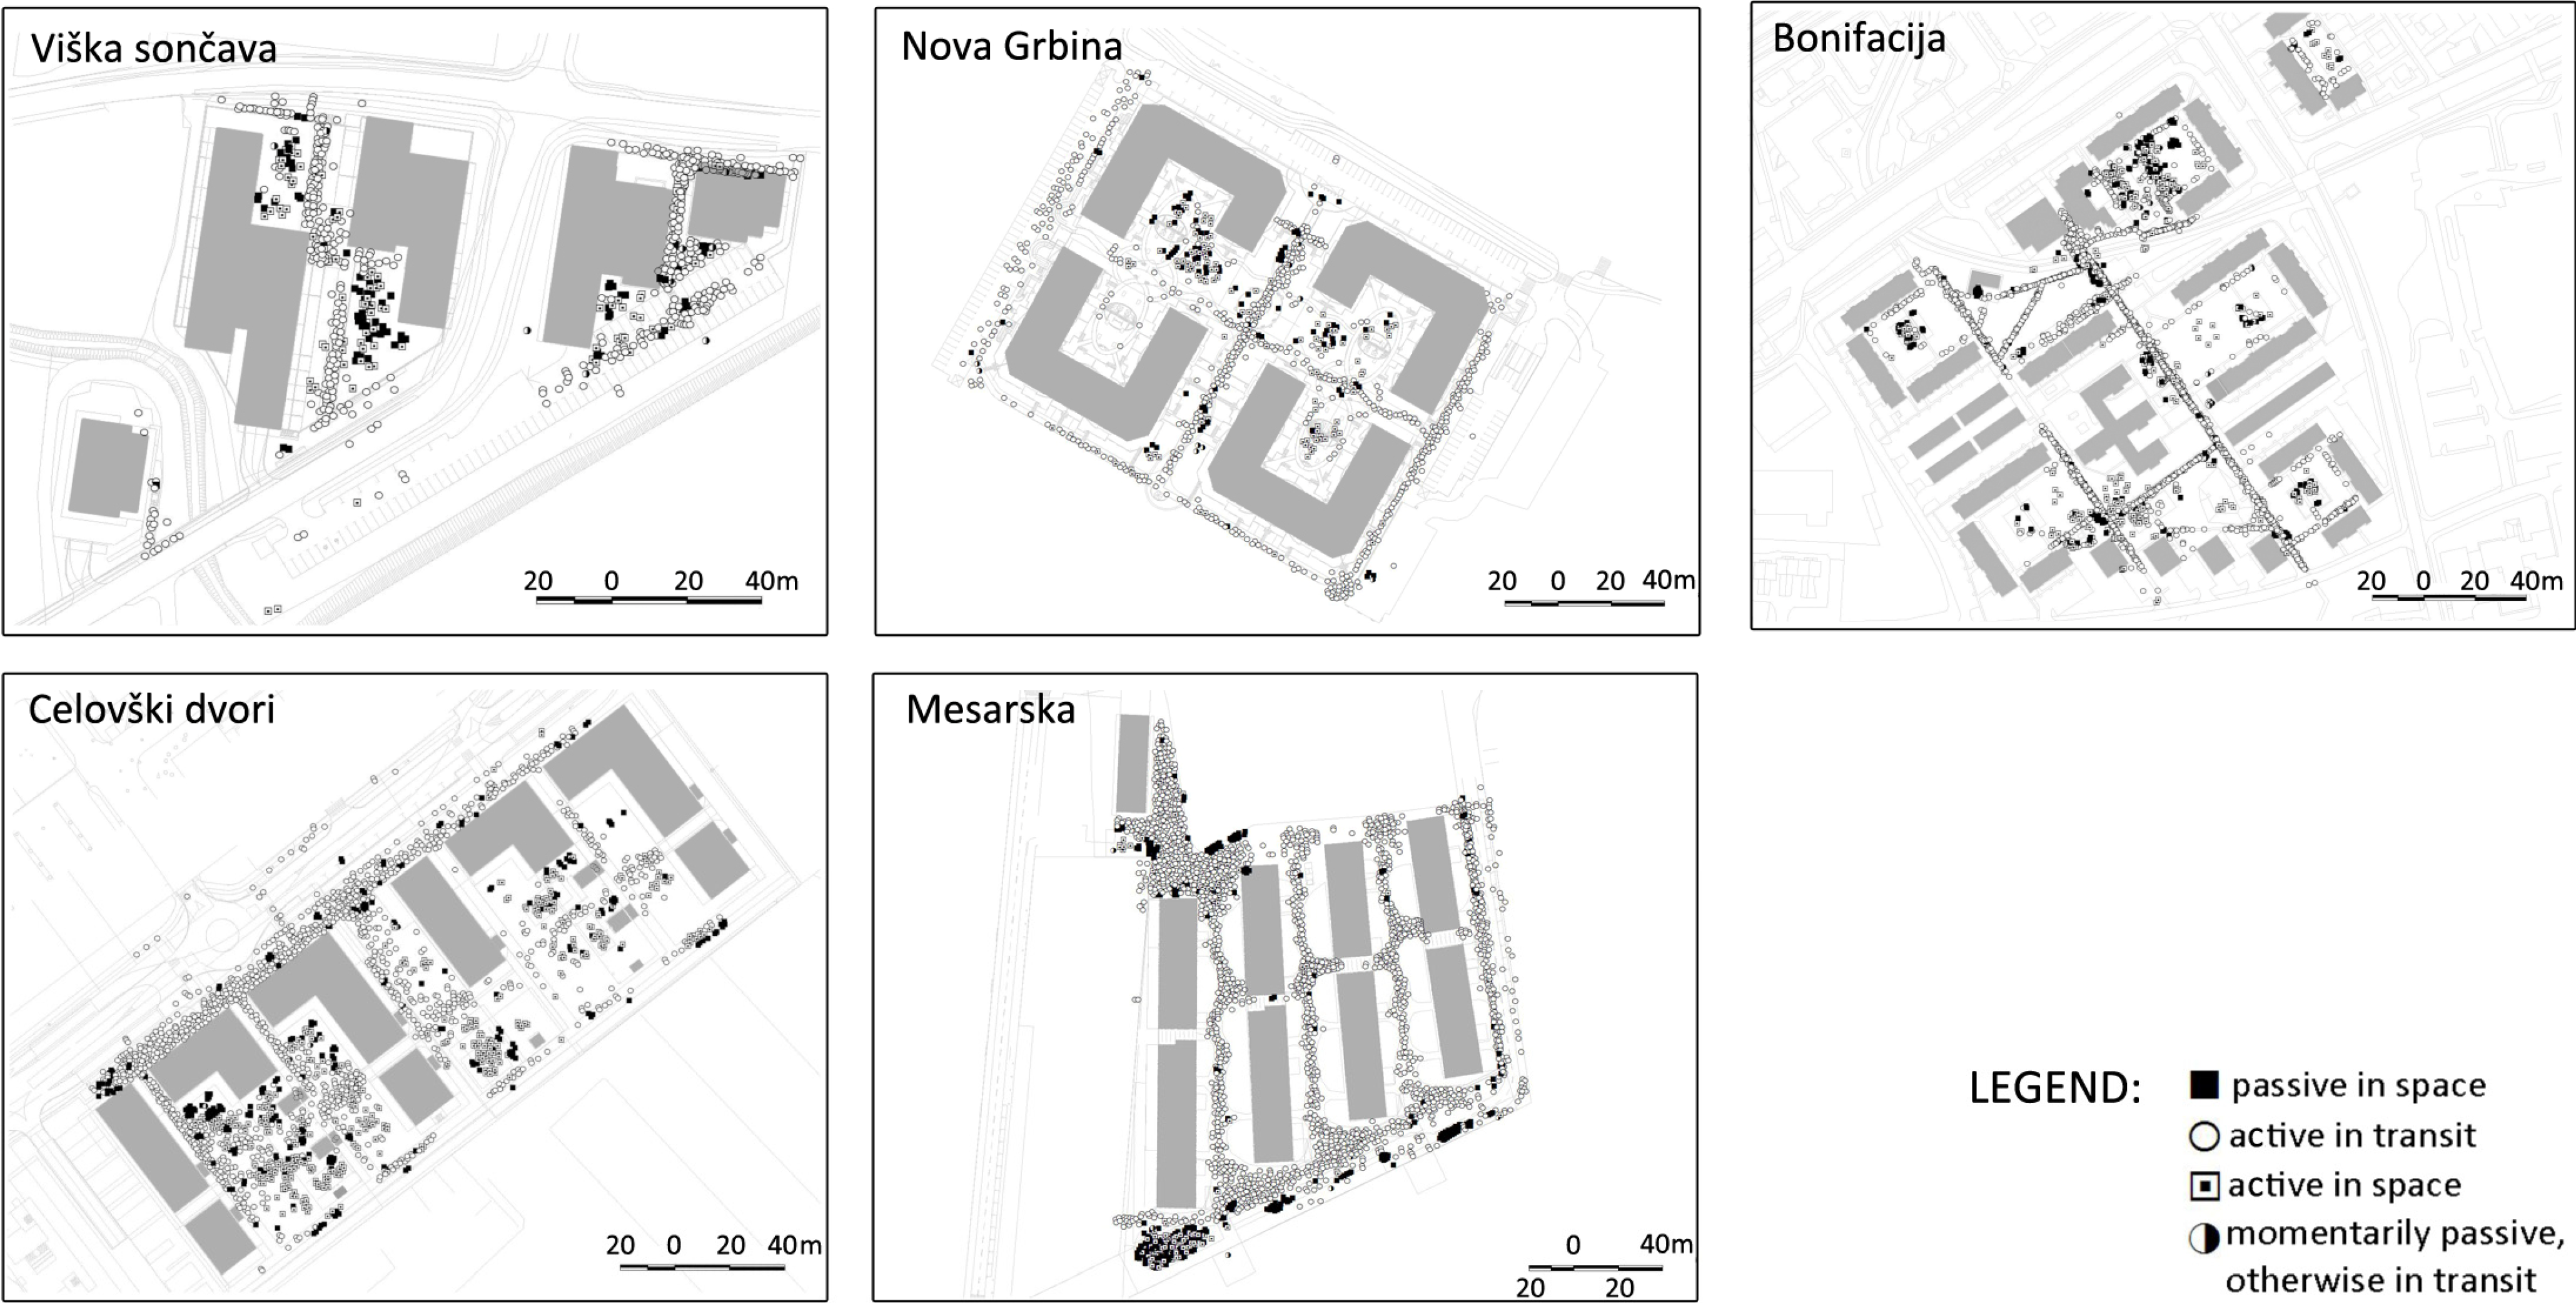
The graphical presentation of observations enables an insight of spatial use according to “category of activity” and “age group”. The activities included in the category “active in space”, are e.g., child’s play, playful running and trampoline jumping; and the activities defined as “passive in space” include e.g., minding children while they play, sitting on a bench, chatting, etc.
In general, the observation method revealed that all open spaces in the newer residential areas are mostly used by the youngest users, while the lack of facilities for other age groups (e.g., playgrounds for older children, sports fields, and shaded and safe spaces for retired residents) results in less (active) use among these users. Despite the poor spatial street furniture and landscape features of the newer residential areas, there were many open space users observed in these areas. However, the majority of observed users were engaged in transitory activities, indicating that open spaces do not attract or not even enable activities of spending more time in the area. Based on the observations, Bonifacija again provided an example of good practice: transitory uses were limited to the footpaths, while a variety of activities were observed in different areas offering possibilities (benches, playgrounds, trampolines, diverse landscape features), a higher number of retired residents were observed who spend their time outdoors, and a wider variety of children’s play (
Figure 2 and
Figure 3).
Figure 2.
Graphical presentation of observation results according to the “Activity” category.
Figure 2.
Graphical presentation of observation results according to the “Activity” category.
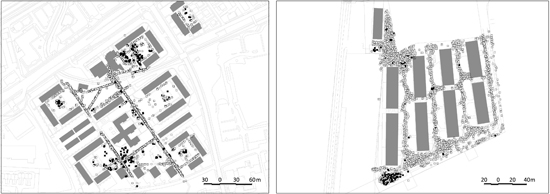
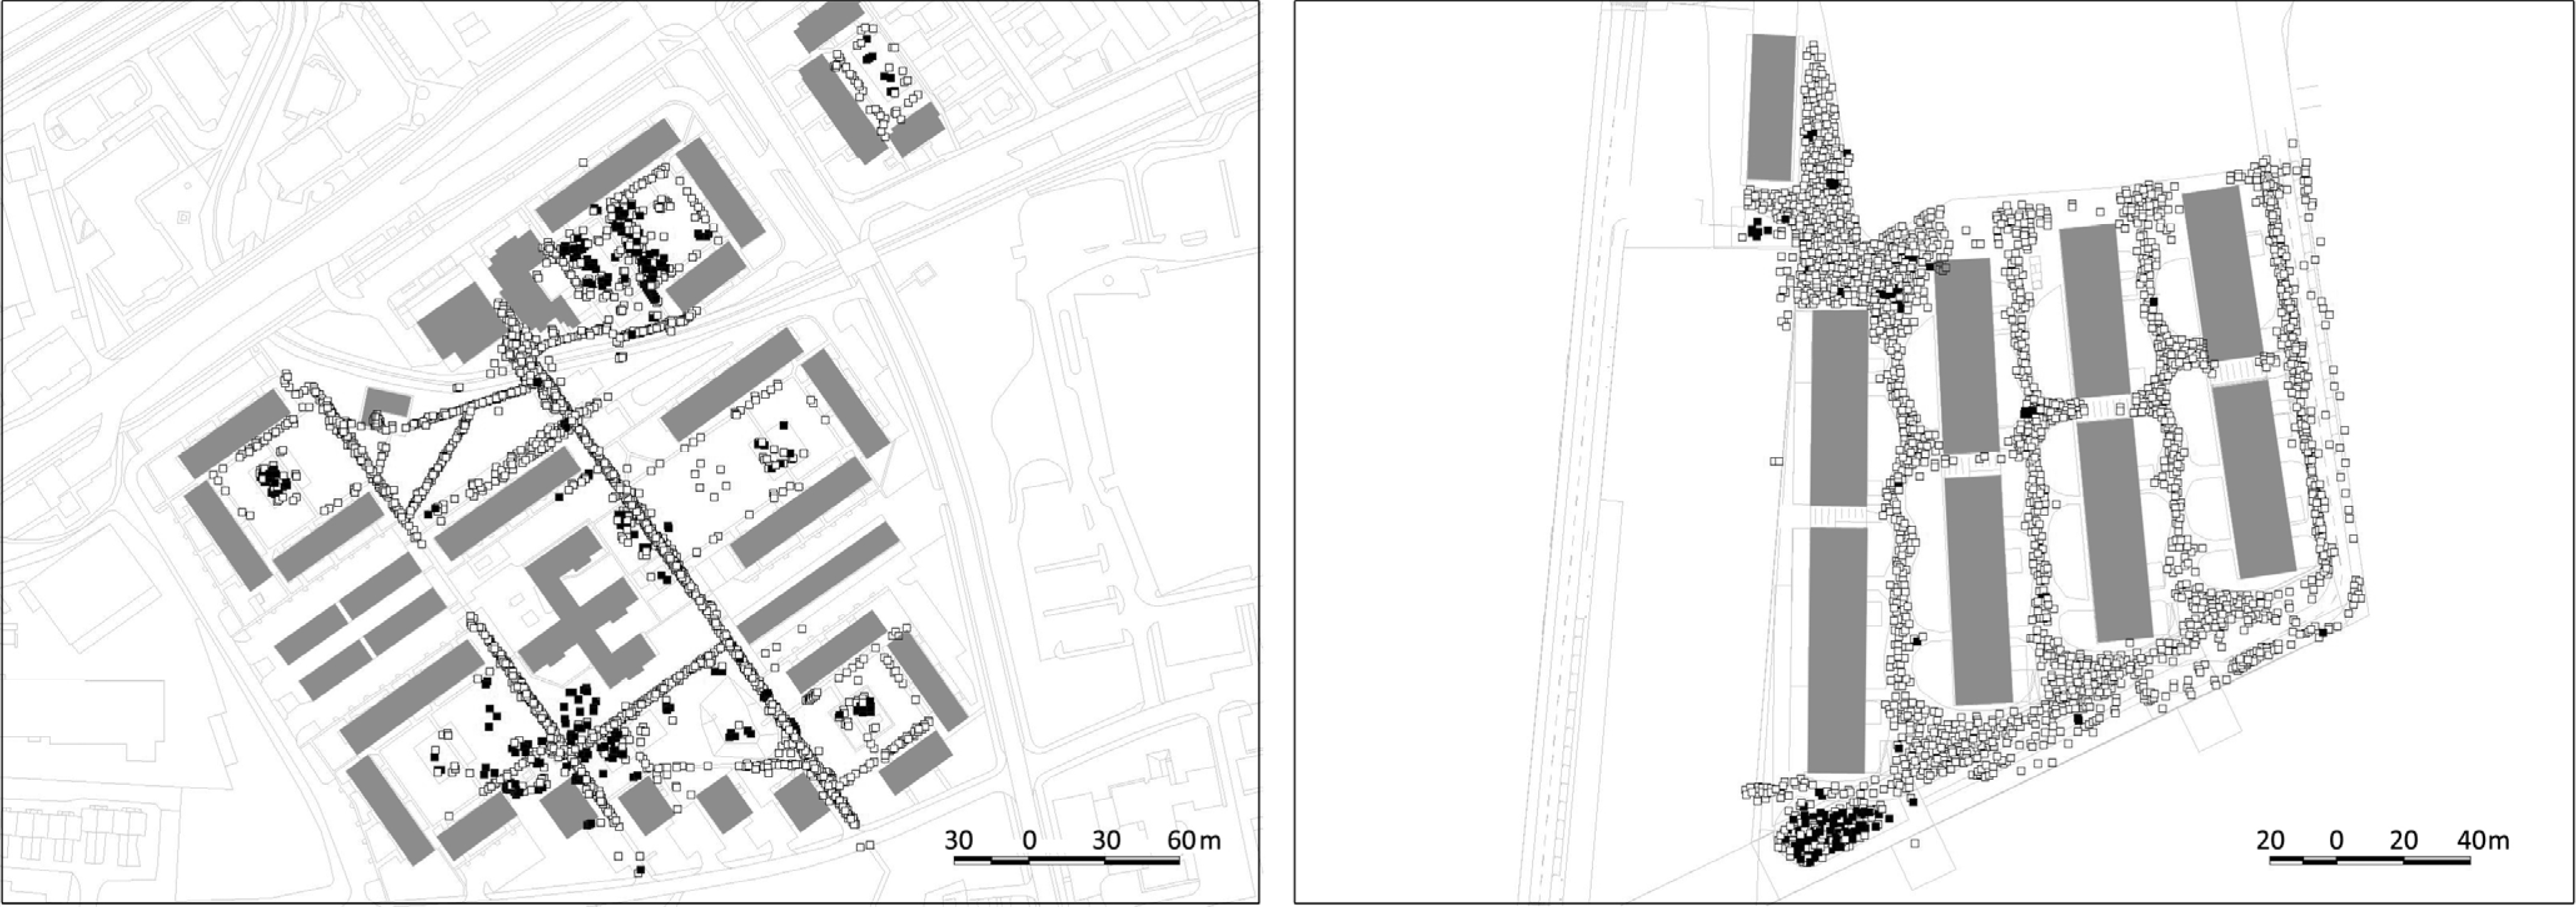
Figure 3.
Left: Results of observations and behavioural mapping in Bonifacija showing the category “active in space”, filtered to show age groups 1 and 2 (up to 12 years) (black spots) in relation to other activities observed in the same time (white spots). Right: Results of observations and behavioural mapping in Mesarska showing the category of activity “active in space”, filtered to show age groups 1 and 2 (up to 12 years) in relation to other activities observed in the same time.
The graphic presentation of the results does not entirely disclose all the variety of children play in Bonifacija. The active children are equally distributed across the open area; with a large share of children’s play activities observed outside of playgrounds, especially in the areas with diverse landscape features such as the edges between open spaces and vegetation and in combination with undulating terrain. As also stated in Kučan
et al. [
35], imaginative child’s play is always stronger in places, which do not strongly define the uses. On the other end of the spectrum, the residential landscapes of Mesarska are (similar to other new areas) predominantly used for transit, while children are confined to one specific area, the children’s playground, which is used beyond its capacities and will increasingly continue to be overused when new residents occupy the empty flats. The comparison between Bonifacija and Mesarska confirms the hypothesis that poor programme equipment and the lack of open areas leads to a reduced variety of spatial uses.
3.3. Questionnaire
The interpretation of the results obtained by the third part of research addresses the question of: “whether and how the design of open spaces affects the residents’ behavioral patterns?”. While open space design cannot directly affect the health related behavioral patterns of eating, smoking, alcohol consumption, drugs intake, etc., they may however affect the time spent outdoors, and the physical activity of children and the elderly, who depend on the proximity of green spaces to their homes. Therefore data interpretation focuses on the questions, addressing the amount of free time spent for recreation, type of outdoor activities and the perception of residential area, health status and general well-being. Due to the fact that open space is not the only behavioral pattern indicator which supports or harms public health, it was also necessary to reflect on correlations with other research variables, which might be significant for this matter.
On average, the strongest correlations proved to be the ones between the satisfaction with the apartment and the satisfaction with the residential area; between the apartment/residential area satisfaction and the self-assessed health of residents and their children; between the economic status/the level of completed education and the self-assessed health; between the economic status and time spent in very intensive sport exercise; and between self-assessed health and very intensive sport exercise (
Table 4).
The physical activity of the inhabitants was assessed by the question “Recreational sport exercise in free time”, which includes intensity (very intensive sport exercise, moderate exercise and walking) and duration (expressed in minutes per day), and the frequency (number of days per week).
This question is not directly related to the quality of residential area open space, as people normally take part in these activities elsewhere, outside of the residential area (fitness classes, dancing, fast cycling, running,
etc.). The layout of Bonifacija (
Figure 1) does show more opportunities for recreation on site compared to other areas, however results show the lowest number of days per week spent engaged in recreational physical activity, compared to other residential areas. This is not surprising taking into account different age structure of Bonifacija population (all age groups, including many elderly residents) compared to the newer residential areas (mostly young families) [
33]. The structure of the population (age, education, income) is a more important determinant of physical activity than neighborhood characteristics [
12]. In the case of Bonifacija, a correlation can be only found between variables representing very intensive physical activity and age (
p = 0.01), with the amount of activity reducing with increasing age. The highest amount of days per week spent in very intensive and moderate physical activity is, on average, claimed by the residents of Viška Sončava and Mesarska. Both cases show a statistically significant correlation between physical activity and the highest completed level of education (Viška Sončava: very intensive sport exercise
p = 0.00, moderate exercise
p = 0.04, walking
p = 0.03; and Mesarska: very intensive sport exercise
p = 0.01, moderate exercise
p = 0.00, and walking
p = 0.04) (
Table 5). There was no significant correlation found between physical activity and education or income level within the respondents from Celovški Dvori and Nova Grbina, however this correlation was confirmed in the whole sample (
Table 4).
Table 4.
Correlations between certain key variables for the entire sample.
Table 4.
Correlations between certain key variables for the entire sample.
| | Satisfaction with the Apartment | Satisfaction with the Residential Area | Economic Status | Very Intensive Sport Exercise | Level of Completed Education | Self-Assessed Health of Residents | Self-Assessed Health of Residents Children |
|---|
| Satisfaction with the Apartment | Pearson Correlation | 1.00 | 0.61 (**) | -0.01 | 0.02 | 0.02 | 0.18 (**) | 0.21 (**) |
| Sig. (2-tailed) | | 0.00 | 0.75 | 0.58 | 0.55 | 0.00 | 0.00 |
| N | 542.00 | 542.00 | 527.00 | 542.00 | 541.00 | 536.00 | 228.00 |
| Satisfaction with the Residential Area | Pearson Correlation | 0.61 (**) | 1.00 | 0.05 | 0.01 | 0.08 | 0.22 (**) | 0.23 (**) |
| Sig. (2-tailed) | 0.00 | | 0.27 | 0.82 | 0.06 | 0.00 | 0.00 |
| N | 542.00 | 543.00 | 528.00 | 543.00 | 542.00 | 537.00 | 229.00 |
| Economic Status | Pearson Correlation | -0.01 | 0.05 | 1.00 | 0.16 (**) | 0.52 (**) | 0.25 (**) | 0.01 |
| Sig. (2-tailed) | 0.75 | 0.27 | | 0.00 | 0.00 | 0.00 | 0.90 |
| N | 527.00 | 528.00 | 535.00 | 535.00 | 534.00 | 529.00 | 230.00 |
| Very Intensive Sport Exercise | Pearson Correlation | 0.02 | 0.01 | 0.16 (**) | 1.00 | 0.21 (**) | 0.27 (**) | 0.03 |
| Sig. (2-tailed) | 0.58 | 0.82 | 0.00 | | 0.00 | 0.00 | 0.68 |
| N | 542.00 | 543.00 | 535.00 | 550.00 | 549.00 | 544.00 | 236.00 |
| Level of Completed Education | Pearson Correlation | 0.02 | 0.08 | 0.52 (**) | 0.21 (**) | 1.00 | 0.33 (**) | 0.06 |
| Sig. (2-tailed) | 0.55 | 0.06 | 0.00 | 0.00 | | 0.00 | 0.36 |
| N | 541.00 | 542.00 | 534.00 | 549.00 | 549.00 | 543.00 | 236.00 |
| Self-Assessed Health of Residents | Pearson Correlation | 0.18 (**) | 0.22 (**) | 0.25 (**) | 0.27 (**) | 0.33 (**) | 1.00 | 0.24 (**) |
| Sig. (2-tailed) | 0.00 | 0.00 | 0.00 | 0.00 | 0.00 | | 0.00 |
| N | 536.00 | 537.00 | 529.00 | 544.00 | 543.00 | 544.00 | 234.00 |
| Self-Assessed Health of Residents Children | Pearson Correlation | 0.20 (**) | 0.23 (**) | 0.01 | 0.03 | 0.06 | 0.24 (**) | 1.000 |
| Sig. (2-tailed) | 0.00 | 0.00 | 0.90 | 0.68 | 0.36 | 0.00 | |
| N | 228.00 | 229.00 | 230.00 | 236.00 | 236.00 | 234.00 | 236.00 |
According to the guidelines of the WHO [
36], the minimum amount of physical activity required for a healthy lifestyle, is 75 min of intensive sport activity per week. The inhabitants of Mesarska come close to meeting these conditions, with almost 60 minutes of this kind of activity on average per week. In Viška sončava interviewees spend only 45 minutes engaged in such exercise per week. The residents of Celovški dvori, Nova grbina and Bonifacija exercise even less. While only recreational exercise was included in the survey, these guidelines can also be partially met by the physical activity at work, running domestic errands and physical movement involved on the way to work or a study place.
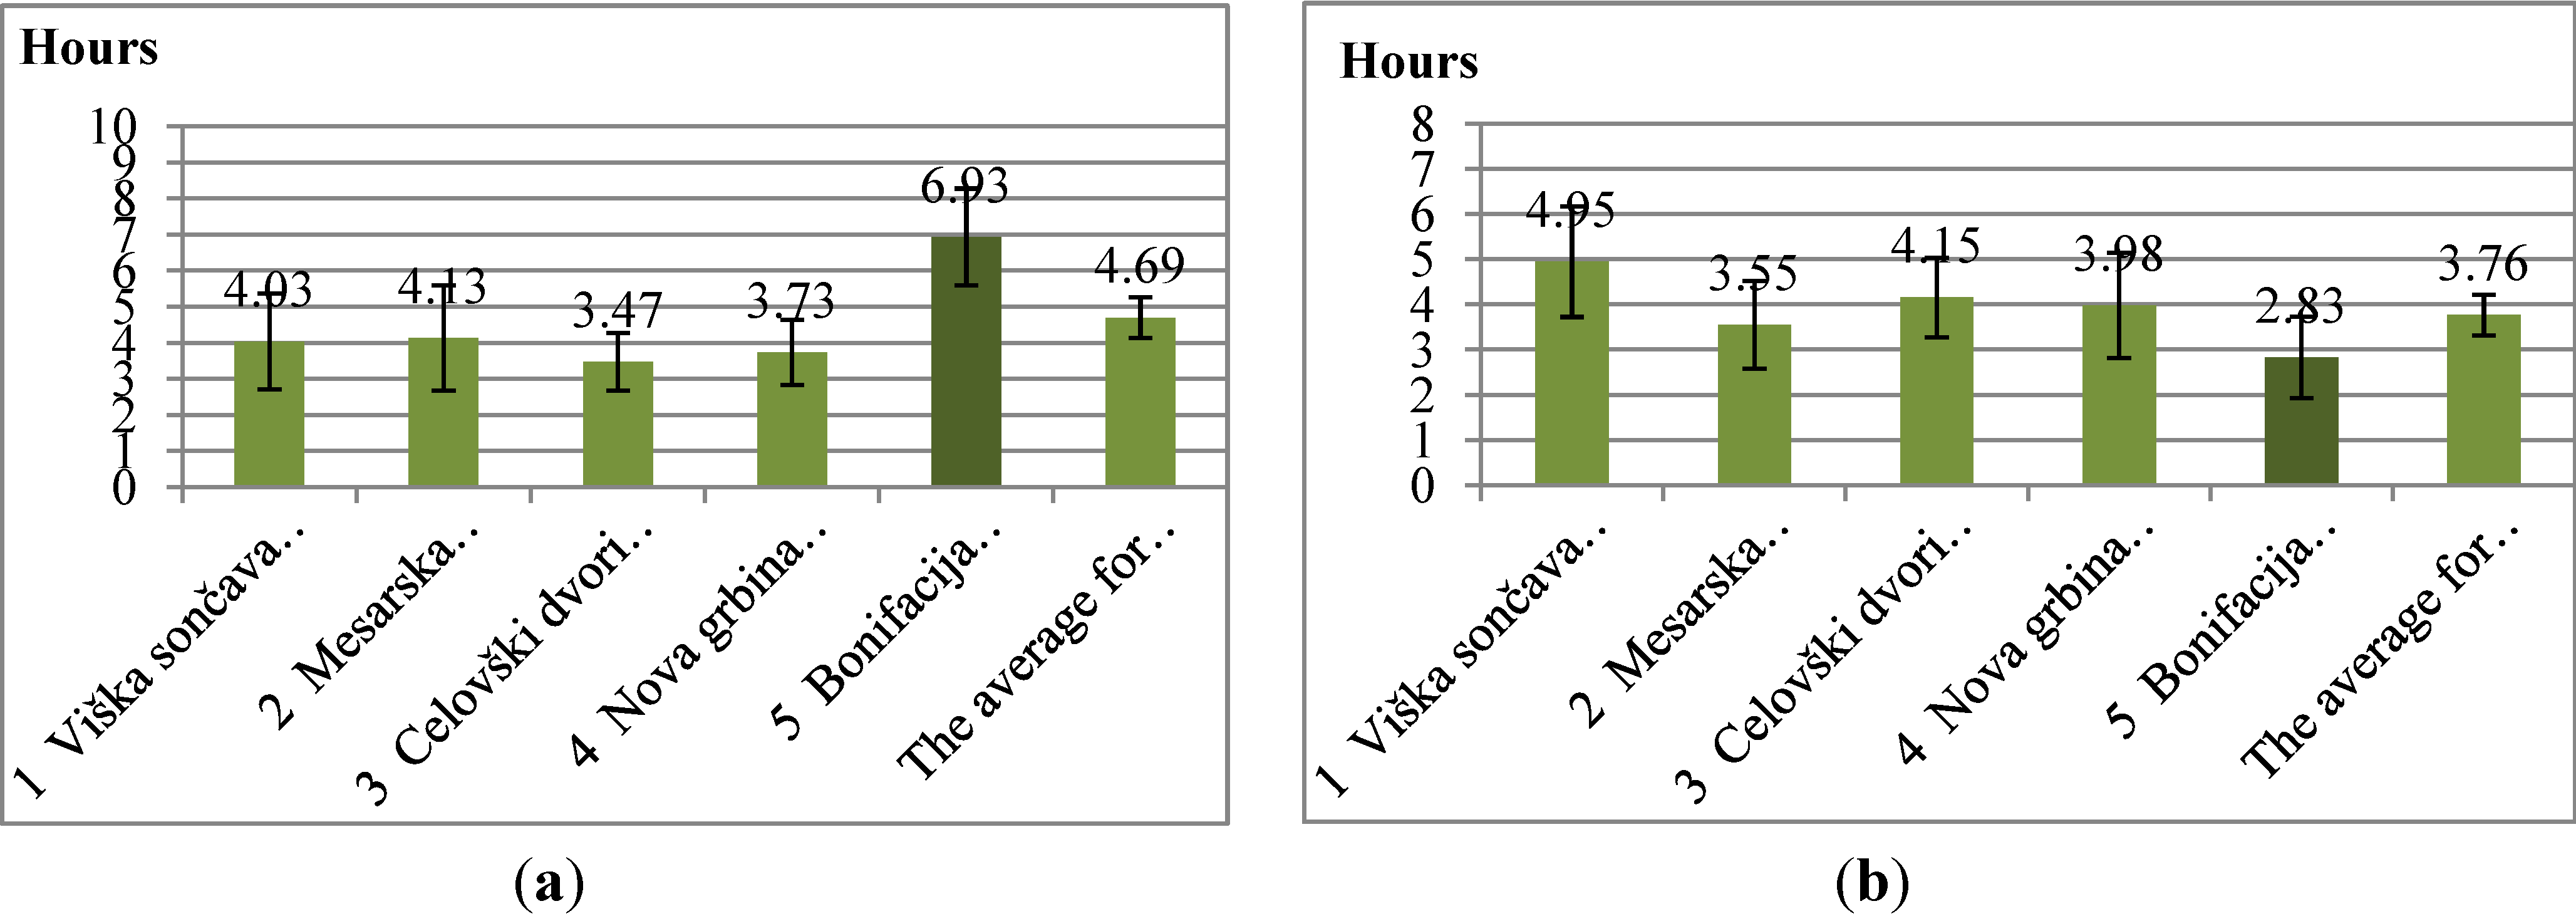
In contrast to the residents of newer developments which claim to spend most time on patios and balconies, the residents of Bonifacija report to spend the most time in the outdoor spaces (
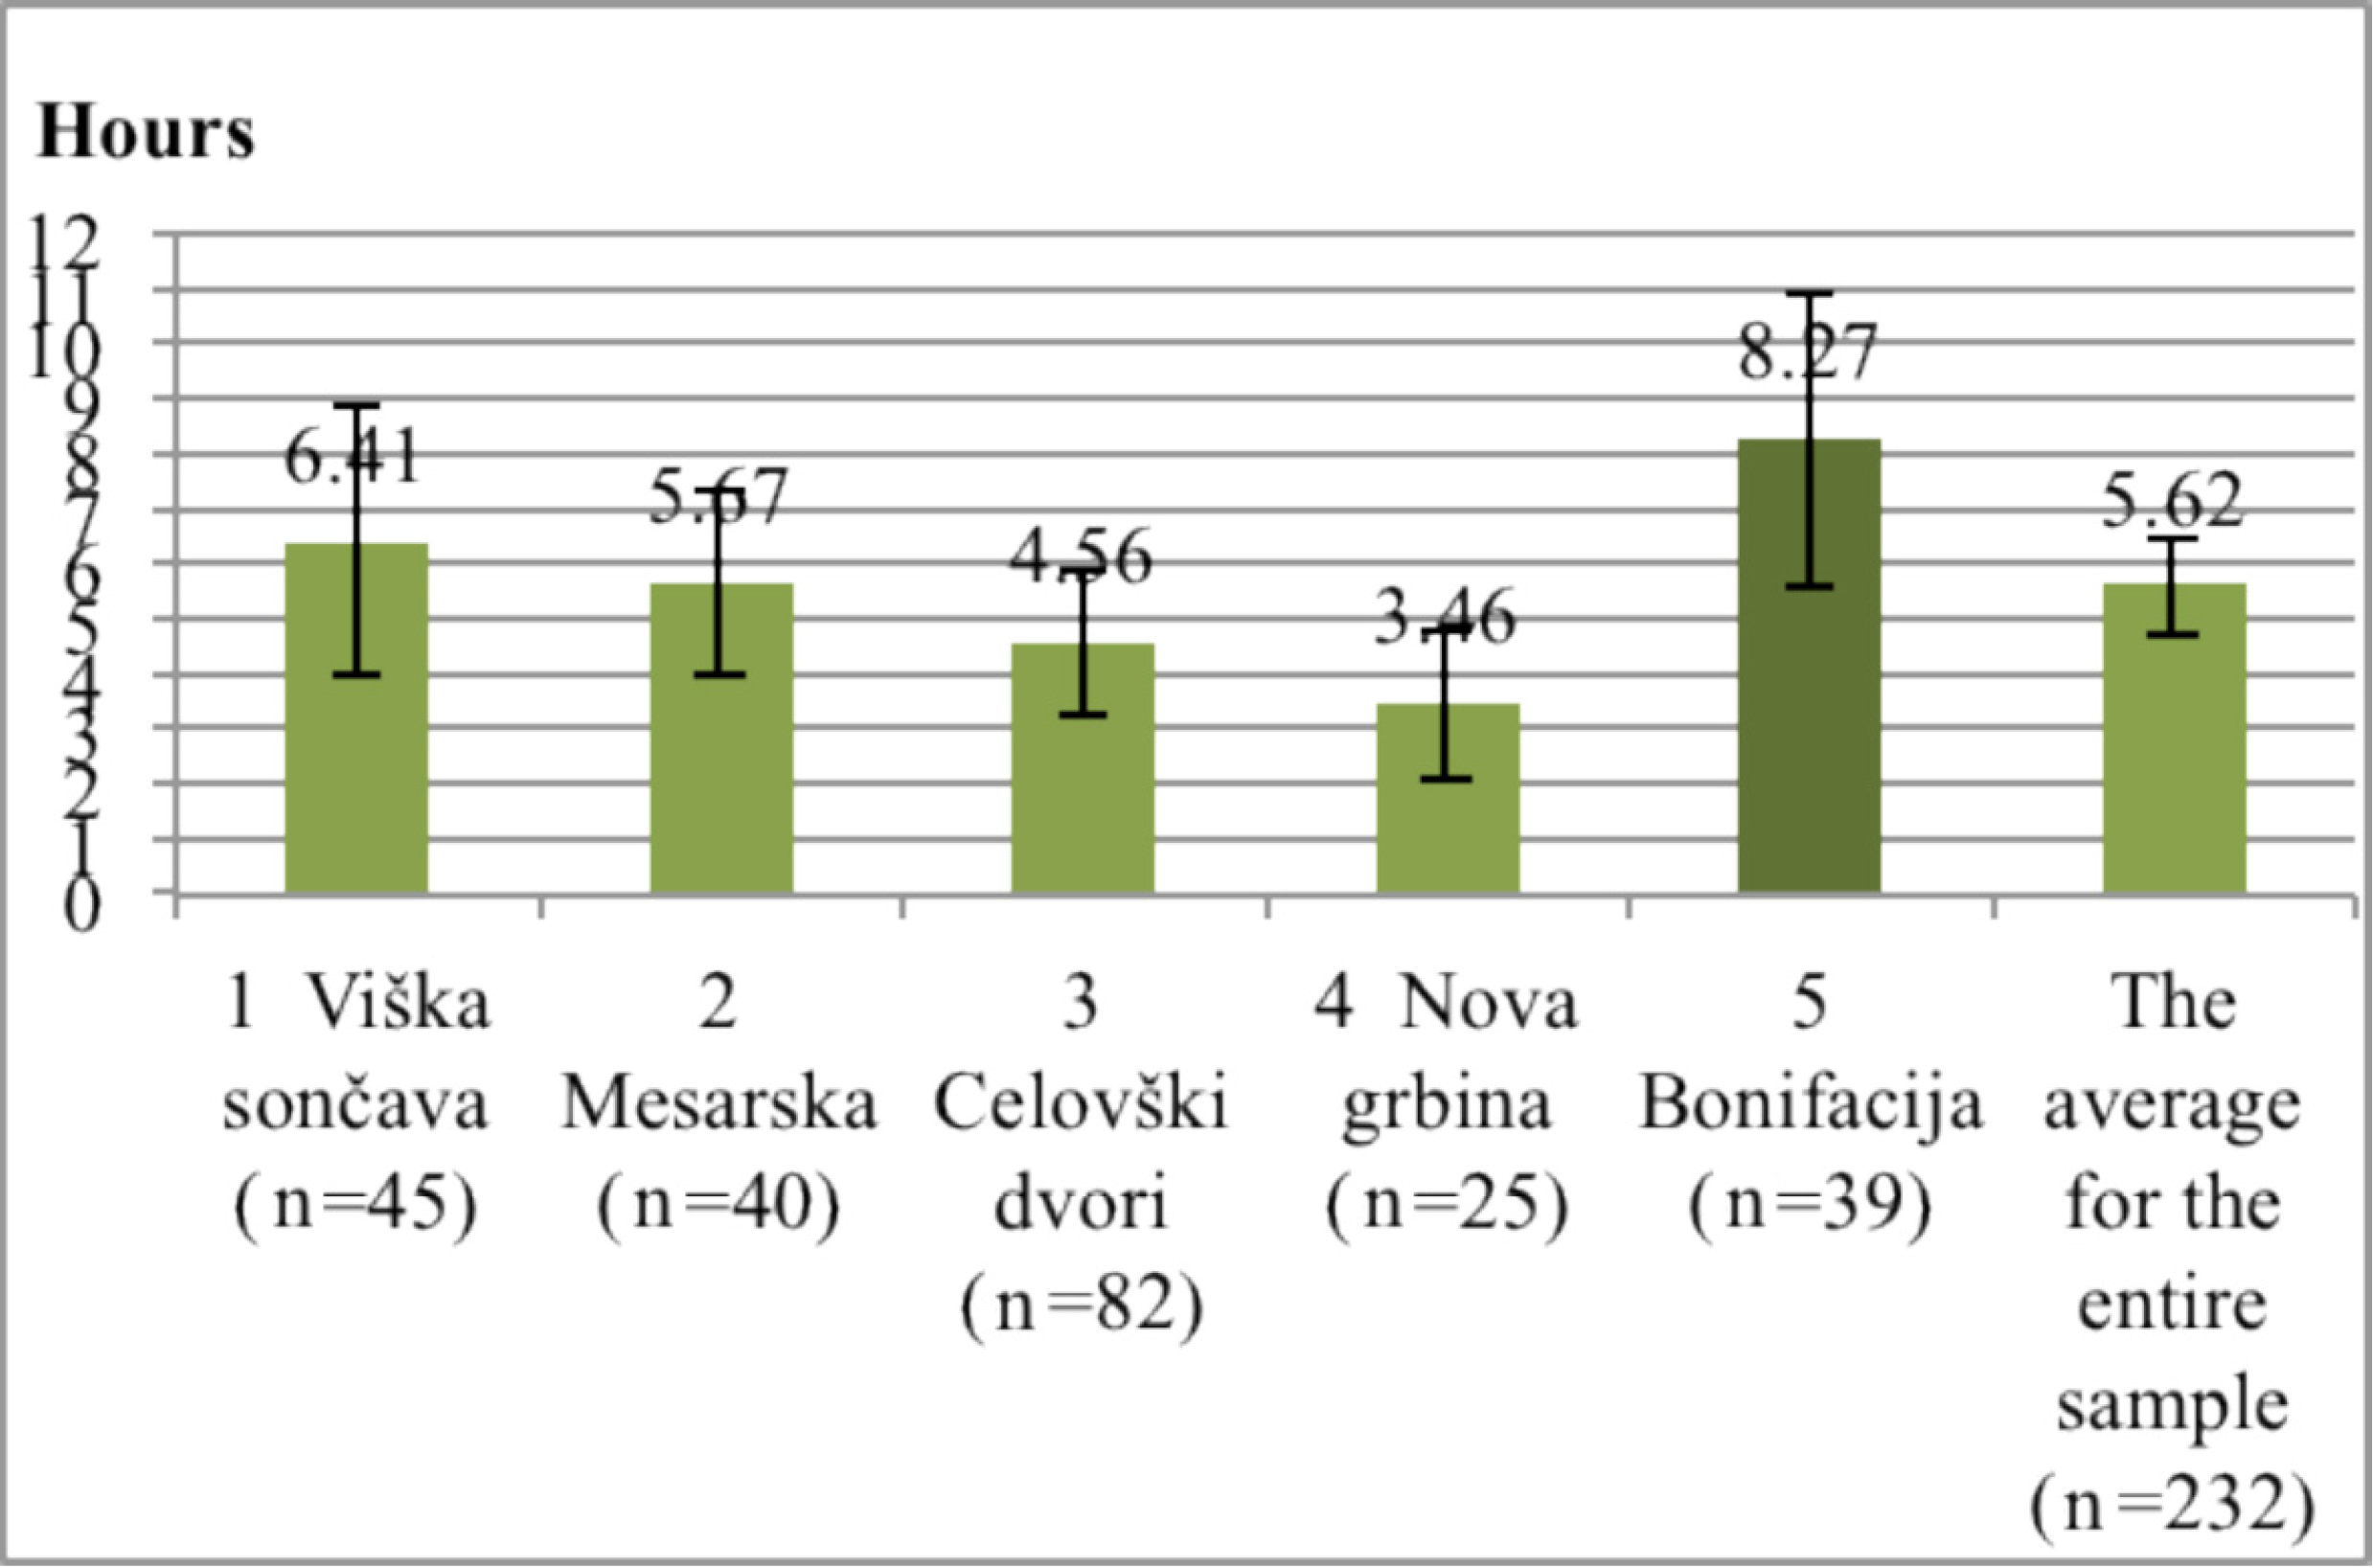
Figure 4). The amount of time that children spend playing outdoors (
Figure 5) is also the highest in Bonifacija (8.27 h per week). These results coincide with the description and evaluation of open space and the observations of behavior. The least amount of such time is reported in Nova Grbina (3.46 h per week). While Nova Grbina boasts with the best open space among new residential areas, it also has inhabitants with the highest education level (64.30% completed the highest level of education). This can explain why the children spend the least hours playing outside. Children of highly educated parents tend to take part in more after-school activities, leaving them with less time available for play [
37].
Table 5.
Recreational sport exercise in free time for very intensive sport exercise (1), moderate exercise (2) and walking (3), showing average amount of days per week (0–7 days).
Table 5.
Recreational sport exercise in free time for very intensive sport exercise (1), moderate exercise (2) and walking (3), showing average amount of days per week (0–7 days).
| Sample | Viška Sončava | Mesarska | Celovški Dvori | Nova Grbina | Bonifacja |
|---|
| intensity | 1 | 2 | 3 | 1 | 2 | 3 | 1 | 2 | 3 | 1 | 2 | 3 | 1 | 2 | 3 |
|---|
| age | <39 | 1.79 | 2.26 | 3.17 | 2.26 | 2.12 | 3.36 | 1.19 | 2.11 | 3.77 | 2.06 | 1.78 | 3.34 | 1.55 | 1.76 | 2.80 |
| 40–54 | 1.09 | 1.85 | 3.41 | 1.68 | 2.57 | 1.88 | 1.01 | 1.28 | 2.90 | 1.19 | 1.79 | 1.90 | 0.78 | 1.12 | 2.68 |
| <55 | 0.59 | 2.46 | 3.55 | 0.48 | 1.24 | 1.30 | 0.11 | 0.57 | 5.48 | 0.26 | 1.50 | 3.89 | 0.60 | 1.24 | 3.65 |
| Total | 1.44 | 2.20 | 3.29 | 1.89 | 2.05 | 2.80 | 1.05 | 1.73 | 3.64 | 1.25 | 1.71 | 2.94 | 0.97 | 1.41 | 3.20 |
| Sig. | 0.03 | 0.72 | 0.82 | 0.00 | 0.16 | 0.01 | 0.21 | 0.06 | 0.04 | 0.00 | 0.84 | 0.01 | 0.01 | 0.32 | 0.17 |
| level of education | primary education | 0.00 | 1.80 | 3.20 | 3.00 | 4.50 | 3.50 | 0.71 | 1.43 | 4.09 | 0.00 | 0.00 | 0.00 | 0.48 | 1.21 | 4.34 |
| vocational degree | 1.33 | 4.00 | 5.17 | 0.00 | 0.00 | 0.00 | 0.94 | 1.72 | 3.65 | 0.51 | 1.49 | 1.98 | 0.65 | 0.94 | 2.91 |
| secondary level | 1.96 | 2.13 | 2.96 | 2.52 | 1.86 | 3.61 | 1.07 | 1.49 | 3.01 | 1.30 | 1.50 | 2.89 | 0.93 | 1.36 | 2.77 |
| higher education | 1.76 | 1.90 | 2.94 | 1.69 | 2.16 | 2.72 | 1.89 | 2.95 | 3.97 | 1.23 | 1.75 | 2.99 | 1.59 | 1.87 | 2.92 |
| Total | 1.44 | 2.19 | 3.26 | 1.87 | 2.10 | 2.84 | 1.05 | 1.73 | 3.64 | 1.21 | 1.66 | 2.90 | 0.97 | 1.39 | 3.16 |
| Sig. | 0.00 | 0.04 | 0.03 | 0.01 | 0.00 | 0.04 | 0.14 | 0.12 | 0.40 | 0.61 | 0.86 | 0.72 | 0.02 | 0.31 | 0.08 |
| total household monthly income | <550 € | 1.15 | 2.21 | 4.04 | 2.92 | 3.63 | 3.99 | 0.90 | 1.00 | 2.10 | 1.19 | 0.94 | 1.52 | 0.74 | 0.81 | 2.42 |
| 551 €–1.300 € | 1.04 | 2.02 | 3.10 | 1.32 | 1.49 | 2.21 | 0.87 | 1.98 | 4.46 | 0.53 | 1.55 | 2.80 | 0.92 | 1.68 | 4.17 |
| 1.301 €–2.200 € | 1.65 | 2.39 | 3.96 | 2.02 | 2.18 | 2.99 | 1.66 | 1.87 | 2.88 | 1.57 | 2.00 | 3.44 | 1.07 | 1.42 | 2.04 |
| <2.201 € | 2.04 | 1.89 | 2.44 | 1.68 | 2.03 | 2.55 | 2.50 | 3.50 | 3.50 | 1.39 | 1.46 | 2.59 | 1.53 | 1.22 | 2.32 |
| Total | 1.43 | 2.08 | 3.22 | 1.85 | 2.12 | 2.78 | 1.04 | 1.75 | 3.61 | 1.21 | 1.66 | 2.90 | 0.95 | 1.39 | 3.21 |
| Sig. | 0.16 | 0.91 | 0.10 | 0.18 | 0.11 | 0.41 | 0.22 | 0.25 | 0.00 | 0.10 | 0.54 | 0.29 | 0.62 | 0.25 | 0.00 |
Figure 4.
Left: Time in hours per week spent outdoor in residential area. Right: Time in hours in spend in patios and balconies (95% Confidence Interval of the Difference).
Figure 4.
Left: Time in hours per week spent outdoor in residential area. Right: Time in hours in spend in patios and balconies (95% Confidence Interval of the Difference).
Notes:
![Ijerph 11 06547 i001]()
newer residential developments;
![Ijerph 11 06547 i002]()
older residential estate as a comparison with better quality of open areas.
Figure 5.
Time in hours per week that children spend playing outdoors (95% Confidence Interval of the Difference).
Figure 5.
Time in hours per week that children spend playing outdoors (95% Confidence Interval of the Difference).
Notes:
![Ijerph 11 06547 i001]()
newer residential developments;
![Ijerph 11 06547 i002]()
older residential estate as a comparison with better quality of open areas.
The responses of residents with highest completed education show us that the average time of children’s play in outdoor residential area is the lowest in the case of Nova Grbina (
Table 6). The average time spent in outdoor play activities is 5.19 h per week for the entire sample; therefore children living in Nova Grbina play substantially less than the average child from other areas.
Table 6.
Time in hours per week that children spend playing outdoors according to the higher education of parents.
Table 6.
Time in hours per week that children spend playing outdoors according to the higher education of parents.
| Higher Education | Viška Sončava | Mesarska | Celovški Dvori | Nova Grbina | Bonifacija | Total |
| 6.65 | 5.60 | 3.33 | 3.28 | 6.97 | 5.19 |
| Sig. | 0.02 | 0.87 | 0.22 | 0.80 | 0.87 | 0.07 |
Correlation between the highest completed education level of parents and the time their children spend playing outdoors in an individual residential area is in fact only statistically significant in the case of Viška Sončava (
p = 0.02), while in the case of other residential areas there has been no statistical significance found. This could be a consequence of a small statistical sample. A weak point of this study is small sample size. Confidence intervals have a larger scope on
Figure 5, because only people with children had answered that question. Error is less likely at
Figure 4, where the entire sample of respondents is represented (see
supplementary file “Confidence intervals”).
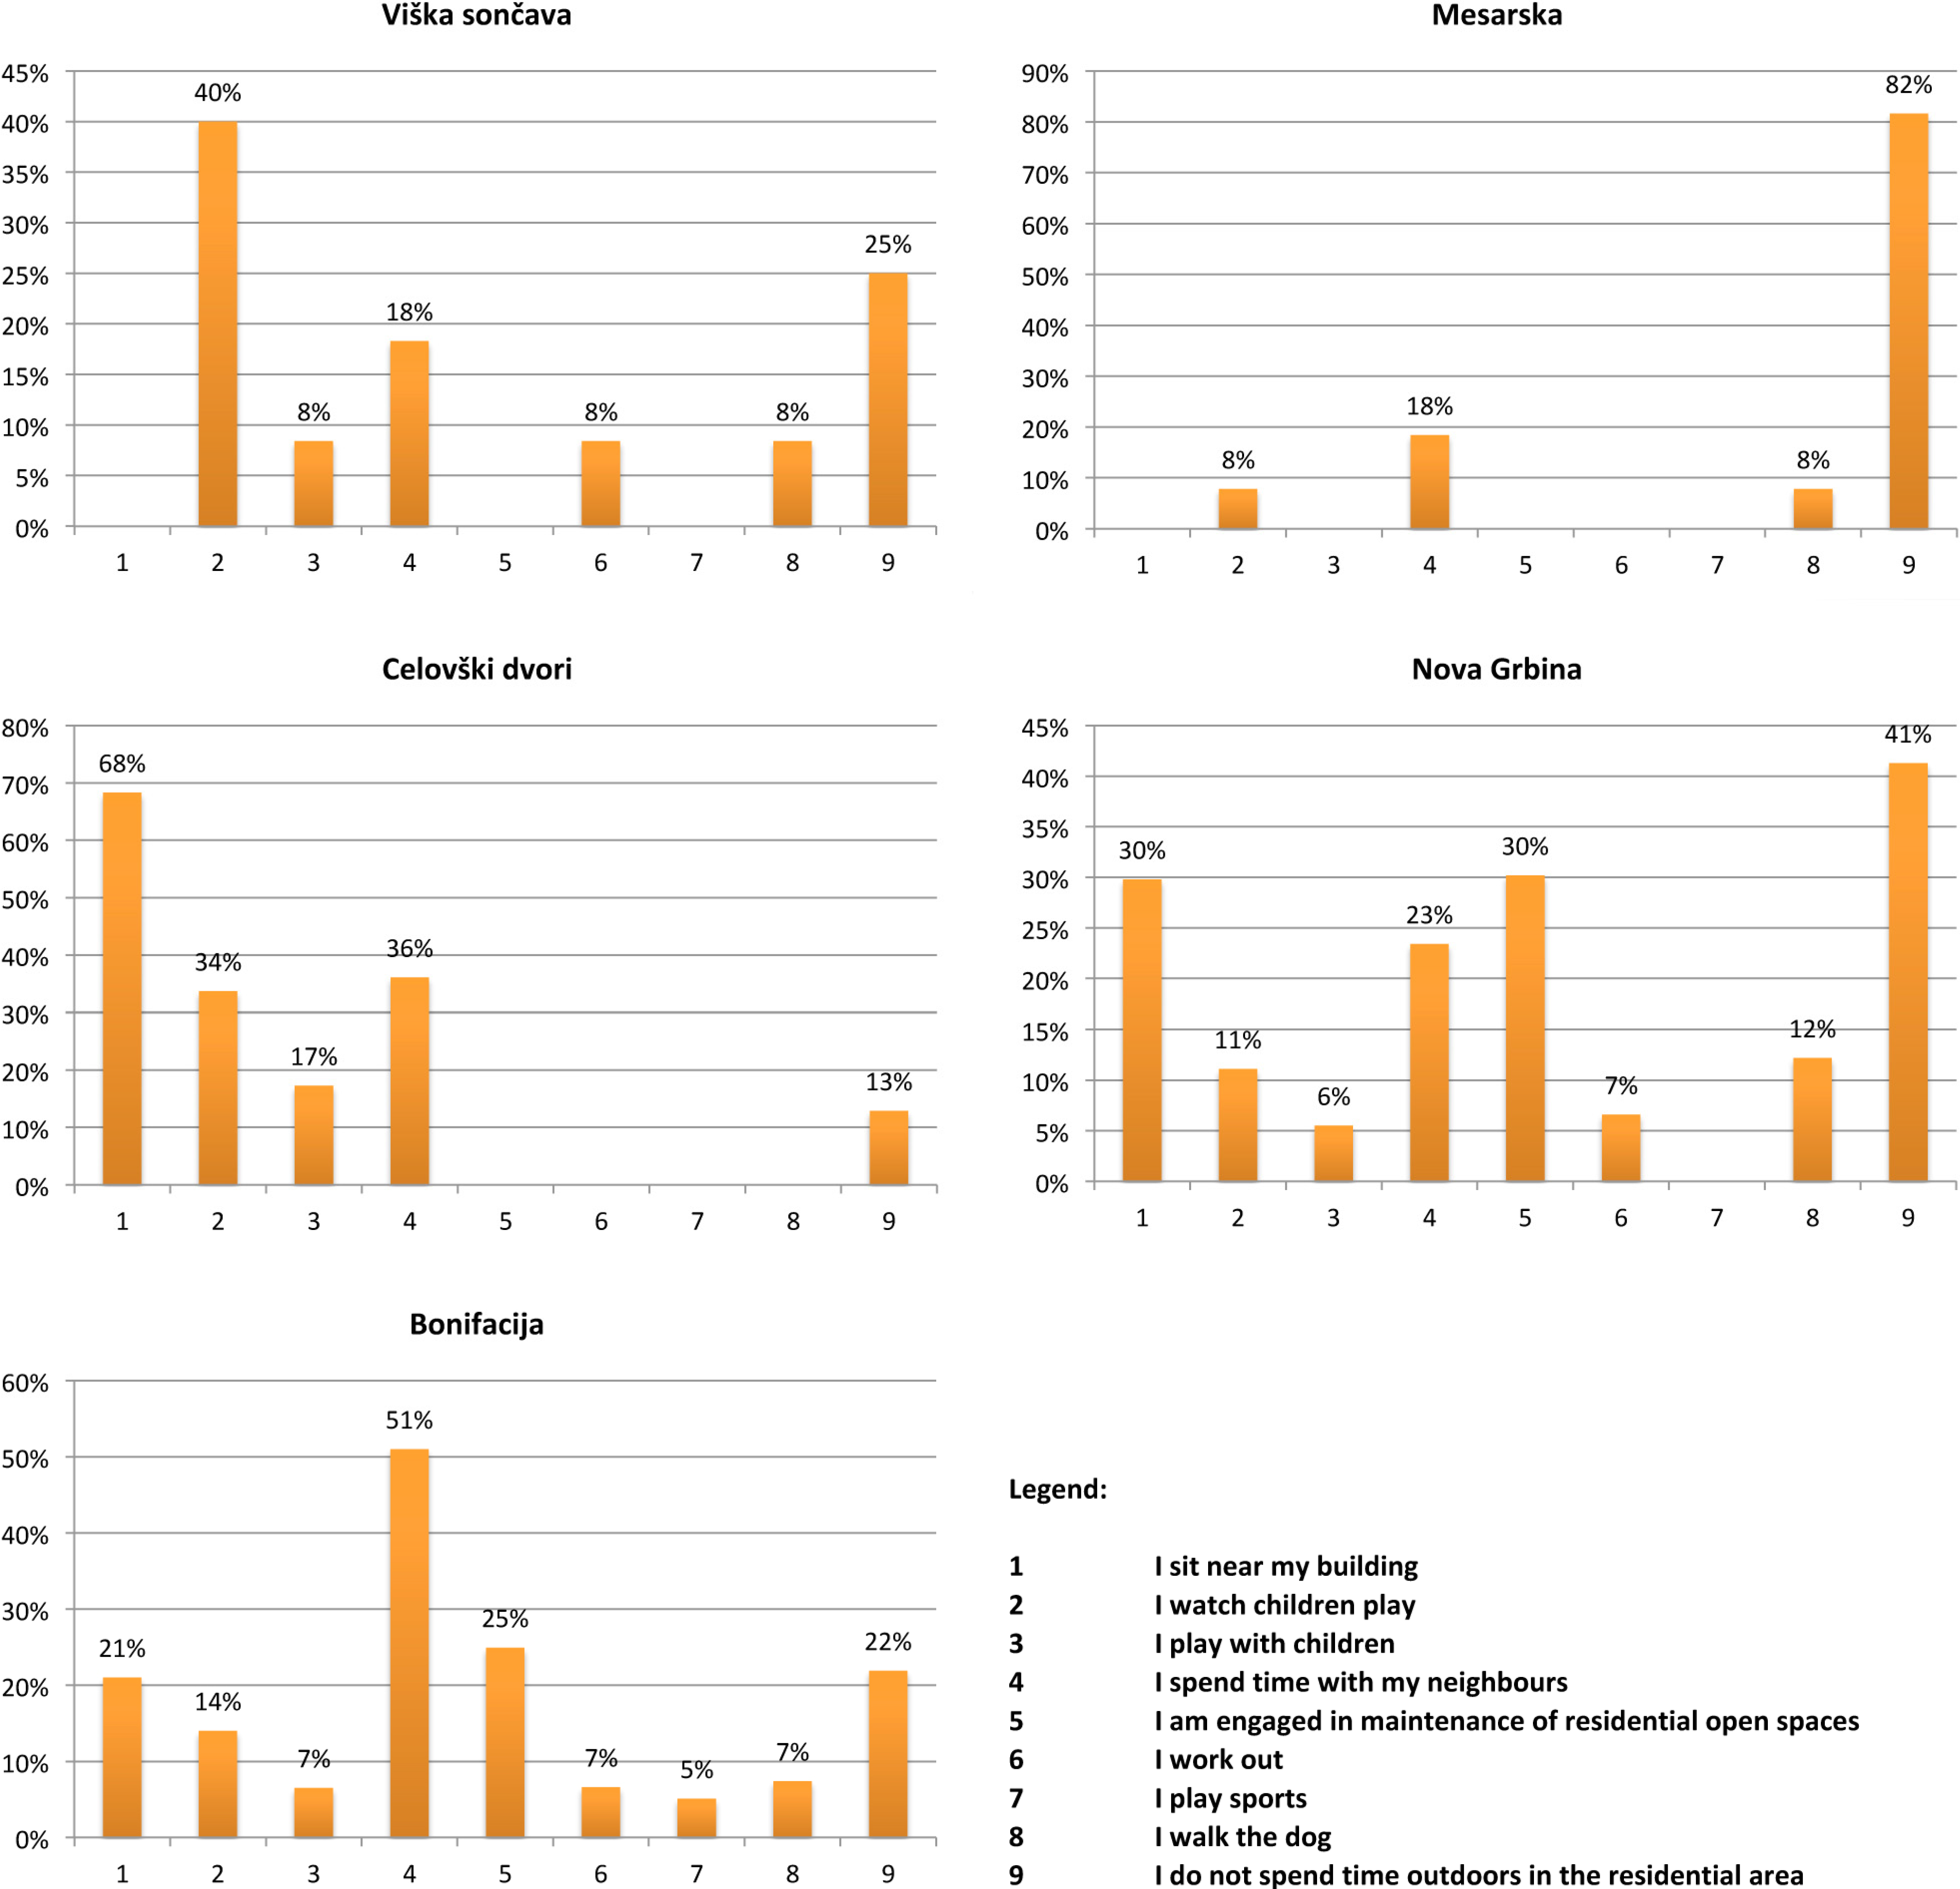
Besides children, the elderly were another focus of the research. A separate analysis was performed for the retired residents asked: ‘What do you normally do when you spend time outdoors within your home area?’ The majority (51.00%) of 57 retired residents of Bonifacija socialise with their neighbours; a quarter (25.00%) are engaged in maintenance of residential open spaces or sit near their building (21.00%); 14.00% of respondents accompany children at play; followed by exercise (7.00%), engage in a sports activity (5.00%), play with their children (7.00%) or walk their dog (7.00%). 22.00% of retired residents claim not to spend time outdoors within the residential area. All of the activities offered by the multiple-choice answers have been represented in the replies of Bonifacija residents. However, with the exception of Nova Grbina, the results gathered from the newer residential areas show that many activities from the list are not represented in the answers (
Figure 6).
Figure 6.
Answers to the question: “What do you normally do when you spend time in open spaces of your residential area?” by retired residents.
Figure 6.
Answers to the question: “What do you normally do when you spend time in open spaces of your residential area?” by retired residents.
In general, it can be concluded that retired residents do not spend time outdoors in newer residential areas, and if they do it is for accompanying children. The interpretation of activities that retired residents engage in must take into consideration the fact that they represented a very small proportion of interviewees (12.00% in Viška sončava, 8.40% in Mesarska, 7.20% in Celovški dvori, 22.90% in Nova grbina, and 39.30% in Bonifacija), therefore these samples are not statistically representative of the population.
Another question related to perception of their home residential area referred to the aspects of open spaces they like best/ find disturbing? (
Table 7 and
Table 8) Highlighted are the answers, which were selected most frequently by residents of all five areas. The well-designed green areas were most frequently chosen in Nova Grbina (61.40%) and Bonifacija (71.30%).
Table 7.
What do you like the most about your residential area open space? (multiple choice answers).
Table 7.
What do you like the most about your residential area open space? (multiple choice answers).
| Well Maintained Green Areas | Good Quality Footpaths | Benches or Tables, Where We can Spend Time Together | Many Trees | Well Maintained Children’s Playgrounds | Good Quality Sports Fields | Peace | Sense of Security | Easy Car Parking | Count |
|---|
| Viška Sončava | 17.50% | 20.70% | 6.50% | 6.50% | 35.80% | 9.50% | 28.60% | 36.60% | 80.20% | 87.00 |
| Mesarska | 22.70% | 32.80% | 4.20% | 8.90% | 21.20% | 1.40% | 71.80% | 27.10% | 45.20% | 106.00 |
| Celovški Dvori | 23.60% | 31.80% | 21.10% | 3.60% | 48.30% | 18.30% | 10.00% | 5.20% | 66.00% | 120.00 |
| Nova Grbina | 61.40% | 22.70% | 9.30% | 11.40% | 28.50% | 9.90% | 61.30% | 63.40% | 63.20% | 70.00 |
| Bonifacija | 71.30% | 34.00% | 23.40% | 48.10% | 47.00% | 9.70% | 56.70% | 31.40% | 21.50% | 154.00 |
| Total | 41.10% | 29.60% | 14.50% | 18.90% | 38.00% | 10.00% | 45.30% | 29.70% | 51.10% | 537.00 |
Table 8.
What disturbs you the most about the open spaces in your residential area? (multiple choice answers).
Table 8.
What disturbs you the most about the open spaces in your residential area? (multiple choice answers).
| | Unkept Green Areas | Untidy Footpaths | Not Enough Benches or Tables for Spending Time Together | Not Enough Trees | Poorly Maintained Children’s Playground | Poor Quality Sports Fields | Inadequate Safety | Difficult Car Parking | Nothing | Noise from the Playgrounds | Traffic Noise | Count |
|---|
| Viška sončava | 10.70% | 3.00% | 11.80% | 34.30% | 8.80% | 4.90% | 20.90% | 8.70% | 15.80% | 15.80% | 58.80% | 86.00 |
| Mesarska | 25.00% | 13.10% | 27.10% | 58.60% | 11.90% | 10.70% | 11.00% | 38.60% | 6.10% | 2.60% | 5.40% | 106.00 |
| Celovški dvori | 26.30% | 4.00% | 15.20% | 51.40% | 8.40% | 2.80% | 59.50% | 8.40% | 8.10% | 36.90% | 26.70% | 127.00 |
| Nova grbina | 2.50% | 6.60% | 14.50% | 20.70% | 1.20% | 5.00% | 3.10% | 6.90% | 47.60% | 5.10% | 13.50% | 69.00 |
| Bonifacija | 7.00% | 8.10% | 24.90% | 10.00% | 6.90% | 6.60% | 10.30% | 37.60% | 28.80% | 3.20% | 27.60% | 149.00 |
| Total | 15.20% | 7.10% | 19.60% | 34.70% | 7.80% | 6.00% | 22.90% | 22.30% | 19.70% | 13.30% | 26.20% | 536.00 |
Poorly maintained green areas in Celovski Dvori (26.30%) and Mesarska (25.00%) (in line with the inventory data of the areas) are rated as disturbing, while in Bonifacija only 7.00% of respondents rated unkept green areas as disturbing (
Table 8). Other responses also confirm the inventory findings: the residents of Mesarska express a wish for more benches and tables for socialising (27.10% of respondents find this lack disturbing), presence of many trees is appreciated by the residents of Bonifacija (48.10%), and the residents of newer residential areas complain about not having enough trees in their area (34.30% of respondents in Viška Sončava, 58.60% in Mesarska, 51.40% in Celovški Dvori, and 20.70% of respondents in Nova Grbina). Children’s playgrounds are perceived to be of lowest quality in Mesarska, (12.00% find poorly maintained children’s playgrounds disturbing), another finding corresponding to least square meters of playground areas per resident. Outdoor sports facilities are also assessed as least attractive in the case of Mesarska (10.70%) (there is an improvised football field, showing the need for such areas). Celovski Dvori clearly stand out in terms of security problems (social housing, vandalism, drugs,
etc.), 59.50% residents selected the answer “inadequate safety” as disturbing, the noise from the playgrounds (echo effect in between blocks of flats), and a general lack of peacefulness (noise from the playgrounds and traffic noise together represent 63.60% respondents’ answers). The best area in terms of safety and lack of disturbances is Nova Grbina (47.60% are not disturbed by anything, the answer “peace” was selected by 61.30%, and “a sense of security” was selected by 63.40% of respondents). Ease of parking is valued by residents in newer developments (The ease of car parking is valued by the residents of Viška Sončava 80.20%, Mesarska 45.20%, Celovški Dvori 66.00%, and Nova Grbina 63.20%), while in the older area of Bonifacija, finding parking spots was assessed as problematic (the highest percentage of answers regarding the difficulty of car parking, 37.60%).
Self-evaluation of health is an established tool for assessing the general state of health indicating low capability, functional competence, frequency of illness, and mortality of population. Many factors influence the health self-evaluation, including age and the socio-economic status. [
12]. The actions for improving the self-evaluation of health and thus to reduce social inequality are needed [
38,
39].
The respondents assessed their health status on Likert scale: “Very poor”, “Poor”, “Average”, “Good”, and “Very good”. The overall sample shows the expected statistically significant correlation between the health self-evaluation and age (
p < 0.05). Apart from age, level of education is a significant variable in the case of health self-evaluation (
p < 0.05). The whole statistical sample also showed a correlation with economic status (
p < 0.05) (
Table 9). Health self-evaluation in the case of the whole sample also indicated a correlation with physical activity: a higher self-evaluation of health was shown by respondents who spend more time engaged in very intensive physical activity (
p < 0.05) (
Table 4).
Health self-evaluation and the residential area are not directly correlated. Most residents assessed their health as “Very good” in Viška Sončava (32.20%) and Mesarska (32.00%) residential areas, which are the worst in terms of provisions for outdoor activities. In Bonifacija as the best example, (
Figure 1), only 14.20% of the residents self-assessed their health to be “Very good”, which is the lowest percentage compared to other residential areas. Results from Viška Sončava and Mesarska show a correlation between health self-evaluation and education (Viška Sončava
p = 0.00; Mesarska
p < 0.05). In both residential areas there is the highest amount of residents with a completed highest level of education, compared to other residential areas as well as within the area (Viška Sončava 47.70% and Mesarska 64.70%). Average health self-evaluation in the group of higher education in Viška sončava is 4.20 (±0.26) and in Mesarska residential area 4.27 (±0.17). There is also a correlation between health self-evaluation and education in the case of Bonifacija (
p = 0.01), however in this case the lower self-assessment can be explained by the age of residents (
p < 0.05). This area accommodates the highest amount of elderly residents (34.80% of residents aged 61 years or more). The lowest self-assessment of health was shown by the residents of Celovški Dvori (“Very poor” 10.80% and “Poor” 8.10%). The latter correlated to the completed education level of its residents (
p = 0.01). Many units in Celovški Dvori are social housing, with highest amount of residents with completed elementary level of education (32.30%) compared to other residential areas. The residents of Nova Grbina showed the highest amount of responses self-evaluating their health as “Good”. While this residential area offers many spatial options for spending time outdoors and pursuing a health-supporting lifestyle, it is more likely that such a high level of self-evaluated health is related to the high economic standard of the residents (
p = 0.01) (
Table 9).
Table 9.
Self-evaluation of health according to variables of age, level of completed education and total household monthly income (* 95% Confidence Interval of the Difference).
Table 9.
Self-evaluation of health according to variables of age, level of completed education and total household monthly income (* 95% Confidence Interval of the Difference).
| | Sample | Viška Sončava | Mesarska | Celovški Dvori | Nova Grbina | Bonifacja | Whole Sample |
|---|
| Age | <39 | 4.18 | 4.22 | 3.60 | 4.06 | 4.13 | 4.01 |
| 40–54 | 3.61 | 4.10 | 3.58 | 4.20 | 3.71 | 3.81 |
| <55 | 2.96 | 3.57 | 2.29 | 3.43 | 3.33 | 3.26 |
| Total | 3.84 | 4.10 | 3.49 | 3.94 | 3.68 | 3.77 |
| Sig. | 0.00 | 0.01 | 0.00 | 0.00 | 0.00 | 0.00 |
| total Household monthly income | <550 € | 4.11 | 4.11 | 3.18 | 3.67 | 3.59 | 3.58 |
| 551 €–1.300 € | 3.40 | 3.68 | 3.55 | 3.68 | 3.59 | 3.56 |
| 1.301 €–2.200 € | 4.27 | 4.15 | 3.61 | 3.96 | 3.72 | 3.95 |
| <2.201€ | 4.19 | 4.26 | 4.00 | 4.31 | 4.16 | 4.24 |
| Total | 3.87 | 4.10 | 3.48 | 3.95 | 3.65 | 3.77 |
| Sig. | 0.01 | 0.07 | 0.45 | 0.01 | 0.23 | 0.00 |
| Level of education | primary education | 3.00 | 4.50 | 3.40 | / | 3.34 | 3.39 |
| vocational degree | 3.67 | 3.00 | 2.94 | 3.51 | 3.53 | 3.29 |
| secondary level | 3.91 | 3.81 | 3.71 | 3.75 | 3.78 | 3.78 |
| higher education | 4.20 | 4.27 | 3.97 | 4.07 | 3.97 | 4.13 |
| Total | 3.86 | 4.10 | 3.49 | 3.95 | 3.69 | 3.78 |
| * Lower/Upper | 3.63/4.09 | 3.94/4.25 | 3.28/3.69 | 3.80/4.09 | 3.54/3.81 | 3.70/3.86 |
| Sig. | 0.00 | 0.00 | 0.01 | 0.05 | 0.01 | 0.00 |
Exploring responses of the age group 55 years and above, the residents of Bonifacija do not report the lowest average health self-evaluation level (3.33) compared to the other four residential areas. Lower health self-evaluation values than the ones in Bonifacija are shown by the residents in Viška Sončava (2.96) and Celovški Dvori (2.29). The highest levels of health self-evaluation by the residents aged 55 and above are reported by residents in Mesarska (3.57) and Nova Grbina (3.43). Within all five individual residential areas there is a statistical correlation between age and health self-evaluation. Interpreting results in the age group of 55 years and higher, it has to be taken into consideration, that the number of respondents was substantially lower in newer residential areas than in Bonifacija. There were only 10 to 18 respondents over 55 years of age in newer areas, while there were 74 respondents belonging to that age group in Bonifacija. Average health self-evaluation of residents above 55 in Bonifacija is above the average of the total statistical sample (3.26) (
Table 9). The level of self-evaluation may partially be this high due to a good spatial design of the Bonifacija area, where there were many elderly people observed spending time outdoors during the second methodological stage.
In terms of Children’s health, no significant difference was observed, generally being assessed as “Good” or “Very good” in all five residential areas.


 newer residential developments;
  older residential estate as a comparison with better quality of open areas.
