Extreme Precipitation and Beach Closures in the Great Lakes Region: Evaluating Risk among the Elderly

Abstract
:1. Introduction
2. Experimental Section
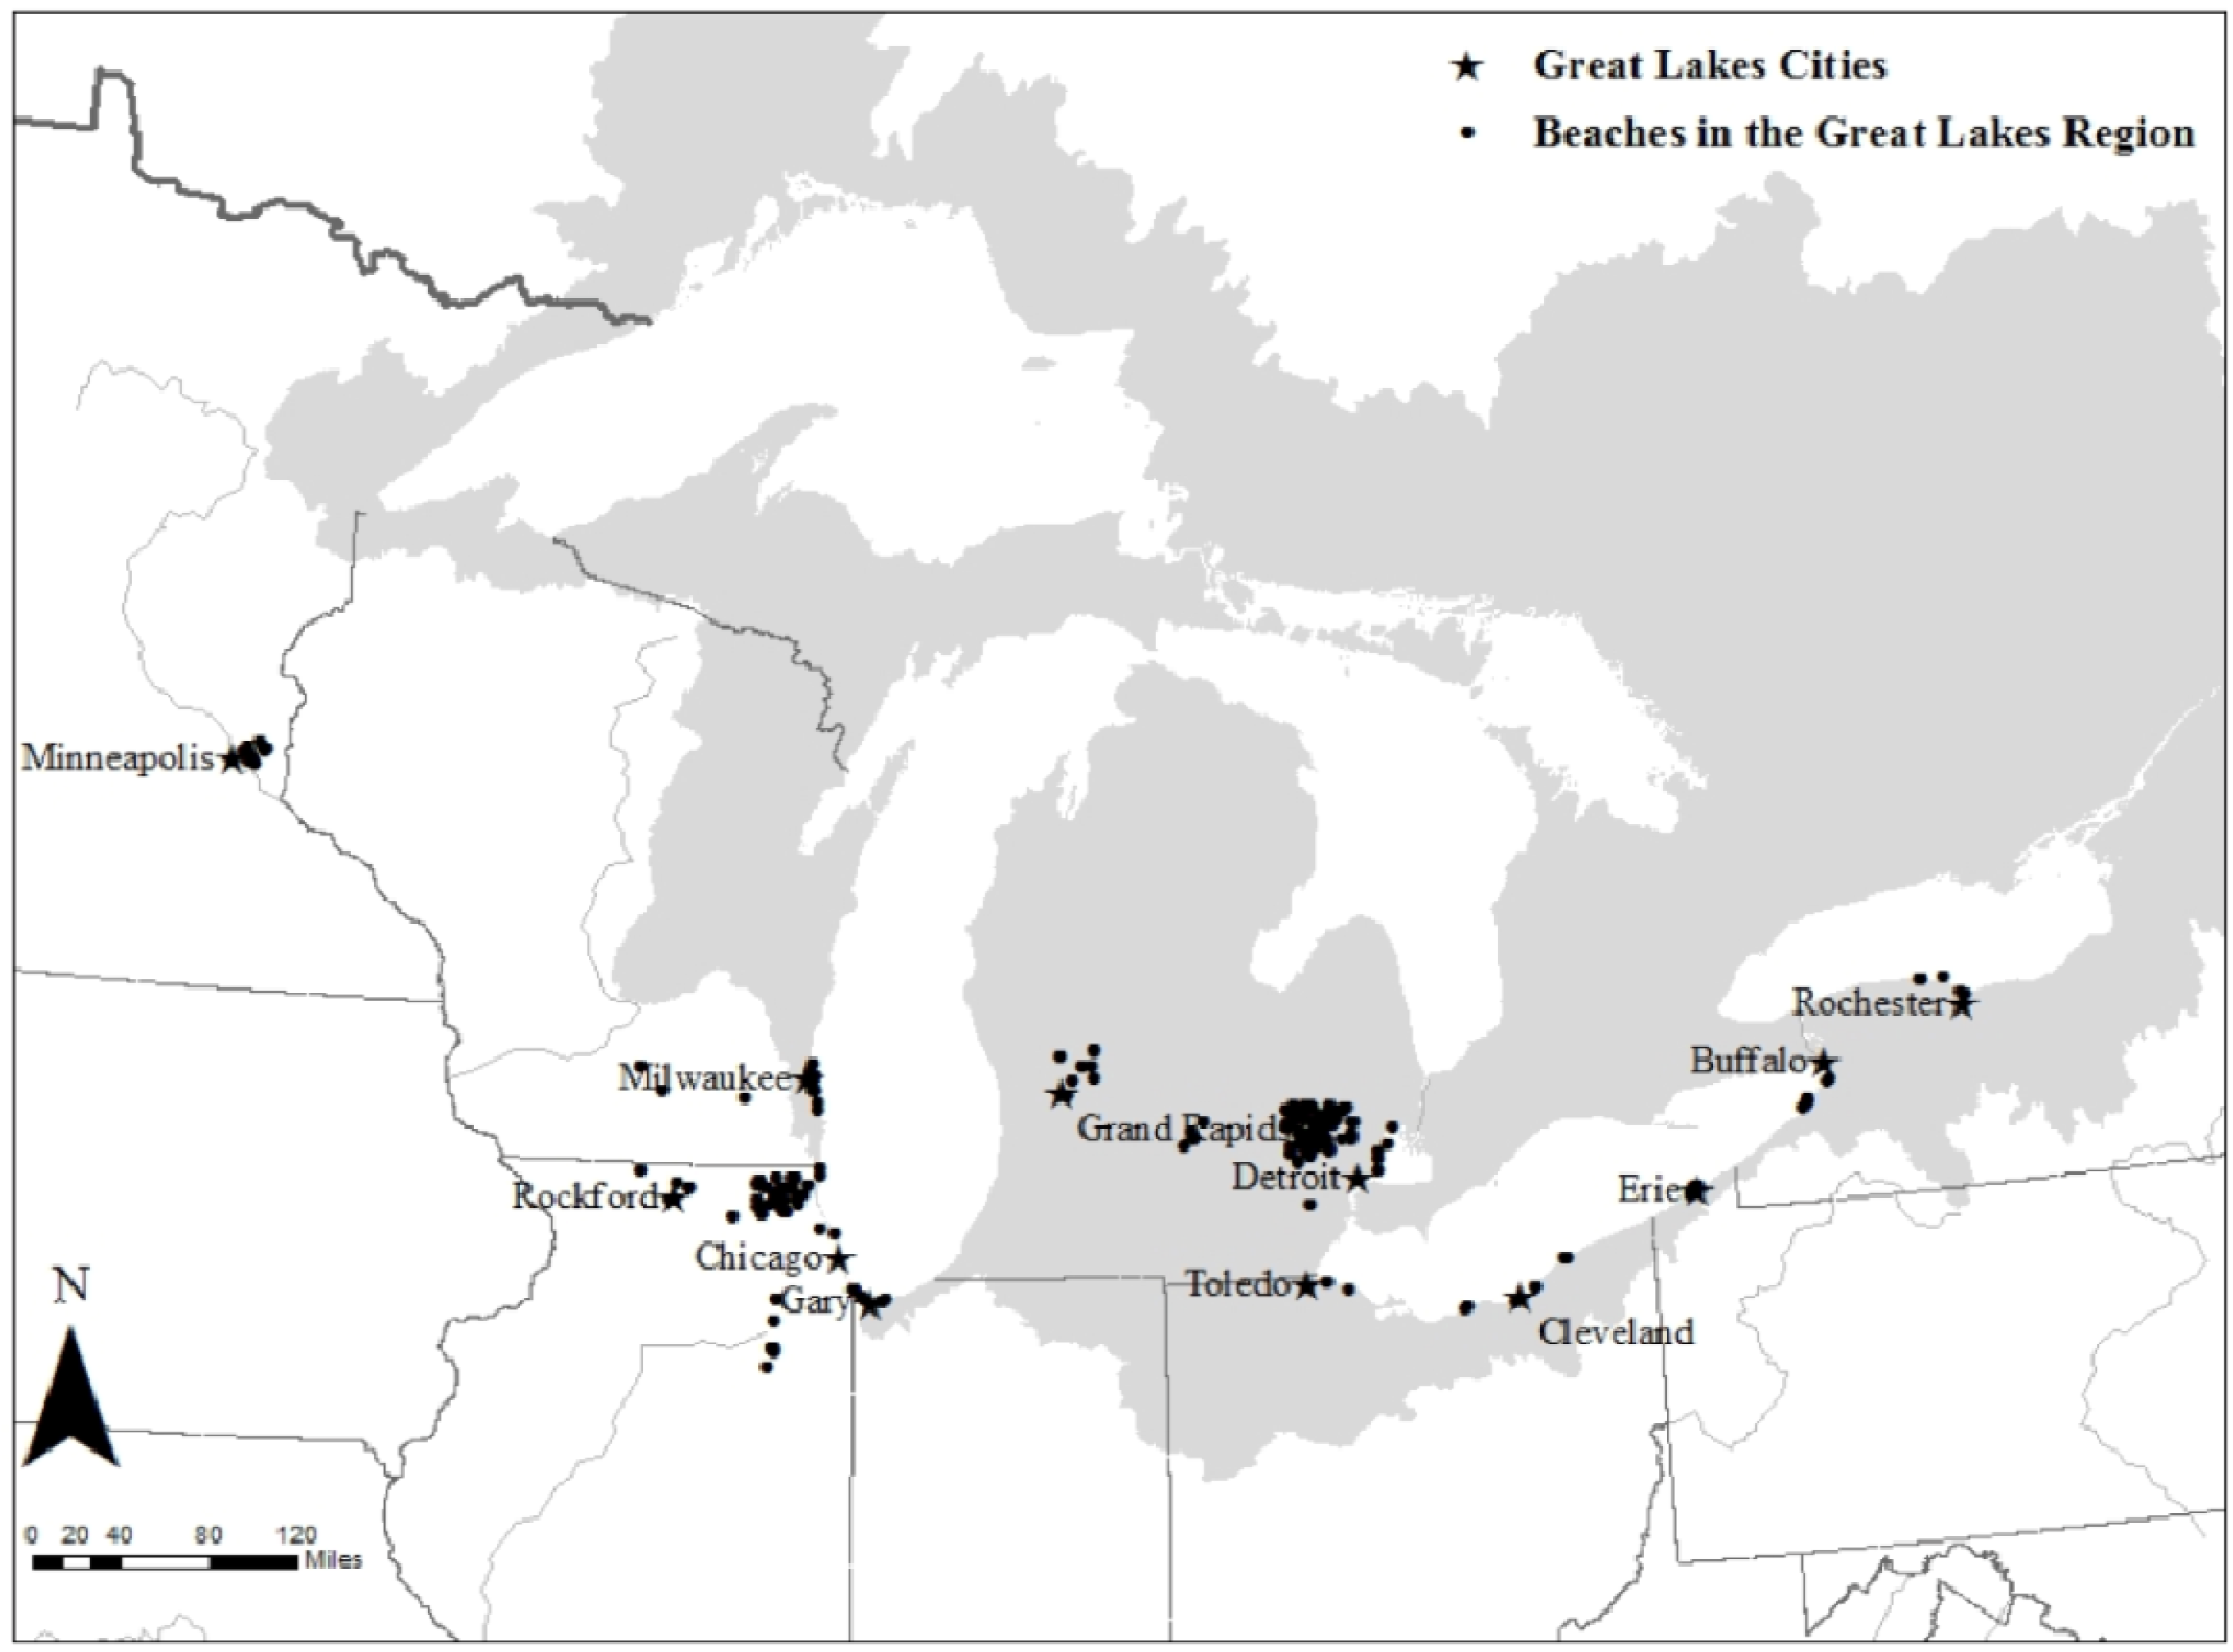
2.1. Study Location

| City | State | County |
|---|---|---|
| Buffalo | NY | Erie |
| Chicago | IL | Cook |
| Lake | ||
| McHenry | ||
| Will | ||
| Cleveland | OH | Cuyahoga |
| Lake | ||
| Lorain | ||
| Detroit | MI | Macomb |
| Oakland | ||
| Wayne | ||
| Erie | PA | Erie |
| Gary | IN | Lake |
| Grand Rapids | MI | Kent |
| Milwaukee | WI | Milwaukee |
| Minneapolis | MN | Ramsey |
| Rochester | NY | Monroe |
| Rockford | IL | Winnebago |
| Toledo | OH | Lucas |

2.2. Data Sources and Variables for Analysis
2.2.1. Hospital Admissions
2.2.2. Beach Closures
2.2.3. Meteorological Conditions
| Data Type | Data Source |
|---|---|
| Hospital Admission Data | Centers for Medicare and Medicaid Services |
| Meteorological Data | National Weather Service Cooperative Observer Program |
| Recreational Water Quality Data (county, state) | |
| Cook; Lake; McHenry; Will; and Winnebago, IL | Illinois Department of Public Health: Environmental Health |
| Lake, IN | Indiana Department of Environmental Management |
| Kent; Macomb; Oakland; and Wayne, MI | Michigan Department of Natural Resources and the Environment |
| Ramsey, MN | Ramsey County Public Works |
| Erie; and Monroe, NY | New York State Health Department |
| Cuyahoga; Lake; Lorain; and Lucas, OH | Ohio Department of Health |
| Erie, PA | Erie County Department of Health |
| Milwaukee; and Waukesha, WI | Wisconsin Department of Natural Resources |
2.3. Statistical Analysis
2.3.1. Exploring Lags
2.3.2. Exploring Confounding
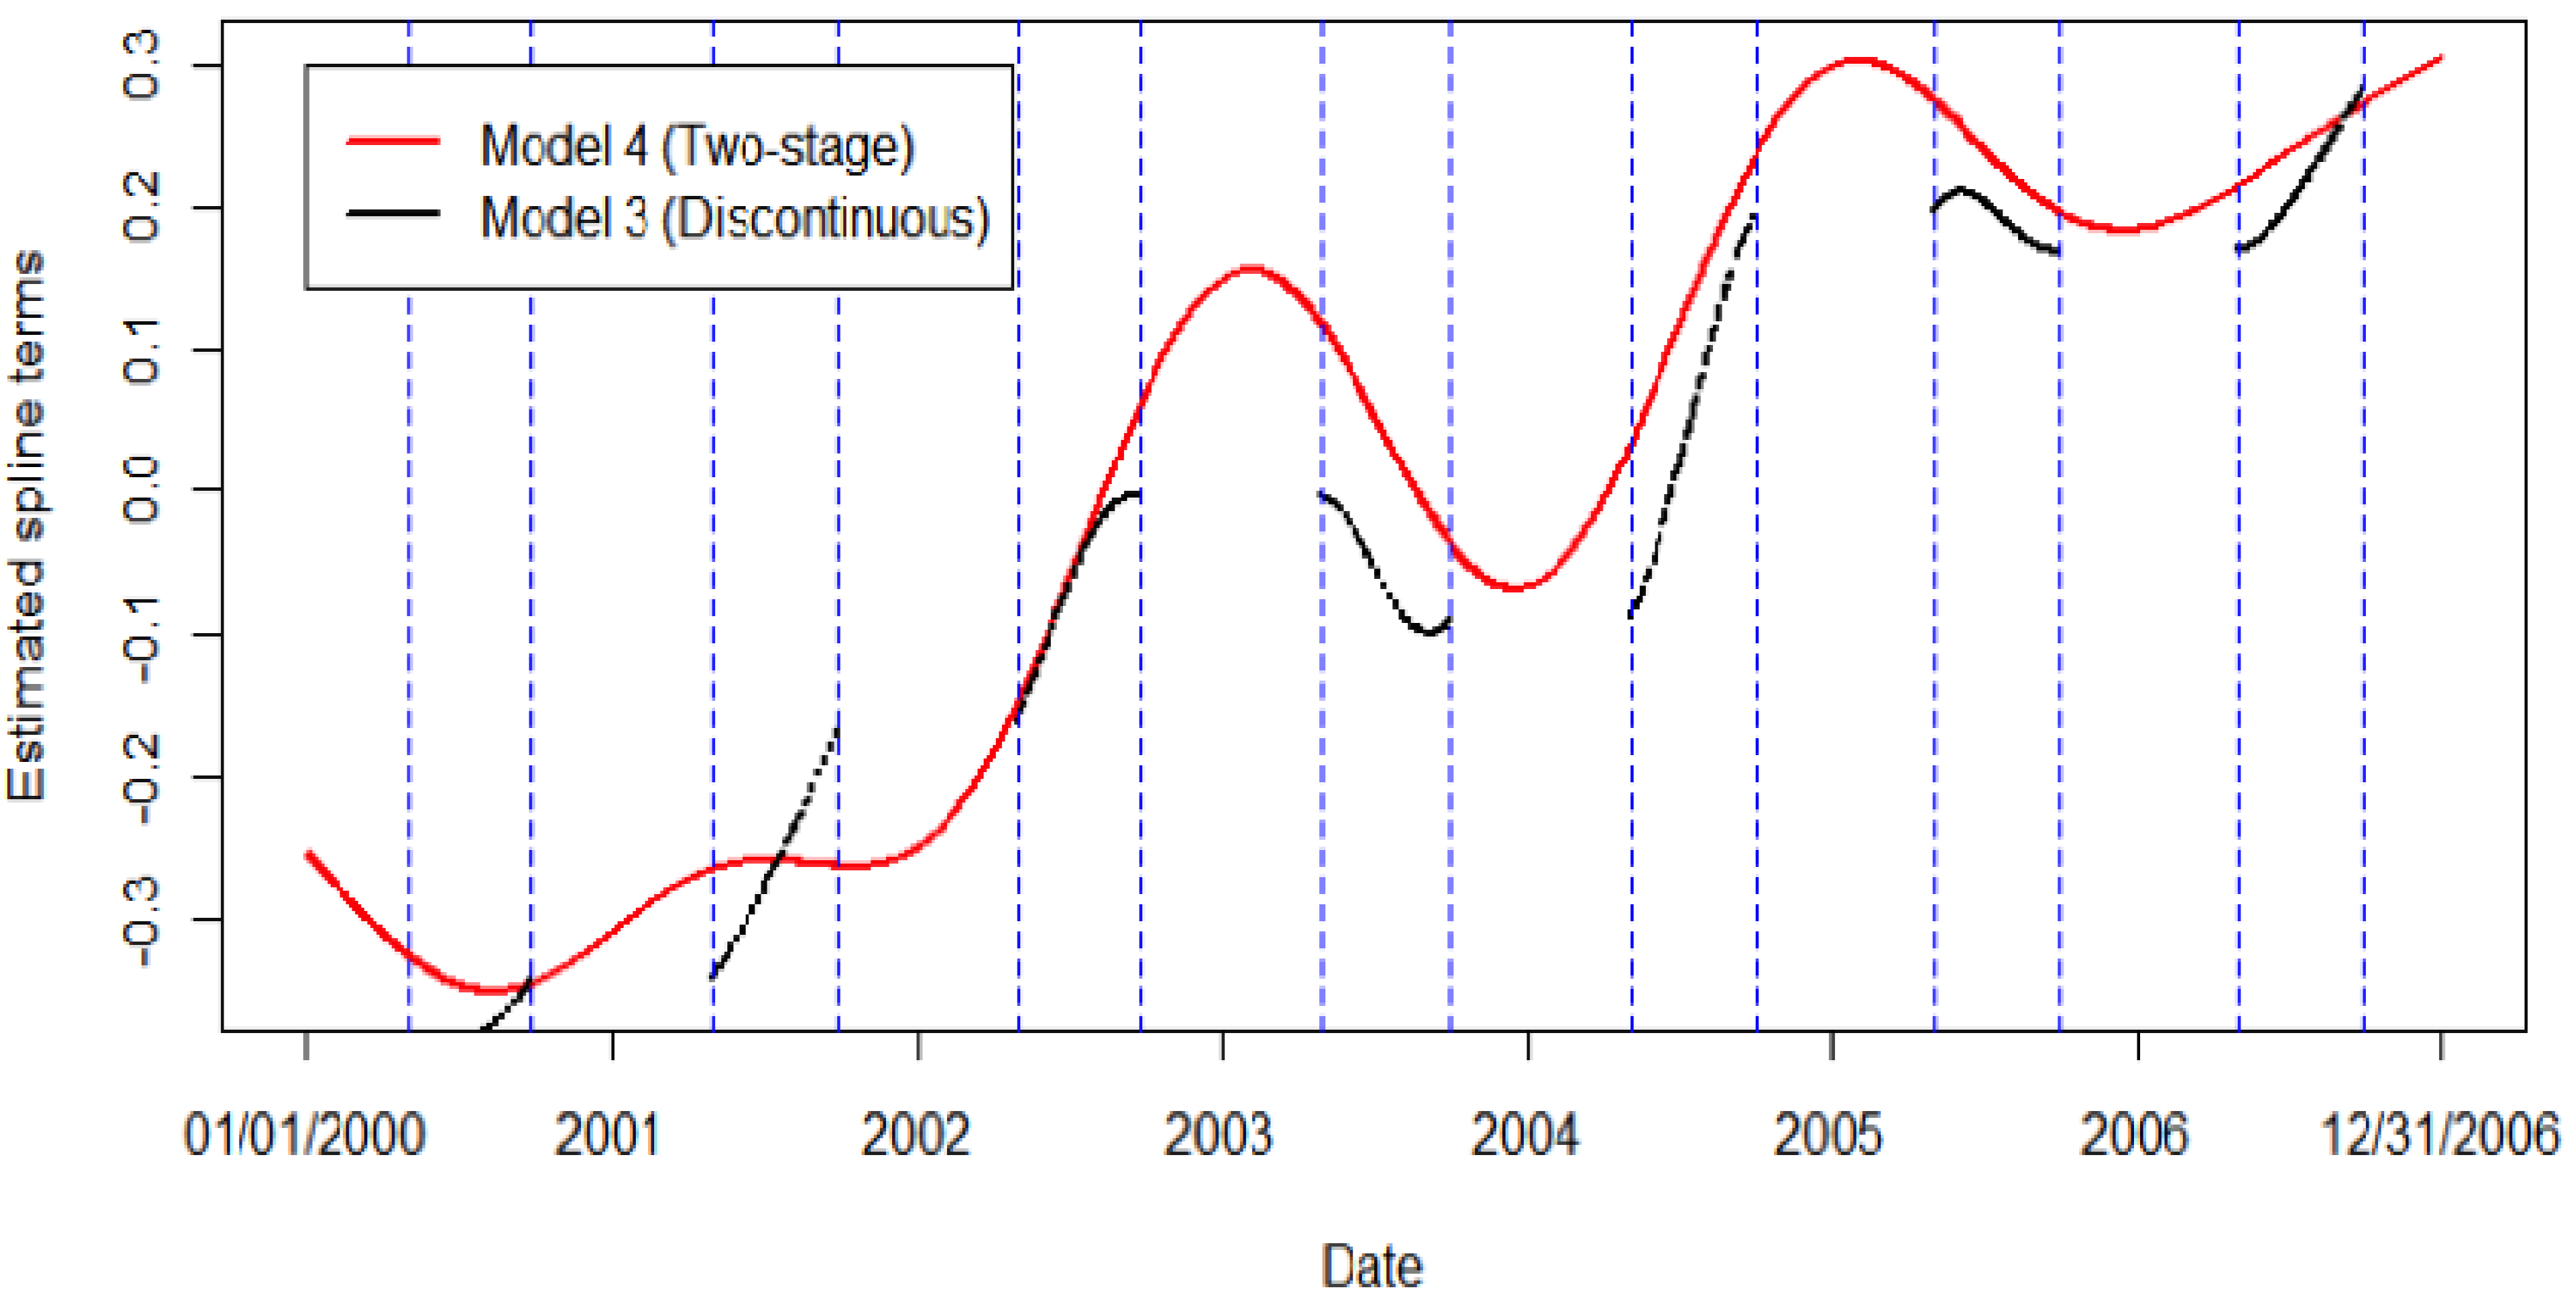
2.3.3. Exploring the Effect of Long-Term Time Trends
Model 4, Stage 2: log[E(HAt)] = β0 + β1BCt-q + β2PRCPt-q + β3ATt-q + β4DOWt + offsett
2.3.4. Calculating A Regional Estimate
3. Results and Discussion
| City | Population Over 65a (% of Population) | Mean Daily GI-Related Admissions (per 100,000) | Mean Daily Beach Closures (Total) | Median daily Total Precipitation (mm) (90th Percentile) | Mean daily Apparent Temperature °C (°F) |
|---|---|---|---|---|---|
| Buffalo, NY | 151,258 (16) | 1.48 (0.98) | 0.93 (292) | 0.00 (9.40) | 18.99 (66.19) |
| Chicago, IL | 747,777 (11) | 14.47 (1.94) | 0.61 (506) | 0.00 (9.63) | 20.39 (68.71) |
| Cleveland, OH | 284,788 (15) | 4.89 (1.72) | 1.47 (535) | 0.00 (9.63) | 20.22 (68.39) |
| Detroit, MI | 491,592 (12) | 7.35 (1.50) | 0.71 (342) | 0.00 (9.40) | 20.44 (68.80) |
| Erie, PA | 40,256 (14) | 0.42 (1.04) | 0.40 (103) | 0.00 (10.67) | 19.38 (66.89) |
| Gary, IN | 63,234 (13) | 0.95 (1.50) | 0.90 (293) | 0.00 (10.67) | 20.27 (68.49) |
| Grand Rapids, MI | 59,625 (10) | 0.69 (1.16) | 0.43 (15) | 0.00 (11.43) | 19.14 (66.46) |
| Milwaukee, WI | 121,685 (13) | 2.38 (1.96) | 0.90 (376) | 0.00 (9.40) | 19.06 (66.31) |
| Minneapolis, MN | 59,502 (12) | 1.95 (3.28) | 0.23 (17) | 0.00 (10.67) | 19.33 (67.79) |
| Rochester, NY | 95,779 (13) | 0.80 (0.84) | 0.40 (145) | 0.00 (9.65) | 19.29 (66.22) |
| Rockford, IL | 35,450 (13) | 0.51 (1.44) | 0.10 (75) | 0.00 (9.65) | 20.14 (68.26) |
| Toledo, OH | 59,441 (13) | 0.57 (0.96) | 0.44 (115) | 0.00 (9.65) | 20.44 (68.8) |
| Precipitation Category | City-specific OR | City-specific OR | City-specific OR | City-specific OR |
|---|---|---|---|---|
| (p-value) | (p-value) | (p-value) | (p-value) | |
| Buffalo, NY | Chicago, IL | Cleveland, OH | Detroit, MI | |
| 0 < prcp < 0.01 | 2.42 (0.14) | 1.69 (0.23) | 1.77 (0.30) | 1.28 (0.68) |
| 0.01 ≤ prcp < 90th percentile | 2.94 (<0.001) | 1.34 (0.14) | 1.65 (0.07) | 1.42 (0.13) |
| prcp ≥ 90th percentile | 16.93 (<0.001) | 1.20 (0.41) | 7.39 (0.00) | 4.02 (<0.001) |
| Erie, PA | Gary, IN | Grand Rapids, MI | Milwaukee, WI | |
| 0 < prcp < 0.01 | 0.00 (0.98) | 1.48 (0.70) | - | 0.93 (0.89) |
| 0.01 ≤ prcp < 90th percentile | 2.31 (0.09) | 1.53 (0.15) | 1.71 (0.54) | 1.41 (0.22) |
| prcp ≥ 90th percentile | 10.21 (<0.001) | 2.01 (0.05) | 0.57 (0.64) | 2.01 (0.04) |
| Minneapolis, MN | Rochester, NY | Rockford, IL | Toledo, OH | |
| 0 < prcp < 0.01 | 2.00 (0.59) | 2.67 (0.03) | 0.00 (0.09) | 2.02 (0.29) |
| 0.01 ≤ prcp < 90th percentile | 1.33 (0.75) | 1.91 (0.03) | 0.51 (0.17) | 1.24 (0.55) |
| prcp ≥ 90th percentile | 1.60 (0.50) | 5.67 (<0.001) | 0.66 (0.40) | 9.07 (<0.001) |
| Buffalo, NY | Chicago, IL | Cleveland, OH | Detroit, MI | Erie, PA | |
| lag 1 | 0.96 (0.79, 1.16) | 0.96 (0.91, 1.00) | 0.99 (0.90, 1.09) | 1.01 (0.94, 1.08) | 1.49 (0.90, 2.46) |
| lag 2 | 0.97 (0.79, 1.19) | 1.02 (0.97, 1.07) | 1.05 (0.95, 1.17) | 1.00 (0.93, 1.08) | 1.67 (1.02, 2.76) |
| lag 3 | 1.04 (0.85, 1.28) | 1.00 (0.95, 1.05) | 0.88 (0.80, 0.98) | 0.97 (0.90, 1.05) | 1.15 (0.69, 1.93) |
| lag 4 | 0.98 (0.81, 1.20) | 1.01 (0.96, 1.06) | 0.96 (0.86, 1.06) | 0.99 (0.92, 1.07) | 1.23 (0.70, 2.18) |
| lag 5 | 0.78 (0.63, 0.96) | 1.02 (0.97, 1.07) | 1.02 (0.92, 1.14) | 0.92 (0.86, 0.99) | 0.49 (0.22, 1.06) |
| lag 6 | 0.92 (0.75, 1.12) | 1.02 (0.98, 1.08) | 1.03 (0.93, 1.15) | 0.95 (0.88, 1.02) | 1.54 (0.89, 2.65) |
| lag 7 | 0.92 (0.75, 1.12) | 1.00 (0.96, 1.05) | 0.96 (0.87, 1.06) | 0.97 (0.90, 1.04) | 0.94 (0.52, 1.68) |
| Gary, IN | Grand Rapids, MI | Milwaukee, WI | Minneapolis, MN | Rochester, NY | |
| lag 1 | 0.90 (0.71, 1.15) | 0.70 (0.22, 2.13) | 1.05 (0.89, 1.24) | 1.76 (1.13, 2.75) | 0.84 (0.64, 1.10) |
| lag 2 | 1.08 (0.85, 1.38) | 1.74 (0.74, 4.09) | 1.02 (0.87, 1.20) | 1.13 (0.72, 1.75) | 0.86 (0.65, 1.12) |
| lag 3 | 1.01 (0.80, 1.28) | 1.13 (0.51, 2.51) | 0.99 (0.84, 1.17) | 1.08 (0.68, 1.69) | 1.30 (1.00, 1.68) |
| lag 4 | 1.03 (0.81, 1.31) | 1.26 (0.50, 3.17) | 1.03 (0.88, 1.21) | 0.70 (0.40, 1.22) | 0.96 (0.73, 1.26) |
| lag 5 | 0.99 (0.78, 1.25) | 0.66 (0.17, 2.57) | 1.08 (0.92, 1.27) | 1.14 (0.69, 1.86) | 0.97 (0.74, 1.28) |
| lag 6 | 1.11 (0.87, 1.41) | 1.49 (0.49, 4.50) | 0.99 (0.84, 1.16) | 1.10 (0.73, 1.67) | 1.03 (0.79, 1.35) |
| lag 7 | 0.87 (0.69, 1.11) | 2.41 (0.75, 7.77) | 1.07 (0.91, 1.26) | 0.75 (0.51, 1.10) | 1.19 (0.92, 1.53) |
| Rockford, IL | Toledo, OH | Pooled-Estimate | |||
| lag 1 | 1.11 (0.67, 1.82) | 0.97 (0.68, 1.38) | 0.98 (0.95, 1.01) | ||
| lag 2 | 0.78 (0.42, 1.43) | 0.70 (0.47, 1.02) | 1.01 (0.98, 1.05) | ||
| lag 3 | 0.83 (0.46, 1.50) | 1.13 (0.77, 1.65) | 0.98 (0.95, 1.02) | ||
| lag 4 | 1.04 (0.62, 1.74) | 0.64 (0.43, 0.97) | 1.00 (0.96, 1.03) | ||
| lag 5 | 1.35 (0.85, 2.13) | 1.03 (0.71, 1.48) | 0.99 (0.95, 1.02) | ||
| lag 6 | 0.77 (0.42, 1.43) | 1.01 (0.71, 1.45) | 1.01 (0.97, 1.04) | ||
| lag 7 | 1.30 (0.81, 2.10) | 1.67 (1.22, 2.30) | 0.99 (0.96, 1.03) |

4. Conclusions
Acknowledgments
Author Contributions
Conflicts of Interest
References
- Dufour, A.P.; Wymer, L.J. Microbes, monitoring, and human health. Oceanography 2006, 19, 72–80. [Google Scholar] [CrossRef] [Green Version]
- Marion, J.W.; Lemeshow, S.; Buckley, T.J. Association of gastrointestinal illness and recreational water exposure at an inland U.S. beach. Water Res. 2010, 44, 4796–4804. [Google Scholar] [CrossRef]
- Wade, T.J.; Calderon, R.L.; Brenner, K.P.; Sams, E.; Beach, M.; Haugland, R.; Wymer, L.; Dufour, A.P. High sensitivity of children to swimming-associated gastrointestinal illness: Results using rapid assay of recreational water quality. Epidemiology 2008, 19, 375–383. [Google Scholar] [CrossRef]
- Fleisher, J.M.; Kay, D.; Salmon, R.L.; Jones, F.; Wyer, M.; Godfree, A.F. Marine waters contaminated with domestic sewage: Nonenteric illnesses associated with bather exposure in the United Kingdom. Am. J. Public Health 1996, 86, 1228–1234. [Google Scholar] [CrossRef]
- Wade, T.J.; Pai, N.; Eisenberg, J.N.S.; Colford, J.M. Do US EPA water quality guidelines prevent gastrointestinal symptoms? A systematic review and meta analysis. Environ. Health Persp. 2003, 111, 1102–1109. [Google Scholar] [CrossRef]
- U.S. Environmental Protection Agency (USEPA). Bacterial Water Quality Standards for Recreational Waters (Freshwater and Marine Waters); No. EPA-823-R-03–008; USEPA: Washington, DC, USA, 2003.
- Efstratiou, M.A. Managing coastal bathing water quality: The contribution of microbiology and epidemiology. Mar. Pollut. Bull. 2001, 42, 425–432. [Google Scholar] [CrossRef]
- Marsalek, J.; Rochfort, Q. Urban wet weather flows: Sources of fecal contamination impacting on recreational waters and threatening drinking water resources. J. Toxicol. Environ. Health 2003, 67, 1–13. [Google Scholar]
- Ackerman, D.; Weisberg, S.B. Relationship between rainfall and beach bacterial concentrations on Santa Monica Bay Beaches. J. Water Health 2003, 1, 85–89. [Google Scholar]
- Olyphant, G.A.; Thomas, J.; Whitman, R.L.; Harper, D. Characterization and statistical modeling of bacterial (Escherichia coli) outflows from watersheds that discharge into southern Lake Michigan. Environ. Monit. Assess. 2003, 81, 289–300. [Google Scholar]
- Byappanahallli, M.N.; Whitman, R.L.; Shively, D.A.; Nevers, M.B. Linking non-culturable (qPCR) and culturable Enterococci densities with hydrometeorological conditions. Sci. Total Environ. 2010, 408, 3096–3101. [Google Scholar] [CrossRef]
- Nevers, M.B.; Whitman, R.L. Efficacy of monitoring and empirical predictive modeling at improving public health protection at Chicago beaches. Water Res. 2011, 45, 1659–1668. [Google Scholar] [CrossRef]
- Whitman, R.L.; Nevers, M.B. Summer E. coli patters and responses along 23 Chicago beaches. Environ. Sci. Technol. 2008, 42, 9217–9224. [Google Scholar] [CrossRef]
- Wade, T.J.; Sams, E.; Brenner, K.P.; Haugland, R.; Chern, E.; Beach, M.; Wymer, L.; Rankin, C.C.; Love, D.; Li, Q.; et al. Rapidly measured indicators of recreational water quality and swimming-associated illness at marine beaches: A prospective cohort study. Environ. Health 2010, 9, 1–14. [Google Scholar]
- Pruss, A. Review of epidemiological studies on health effects from exposure to recreational water. Int. J. Epidemiol. 1998, 1, 1–9. [Google Scholar] [CrossRef]
- Curriero, F.C.; Patz, J.A.; Rose, J.B.; Lele, S. The association between extreme precipitation and waterborne disease outbreaks in the United States, 1948–1994. Am. J. Public Health 2001, 91, 1194–1199. [Google Scholar] [CrossRef]
- Regional Climate Trends and Scenarios for the U.S. National Climate Assessment. Part 3. Climate of the Midwest U.S. Available online: http://www.nesdis.noaa.gov/technical_reports/NOAA_NESDIS_Tech_Report_142-3-Climate_of_the_Midwest_U.S.pdf (accessed on 18 November 2013).
- Schuster, C.J.; Ellis, A.; Robertson, W.J.; Charron, D.F.; Aramini, J.J.; Marshall, B.J. Medeiros. D.T. Infectious disease outbreaks related to drinking water in Canada, 1974–2001. Can. J. Public Health 2005, 96, 254–258. [Google Scholar]
- Rose, J.B.; Daeschner, S.; Easterling, D.R.; Curriero, F.C.; Lele, S.; Patz, J.A. Climate and waterborne disease outbreaks. Am. Water Works Assoc. J. 2000, 92, 77–87. [Google Scholar]
- Aramini, J.J.; Mclean, M.; Wilson, J.; Holt, J.; Copes, R.; Allen, B.; Sears, W. Drinking water quality and health care utilization for gastrointestinal illness in greater Vancouver. Can. Commun. Dis. Rep. 2000, 26, 211–214. [Google Scholar]
- Egorov, A.I.; Naumova, E.N.; Tereschenko, A.A.; Kislitsin, V.A.; Ford, T.E. Daily variations in effluent water turbidity and diarrhoeal illness in a Russian city. Int. J. Environ. Health Res. 2003, 13, 81–94. [Google Scholar] [CrossRef]
- Schwartz, J.; Levin, R.; Goldstein, R. Drinking water turbidity and gastrointestinal illness in the elderly of Philadelphia. J. Epidemiol. Commun. Health 2000, 54, 45–51. [Google Scholar] [CrossRef]
- Haley, B.J.; Cole, D.J.; Lipp, E.K. Distribution, diversity, and seasonality of waterborne salmonella in a rural watershed. Appl. Environ. Microbiol. 2009, 75, 1248–1255. [Google Scholar] [CrossRef]
- Jagai, J.S.; Castronovo, D.A.; Monchak, J.; Naumova, E.N. Seasonality of cryptosporidiosis: A meta-analysis approach. Environ. Res. 2009, 109, 465–478. [Google Scholar] [CrossRef]
- Eisenberg, J.N.S.; Seto, E.Y.W.; Colford, J.M., Jr.; Olivieri, A.; Spear, R.C. An analysis of the Milwaukee cryptosporidiosis outbreak based on a dynamic model of the infection process. Epidemiology 1998, 9, 255–263. [Google Scholar] [CrossRef]
- Naumova, E.N.; Egorov, A.I.; Morris, R.D.; Griffiths, J.K. The elderly and waterborne Cryptosporidium infection: Gastroenteritis hospitalizations before and during the 1996 Milwaukee Outbreak. Emerg. Infect. Dis. 2003, 9, 418–425. [Google Scholar] [CrossRef]
- Wong, M.; Kumar, L.; Jenkins, T.M.; Xagoraraki, I.; Phanikuman, M.S.; Rose, J.B. Evaluation of public health risks at recreational beaches in Lake Michigan via detection of enteric viruses and a human-specific bacteriological marker. Water Res. 2009, 43, 1137–1149. [Google Scholar]
- Dorfman, M. Testing the Waters: A Guide to Water Quality at Vacation Beaches; Natural Resources Defense Council (NRDC) 16th Annual Report; NRDC: New York, NY, USA, 2006. [Google Scholar]
- Dorfman, M.; Rosselot, K.S. Testing the Waters: A Guide to Water Quality at Vacation Beaches; Natural Resources Defense Council (NRDC) 20th Annual Report; NRDC: New York, NY, USA, 2010. [Google Scholar]
- Centers for Medicare and Medicaid Services. Available online: www.cms.gov (accessed on 18 November 2013).
- Morris, R.D.; Naumova, E.N.; Levin, R.; Munasinghe, R.L. Temporal variation in drinking water turbidity and diagnosed gastroenteritis in Milwaukee. Am. J. Public Health 1996, 86, 237–239. [Google Scholar] [CrossRef]
- United States National Weather Service (NWS). Cooperative Observer Program. 2010. Available online: http://www.nws.noaa.gov/om/coop (accessed on 18 November 2013).
- Kalkstein, L.S.; Valimont, K.M. An evaluation of summer discomfort in the United States using a relative climatological index. Bull. Am. Meteorol. Soc. 1986, 67, 842–848. [Google Scholar] [CrossRef]
- Steadman, R.G. The assessment of sultriness. Part II: Effects of wind, extra radiation and barometric pressure on apparent temperature. J. App. Meteorol. 1979, 18, 874–885. [Google Scholar] [CrossRef]
- Thirsty for Answers: Preparing for the Water-related impacts of Climate Change in American Cities. Available online: http://www.nrdc.org/water/files/thirstyforanswers.pdf (accessed on 18 November 2013).
- Haack, S.K.; Fogarty, L.R.; Wright, C. Escherichia coli and Enterococci at beaches in the Grand Traverse Bay, Lake Michigan: Sources, characteristics, and environmental pathways. Environ. Sci. Technol. 2003, 37, 3275–3282. [Google Scholar] [CrossRef]
- Scopel, C.O.; Harris, J.; McLellan, S.L. Influence of nearshore water dynamics and pollution sources on beach monitoring outcomes at two adjacent Lake Michigan beaches. J. Great Lakes Res. 2006, 32, 543–552. [Google Scholar] [CrossRef]
- McCullagh, P.; Nelder, J.A. Generalized Linear Models; Chapman and Hall: London, UK, 1989. [Google Scholar]
- Dean, C.B. Testing for overdispersion in Poisson and Binomial regression models. J. Am. Stat. Assoc. 1992, 87, 451–457. [Google Scholar] [CrossRef]
- Schwartz, J.; Levin, R.; Goldstein, R. Drinking water turbidity and pediatric use for gastrointestinal illness in Philadelphia. Epidemiology 1997, 8, 615–620. [Google Scholar] [CrossRef]
- Checkley, W.; Epstein, L.D.; Gilman, R.H.; Figueroa, D.; Cama, R.I.; Patz, J.A. Effects of El Nino and ambient temperature on hospital admissions for diarrhoeal diseases in Peruvian children. Lancet 2000, 355, 442–450. [Google Scholar]
- Fleury, M.; Charron, D.F.; Holt, J.D.; Allen, O.B.; Maarouf, A.R. A time series analysis of the relationship of ambient temperature and common bacterial enteric infections in two Canadian provinces. Int. J. Biometeorol. 2006, 50, 385–91. [Google Scholar] [CrossRef]
- Singh, R.B.K.; Hales, S.; de Wet, N.; Raj, R.; Hearnden, M.; Weinstein, P. The influence of climate variation and change on diarrheal disease in the Pacific Islands. Environ. Health Perspect. 2001, 109, 155–159. [Google Scholar] [CrossRef]
- Trinh, C.; Prabhakar, K. Diarrheal diseases in the elderly. Clin. Geriatr. Med. 2007, 23, 833–856. [Google Scholar] [CrossRef]
- Hastie, T.; Tibshirani, R. Generalized additive models (with discussion). Stat. Sci. 1986, 1, 297–318. [Google Scholar] [CrossRef]
- Hastie, T.; Tibshirani, R. Exploring the nature of covariate effects in the proportional hazards model. Biometrics 1990, 46, 1005–1016. [Google Scholar] [CrossRef]
- Berkey, C.S.; Hoaglin, D.C.; Mosteller, F.; Colditz, G.A. A random-effects regression model for meta-analysis. Stat. Med. 1995, 14, 395–411. [Google Scholar] [CrossRef]
- Normand, S.L.T. Tutorial in biostatistics. Meta-analysis: Formulating, evaluating, combining, and reporting. Stat. Med. 1999, 18, 321–359. [Google Scholar] [CrossRef]
- United States Census Bureau. American Fact Finder. Available online: http://factfinder2.census.gov/faces/nav/jsf/pages/index.xhtml (accessed on 18 November 2013).
- Drayna, P.; McLellan, S.L.; Simpson, P.; Li, S.; Gorelick, M.H. Association between rainfall and pediatric emergency department visits for acute gastrointestinal illness. Environ. Health Persp. 2010, 188, 1439–1443. [Google Scholar]
- Sampson, R.W.; Swiatnicki, S.A.; McDermott, C.M.; Kleinheinz, G.T. The effects of rainfall on Escherichia coli and total coliform levels at 15 lake superior recreational beaches. Water Res. Manage. J. 2006, 20, 151–159. [Google Scholar] [CrossRef]
- Charron, D.F.; Thomas, M.K.; Waltner-Toews, D.; Aramini, J.J.; Edge, T.; Kent, R.A.; Maarouf, A.; Wilson, J. Vulnerability of waterborne diseases to climate change in Canada: A review. J. Toxicol. Environ. Health 2004, 67, 1667–1677. [Google Scholar] [CrossRef]
- Ford, T.E. Microbiological safety of drinking water: United States and global perspectives. Environ. Health Persp. 1999, 107, 191–206. [Google Scholar]
- Nowcasting and Forecasting of Beach Bacteria Concentration Using EPA’s Virtual Beach Software. Available online: http://adsabs.harvard.edu/abs/2007AGUSMOS23G..05F (accessed on 18 November 2013).
- Nevers, M.B.; Whitman, R.L. Nowcast modeling of Escherichia coli concentrations at multiple urban beaches of southern Lake Michigan. Water Res. 2005, 39, 5250–5260. [Google Scholar] [CrossRef]
- Intergovernmental Panel on Climate Change (IPCC). Managing the Risks of Extreme Events and Disasters to Advance Climate Change Adaptation Summary for Policymakers; Cambridge University Press: Cambridge, UK, 2012; pp. 1–19. Available online: http://www.ipcc.ch/pdf/special-reports/srex/SREX_FD_SPM_final.pdf (accessed on 18 November 2013).
- Sterk, A.; Schijven, J.; de Nijs, T.; de Roda Husman, A.M. Direct and indirect effects of climate change on the risk of infection by water-transmitted pathogens. Environ. Sci. Technol. 2013, 19. [Google Scholar] [CrossRef]
Appendix
| Buffalo, NY | Chicago, IL | Cleveland, OH | Detroit, MI | Erie, PA | |
| lag 1 | 0.69 (0.38, 1.25) | 1.12 (1.00, 1.24) | 1.02 (0.83, 1.25) | 0.98 (0.78, 1.20) | 1.33 (0.38, 4.60) |
| lag 2 | 1.26 (0.80, 1.99) | 0.97 (0.86, 1.09) | 1.03 (0.84, 1.27) | 0.92 (0.73, 1.15) | 0.34 (0.05, 2.49) |
| lag 3 | 1.11 (0.67, 1.83) | 1.02 (0.90, 1.15) | 1.13 (0.93, 1.38) | 1.04 (0.83, 1.30) | 2.33 (0.94, 5.77) |
| lag 4 | 0.61 (0.33, 1.13) | 0.99 (0.88, 1.12) | 0.96 (0.77, 1.21) | 1.05 (0.83, 1.31) | 1.04 (0.30, 3.61) |
| lag 5 | 1.04 (0.62, 1.72) | 0.99 (0.88, 1.11) | 0.93 (0.74, 1.17) | 0.78 (0.61, 1.00) | 0.96 (0.22, 4.14) |
| lag 6 | 0.99 (0.59, 1.69) | 1.05 (0.94, 1.18) | 1.01 (0.82, 1.26) | 1.29 (1.06, 1.58) | 1.02 (0.23, 4.46) |
| lag 7 | 1.10 (0.68, 1.79) | 1.10 (0.98, 1.23) | 1.11 (0.91, 1.36) | 1.02 (0.81, 1.27) | 0.75 (0.11, 5.37) |
| Gary, IN | Grand Rapids, MI | Milwaukee, WI | Minneapolis, MN | Rochester, NY | |
| lag 1 | 1.14 (0.42, 3.11) | 0.51 (0.13, 1.87) | 0.86 (0.55, 1.35) | 0.83 (0.27, 2.49) | 1.25 (0.77, 2.02) |
| lag 2 | 1.52 (0.64, 3.59) | 1.31 (0.53, 3.25) | 0.91 (0.59, 1.39) | 1.02 (0.41, 2.52) | 0.80 (0.45, 1.41) |
| lag 3 | 0.42 (0.09, 2.00) | 1.23 (0.55, 2.75) | 0.93 (0.61, 1.43) | 1.28 (0.60, 2.77) | 1.18 (0.72, 1.94) |
| lag 4 | 1.30 (0.55, 3.07) | 0.47 (0.14, 1.57) | 1.19 (0.83, 1.73) | 0.71 (0.23, 2.16) | 1.09 (0.65, 1.84) |
| lag 5 | 1.45 (0.62, 3.39) | 1.33 (0.44, 4.04) | 0.66 (0.41, 1.06) | 1.57 (0.67, 3.66) | 0.86 (0.48, 1.56) |
| lag 6 | 0.91 (0.34, 2.49) | 0.66 (0.18, 2.40) | 1.02 (0.69, 1.52) | 1.05 (0.45, 2.44) | 1.21 (0.75, 1.95) |
| lag 7 | 0.90 (0.30, 2.72) | 0.87 (0.23, 3.26) | 1.08 (0.74, 1.58) | 0.51 (0.20, 1.29) | 1.00 (0.59, 1.72) |
| Rockford, IL | Toledo, OH | ||||
| lag 1 | 1.50 (0.90, 2.53) | 0.71 (0.30, 1.69) | |||
| lag 2 | 0.79 (0.38, 1.61) | 0.86 (0.39, 1.88) | |||
| lag 3 | 1.20 (0.64, 2.24) | 0.68 (0.27, 1.70) | |||
| lag 4 | 1.02 (0.53, 1.96) | 0.73 (0.30, 1.82) | |||
| lag 5 | 0.66 (0.31, 1.43) | 0.98 (0.46, 2.11) | |||
| lag 6 | 0.97 (0.47, 2.00) | 1.73 (0.95, 3.15) | |||
| lag 7 | 1.44 (0.79, 2.63) | 1.69 (0.94, 3.02) |
| Buffalo, NY | Chicago, IL | Cleveland, OH | Detroit, MI | Erie, PA | |
| lag 1 | 0.94 (0.78, 1.14) | 0.96 (0.91, 1.01) | 1.02 (0.92, 1.12) | 1.01 (0.94, 1.08) | 1.35 (0.81, 2.25) |
| lag 2 | 0.96 (0.79, 1.18) | 1.02 (0.97, 1.08) | 1.08 (0.97, 1.19) | 1.00 (0.93, 1.08) | 1.49 (0.90, 2.49) |
| lag 3 | 1.04 (0.84, 1.27) | 0.99 (0.94, 1.05) | 0.89 (0.81, 0.99) | 0.97 (0.90, 1.05) | 1.09 (0.65, 1.84) |
| lag 4 | 0.96 (0.78, 1.17) | 1.01 (0.96, 1.07) | 0.97 (0.87, 1.08) | 1.00 (0.93, 1.07) | 1.24 (0.69, 2.20) |
| lag 5 | 0.76 (0.62, 0.93) | 1.02 (0.97, 1.08) | 1.04 (0.93, 1.16) | 0.92 (0.86, 0.99) | 0.48 (0.22, 1.05) |
| lag 6 | 0.89 (0.73, 1.09) | 1.03 (0.98, 1.08) | 1.06 (0.95, 1.17) | 0.95 (0.88, 1.02) | 1.58 (0.91, 2.74) |
| lag 7 | 0.91 (0.74, 1.11) | 1.01 (0.97, 1.06) | 0.97 (0.87, 1.08) | 0.97 (0.90, 1.04) | 0.87 (0.48, 1.58) |
| Gary, IN | Grand Rapids, MI | Milwaukee, WI | Minneapolis, MN | Rochester, NY | |
| lag 1 | 0.95 (0.74, 1.22) | 0.62 (0.20, 1.93) | 1.02 (0.86, 1.20) | 1.84 (1.16, 2.91) | 0.82 (0.63, 1.08) |
| lag 2 | 1.16 (0.90, 1.49) | 1.89 (0.76, 4.68) | 1.01 (0.86, 1.19) | 1.09 (0.69, 1.71) | 0.84 (0.64, 1.11) |
| lag 3 | 1.09 (0.85, 1.39) | 1.11 (0.48, 2.60) | 0.99 (0.84, 1.17) | 0.96 (0.60, 1.55) | 1.28 (0.99, 1.65) |
| lag 4 | 1.13 (0.88, 1.46) | 1.37 (0.53, 3.58) | 1.05 (0.90, 1.23) | 0.61 (0.35, 1.05) | 0.94 (0.72, 1.24) |
| lag 5 | 1.06 (0.82, 1.38) | 1.48 (0.26, 8.57) | 1.08 (0.92, 1.27) | 1.10 (0.67, 1.81) | 0.96 (0.73, 1.27) |
| lag 6 | 1.22 (0.94, 1.57) | 1.35 (0.45, 4.05) | 1.00 (0.86, 1.18) | 1.07 (0.70, 1.65) | 1.02 (0.78, 1.34) |
| lag 7 | 0.90 (0.70, 1.15) | 2.29 (0.68, 7.76) | 1.07 (0.91, 1.26) | 0.77 (0.52, 1.12) | 1.17 (0.91, 1.52) |
| Rockford, IL | Toledo, OH | ||||
| lag 1 | 1.10 (0.67, 1.82) | 0.97 (0.68, 1.39) | |||
| lag 2 | 0.77 (0.42, 1.42) | 0.70 (0.48, 1.03) | |||
| lag 3 | 0.81 (0.44, 1.47) | 1.11 (0.76, 1.63) | |||
| lag 4 | 1.02 (0.61, 1.72) | 0.64 (0.42, 0.96) | |||
| lag 5 | 1.35 (0.84, 2.16) | 1.02 (0.71, 1.46) | |||
| lag 6 | 0.75 (0.40, 1.40) | 1.01 (0.71, 1.45) | |||
| lag 7 | 1.29 (0.79, 2.09) | 1.64 (1.19, 2.25) |
© 2014 by the authors; licensee MDPI, Basel, Switzerland. This article is an open access article distributed under the terms and conditions of the Creative Commons Attribution license (http://creativecommons.org/licenses/by/3.0/).
Share and Cite
Bush, K.F.; Fossani, C.L.; Li, S.; Mukherjee, B.; Gronlund, C.J.; O'Neill, M.S. Extreme Precipitation and Beach Closures in the Great Lakes Region: Evaluating Risk among the Elderly. Int. J. Environ. Res. Public Health 2014, 11, 2014-2032. https://doi.org/10.3390/ijerph110202014
Bush KF, Fossani CL, Li S, Mukherjee B, Gronlund CJ, O'Neill MS. Extreme Precipitation and Beach Closures in the Great Lakes Region: Evaluating Risk among the Elderly. International Journal of Environmental Research and Public Health. 2014; 11(2):2014-2032. https://doi.org/10.3390/ijerph110202014
Chicago/Turabian StyleBush, Kathleen F., Cheryl L. Fossani, Shi Li, Bhramar Mukherjee, Carina J. Gronlund, and Marie S. O'Neill. 2014. "Extreme Precipitation and Beach Closures in the Great Lakes Region: Evaluating Risk among the Elderly" International Journal of Environmental Research and Public Health 11, no. 2: 2014-2032. https://doi.org/10.3390/ijerph110202014
APA StyleBush, K. F., Fossani, C. L., Li, S., Mukherjee, B., Gronlund, C. J., & O'Neill, M. S. (2014). Extreme Precipitation and Beach Closures in the Great Lakes Region: Evaluating Risk among the Elderly. International Journal of Environmental Research and Public Health, 11(2), 2014-2032. https://doi.org/10.3390/ijerph110202014