Risk Factors Associated with the Choice to Drink Bottled Water and Tap Water in Rural Saskatchewan

Abstract
:
1. Introduction
2. Materials and Methods
2.1. Design
2.2. Outcomes and Potential Risk Factors of Interest
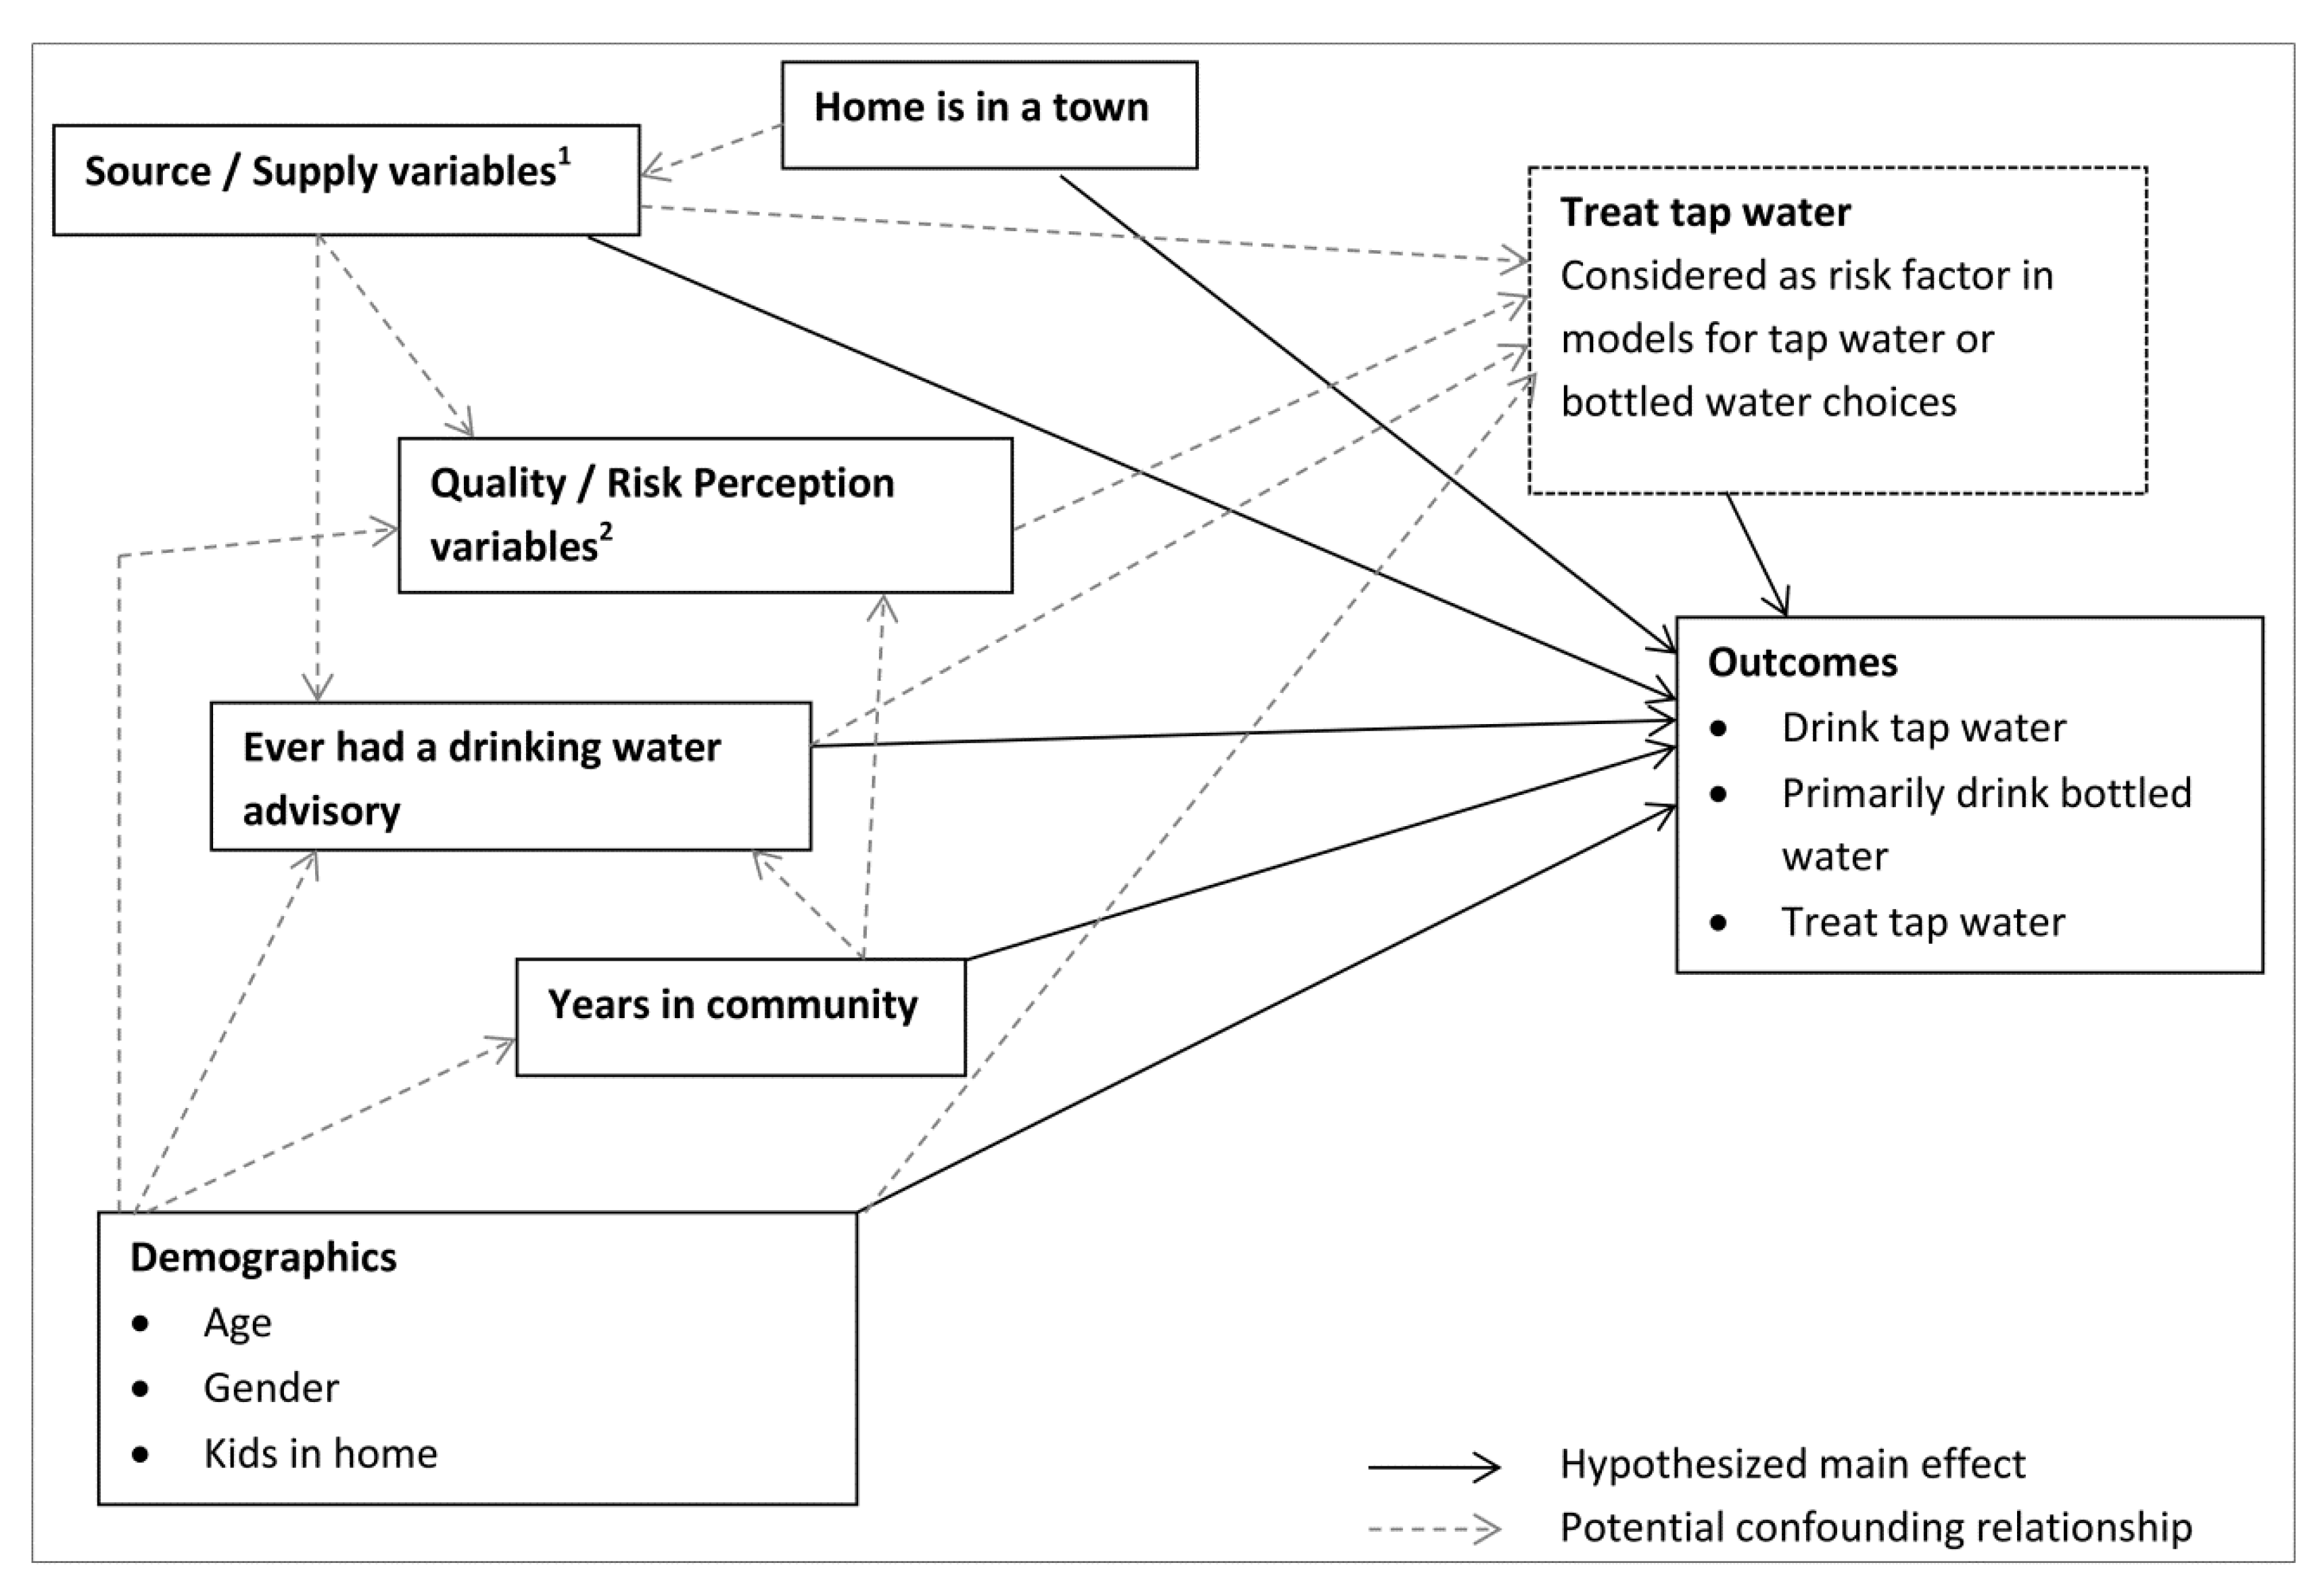
2.3. Statistical Analysis
3. Results
3.1. Descriptive Statistics

| Variable | Complete | Missing | Response | Frequency | ||
|---|---|---|---|---|---|---|
| n | n | n | % 1 | |||
| Outcomes | ||||||
| Primarily Drink Bottled water | 2,030 | 35 | Yes | 626 | 30.8 | |
| No | 1,404 | 69.2 | ||||
| Drink Tap Water Daily | 2,013 | 52 | Yes | 1,223 | 60.8 | |
| No | 790 | 39.2 | ||||
| Treat tap water in-home 2 | 2,003 | 62 | Yes | 953 | 47.6 | |
| No | 1,050 | 52.4 | ||||
| Risk Factors | ||||||
| Private water supply | 2,059 | 6 | Yes | 1,249 | 60.7 | |
| No | 810 | 39.3 | ||||
| Community treated water supply | 2,059 | 6 | Yes | 640 | 31.1 | |
| No | 1,419 | 68.9 | ||||
| Ground water source | 1,857 | 208 | Yes | 1,349 | 72.6 | |
| No | 508 | 27.4 | ||||
| Surface water source | 1,856 | 209 | Yes | 613 | 33.0 | |
| No | 1,243 | 67.0 | ||||
| Any aesthetic complaint about tap water | 1,984 | 81 | Yes | 501 | 25.3 | |
| No | 1,483 | 74.8 | ||||
| Believe tap water not safe to drink | 1,984 | 81 | Yes | 235 | 11.8 | |
| No | 1,749 | 88.2 | ||||
| Fear of contamination of water supply | 1,988 | 77 | Yes | 706 | 35.5 | |
| No | 1,282 | 64.5 | ||||
| Anyone ever been ill from tap water | 1,784 | 281 | Yes | 57 | 3.2 | |
| No | 1,727 | 96.8 | ||||
| Ever had water advisory | 1,981 | 84 | Yes | 485 | 24.5 | |
| No | 1,496 | 75.5 | ||||
| Number of years in community | 2,046 | 19 | ≤10 years 3 | 403 | 19.7 | |
| >10 years | 1,643 | 80.3 | ||||
| Home is in a town | 2,047 | 18 | Yes | 525 | 25.7 | |
| No | 1,522 | 74.4 | ||||
| Gender | 2,005 | 60 | Female 3 | 1,053 | 52.5 | |
| Male | 952 | 47.5 | ||||
| Age | 2,050 | 15 | 18–44 years 3 | 317 | 15.5 | |
| 45–54 years | 446 | 21.8 | ||||
| 55–64 years | 614 | 30.0 | ||||
| ≥65 years | 673 | 32.8 | ||||
| Children in the home | 1,932 | 133 | Yes | 437 | 22.6 | |
| No | 1,495 | 77.4 | ||||
| Category | Survey Respondents 1 | 2011 Census of Population (%) | |
|---|---|---|---|
| n | (%) | ||
| Female | 1,053 | 52.5 | 47.3 |
| Male | 952 | 47.5 | 52.7 |
| 18–44 years | 317 | 15.5 | 35.7 |
| 45–54 years | 446 | 21.8 | 23.2 |
| 55–65 years | 614 | 30.0 | 21.7 |
| ≥65 years | 673 | 32.8 | 19.3 |
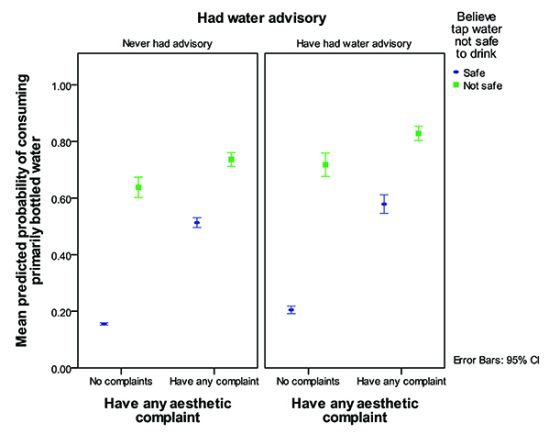
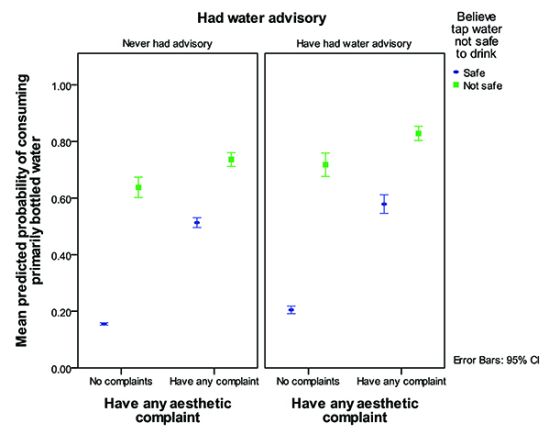
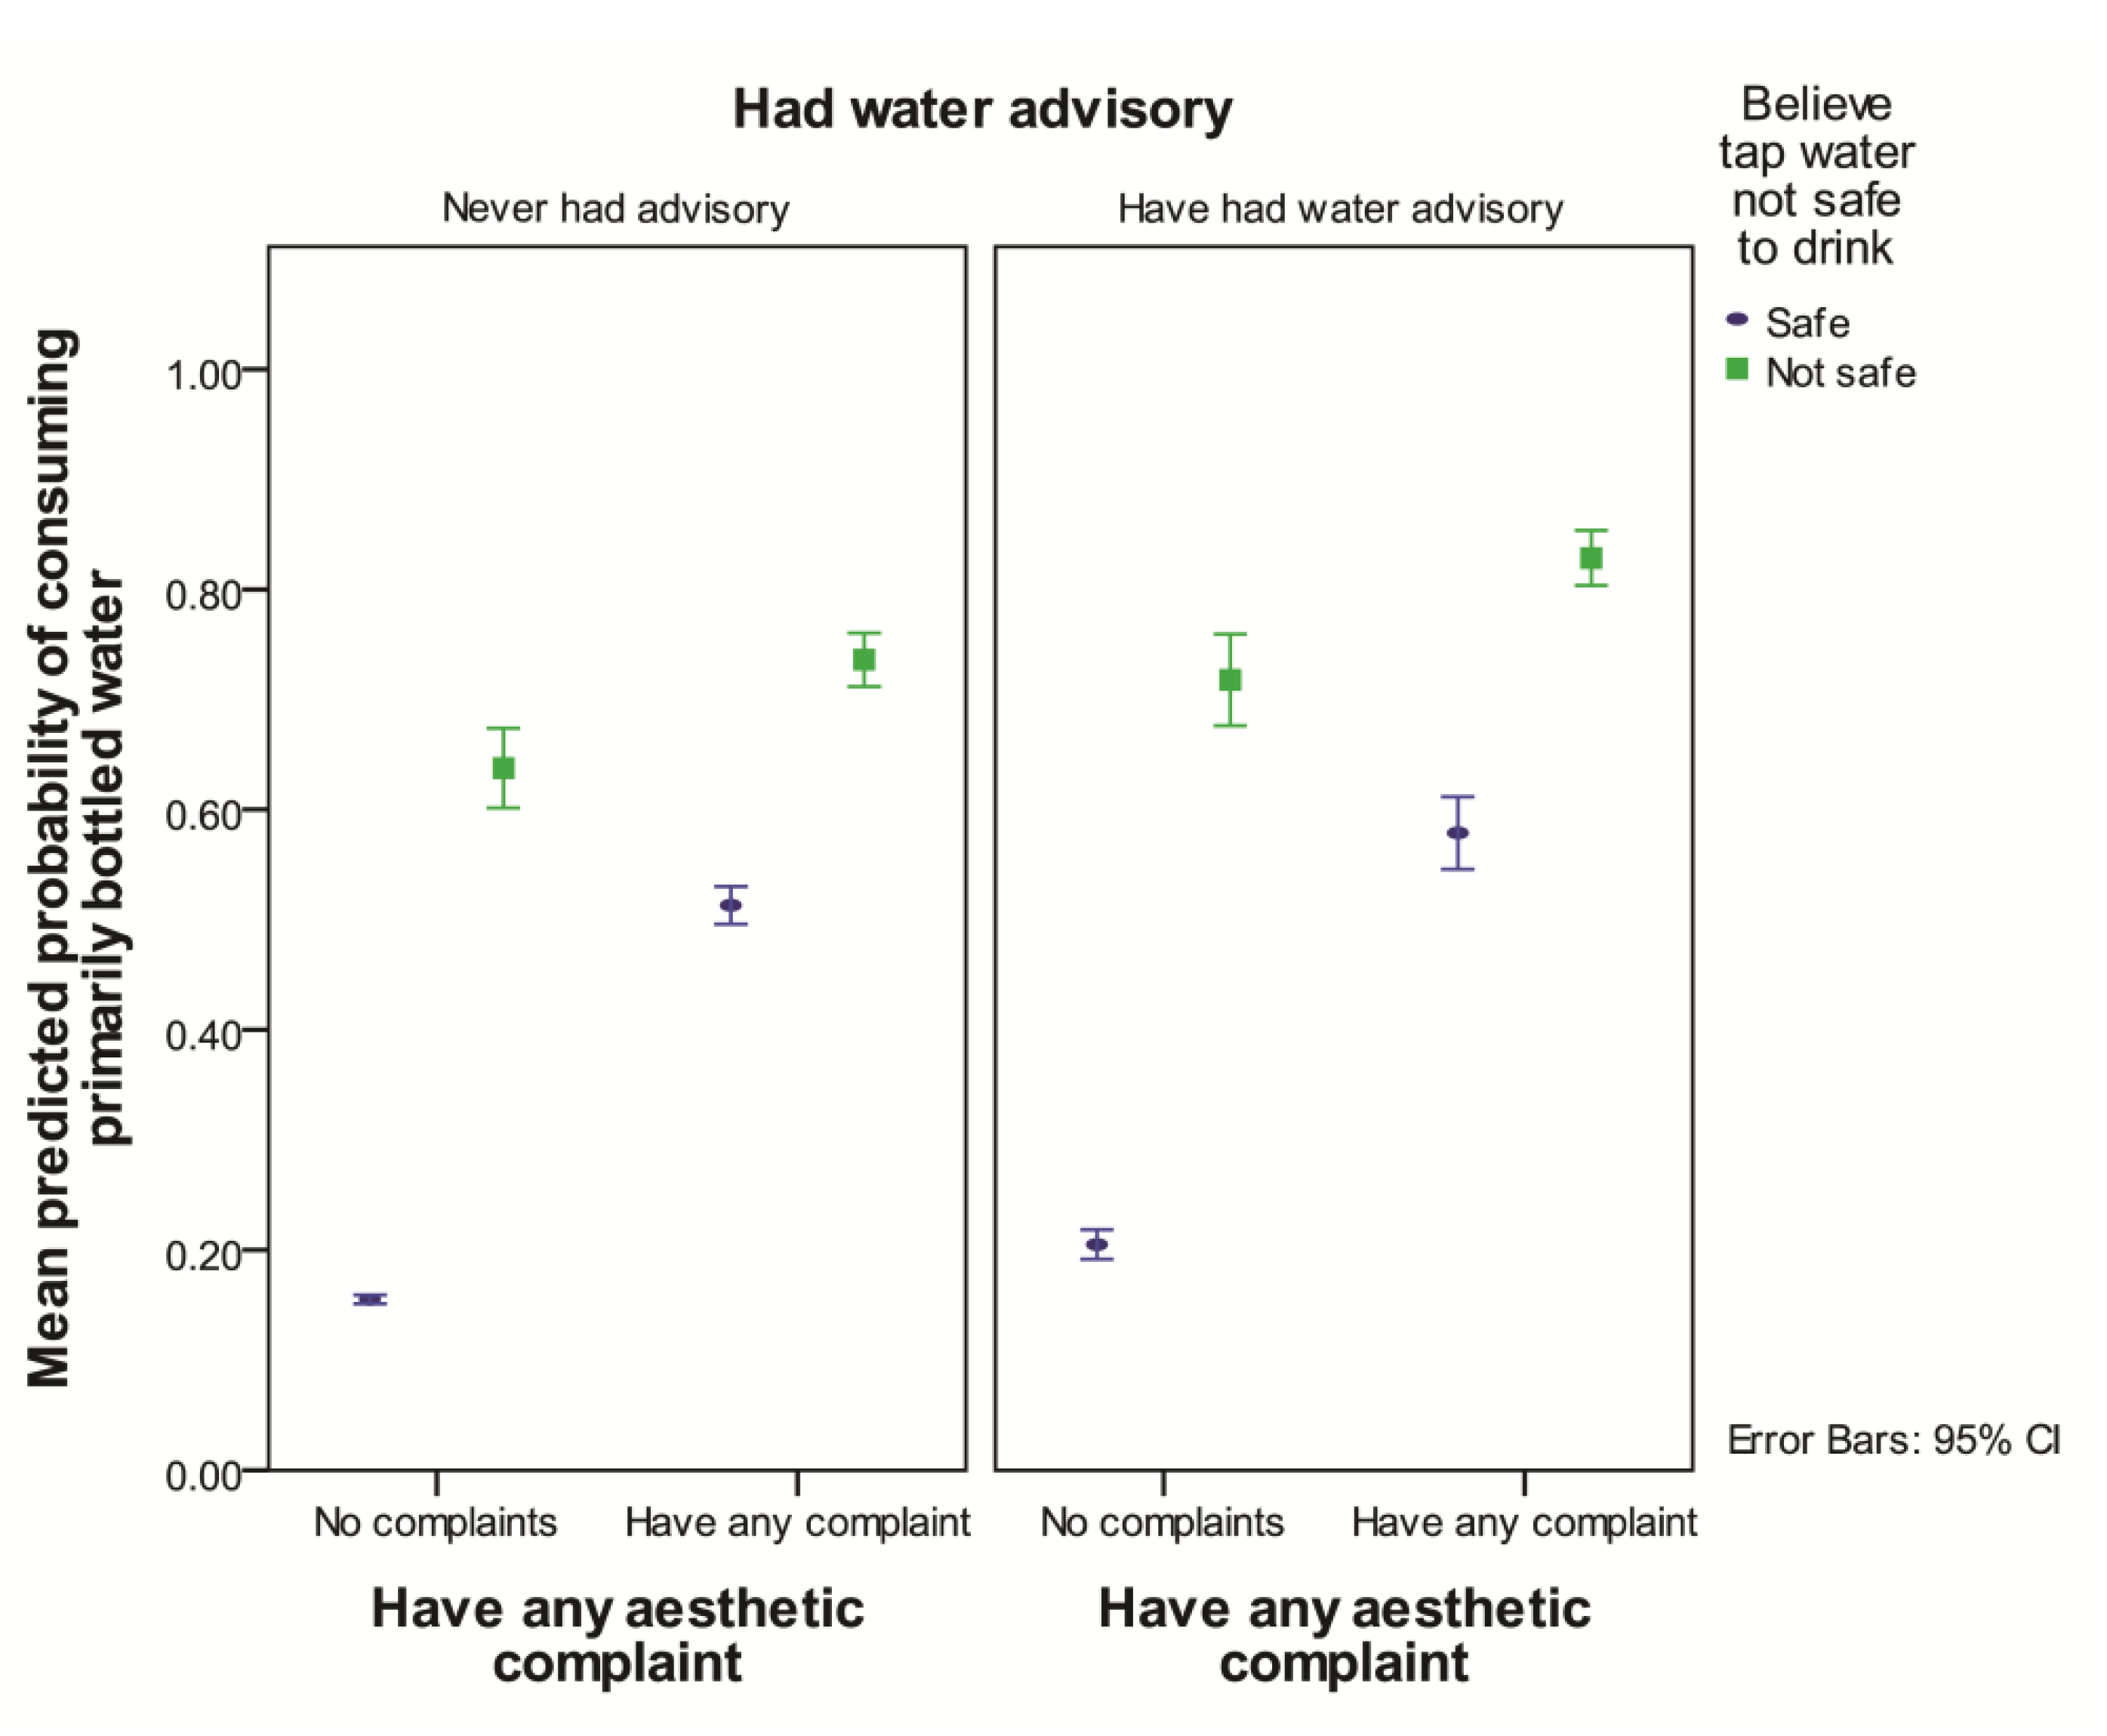
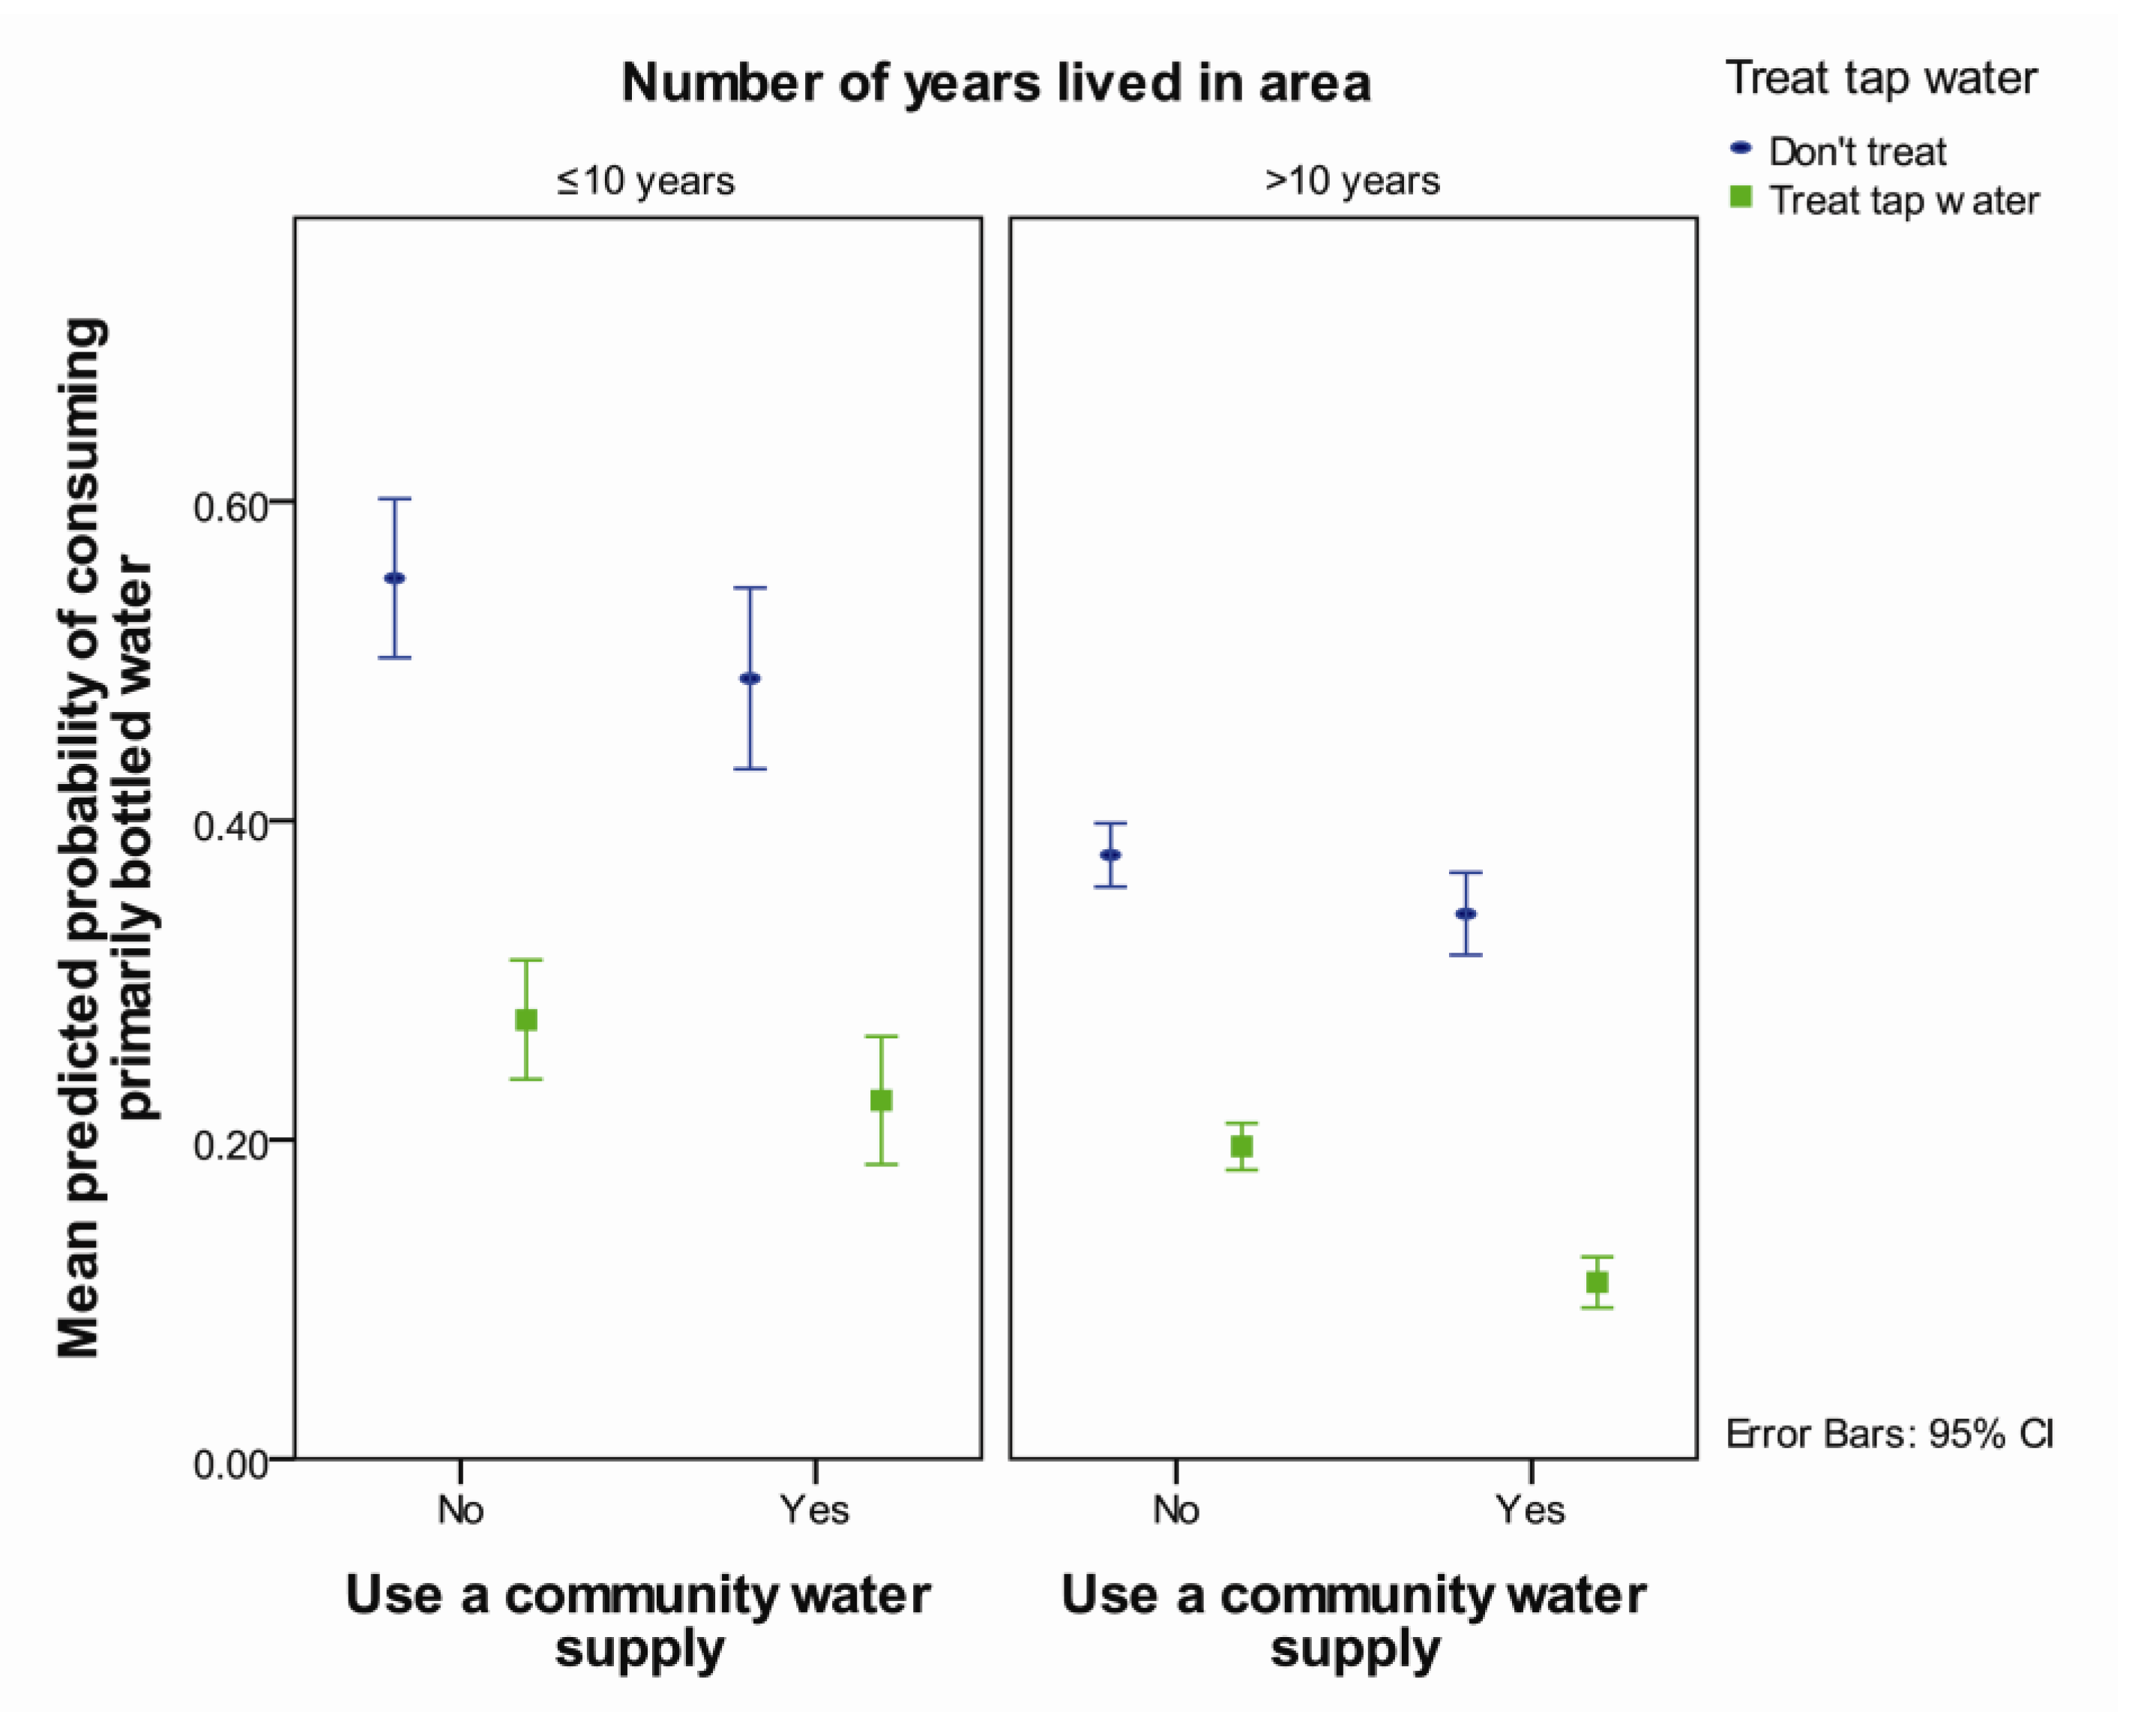
3.2. Choosing Primarily Bottled Water
| Risk Factor | OR | 95% CI | p | ||||
|---|---|---|---|---|---|---|---|
| Ever had water advisory | 1.7 | 1.3 | 2.4 | <0.001 | |||
| Lived in area for > 10 years | Ref 1 | ||||||
| Lived in area ≤; 10 years | 1.5 | 1.1 | 2.0 | 0.01 | |||
| Believe water not safe × have any aesthetic complaint | <0.001 2 | ||||||
| Believe tap water is not safe to drink, compared believing it is safe, for those who have any aesthetic complaint | 2.3 | 1.4 | 3.8 | 0.001 | |||
| Believe tap water is not safe to drink, compared to believing it is safe, for those who have no aesthetic complaints | 8.5 | 5.2 | 13.9 | <0.001 | |||
| Have any aesthetic complaint about tap water compared to not having a complaint, for those who believe their tap water is not safe | 1.7 | 0.9 | 3.2 | 0.13 | |||
| Have any aesthetic complaint about tap water compared to not having a complaint, for those who believe their tap water is safe | 6.1 | 4.6 | 8.0 | <0.001 | |||
| Use a community water supply × treat tap water | 0.03 2 | ||||||
| Not using a community water supply compared to using a community supply, for those who treat the tap water | 2.5 | 1.5 | 4.0 | <0.001 | |||
| Not using a community water supply compared to using a community supply, for those who do not treat their tap water | 1.3 | 0.9 | 1.9 | 0.10 | |||
| Not treating tap water compared to treating tap water, for those who use a community water supply | 4.6 | 2.9 | 7.3 | <0.001 | |||
| Not treating tap water compared to treating tap water, for those who do not use a community water supply | 2.5 | 1.9 | 3.3 | <0.001 | |||
| Variances of Random Effects | Variance | SE | |||||
| Postal code | 0.147 | 0.086 | |||||
| Region | 0.010 | 0.030 | |||||
| Number of observations = 1,844 | |||||||


3.3. Consuming Tap Water Daily
| Risk Factor | OR | 95% CI | p | |||
|---|---|---|---|---|---|---|
| Ever had water advisory | 0.7 | 0.5 | 0.9 | 0.004 | ||
| Lived in area < 10 years | Ref. 1 | |||||
| Lived in area > 10 years | 1.6 | 1.2 | 2.1 | 0.001 | ||
| Believe tap water not safe × any aesthetic complaint | 0.001 2 | |||||
| Believe tap water not safe to drink compared to believing it is safe, for those with any aesthetic complaint | 0.4 | 0.2 | 0.7 | 0.001 | ||
| Believe that tap water not safe to drink compared to believing it is safe, for those with no aesthetic complaints | 0.1 | 0.1 | 0.2 | <0.001 | ||
| Have any aesthetic complaint compared to not having any aesthetic complaint, for those who believe the tap water is not safe | 0.5 | 0.2 | 1.1 | 0.09 | ||
| Have any aesthetic complaint compared to not having any aesthetic complaint, for those who believe the tap water is safe | 0.1 | 0.1 | 0.2 | <0.001 | ||
| Have any aesthetic complaint × treat tap water | 0.006 2 | |||||
| Have any aesthetic complaint compared to not having any aesthetic complaint, for those who treat their tap water | 0.2 | 0.2 | 0.3 | <0.001 | ||
| Have any aesthetic complaint compared to not having any aesthetic complaint, for those who do not treat their tap water | 0.1 | 0.1 | 0.2 | <0.001 | ||
| Treat tap water compared to not treating tap water, for those with any aesthetic complaint | 3.7 | 2.4 | 5.7 | <0.001 | ||
| Treat tap water compared to not treating tap water, for those with no aesthetic complaints | 1.8 | 1.4 | 2.4 | <0.001 | ||
| Variances of Random Effects | Variance | SE | ||||
| Postal code | 0.106 | 0.064 | ||||
| Region | 2.4 × 10⁻¹⁵ | 6.4 × 10⁻⁸ | ||||
| Number of observations = 1,830 | ||||||

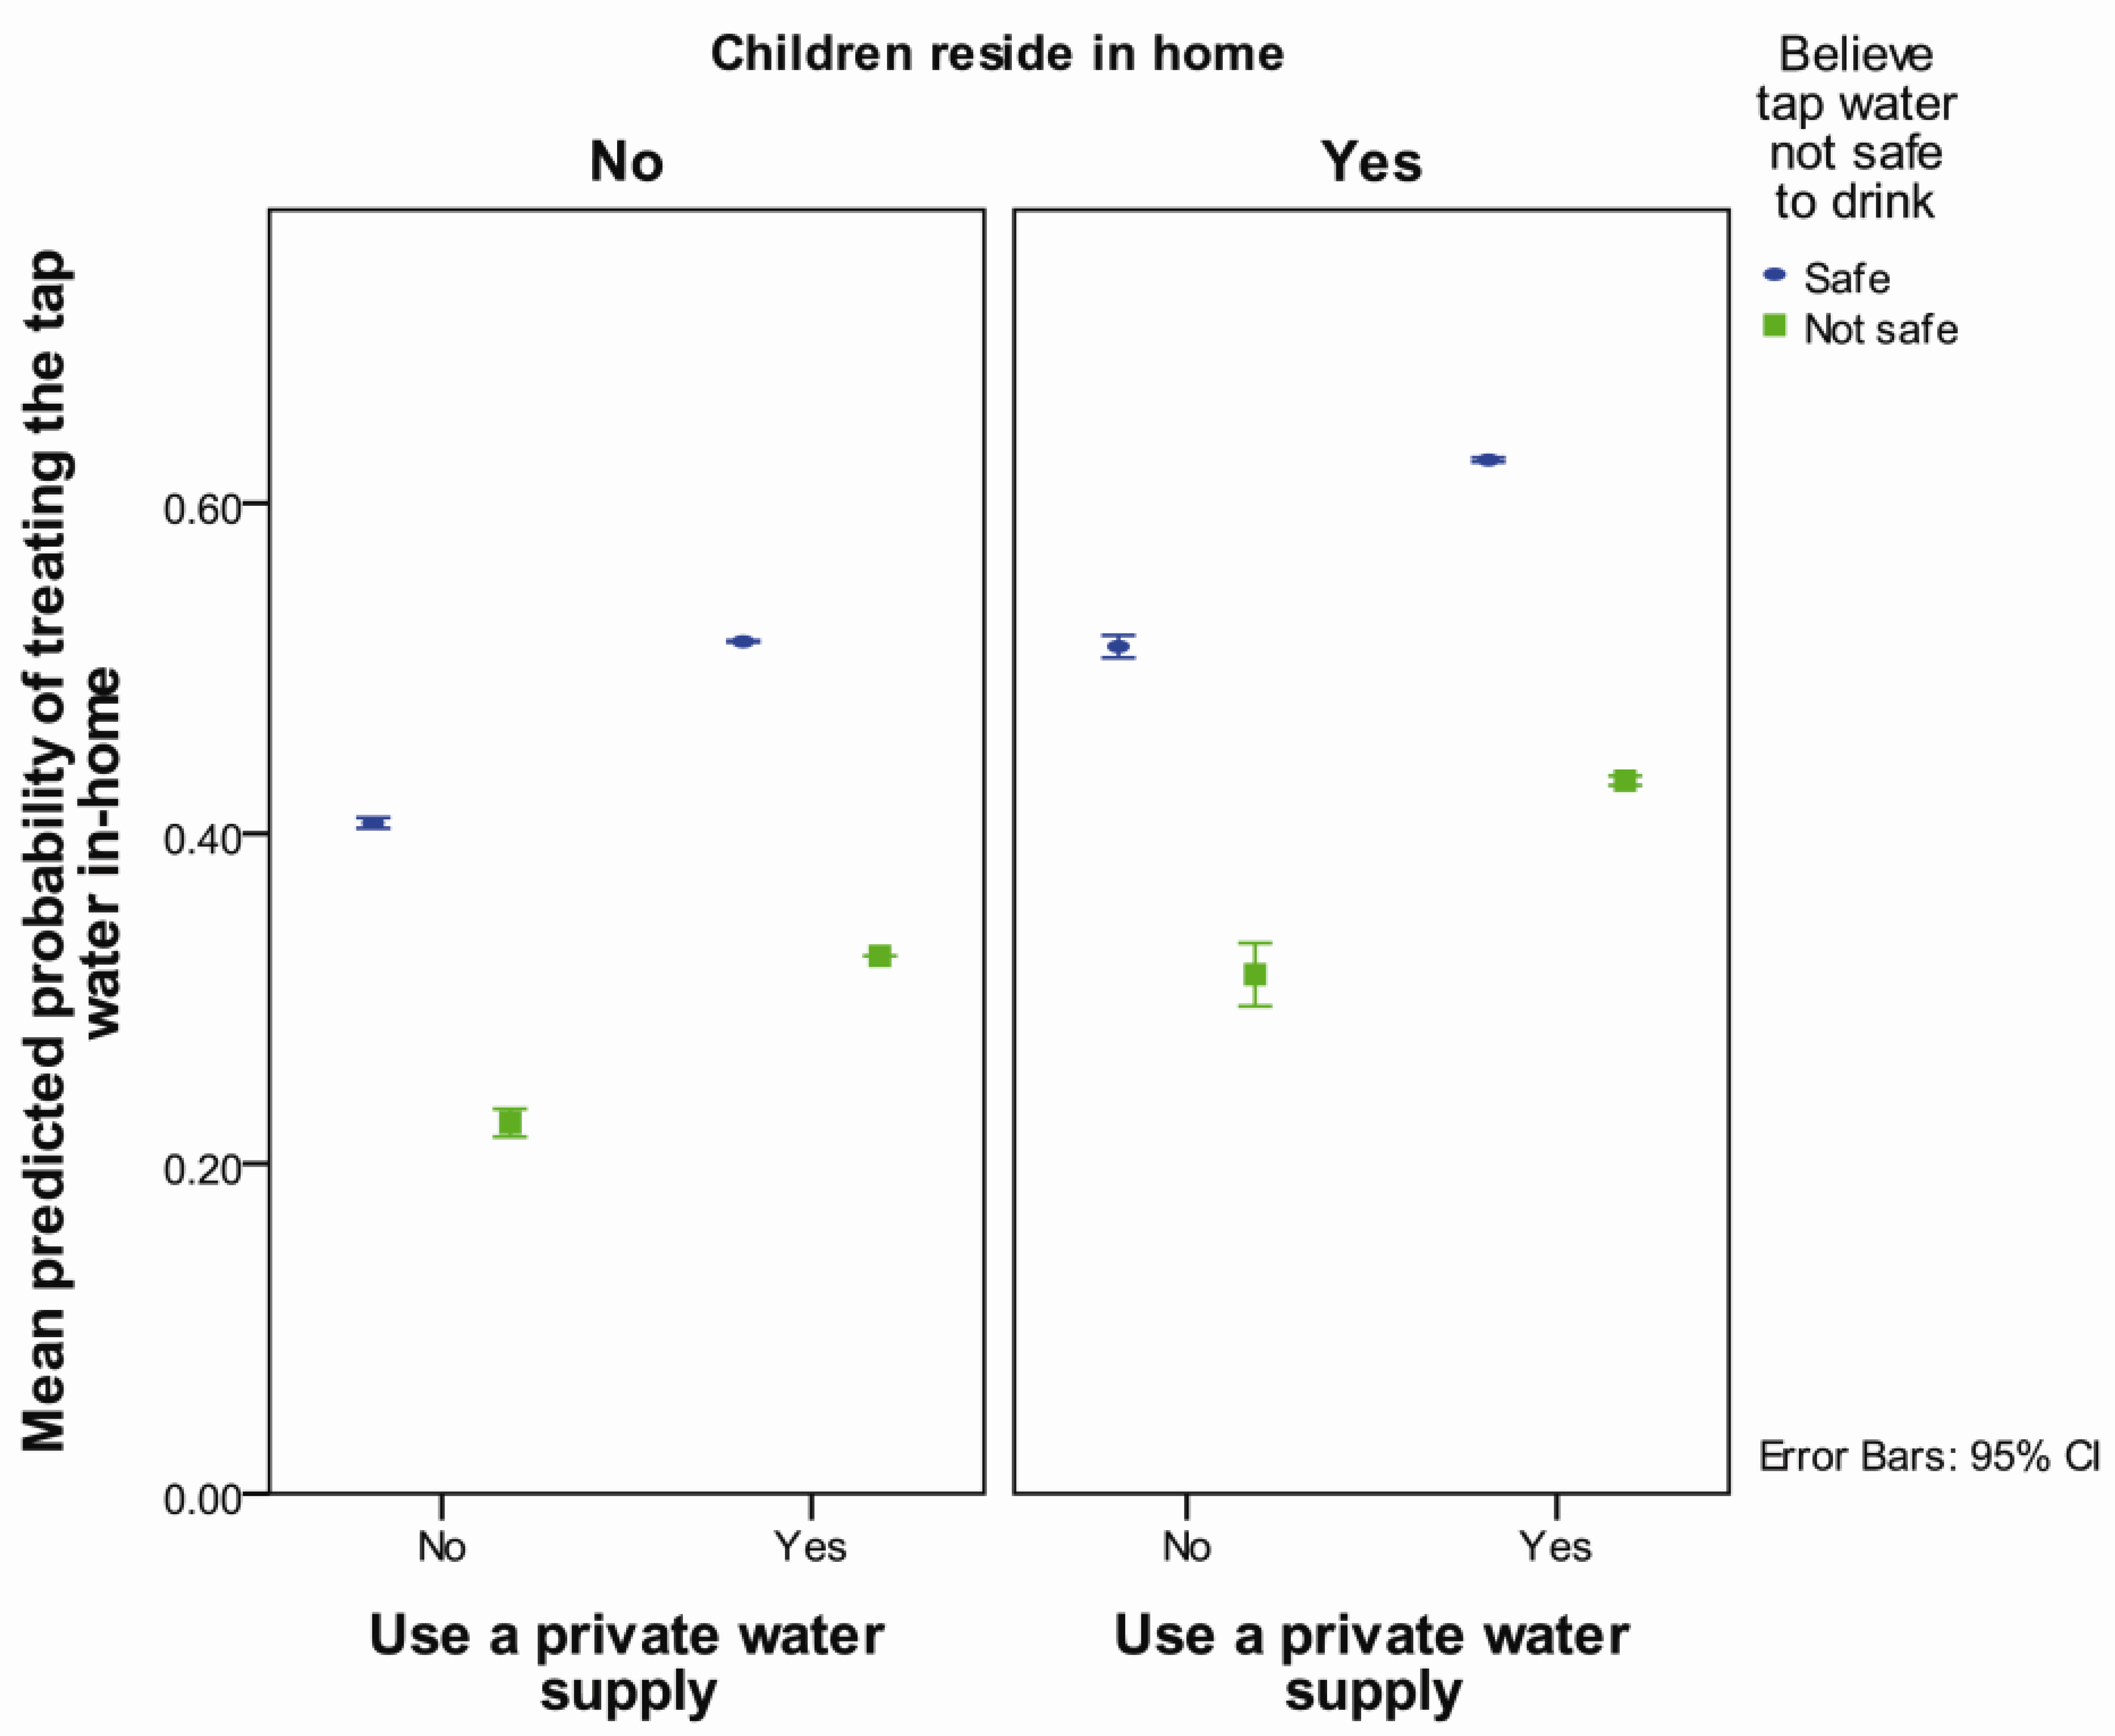
3.4. In-home Treatment of Tap Water
| Risk Factor | OR | 95% CI | p | |
|---|---|---|---|---|
| Use a private water supply | 2.1 | 1.5 | 3.0 | <0.001 |
| Believe tap water not safe | 0.5 | 0.3 | 0.6 | <0.001 |
| Children reside in home | 1.6 | 1.2 | 1.9 | <0.001 |
| Home is in a town | 1.2 | 0.8 | 1.7 | 0.31 |
| Use a community water supply | 1.3 | 0.9 | 1.8 | 0.25 |
| Variances of Random Effects | Variance | SE | ||
| Postal code | 0.067 | 0.044 | ||
| Region | 0.038 | 0.035 | ||
| Number of observations | 1,796 | |||

| Outcome | n | Factors that Increase Likelihood of Outcome | Factors that Decrease Likelihood of Outcome |
|---|---|---|---|
| Primarily choose bottled water | 1,711 | History of water advisory Believe tap water is not safe to drink—magnitude of effect greater for those that have no aesthetic complaints Have any aesthetic complaints about tap water, only for those who believe their tap water is safe | Lived in area longer than 10 years
Use a community water supply, only for those who treat tap water Treat the tap water, with the magnitude of effect larger for those who use a community water supply |
| Consume tap water daily | 1,818 | Lived in area longer than 10 years
Treat tap water—magnitude of effect larger for those that also have aesthetic complaint about tap water | History of water advisory
Believe tap water not safe to drink—magnitude of effect greater for those with no aesthetic complaint Have any aesthetic complaint, only for those who belief the tap water is safe to drink Have any aesthetic complaint—magnitude greater if tap water not treated |
| Treat tap water 1 | 1,796 | Use a private water supply Children reside in the home | Believe tap water not safe to drink |
4. Discussion
4.1. Consuming Primarily Bottled Water
4.2. Consuming Tap Water Daily
4.3. Treating Tap Water
4.4. Limitations
5. Conclusions
Acknowledgments
Author Contributions
Conflicts of Interest
References
- Statistics Canada, Government of Canada. Households and the Environment: Analysis. Available online: http://www.statcan.gc.ca/pub/11–526-x/2013001/part-partie1-eng.htm (accessed on 31 July 2013).
- Doria, M.F.; Pidgeon, N.; Hunter, P.R. Perceptions of drinking water quality and risk and its effect on behaviour: A cross-national study. Sci. Total Environ. 2009, 407, 5455–5464. [Google Scholar] [CrossRef]
- Doria, M.F. Bottled water vs. tap water: Understanding consumers’ preferences. J. Water Health 2006, 4, 271–276. [Google Scholar]
- Hu, Z.; Morton, L.W.; Mahler, R.L. Bottled water: United States consumers and their perceptions of water quality. Int. J. Environ. Res. Public. Health 2011, 8, 565–578. [Google Scholar] [CrossRef]
- McSpirit, S.; Reid, C. Residents’ perceptions of tap water and decisions to purchase bottled water: A survey analysis from the appalachian, big sandy coal mining region of west Virginia. Soc. Nat. Resour. 2011, 24, 511–520. [Google Scholar]
- Saylor, A.; Prokopy, L.S.; Amberg, S. What’s wrong with the tap? Examining perceptions of tap water and bottled water at Purdue university. Environ. Manage. 2011, 48, 588–601. [Google Scholar] [CrossRef]
- Merkel, L.; Bicking, C.; Sekhar, D. Parents’ perceptions of water safety and quality. J. Community Health 2012, 37, 195–201. [Google Scholar] [CrossRef]
- Jones, A.; Dewey, C.; Doré, K.; Majowicz, S.; McEwen, S.; Waltner-Toews, D. Drinking water consumption patterns of residents in a Canadian community. J. Water Health 2006, 4, 125–138. [Google Scholar]
- Jones, A.Q.; Majowicz, S.E.; Edge, V.L.; Thomas, M.K.; MacDougall, L.; Fyfe, M.; Atashband, S.; Kovacs, S.J. Drinking water consumption patterns in British Columbia: An investigation of associations with demographic factors and acute gastrointestinal illness. Sci. Total Environ. 2007, 388, 54–65. [Google Scholar] [CrossRef]
- Dupont, D.; Adamowicz, W.L.; Krupnick, A. Differences in water consumption choices in Canada: The role of socio-demographics, experiences, and perceptions of health risks. J. Water Health 2010, 8, 671–686. [Google Scholar] [CrossRef]
- Levallois, P.; Grondin, J.; Gingras, S. Evaluation of consumer attitudes on taste and tap water alternatives in Quebec. Water Sci. Technol. 1999, 40, 135–139. [Google Scholar] [CrossRef]
- Pintar, K.D.M.; Waltner-Toews, D.; Charron, D.; Pollari, F.; Fazil, A.; McEwen, S.A.; Nesbitt, A.; Majowicz, S. Water consumption habits of a south-western Ontario community. J. Water Health 2009, 7, 276–292. [Google Scholar] [CrossRef]
- Corkal, D.; Schutzman, W.C.; Hilliard, C.R. Rural water safety from the source to the on-farm tap. J. Toxicol. Environ. Health Pt A 2004, 67, 1619–1642. [Google Scholar]
- DMTI Platinum Postal Suite Version 2006.4: Saskatchewan Local Delivery Unit Area (LDU) Boundaries. Available online: http://datalib.usask.ca.cyber.usask.ca/gis/Data/DMTI_GIS_isonequinox/dmti/postcode/platinum_postal_suite/v2012.3/ (accessed on 18 August 2011).
- Roche, S.M.; Jones, A.Q.; Majowicz, S.E.; McEwen, S.A.; Pintar, K.D. Drinking water consumption patterns in Canadian communities (2001–2007). J. Water Health 2012, 10, 69–86. [Google Scholar] [CrossRef]
- Rabe-Hesketh, S.; Skrondal, A. Multilevel and Longitudinal Modelling, Using Stata; Stata Press: College Station, TX, USA, 2008. [Google Scholar]
- Browne, W.J.; Subramanian, S.V.; Jones, K.; Goldstein, H. Variance partitioning in multilevel logistic models that exhibit overdispersion. J. Roy. Statist. Soc. Ser. A Stat. 2005, 168, 599–613. [Google Scholar] [CrossRef]
- Statistics Canada. Census of Canada, 2011: Profile of Census Subdivisions (Public-use Microdata File). Available online: http://datacentre2.chass.utoronto.ca.cyber.usask.ca/cgi-bin/census/2011/ (accessed on 19 December 2013).
- Jones, A.Q.; Dewey, C.E.; Doré, K.; Majowicz, S.E.; McEwen, S.A.; David, W.-T.; Eric, M.; Carr, D.J.; Henson, S.J. Public perceptions of drinking water: A postal survey of residents with private water supplies. BMC Public Health 2006, 6, 94–104. [Google Scholar] [CrossRef]
- Auslander, B.A.; Langlois, P.H. Toronto tap water: Perception of its quality and use of alternatives. Can. J. Public Health 1993, 84, 99–102. [Google Scholar]
- Saskatchewan Ministry of Environment. 2010–2011 State of Drinking Water Quality in Saskatchewan. Available online: http://www.saskh2o.ca/PDF/EPB418DrinkingWaterAnnualReport10-11.pdf (accessed on 19 December 2013).
- Dietrich, A.M. Aesthetic issues for drinking water. J. Water Health 2006, 4, 11–16. [Google Scholar]
- Doria, M.F. Factors influencing public perception of drinking water quality. Water Policy 2010, 12, 1–19. [Google Scholar] [CrossRef]
- Jones, A.Q.; Dewey, C.E.; Doré, K.; Majowicz, S.E.; McEwen, S.A.; Waltner-Toews, D.; Henson, S.J.; Mathews, E. A qualitative exploration of the public perception of municipal drinking water. Water Policy 2007, 9, 425–438. [Google Scholar] [CrossRef]
- Health Canada, Government of Canada. Water Treatment Devices for the Removal of Taste, Odour and Chemicals. Available online: http://www.hc-sc.gc.ca/ewh-semt/pubs/water-eau/devices-dispositifs-eng.php (accessed on 26 July 2013).
- Janmaat, J. A little knowledge: Household water quality investment in the Annapolis valley. Can. J. Agr. Econ. 2007, 55, 233–253. [Google Scholar] [CrossRef]
© 2014 by the authors; licensee MDPI, Basel, Switzerland. This article is an open access article distributed under the terms and conditions of the Creative Commons Attribution license (http://creativecommons.org/licenses/by/3.0/).
Share and Cite
McLeod, L.; Bharadwaj, L.; Waldner, C. Risk Factors Associated with the Choice to Drink Bottled Water and Tap Water in Rural Saskatchewan. Int. J. Environ. Res. Public Health 2014, 11, 1626-1646. https://doi.org/10.3390/ijerph110201626
McLeod L, Bharadwaj L, Waldner C. Risk Factors Associated with the Choice to Drink Bottled Water and Tap Water in Rural Saskatchewan. International Journal of Environmental Research and Public Health. 2014; 11(2):1626-1646. https://doi.org/10.3390/ijerph110201626
Chicago/Turabian StyleMcLeod, Lianne, Lalita Bharadwaj, and Cheryl Waldner. 2014. "Risk Factors Associated with the Choice to Drink Bottled Water and Tap Water in Rural Saskatchewan" International Journal of Environmental Research and Public Health 11, no. 2: 1626-1646. https://doi.org/10.3390/ijerph110201626
APA StyleMcLeod, L., Bharadwaj, L., & Waldner, C. (2014). Risk Factors Associated with the Choice to Drink Bottled Water and Tap Water in Rural Saskatchewan. International Journal of Environmental Research and Public Health, 11(2), 1626-1646. https://doi.org/10.3390/ijerph110201626