Relating Built Environment to Physical Activity: Two Failures to Validate

Abstract
:1. Introduction
1.1. Irvine Minnesota Inventory
1.2. Proposed IMI Scales Concerning Physical Activity and Walking (Boarnet et al.)

| Covariate | Current Study | Boarnet et al. |
|---|---|---|
| Age | In Years | In Years |
| Age squared | In years Squared | In Years Squared |
| Children | Dummy Variable = 1 if children < 18 years in household, else 0 | Dummy Variable = 1, if children < 18 years in household, else 0 |
| Married | Dummy variable = 1 if married, else 0 | Dummy variable = 1 if married, else 0 |
| Education | Dummy variable = 1 indicating that the respondent has completed some college/university, college/university degree, or graduate/professional degree, else 0 | Three dummy variables indicating highest level of education (some college, college degree, or graduate/professional degree) |
| Employment | Dummy variable = 1 if currently employed, else 0 | Dummy variable = 1 if currently employed, else 0 |
| Student | Dummy variable = 1 if a student, else 0 | Dummy variable = 1 if a student, else 0 |
| Household Income | Dummy variable = 1, indicating the respondent (and their family) may be in straitened financial circumstances | Household income, indicated by 3 dummy variables for annual income in ranges of US$20,000 to US$50,000, US$50,000 to US$80,000, and more than US$80,000 |
| Race/Ethnicity | Not Collected | Race/ethnicity, indicated by 3 dummy variables for Black, Asian, and Hispanic |
| Drive to work | Not Collected | Dummy variable indicating whether respondent drives to work |
| Vehicle | Not Collected | Dummy variable = 1, if vehicle is available to respondent |
| Dog | Not Collected | Dummy variable = 1, if dog owner |
1.3. Proposed IMI Scales Concerning Walkability in the Context of Light Rail Transit Use (Werner et al.)
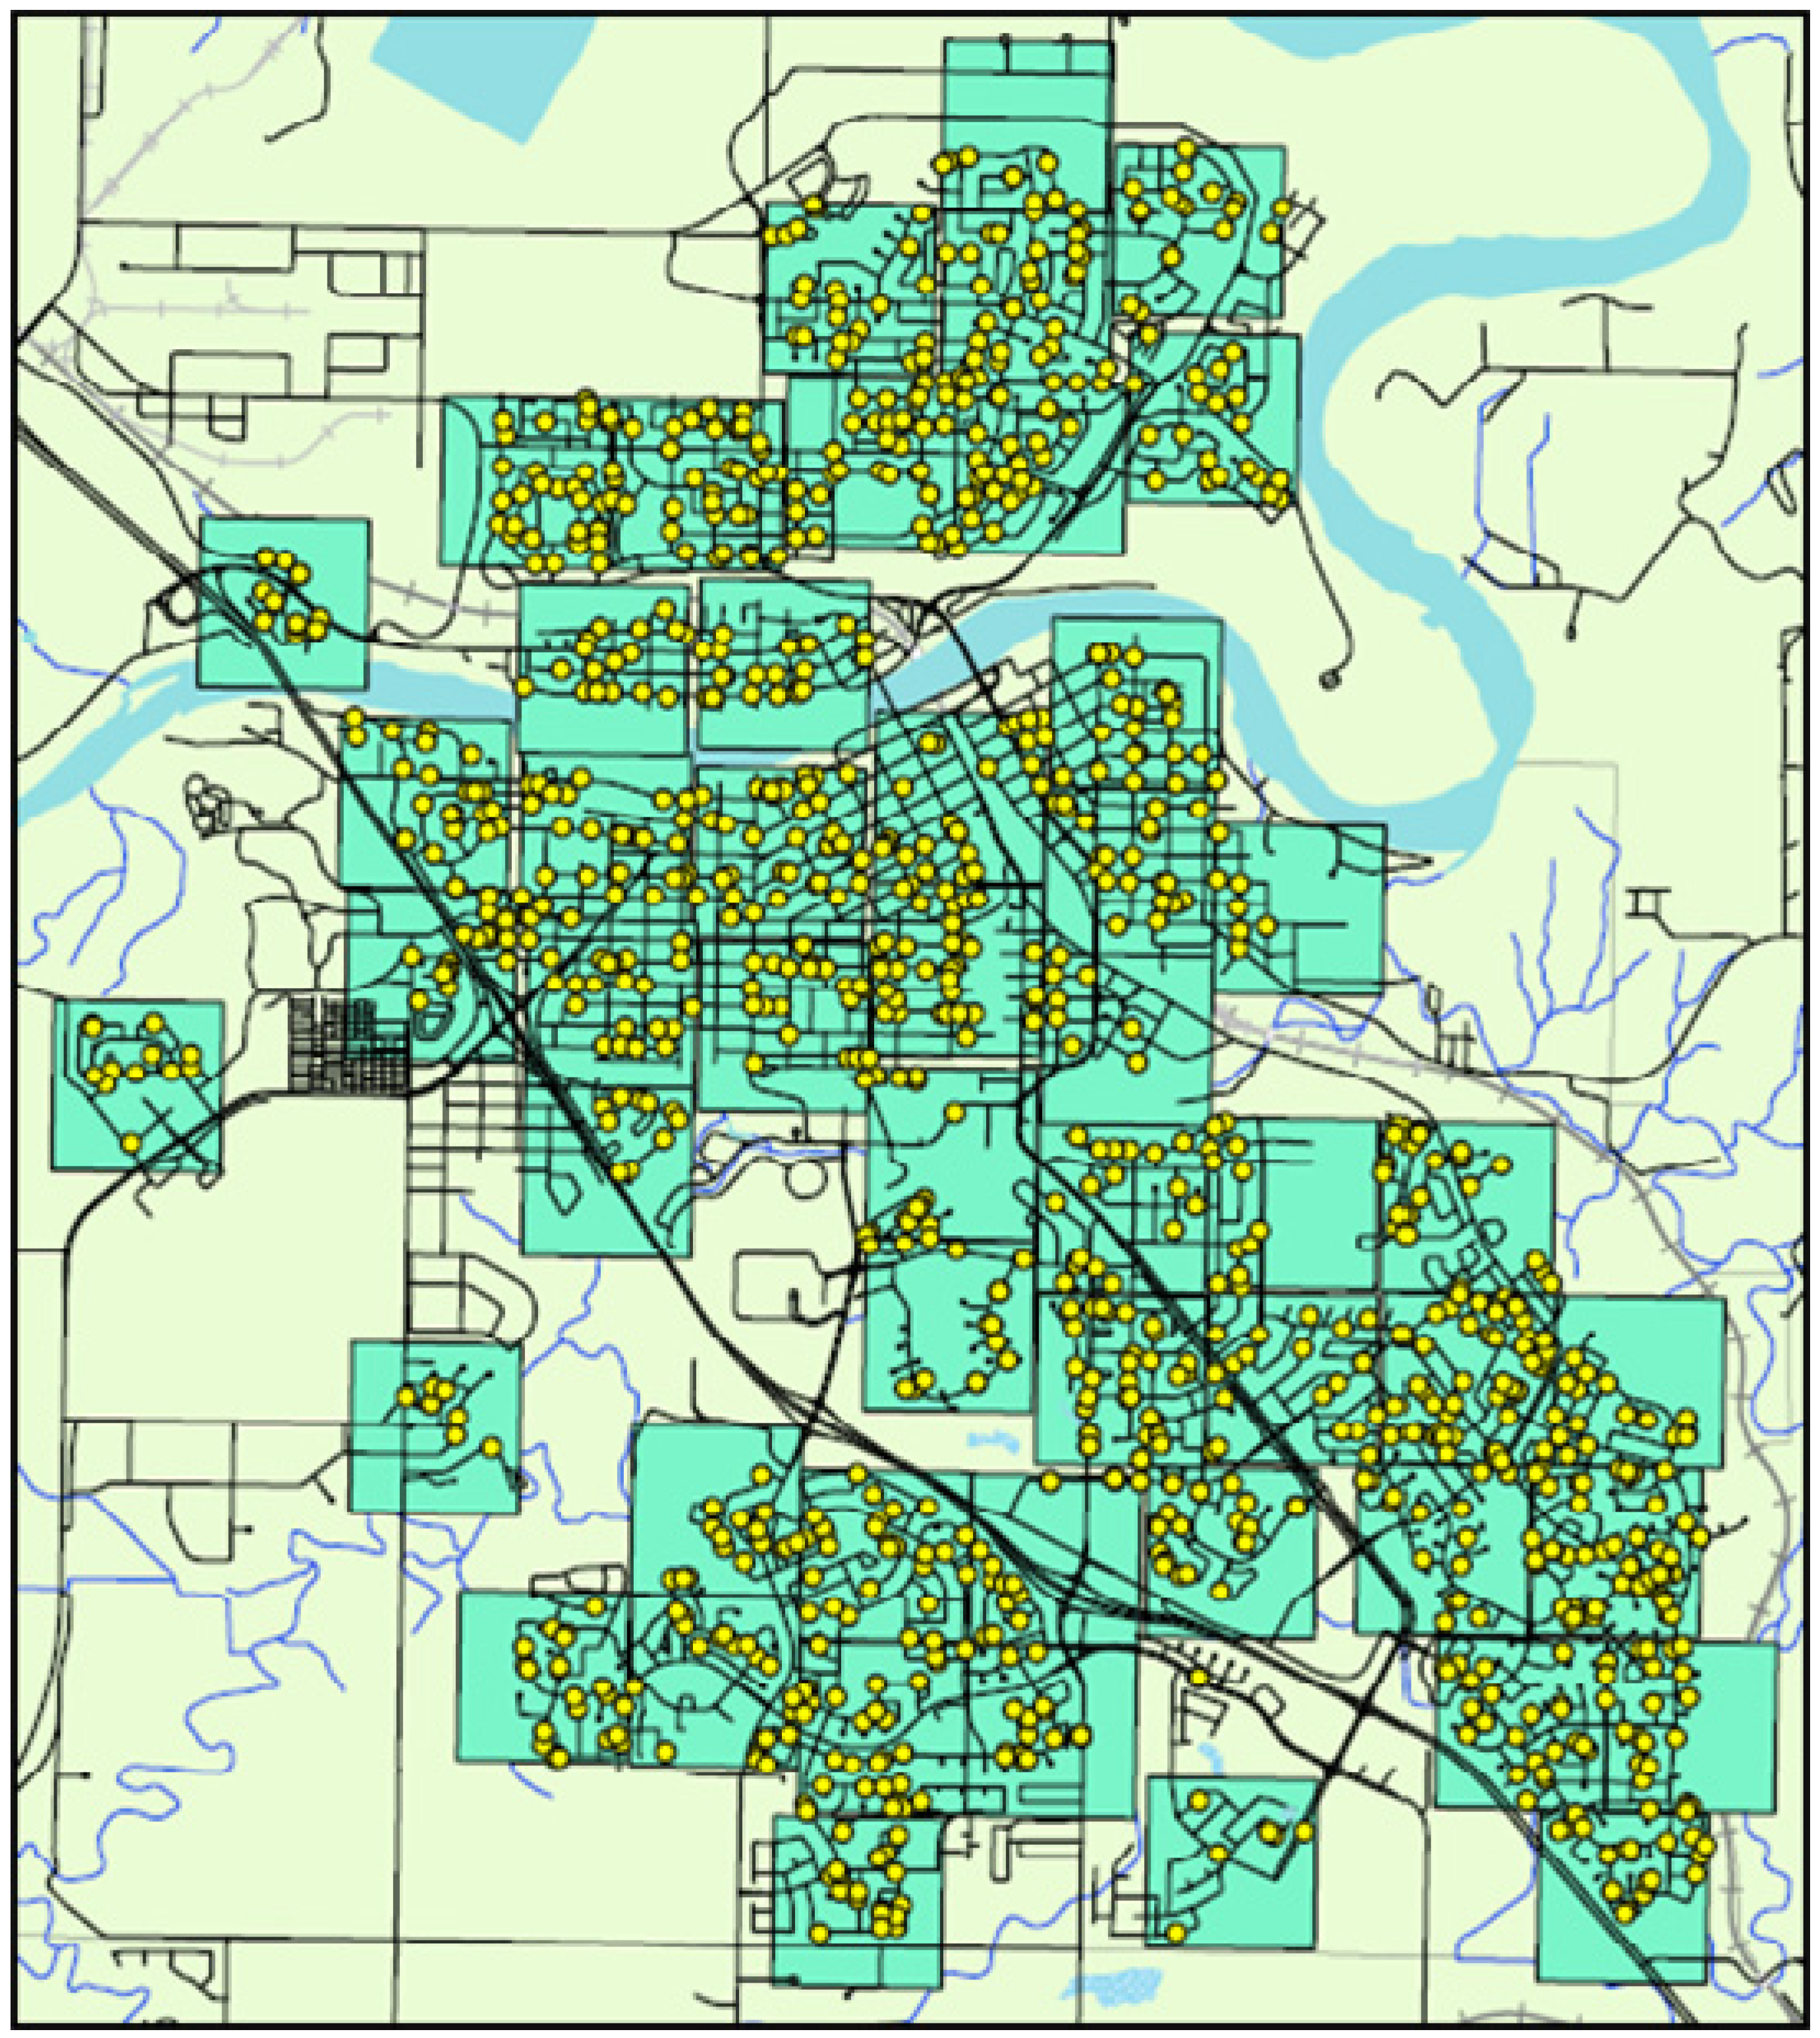
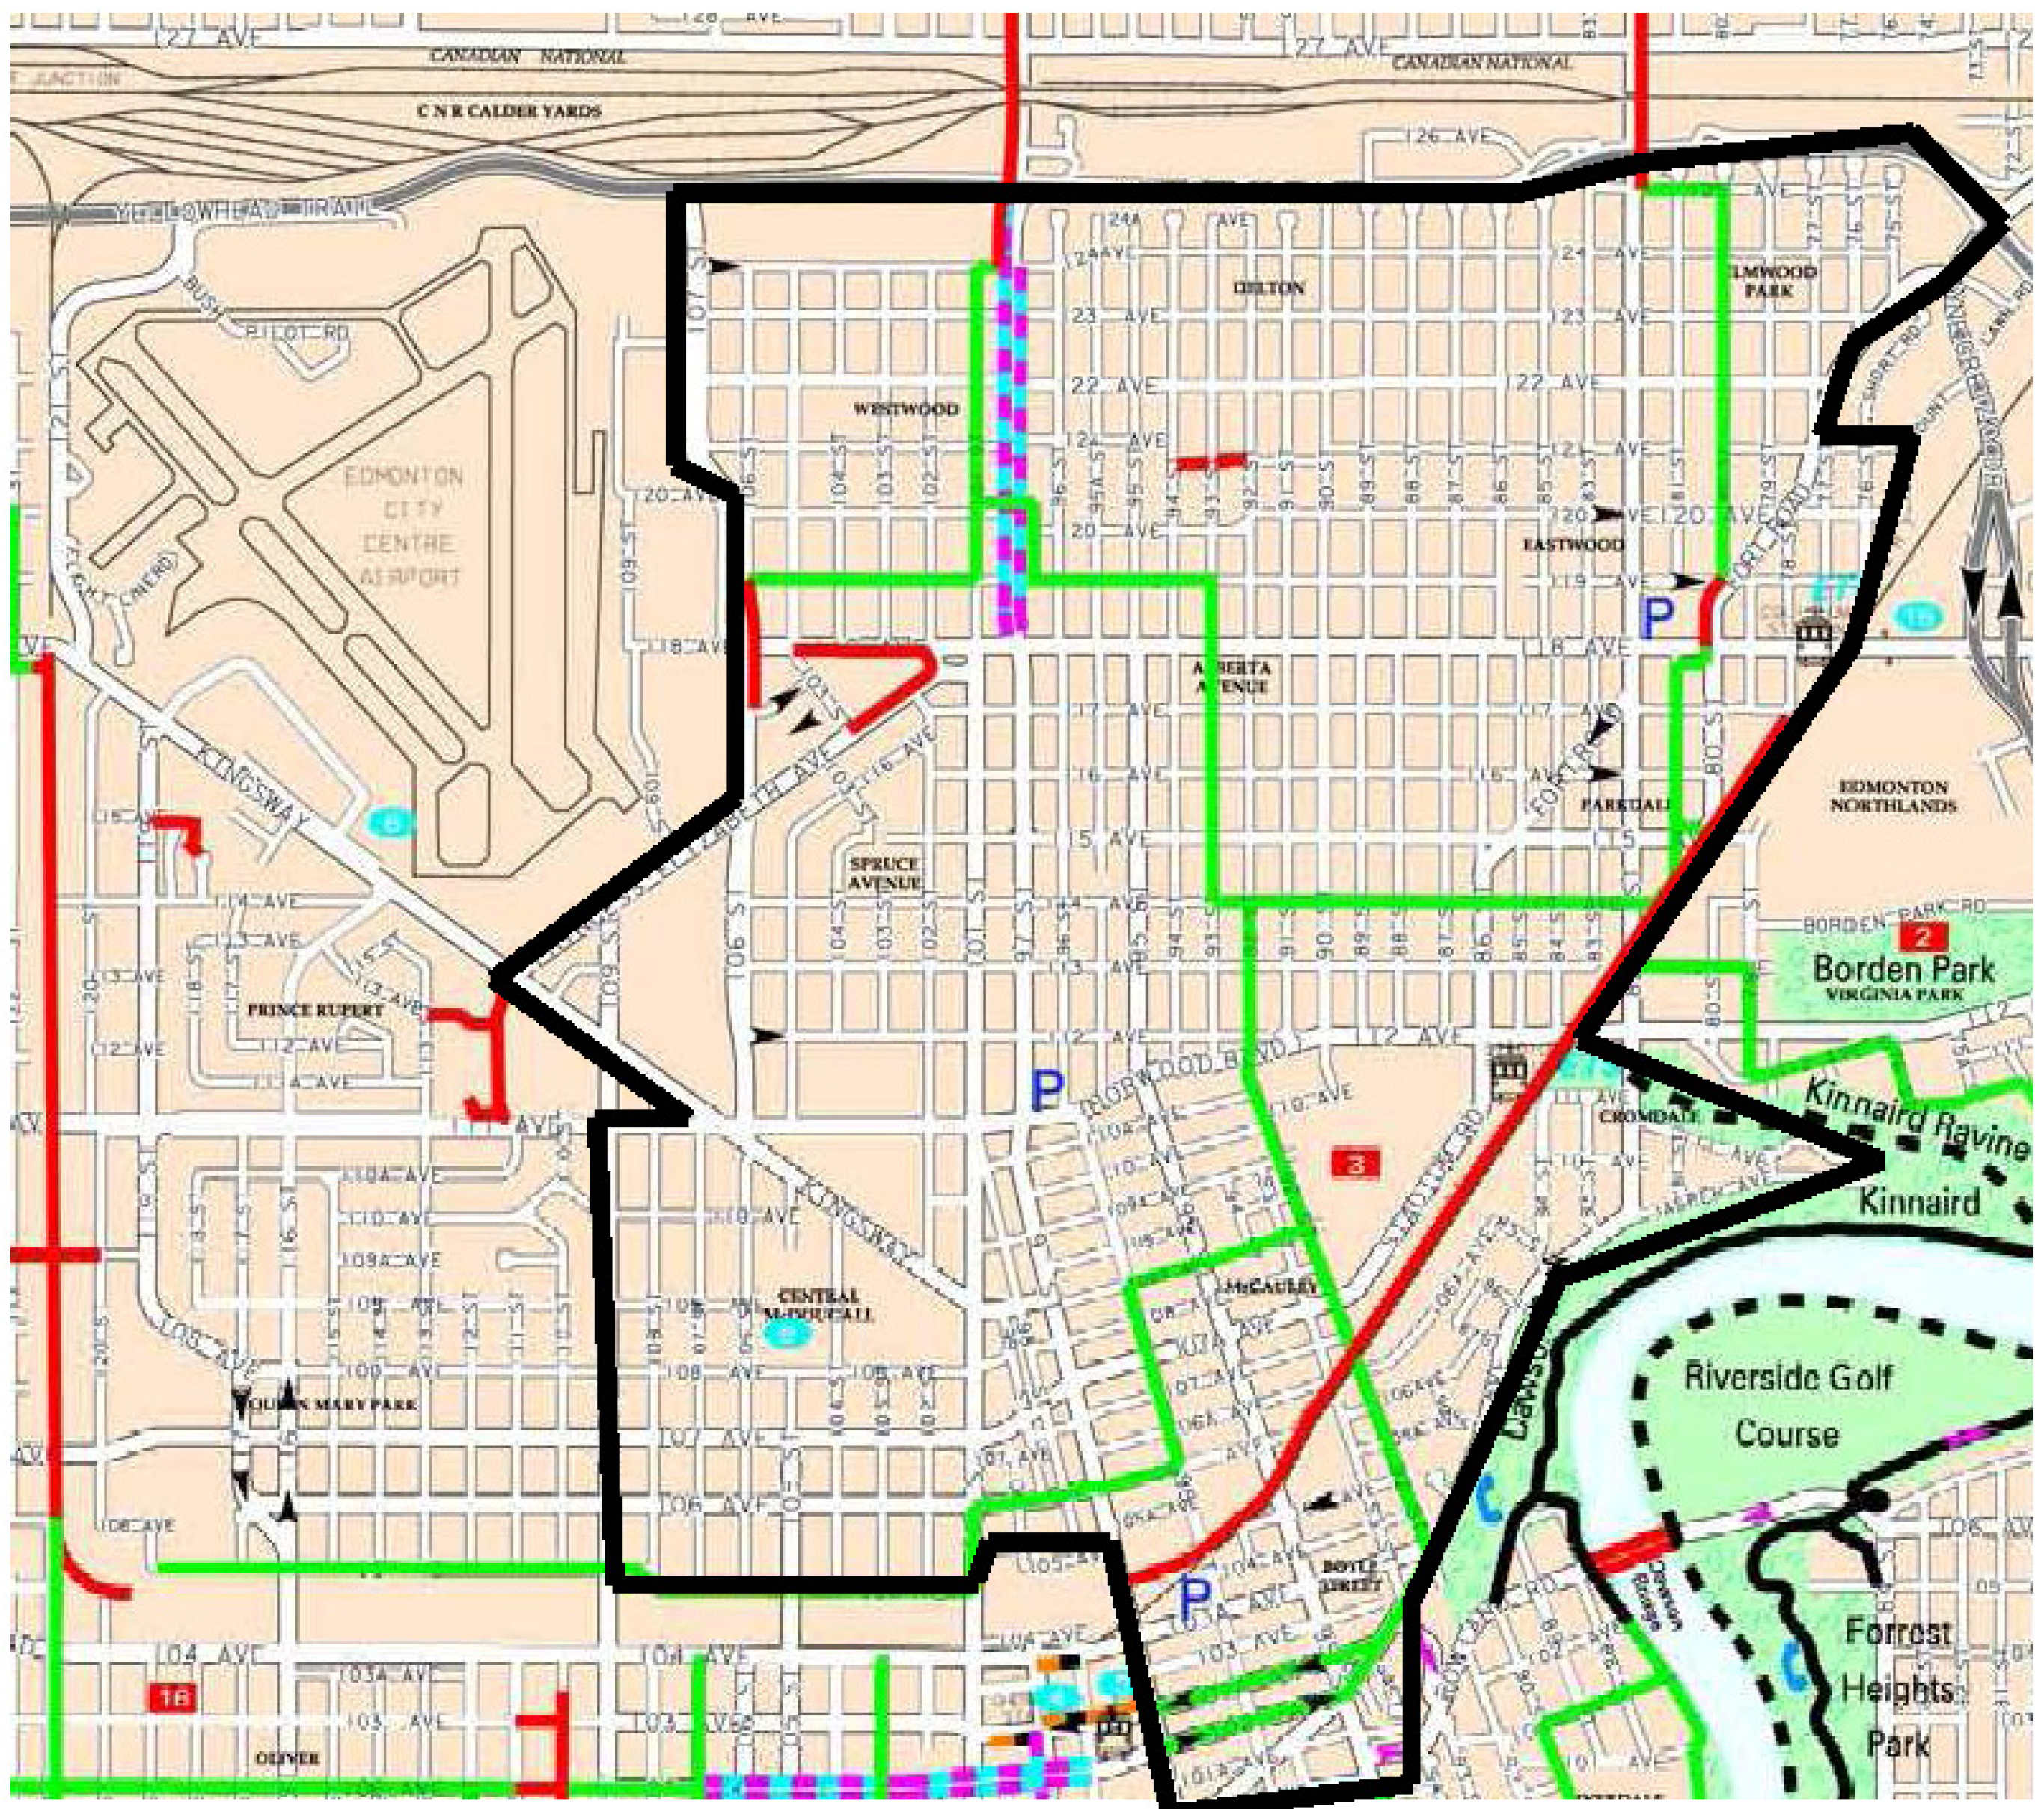
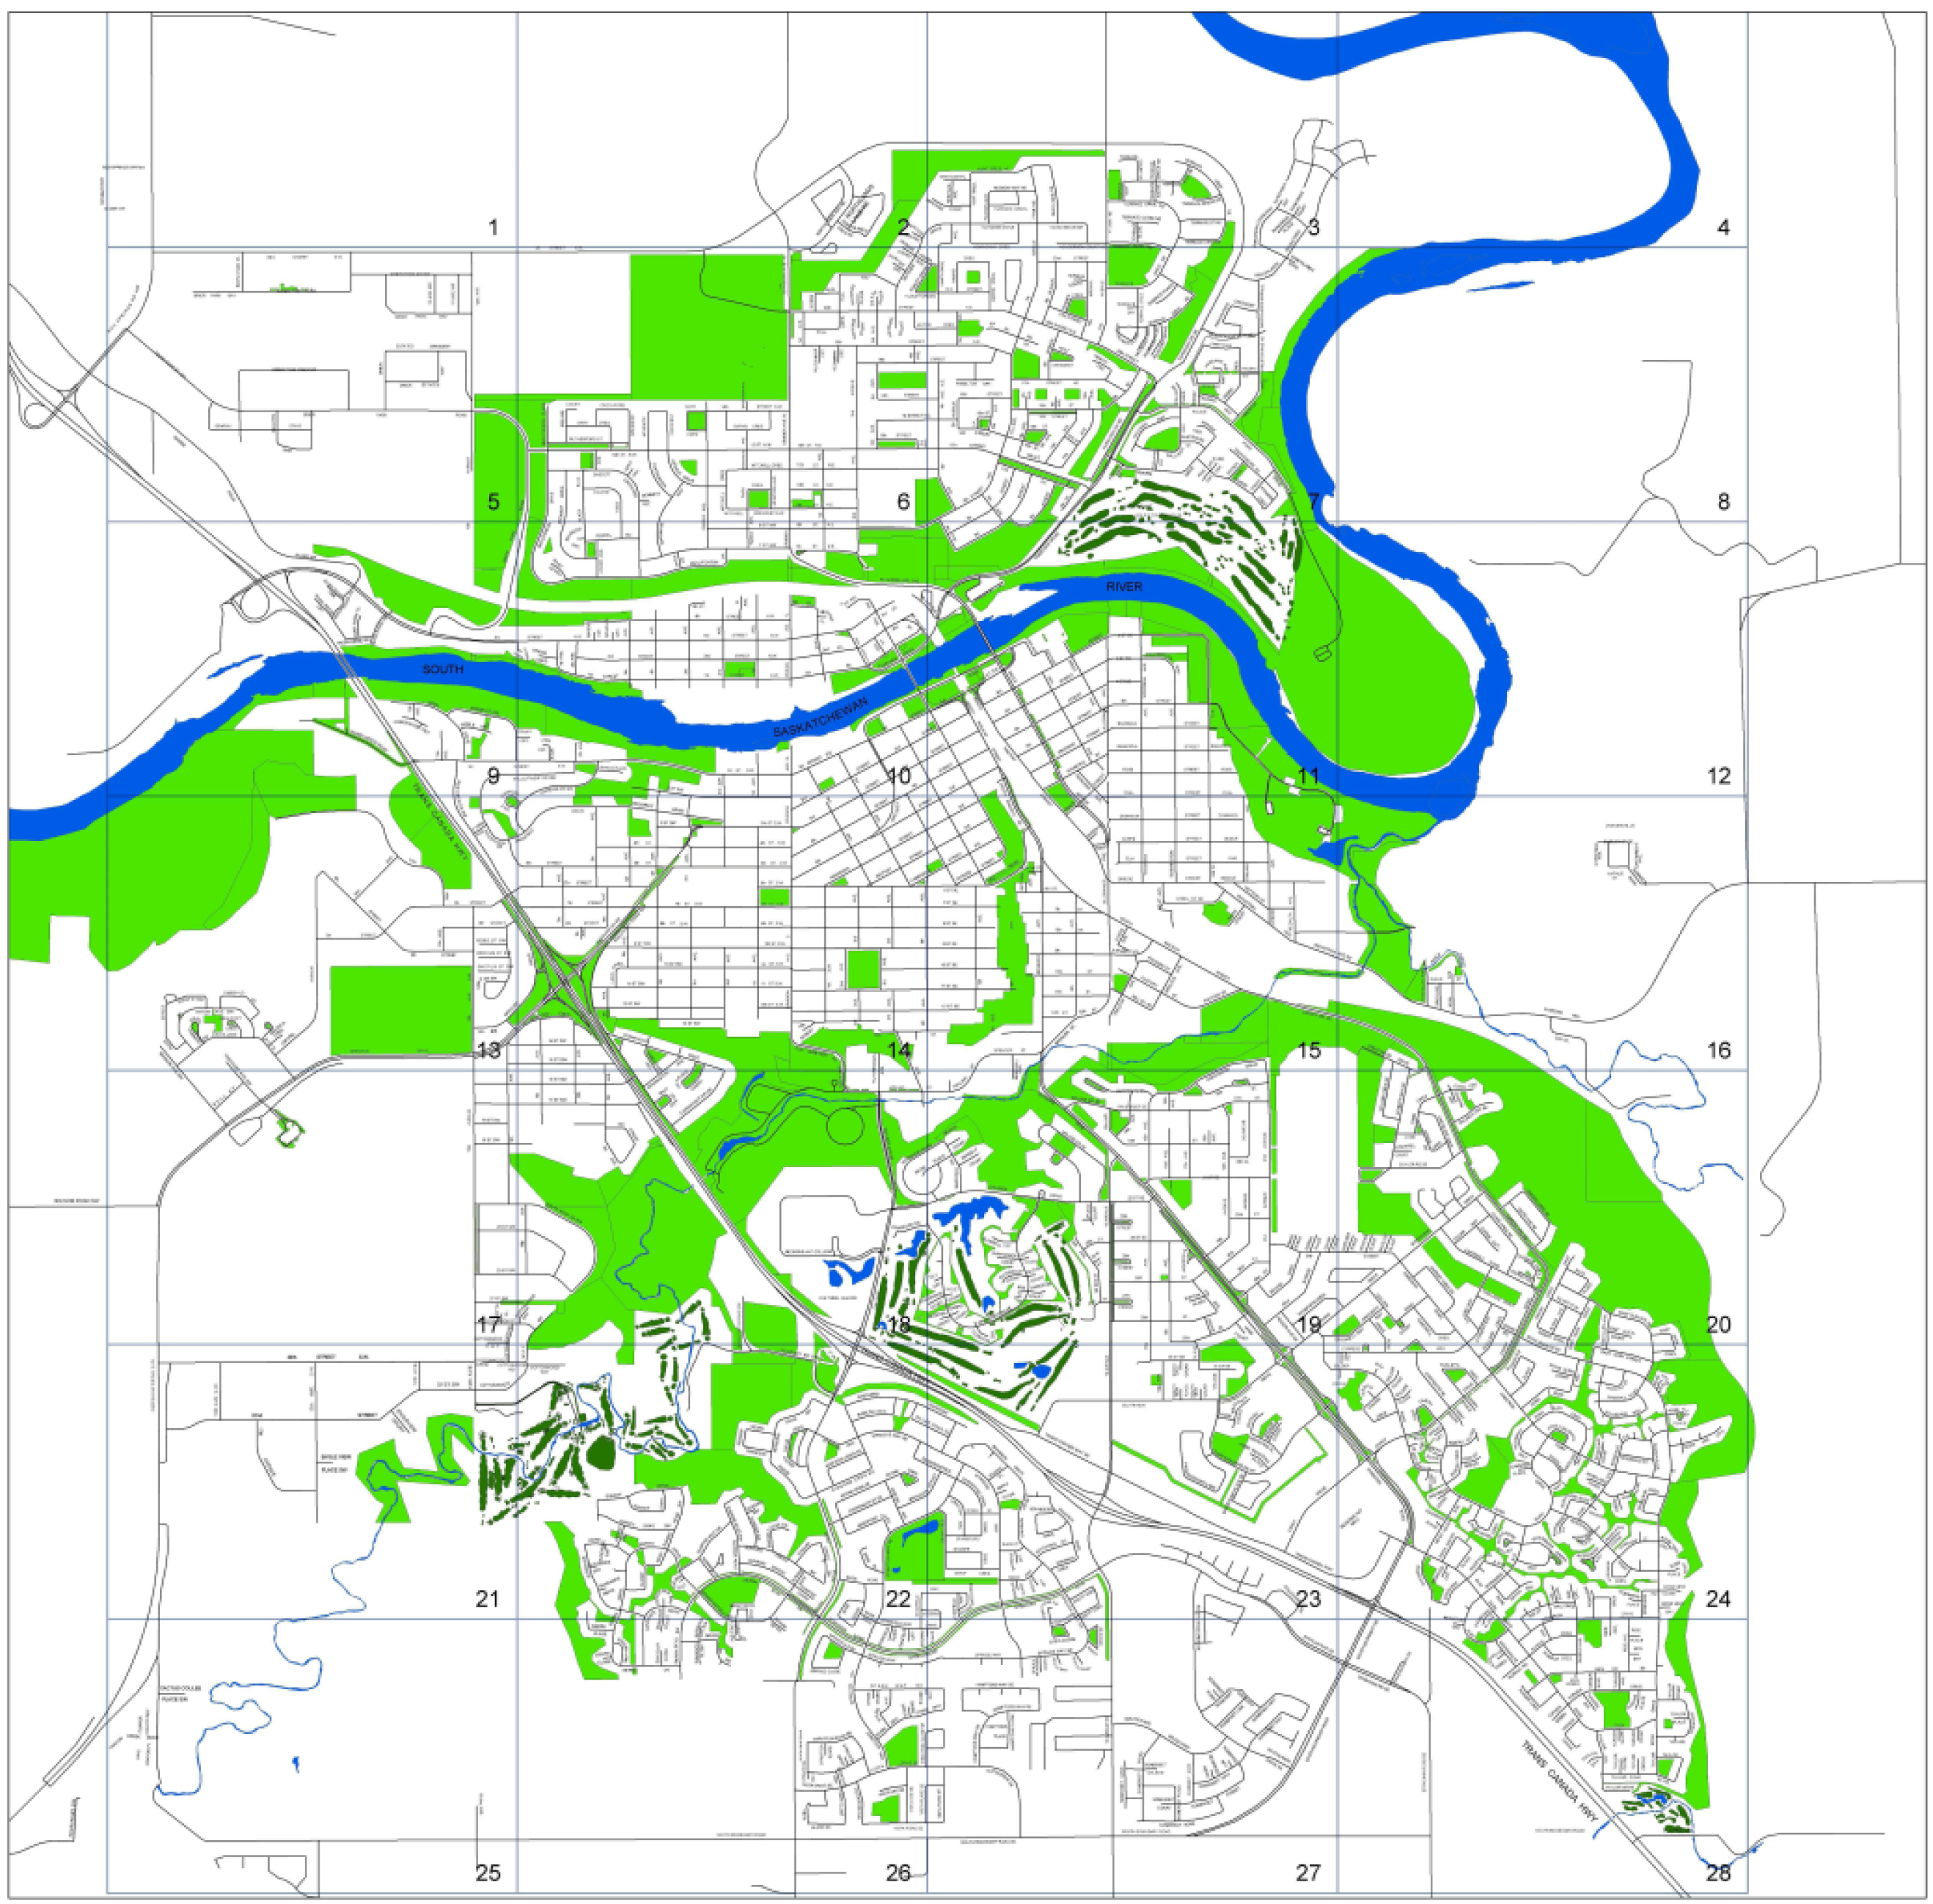
1.4. Community Health and the Built Environment (CHBE) Project
2. Experimental Section
2.1. Built Environment Measurement
2.2. Health Survey Data
2.3. Statistical Analysis
2.4. Repeating Proposed IMI Scales Concerning Physical Activity and Walking (Boarnet et al.)

2.5. Generalizing Proposed IMI scales Concerning Walkability in the Context of Light Rail Transit Use (Werner et al.)
3. Results
3.1. Results of Repeating Proposed IMI Scales Concerning Physical Activity and Walking (Boarnet et al.)
| Boarnet-Derived Scales | CHBE Setting | HAC Outcome Measure * | ||
|---|---|---|---|---|
| Total Walking | Walking For Leisure | Walking for Travel | ||
| “To Predict Total Walking” | Medicine Hat | 0.160 | 0.097 | 0.135 |
| North Central Edmonton | 0.099 | −0.17 | 0.123 | |
| “To Predict Walking for Leisure” | Medicine Hat | 0.043 | 0.112 | −0.008 |
| North Central Edmonton | 0.170 | 0.263 | 0.149 | |
| “To Predict Walking for Travel” | Medicine Hat | −0.071 | −0.110 | −0.072 |
| North Central Edmonton | −0.128 | −0.110 | −0.101 | |
| Boarnet-Derived Scales | CHBE Setting | Scale Reliability (Cronbach’s alpha) |
|---|---|---|
| “To Predict Total Walking” | Medicine Hat | 0.608 |
| North Central Edmonton | <0.00 | |
| “To Predict Walking for Leisure” | Medicine Hat | 0.246 |
| North Central Edmonton | 0.489 | |
| “To Predict Walking for Travel” | Medicine Hat | 0.255 |
| North Central Edmonton | <0.00 |
| IMI Moderate Scale | Boarnet et al. Results | CHBE/HAC Results In Two Settings | |
|---|---|---|---|
| Number of variables in scale (p < 0.1) | Setting | Number of Variables in Scale Demonstrating Significance (p < 0.1) | |
| Total Walking | 14 | Medicine Hat | 3 |
| North Central Edmonton | 0 | ||
| Walking for Leisure | 11 | Medicine Hat | 1 |
| North Central Edmonton | 1 | ||
| Walking for Travel | 17 | Medicine Hat | 0 |
| North Central Edmonton | 0 | ||
| CHBE/HAC Scales | CHBE Setting | Number of Variables in Scale | Variables with p < 0.05 | Variables with p < 0.1 | Number of Common Variables |
|---|---|---|---|---|---|
| Total Walking | Medicine Hat | 40 | 30 | 10 | 3 |
| North Central Edmonton | 11 | 2 | 9 | ||
| Walking for Leisure | Medicine Hat | 57 | 44 | 13 | 4 |
| North Central Edmonton | 13 | 4 | 9 | ||
| Walking for Travel | Medicine Hat | 18 | 8 | 10 | 3 |
| North Central Edmonton | 17 | 8 | 9 |
3.2. Results of Generalizing Proposed IMI Scales Concerning Walkability in the Context of Light Rail Transit Use (Werner et al.)
| Medicine Hat (standardized beta coefficients) | North Central Edmonton (standardized beta coefficients) | Werner | |||||
|---|---|---|---|---|---|---|---|
| Total Walking | Walking for Leisure | Walking for Travel | Total Walking | Walking for Leisure | Walking for Travel | LRT Usage | |
| Diversity | 0.048 | 0.034 | 0.038 | −0.081 | −0.002 | −0.085 | * |
| Density | −0.030 | −0.012 | −0.033 | −0.050 | −0.047 | −0.035 | ** |
| Pedestrian Accessibility | −0.029 | 0.002 | −0.031 | 0.038 | −0.050 | 0.068 ** | |
| Crime Safety | −0.031 | 0.033 | −0.040 | −0.095 * | −0.008 | −0.101 * | * |
| Traffic Safety | −0.003 | 0.057 ** | −0.023 | 0.025 | 0.012 | 0.022 | |
| Attractiveness | 0.015 | 0.062 * | −0.004 | −0.017 | −0.065 | 0.009 | |
| Age | −0.209 | 0.327 ** | −0.374 * | 0.096 | 0.410 ** | −0.064 | |
| Age-squared | 0.146 | −0.349 * | 0.318 ** | −0.191 | −0.380 | −0.061 | |
| Gender | −0.057 ** | −0.031 | −0.058 ** | −0.063 | −0.022 | −0.067 ** | |
| Higher Education | 0.029 | 0.002 | 0.030 | 0.032 | −0.030 | 0.045 | |
| R-squared | 0.015 ** | 0.016 ** | 0.016 ** | 0.030 ** | 0.017 | 0.040 * | |
| Werner-Derived Scales | CHBE Setting | Scale Internal Consistency (Cronbach’s alpha) |
|---|---|---|
| Diversity | Medicine Hat | 0.75 |
| North Central Edmonton | 0.51 | |
| Density | Medicine Hat | <0.00 |
| North Central Edmonton | <0.00 | |
| Pedestrian Accessibility | Medicine Hat | 0.23 |
| North Central Edmonton | 0.37 | |
| Crime Safety | Medicine Hat | 0.35 |
| North Central Edmonton | 0.50 | |
| Traffic Safety | Medicine Hat | 0.61 |
| North Central Edmonton | 0.48 | |
| Attractive | Medicine Hat | 0.43 |
| North Central Edmonton | 0.53 |
4. Discussion
Strengths and Limitations
5. Conclusions
Acknowledgments
Conflicts of Interest
References
- Finucane, M.M.; Stevens, G.A.; Cowan, M.J.; Danaei, G.; Lin, J.K.; Paciorek, C.J.; Singh, G.M.; Gutierrez, H.R.; Lu, Y.; Bahalim, A.N.; et al. National, regional, and global trends in body-mass index since 1980: Systematic analysis of health examination surveys and epidemiological studies with 960 country-years and 9.1 million participants. Lancet 2011, 377, 557–567. [Google Scholar] [CrossRef]
- Swinburn, B.A.; Sacks, G.; Hall, K.D.; McPherson, K.; Finegood, D.T.; Moodie, M.L.; Gortmaker, S.L. The global obesity pandemic: Shaped by global drivers and local environments. Lancet 2011, 378, 804–814. [Google Scholar] [CrossRef]
- Raine, K.D. Obesity and Overweight in Canada: A Population Health Perspective; Canadian Institute for Health Information: Ottawa, ON, Canada, 2004. [Google Scholar]
- World Health Organization: Integrated Chronic Disease Prevention and Control. World Health Organization. Available online: http://www.who.int/chp/about/integrated_cd/en/ (accessed on 2 February 2013).
- Egger, G.; Swinburn, B. An ecological approach to the obesity pandemic. BMJ 1997, 315, 477–480. [Google Scholar] [CrossRef]
- Frank, L.; Kavage, S. A national plan for physical activity: The enabling role of the built environment. J. Phys. Act. Health 2009, 6, S186–S195. [Google Scholar]
- Heath, G.W.; Brownson, R.C.; Kruger, J.; Miles, R.; Powell, K.E.; Ramsey, L.T. The effectiveness of urban design and land use and transport policies and practices to increase physical activity: A systematic review. J. Phys. Act. Health 2006, 3, S55–S76. [Google Scholar]
- Adams, M.A.; Sallis, J.F.; Kerr, J.; Conway, T.L.; Saelens, B.E.; Frank, L.D.; Norman, G.J.; Cain, K.L. Neighborhood environment profiles related to physical activity and weight status: A latent profile analysis. Prev. Med. 2011, 52, 326–331. [Google Scholar] [CrossRef]
- Garden, F.L.; Jalaludin, B.B. Impact of urban sprawl on overweight, obesity, and physical activity in Sydney, Australia. J. Urban Health 2008, 86, 19–30. [Google Scholar] [CrossRef]
- Hoehner, C.M.; Handy, S.L.; Yan, Y.; Blair, S.N.; Berrigan, D. Association between neighborhood walkability, cardiorespiratory fitness and body-mass index. Soc. Sci. Med. 2011, 73, 1707–1716. [Google Scholar] [CrossRef]
- Joshu, C.E.; Boehmer, T.K.; Brownson, R.C.; Ewing, R. Personal, neighbourhood and urban factors associated with obesity in the United States. J. Epidemiol. Community Health 2008, 62, 202–208. [Google Scholar] [CrossRef]
- Frank, L.D.; Saelens, B.E.; Powell, K.E.; Chapman, J.E. Stepping towards causation: Do built environments or neighborhood and travel preferences explain physical activity, driving, and obesity? So. Sci. Med. 2007, 65, 1898–1914. [Google Scholar] [CrossRef]
- Ding, D.; Sallis, J.F.; Kerr, J.; Lee, S.; Rosenberg, D.E. Neighborhood environment and physical activity among youth: A review. Am. J. Prev. Med. 2011, 41, 442–455. [Google Scholar] [CrossRef]
- Feng, J.; Glass, G.A.; Curriero, F.C.; Stewart, W.F.; Schwartz, B.S. The built environment and obesity: A systematic review of the epidemiologic evidence. Health Place 2010, 16, 175–190. [Google Scholar] [CrossRef]
- Brownson, R.C.; Hoehner, C.M.; Day, K.; Forsyth, A.; Sallis, J.F. Measuring the built environment for physical activity state of science. Am. J. Prev. Med. 2009, 36, 99–123. [Google Scholar] [CrossRef]
- Wendel-Vos, W.; Droomers, M.; Kremers, S.; Brug, J.; van Lenthe, F. Potential environmental determinants of physical activity in adults: A systematic review. Obes. Rev. 2007, 8, 425–440. [Google Scholar] [CrossRef]
- Deehr, R.C.; Shumann, A. Active Seattle: Achieving walkability in diverse neighborhoods. Am. J. Prev. Med. 2009, 37, S403–S411. [Google Scholar] [CrossRef]
- Bors, P.A.; Brownson, R.C.; Brennan, L.K. Assessment for active living: Harnessing the power of data-driven planning and action. Am. J. Prev. Med. 2012, 43, S300–S308. [Google Scholar] [CrossRef]
- Evenson, K.R.; Sallis, J.F.; Handy, S.L.; Bell, R.; Brennan, L.K. Evaluation of physical projects and policies from the active living by design partnerships. Am. J. Prev. Med. 2012, 43, S309–S319. [Google Scholar] [CrossRef]
- Day, K.; Boarnet, M.; Alfonzo, M.; Forsyth, A. The Irvine-Minnesota inventory to measure built environments: Development. Am. J. Prev. Med. 2006, 30, 144–152. [Google Scholar] [CrossRef]
- Boarnet, M.G.; Day, K.; Alfonzo, M.; Forsyth, A.; Oakes, M. The Irvine-Minnesota inventory to measure built environments: Reliability tests. Am. J. Prev. Med. 2006, 30, 155–159. [Google Scholar]
- Boarnet, M.G.; Forsyth, A.; Day, K.; Oakes, J.M. The street level built environment and physical activity and walking: Results of a predictive validity study for the Irvine Minnesota Inventory. Environ. Behav. 2011, 43, 735–775. [Google Scholar] [CrossRef]
- Oakes, J.M.; Forsyth, A.; Hearst, M.O.; Schmitz, K.H. Recruiting participants for neighbourhood effects research: Strategies and outcomes of the Twin Cities Walking Study. Environ. Behav. 2009, 41, 787–805. [Google Scholar] [CrossRef]
- Ioannidis, J.P. Why most published research findings are false. PLoS Med. 2005, 2, e124. [Google Scholar] [CrossRef]
- Dickersin, K.; Min, Y.I. Publication bias: The problem that won’t go away. Ann. N. Y. Acad. Sci. 2006, 703, 135–148. [Google Scholar] [CrossRef]
- Dwan, K.; Altman, D.G.; Arnaiz, J.A.; Bloom, J.; Chan, A.W.; Cronin, E.; Decullier, E.; Easterbrook, P.J.; von Elm, E.; Gamble, C.; et al. Systematic review of the empirical evidence of study publication bias and outcome reporting bias. PLoS One 2008, 3, e3081:1–e3081:31. [Google Scholar]
- Roediger, H.L. Psychology’s woes and a partial cure: The value of replication. APS Obs. 2012, 25, 2:1–2:3. [Google Scholar]
- Craig, C.L.; Marshall, A.L.; Sjostrom, M.; Bauman, A.E.; Booth, M.L.; Ainsworth, B.E.; Pratt, M.; Ekelund, U.; Yngve, A.; Sallis, J.F.; et al. International physical activity questionnaire: 12-country reliability and validity. Med. Sci. Sports Exerc. 2003, 35, 1381–1395. [Google Scholar] [CrossRef]
- Werner, C.N.; Brown, B.B.; Gallimore, J. Light rail use is more likely on “walkable” blocks: Further support for using micro-level environmental audit measures. J. Environ. Psychol. 2010, 30, 206–214. [Google Scholar] [CrossRef]
- Nykiforuk, C.I.J.; Schopflocher, D.; Vallianatos, H.; Spence, J.C.; Raine, K.D.; Plotnikoff, R.C.; Vanspronsen, E.; Nieuwendyk, L. Community health and the built environment: Examining place in a Canadian chronic disease prevention project. Health Promot. Int. 2013, 28, 257–268. [Google Scholar] [CrossRef]
- Raine, K.D.; Plotnikoff, R.; Nykiforuk, C.; Deegan, H.; Hemphill, E.; Storey, K.; Schopflocher, D.; Veugelers, P.; Wild, T.C.; Ohinmaa, A. Reflections on community-based population health intervention and evaluation for obesity and chronic disease prevention: The healthy Alberta communities project. Int. J. Public Health 2010, 55, 679–686. [Google Scholar] [CrossRef]
- Pikora, T.J.; Bull, F.C.L.; Jamrozik, K.; Knuiman, M.; Giles-Corti, B.; Donovan, R.J. Developing a reliable audit instrument to measure the physical environment for physical activity. Am. J. Prev. Med. 2002, 23, 187–194. [Google Scholar]
- Clifton, K.J.; Smith, A.D.L.; Rodriguez, D. The development and testing of an audit for the pedestrian environment. Landsc. Urban Plan. 2007, 80, 95–110. [Google Scholar] [CrossRef]
- The City of Edmonton. 2009 Municipal Census Results. 2009. Available online: http://www.edmonton.ca/city_government/2009-municipal-census-results.aspx (accessed on 2 February 2013).
- City of Medicine Hat. City of Medicine Hat 2009 Census Final Report. 2009. Available online: http://www.medicinehat.ca/modules/showdocument.aspx?documentid=276 (accessed on 16 September 2013).
- Statistics Canada. Canadian Community Health Survey (CCHS) Cycle 3.1 (2005) Public Use Microdata File (PUMF) User Guide. 2006. Available online: http://www23.statcan.gc.ca:81/imdb-bmdi/pub/document/3226_D7_T9_V3-eng.pdf (accessed on 2 February 2013).
- Statistics Canada. Canadian Community Health Survey (CCHS) Cycle 3.1 (2005) Public Use Microdata File (PUMF) Integrated Derived Variable and Grouped Variable Specifications. 2006. Available online: http://www23.statcan.gc.ca:81/imdb-bmdi/pub/document/3226_D7_T9_V3-eng.pdf (accessed on 2 February 2013).
- Cronbach, L.J. Coefficient alpha and the internal structure of tests. Psychometrika 1951, 16, 297–334. [Google Scholar] [CrossRef]
- Kline, P. The Handbook of Psychological Testing, 2nd ed.; Routledge: New York, NY, USA, 1999. [Google Scholar]
- Aguinis, H.; Harden, E.E. Sample Size Rules of Thumb: Evaluating Three Common Practices. In Statistical and Methodological Myths and Urban Legends: Doctrine, Verity and Fable in Organizational and Social Science; Lance, C.E., Vandenberg, R.J., Eds.; Routledge: New York, NY, USA, 2008. [Google Scholar]
- VanVoorhis, C.R.W.; Morgan, B.L. Understanding power and rules of thumb for determining sample sizes. Tutor. Quant. Methods Psychol. 2007, 3, 43–50. [Google Scholar]
- Curran-Everett, D. Multiple comparisons: Philosophies and illustrations. Am. J. Physiol. Regul. Integr. Comp. Physiol. 2000, 279, R1–R8. [Google Scholar]
- Nunnally, J.; Bernstein, I. Psychometric Theory, 3rd ed.; McGraw-Hill: New York, NY, USA, 1994. [Google Scholar]
© 2014 by the authors; licensee MDPI, Basel, Switzerland. This article is an open access article distributed under the terms and conditions of the Creative Commons Attribution license (http://creativecommons.org/licenses/by/3.0/).
Share and Cite
Schopflocher, D.; VanSpronsen, E.; Nykiforuk, C.I.J. Relating Built Environment to Physical Activity: Two Failures to Validate. Int. J. Environ. Res. Public Health 2014, 11, 1233-1249. https://doi.org/10.3390/ijerph110201233
Schopflocher D, VanSpronsen E, Nykiforuk CIJ. Relating Built Environment to Physical Activity: Two Failures to Validate. International Journal of Environmental Research and Public Health. 2014; 11(2):1233-1249. https://doi.org/10.3390/ijerph110201233
Chicago/Turabian StyleSchopflocher, Donald, Eric VanSpronsen, and Candace I. J. Nykiforuk. 2014. "Relating Built Environment to Physical Activity: Two Failures to Validate" International Journal of Environmental Research and Public Health 11, no. 2: 1233-1249. https://doi.org/10.3390/ijerph110201233
APA StyleSchopflocher, D., VanSpronsen, E., & Nykiforuk, C. I. J. (2014). Relating Built Environment to Physical Activity: Two Failures to Validate. International Journal of Environmental Research and Public Health, 11(2), 1233-1249. https://doi.org/10.3390/ijerph110201233