Symptoms and Health Complaints and Their Association with Perceived Stressors among Students at Nine Libyan Universities


Abstract
:1. Introduction
Aim of the Study
- Describe the sample’s general characteristics;
- Assess the prevalence of eight symptoms, and the number of symptoms reported in the last 12 months;
- Assess the association between the frequency of the four most prevalent symptoms and students’ demographic characteristics and health behaviours; and
- Explore the frequency of symptoms by extent of perceived stressors (burdens); and the association between the four most prevalent symptoms and perceived stressors while controlling for all other symptom groups.
2. Materials and Methods
2.1. Sample, Data Collection and Ethics
2.2. Health and Wellbeing Measures and Variables
2.3. Statistical Analysis
3. Results
3.1. General Characteristics

| Variable | Characteristic | All Students N = 1300 | Males N = 439 | Females N = 861 | p |
|---|---|---|---|---|---|
| Stressors | |||||
| Burdens (exams) | Less burdened | 573 (44.1) | 243 (55.4) | 330 (38.3) | <0.001 |
| Strongly/Very strongly | 727 (55.9) | 196 (44.6) | 531 (61.7) | ||
| Burdens (overall) | Less burdened | 972 (74.8) | 338 (77.0) | 634 (73.6) | 0.187 |
| Strongly/Very strongly | 328 (25.2) | 101 (23.0) | 227 (26.4) | ||
| Socio-demographic | |||||
| Age (years) | <20 | 360 (27.7) | 109 (24.8) | 251 (29.2) | |
| 20–24 | 848 (65.2) | 288 (65.6) | 560 (65.0) | 0.020 | |
| ≥25 | 92 (7.1) | 42 (9.6) | 50 (5.8) | ||
| Marital status | Married | 45 (3.5) | 5 (1.1) | 40 (4.6) | 0.001 |
| Single | 1255 (96.5) | 434 (98.9) | 821 (95.4) | ||
| Year of study | 1st | 431 (33.2) | 187 (42.6) | 244 (28.3) | <0.001 |
| 2nd | 356 (27.4) | 86 (19.6) | 270 (31.4) | ||
| 3rd | 319 (24.5) | 82 (18.7) | 237 (27.5) | ||
| ≥4th | 194 (14.9) | 84 (19.1) | 110 (12.8) | ||
| Living with parent | Yes | 1062 (81.7) | 322 (73.3) | 121 (14.1) | |
| No | 238 (18.3) | 117 (26.7) | 740 (85.9) | <0.001 | |
| Income sufficiency | Always/Mostly sufficient | 948 (72.9) | 285 (64.9) | 663 (77.0) | <0.001 |
| Mostly/Always insufficient | 352 (27.1) | 154 (35.1) | 198 (23.9) | ||
| Health behaviours/Lifestyle | |||||
| Smoking | Daily | 63 (4.8) | 63 (14.4) | 0 | |
| Occasional | 49 (3.8) | 43 (9.8) | 6 (0.7) | <0.001 | |
| Never | 1188 (91.4) | 333 (75.9) | 855 (99.3) | ||
| Illicit drug/s (ever use) | No | 1279 (98.4) | 419 (95.4) | 860 (99.9) | <0.001 |
| Yes | 21 (1.6) | 20 (4.6) | 1 (0.1) | ||
| Alcohol consumption | Never | 1256 (96.6) | 404 (92.0) | 852 (99.0) | |
| Occasional | 40 (3.1) | 31 (7.1) | 9 (1.0) | <0.001 | |
| Every day | 4 (0.3) | 4 (0.9) | - | ||
| Subjective health | Excellent/Very good | 690 (53.1) | 228 (51.9) | 462 (53.7) | |
| Good | 424 (32.6) | 149 (33.9) | 275 (31.9) | 0.765 | |
| Fair/Poor | 186 (14.3) | 62 (14.1) | 124 (14.4) | ||
| Health awareness | Very much/To some extent | 1043 (80.2) | 364 (82.9) | 679 (78.9) | 0.083 |
| Not much/Not at all | 257 (19.8) | 75 (17.1) | 182 (21.2) | ||
| BMI (reported) * | Underweight | 86 (8.2) | 24 (6.1) | 62 (9.4) | |
| Normal weight | 667(63.5) | 228 (58.0) | 439 (66.8) | <0.001 | |
| Overweight | 236 (22.5) | 106 (27.0) | 130 (19.8) | ||
| Obese | 61 (5.8) | 35 (8.9) | 26 (4.0) | ||
| Others | |||||
| Importance of religion | Somewhat/Strongly disagree | 22 (1.7) | 12 (2.8) | 10 (1.2) | 0.035 |
| (religiosity) | Strongly/Somewhat agree | 1269 (98.3) | 420 (97.2) | 849 (98.8) | |
| Quality of life | Very badly/Badly | 116 (8.9) | 45 (10.3) | 71 (8.5) | 0.439 |
| Intermediate | 416 (32.0) | 142 (32.3) | 274 (31.8) | ||
| Quite well/Very well | 768 (59.1) | 252 (57.4) | 516 (59.9) | ||
| Total | 1300 (100) | 439 (100) | 861 (100) | ||
3.2. Prevalence and Number of Symptoms in Last 12 Months
| Symptoms | Never | Rarely | Sometimes/ Very Often |
|---|---|---|---|
| N (%) | N (%) | N (%) | |
| Psychological | |||
| Depressive mood | 306 (23.5) | 245 (18.8) | 749 (57.6) |
| Difficulties to concentrate | 227 (17.5) | 335 (25.8) | 738 (56.8) |
| Sleep disorder/Insomnia | 361 (27.8) | 290 (22.3) | 649 (49.9) |
| Circulatory | |||
| Rapid heartbeats, Circulatory problems, Dizziness | 718 (55.2) | 245 (18.8) | 337 (25.9) |
| Pains/Aches | |||
| Back pain | 391 (30.1) | 319 (24.5) | 590 (45.4) |
| Neck and shoulder pain | 492 (37.8) | 321 (24.7) | 487 (37.5) |
| Headaches | 172 (13.2) | 340 (26.2) | 788 (60.6) |
| Gastrointestinal | |||
| Stomach trouble/Heartburn | 618 (47.5) | 265 (20.4) | 417 (32.1) |
| Sample | No Symptoms | 1–2 Symptoms | ≥3 Symptoms | p value for Gender Difference |
|---|---|---|---|---|
| N (%) | N (%) | N (%) | ||
| All students | 97 (7.5) | 394 (30.3) | 809 (62.2) | |
| Males | 42 (9.6) | 152 (34.6) | 245 (55.8) | 0.002 |
| Females | 55 (6.4) | 242 (28.1) | 564 (65.5) |
3.3. Frequency of Symptoms by General Characteristics
| Characteristic/ Behaviour | Headache M (SD) | p | Depressive Mood M (SD) | p | Difficulties to Concentrate M (SD) | p | Insomnia M (SD) | p |
|---|---|---|---|---|---|---|---|---|
| Stressors | ||||||||
| Stressors/Burdens (exams) | ||||||||
| Less burdened | 2.52 (0.92) | <0.001 | 2.31 (1.07) | <0.001 | 2.33 (0.94) | <0.001 | 2.20 (1.05) | <0.001 |
| Strongly/very burdened | 2.78 (0.93) | 2.80 (1.07) | 2.71 (0.92) | 2.55 (1.06) | ||||
| Stressors/Burdens (overall) | ||||||||
| Less burdened | 2.59 (0.91) | <0.001 | 2.43 (1.06) | <0.001 | 2.46 (0.92) | <0.001 | 2.29 (1.04) | <0.001 |
| Strongly/very burdened | 2.88 (0.99) | 3.01 (1.07) | 2.77 (0.99) | 2.69 (1.10) | ||||
| Socio-demographic | ||||||||
| Gender | ||||||||
| Female | 2.76 (0.92) | <0.001 | 2.69 (1.09) | <0.001 | 2.58 (0.93) | 0.031 | 2.47 (1.06) | 0.001 |
| Male | 2.48 (0.93) | 2.36 (1.06) | 2.46 (0.97) | 2.25 (1.07) | ||||
| Age | ||||||||
| < 20 | 2.57 (0.90) | 0.050 | 2.45 (1.08) | 0.006 | 2.43 (0.94) | 0.018 | 2.17 (1.05) | <0.001 |
| 20-24 | 2.71 (0.94) | 2.61 (1.10) | 2.57 (0.95) | 2.47 (1.07) | ||||
| ≥ 25 | 2.60 (1.02) | 2.83 (1.06) | 2.68 (0.88) | 2.60 (1.02) | ||||
| Marital status | ||||||||
| Married | 2.69 (0.93) | 0.868 | 2.13 (1.08) | 0.005 | 2.29 (0.92) | 0.068 | 2.38 (1.03) | 0.914 |
| Single | 2.67 (0.94) | 2.60 (1.09) | 2.55 (0.95) | 2.40 (1.07) | ||||
| Year of study | ||||||||
| 1st | 2.56 (0.91) | 0.007 | 2.42 (1.10) | 0.001 | 2.43 (0.96) | 0.034 | 2.18 (1.04) | <0.001 |
| 2nd | 2.68 (0.95) | 2.58 (1.10) | 2.59 (0.94) | 2.46 (1.08) | ||||
| 3rd | 2.80 (0.92) | 2.73 (1.08) | 2.58 (0.91) | 2.56 (1.05) | ||||
| ≥4th | 2.65 (0.94) | 2.66 (1.06) | 2.63 (0.98) | 2.49 (1.07) | ||||
| Living with parent | ||||||||
| Yes | 2.69 (0.92) | 0.041 | 2.58 (1.09) | 0.998 | 2.55 (0.93) | 0.656 | 2.39 (1.07) | 0.635 |
| No | 2.55 (0.97) | 2.58 (1.10) | 2.52 (1.01) | 2.42 (1.08) | ||||
| Income sufficiency | ||||||||
| Always/ Mostly sufficient | 2.66 (0.93) | 0.482 | 2.52 (1.10) | 0.002 | 2.49 (0.95) | 0.001 | 2.36 (1.06) | 0.089 |
| Mostly/ Always insufficient | 2.70 (0.95) | 2.73 (1.07) | 2.68 (0.93) | 2.48 (1.09) | ||||
| Health behaviours/Lifestyle | ||||||||
| Smoking | ||||||||
| Daily | 2.63 (0.97) | 0.069 | 2.62 (1.04) | 0.089 | 2.57 (1.00) | 0.590 | 2.40 (1.06) | 0.902 |
| Occasional | 2.37 (1.06) | 2.24 (1.11) | 2.41 (0.93) | 2.33 (1.11) | ||||
| Never | 2.68 (0.93) | 2.59 (1.09) | 2.55 (0.94) | 2.40 (1.07) | ||||
| Illicit drugs (ever use) | ||||||||
| No | 2.66 (0.93) | 0.636 | 2.58 (1.09) | 0.869 | 2.54 (0.94) | 0.541 | 2.39 (1.07) | 0.240 |
| Yes | 2.76 (1.04) | 2.62 (1.28) | 2.67 (1.16) | 2.67 (1.07) | ||||
| Alcohol consumption | ||||||||
| Never | 2.67 (0.93) | 0.888 | 2.58 (1.09) | 0.668 | 2.54 (0.94) | 0.837 | 2.39 (1.07) | 0.756 |
| Occasionally | 2.60 (0.98) | 2.50 (1.20) | 2.60 (1.08) | 2.45 (1.04) | ||||
| Every day | 2.75 (1.50) | 3.00 (1.41) | 2.75 (1.26) | 2.75 (0.96) | ||||
| Subjective Health | ||||||||
| Excellent/Very good | 2.51 (0.92) | <0.001 | 2.41 (1.10) | <0.001 | 2.38 (0.94) | <0.001 | 2.23 (1.05) | <0.001 |
| Good | 2.82 (0.88) | 2.65 (1.04) | 2.63 (0.89) | 2.51 (1.03) | ||||
| Fair Poor | 2.89 (0.99) | 3.04 (1.04) | 2.93 (0.95) | 2.73 (1.13) | ||||
| Health awareness | ||||||||
| Very much/Some extent | 2.63 (0.93) | 0.014 | 2.51 (1.08) | <0.001 | 2.49 (0.92) | <0.001 | 2.37 (1.07) | 0.054 |
| Not much/Not at all | 2.79 (0.96) | 2.86 (1.09) | 2.75 (1.02) | 2.51 (1.07) | ||||
| BMI (reported) | ||||||||
| Underweight | 2.60 (0.92) | 0.620 | 2.58 (1.15) | 0.313 | 2.44 (0.94) | 0.339 | 2.29 (1.11) | 0.695 |
| Normal weight | 2.63 (0.91) | 2.62 (1.08) | 2.57 (0.92) | 2.42 (1.06) | ||||
| Overweight | 2.69 (0.91) | 2.47 (1.08) | 2.50 (0.93) | 2.43 (1.04) | ||||
| Obese | 2.74 (1.06) | 2.64 (1.13) | 2.67 (1.00) | 2.36 (1.07) | ||||
| Others | ||||||||
| Importance of religion (religiosity) | ||||||||
| Somewhat/Strongly disagree | 2.73 (0.88) | 0.766 | 2.82 (1.05) | 0.309 | 2.55 (0.96) | 0.984 | 2.32 (0.89) | 0.721 |
| Strongly/Somewhat agree | 2.67 (0.94 ) | 2.58 (1.09) | 2.54 (0.95) | 2.40 (1.07) | ||||
| Quality of life | ||||||||
| Very badly/Badly | 2.74 (0.97) | 0.412 | 2.92 (1.05) | <0.001 | 2.80 (0.93) | <0.001 | 2.64 (1.17) | <0.001 |
| Intermediate | 2.69 (0.97) | 2.77 (1.05) | 2.68 (0.95) | 2.52 (1.04) | ||||
| Quite well/Very well | 2.64 (0.91) | 2.42 (1.09) | 2.43 (0.93) | 2.29 (1.06) | ||||
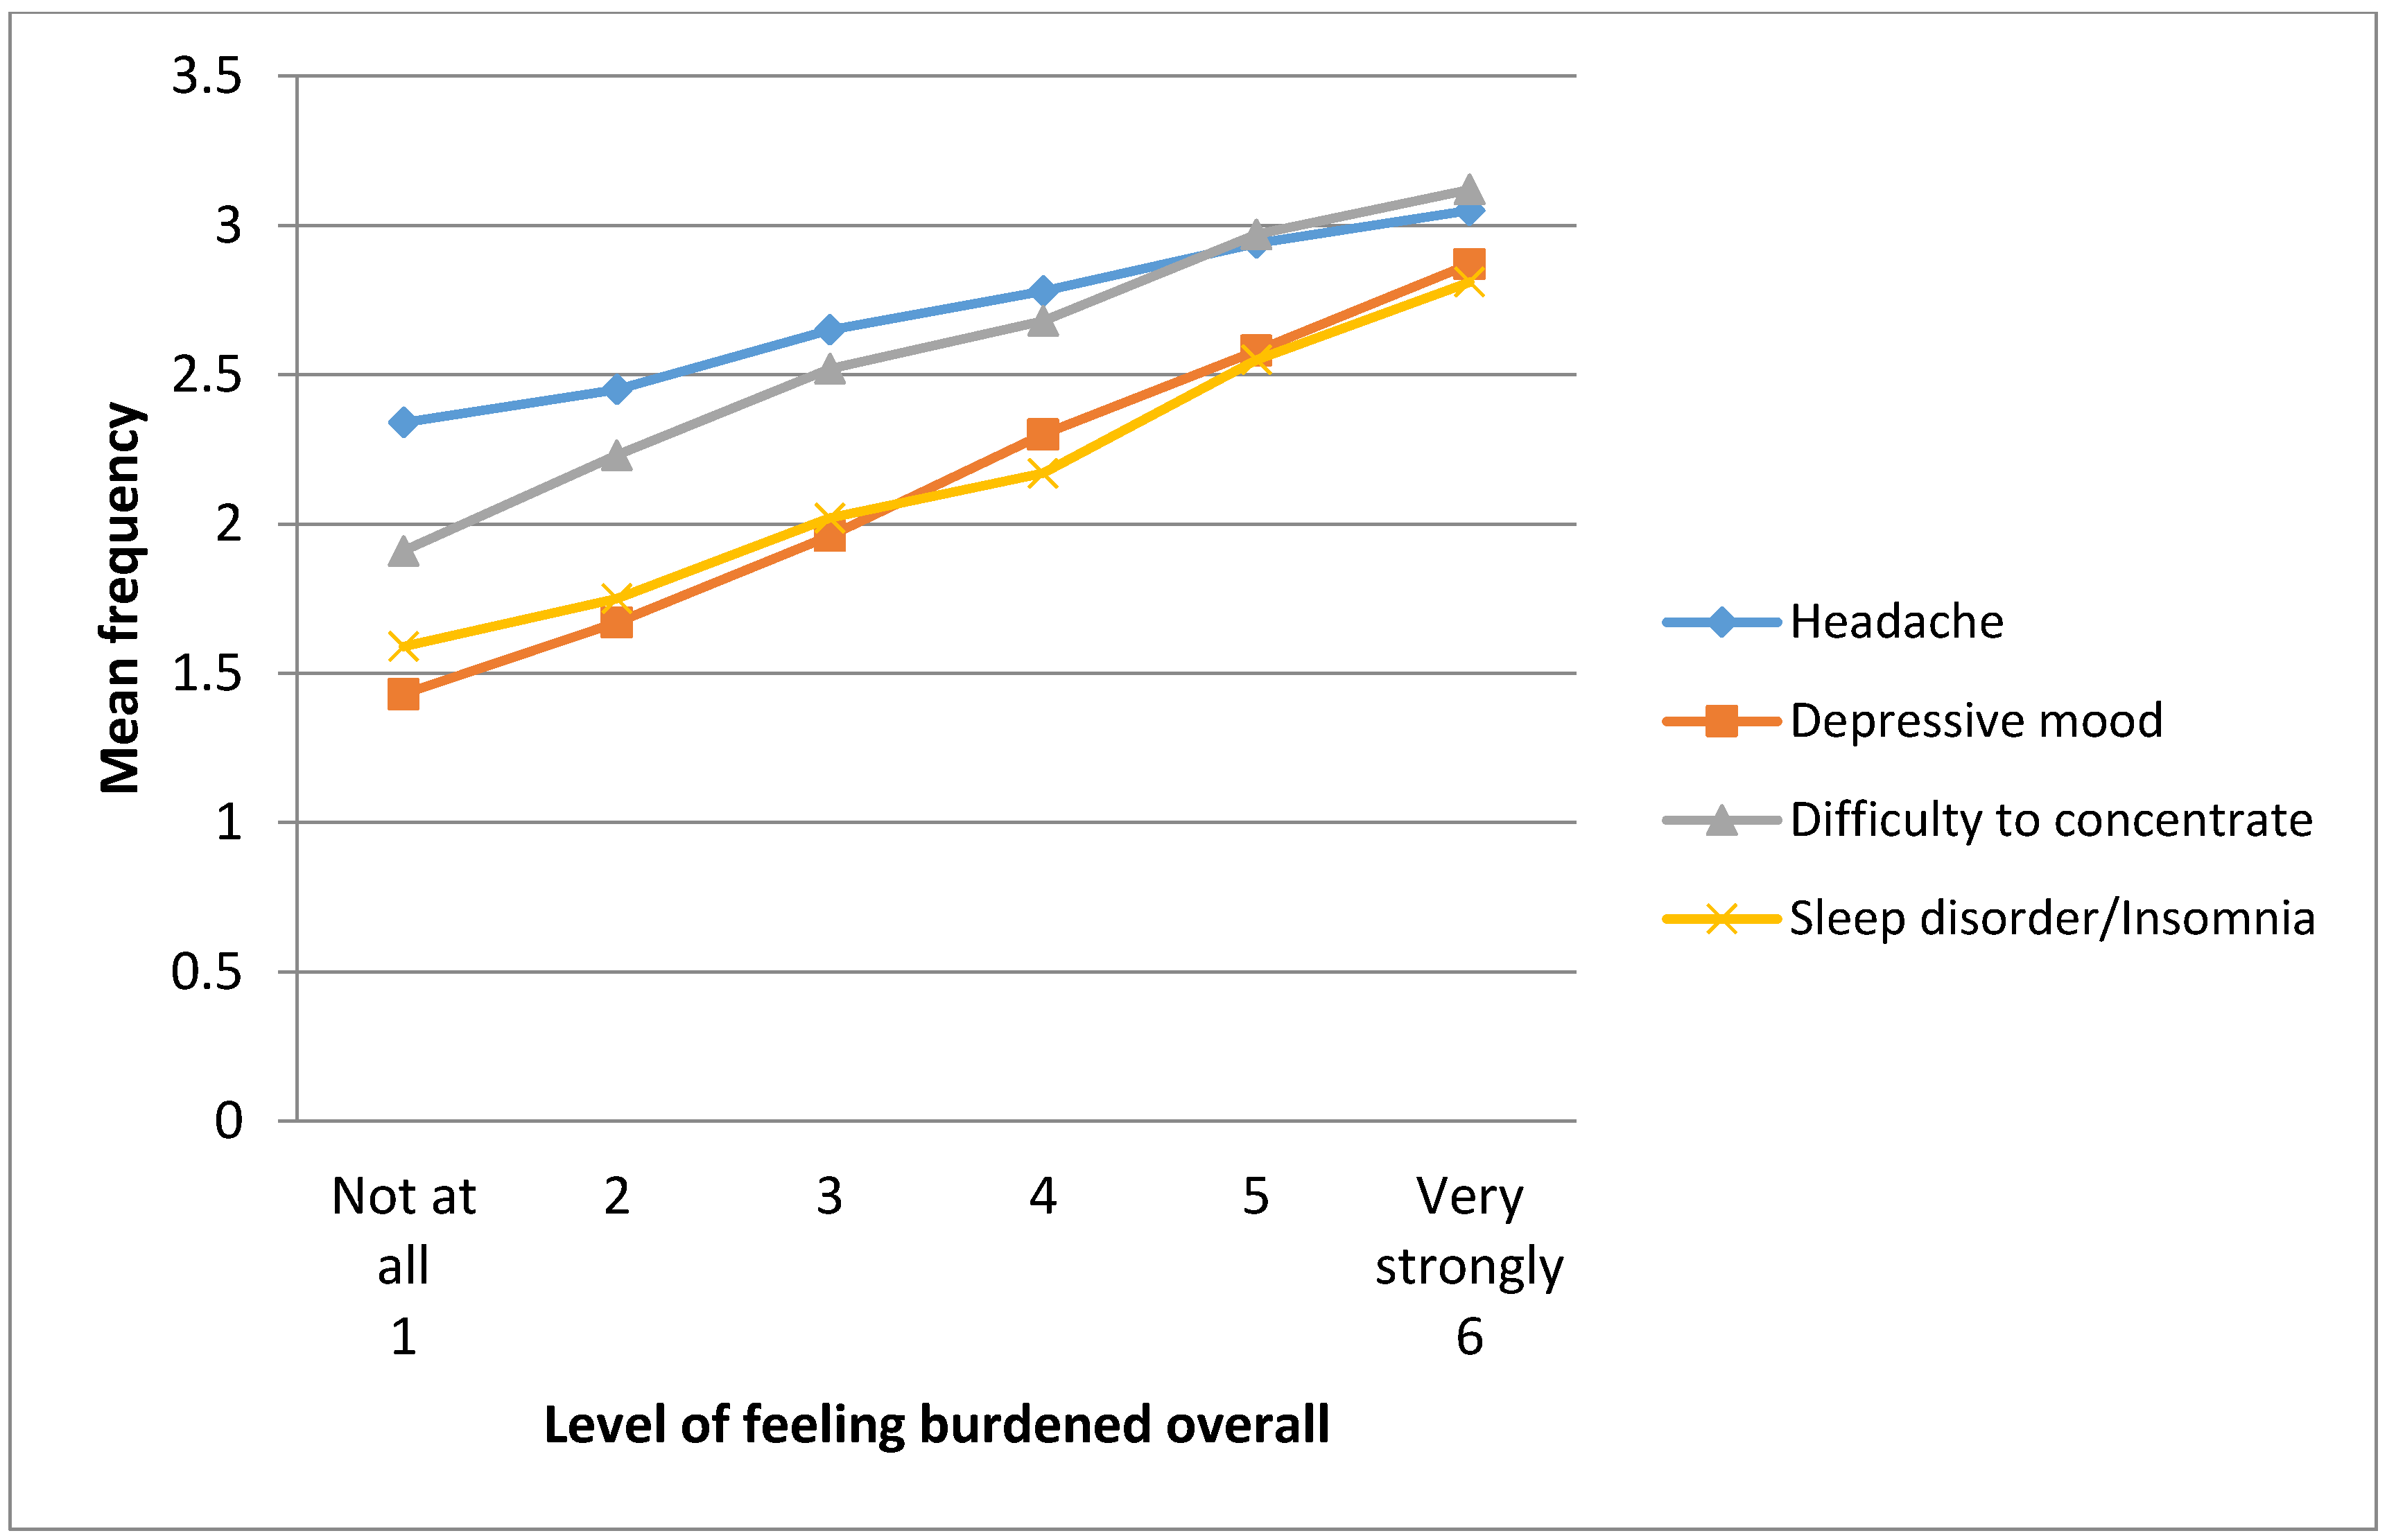
3.4. Association between Feeling Burdened Overall and Frequency of Symptoms
| Symptom | Level of Stressor (Feeling Burdened) | p | ||||||
|---|---|---|---|---|---|---|---|---|
| Not at All | Very Much | β | ||||||
| M (SD) | M (SD) | M (SD) | M (SD) | M (SD) | M (SD) | |||
| Headache | 2.34(0.83) | 2.45(0.84) | 2.65(0.82) | 2.78(0.83) | 2.94(0.82) | 3.05(0.91) | 0.18 | <0.001 |
| Depressive mood | 1.43(0.69) | 1.67(0.75) | 1.96(0.85) | 2.30(0.89) | 2.58(0.92) | 2.87(0.96) | 0.30 | <0.001 |
| Difficulty to concentrate | 1.91(0.91) | 2.23(0.85) | 2.52(0.79) | 2.68(0.82) | 2.97(0.79) | 3.12(0.86) | 0.20 | <0.001 |
| Sleep disorder/ insomnia | 1.59(0.86) | 1.75(0.93) | 2.02(0.97) | 2.17(0.98) | 2.55(1.08) | 2.81(1.06) | 0.19 | <0.001 |

| Variable | Headache OR (95% CI) | Depressive Mood OR (95% CI) | Difficulty to Concentrate OR (95% CI) | Sleep Disorder/ Insomnia OR (95% CI) |
|---|---|---|---|---|
| Stressors | ||||
| Feeling burdened overall | ||||
| Less burdened | 1.00 | 1.00 | 1.00 | 1.00 |
| Strongly/very strongly burdened | 1.52 (1.15–2.02) | 2.20 (1.64–2.94) | 1.07 (0.81–1.40) | 1.55 (1.19–2.03) |
| Socio-demographic | ||||
| Gender | ||||
| Female | 1.00 | 1.00 | 1.00 | 1.00 |
| Male | 0.63 (0.49–0.80) | 0.58 (0.45–0.75) | 1.12 (0.87–1.44) | 0.71 (0.56–0.91) |
| Age | ||||
| <20 | 1.00 | 1.00 | 1.00 | 1.00 |
| 20-24 | 1.22 (0.90–1.63) | 1.07 (0.79–1.44) | 1.01 (0.74–1.36) | 1.46 (1.09–1.96) |
| ≥ 25 | 0.88 (0.52–1.48) | 1.32 (0.76–2.29) | 1.13 (0.66–1.93) | 1.92 (1.14–3.26) |
| Year of study | ||||
| 1st * | 1.00 | 1.00 | 1.00 | 1.00 |
| 2nd | 1.16 (0.86–1.58) | 1.07 (0.78–1.46) | 0.89 (0.65–1.21) | 1.25 (0.92–1.69) |
| 3rd | 1.13 (0.80–1.60) | 1.34 (0.94–1.90) | 1.00 (0.70–1.41) | 1.37 (0.98–1.92) |
| ≥4th | 1.05 (0.70–1.57) | 1.68 (1.11–2.53) | 1.08 (0.72–1.62) | 1.36 (0.92–2.01) |
| Income sufficiency | ||||
| Always/Mostly sufficient | 1.00 | 1.00 | 1.00 | 1.00 |
| Always/Mostly insufficient | 1.05 (0.81–1.37) | 1.29 (0.98–1.69) | 1.33 (1.02–1.73) | 1.05 (0.81–1.36) |
| Health behaviours/Lifestyle | ||||
| Subjective health status | ||||
| Excellent/Very good | 1.00 | 1.00 | 1.00 | 1.00 |
| Good | 1.64 (1.27–2.13) | 1.21 (0.93–1.56) | 1.31 (1.01–1.70) | 1.35 (1.05–1.73) |
| Fair/Poor | 1.57 (1.09–2.27) | 1.63 (1.10–2.41) | 2.39 (1.67–3.41) | 1.51 (1.06–2.17) |
| Watch one’s health | ||||
| Very much/Some extent | 1.00 | 1.00 | 1.00 | 1.00 |
| Not much/Not at all | 0.97 (0.72–1.30) | 1.41 (1.03–1.92) | 1.16 (0.87–1.56) | 1.04 (0.78–1.39) |
| Others | ||||
| Quality of life | ||||
| Very badly/Badly | 1.00 | 1.00 | 1.00 | 1.00 |
| Intermediate | 0.84 (0.54–1.31) | 0.89 (0.55–1.43) | 0.97 (0.63–1.48) | 1.06 (0.69–1.63) |
| Quite well/Very well | 1.08 (0.70–1.67) | 0.60 (0.38–0.95) | 0.66 (0.44–1.01) | 0.86 (0.57–1.31) |
4. Discussion
5. Conclusions
Acknowledgements
Author Contributions
Conflicts of Interest
References
- El Ansari, W. Health and well-being of students at higher education institutions—Time for urgent action? Cent. Eur. J. Public Health 2014, 22, 67. [Google Scholar] [PubMed]
- El Ansari, W.; Oskrochi, R.; Labeeb, S.; Stock, C. Symptoms and health complaints and their association with perceived stress at university: survey of students at eleven faculties in Egypt. Cent. Eur. J. Public Health 2014, 22, 68–79. [Google Scholar] [PubMed]
- El Ansari, W.; Oskrochi, R.; Haghgoo, G. Are students’ symptoms and health complaints associated with perceived stress at university? Perspectives from the United Kingdom and Egypt. Int. J. Environ. Res. Public Health 2014, 11, 9981–10002. [Google Scholar] [PubMed]
- Lazarus, R.; Cohen, J. Environmental stress. In Human Behavior and Environment: Current Theory and Research; Altman, I., Wohlwill, J.F., Eds.; Plenum: New York, NY, USA, 1977; Volume 2. [Google Scholar]
- Behere, S.P.; Yadav, R.; Behere, P.B. A comparative study of stress among students of medicine, engineering, and nursing. Indian J. Psychol. Med. 2011, 33, 145–148. [Google Scholar] [PubMed]
- El Ansari, W.; Oskrochi, R.; Stock, C. Symptoms and health complaints and their association with perceived stress: Students from seven universities in England, Wales and Northern Ireland. J. Public Health 2013, 21, 413–425. [Google Scholar]
- Dahan, H.; Bedos, C. A typology of dental students according to their experience of stress: A qualitative study. J. Dent. Educ. 2010, 74, 95–103. [Google Scholar] [PubMed]
- Mikolajczyk, R.T.; Maxwell, A.E.; Naydenova, V.; Meier, S.; El Ansari, W. Depressive symptoms and perceived burdens related to being a student: Survey in three European countries. Clin. Pract. Epidemiol. Ment. Health 2008, 4. [Google Scholar] [CrossRef]
- Elias, H.; Ping, W.S.; Abdullah, M.C. Stress and academic achievement among undergraduate students in University Putra Malaysia. Proc. Soc. Behav. Sci. 2011, 29, 646–655. [Google Scholar]
- El Ansari, W.; Stock, C. Is the health and wellbeing of university students associated with their academic performance? Cross sectional findings from the United Kingdom. Int. J. Environ. Res. Public Health 2010, 7, 509–527. [Google Scholar] [PubMed]
- Alzahem, A.M.; van der Molen, H.T.; Alaujan, A.H.; Schmidt, H.G.; Zamakhshary, M.H. Stress amongst dental students: A systematic review. Eur. J. Dent. Educ. 2011, 15, 8–18. [Google Scholar] [PubMed]
- Chan, G.C.; Koh, D. Understanding the psychosocial and physical work environment in a Singapore medical school. Singapore Med. J. 2007, 48, 166–171. [Google Scholar] [PubMed]
- Divaris, K. The academic environment: The students’ perspective. Eur. J. Dent. Educ. 2008, 12, 120–130. [Google Scholar] [PubMed]
- Pillay, A.L.; Ngcobo, H.S.B. Sources of stress and support among rural-based first-year university students: An exploratory study. S. Afr. J. Psychol. 2010, 40, 234–240. [Google Scholar]
- Elani, H.W.; Bedos, C.; Allison, P.J. Sources of stress in Canadian dental students: A prospective mixed methods study. J. Dent. Educ. 2013, 77, 1488–1497. [Google Scholar] [PubMed]
- Koyama, A.; Matsushita, M.; Ushijima, H.; Jono, T.; Ikeda, M. Association between depression, examination-related stressors, and sense of coherence: The Ronin-Sei study. Psychiat. Clin. Neurosciences 2014, 68, 441–447. [Google Scholar]
- Doulatabad, S.N.; Mohamadhosaini, S.; Ghafarian Shirazi, H.R.; Mohebbi, Z. Nursing students in Iran identify the clinical environment stressors. Int. J. Nurs. Pract. 2014. [Google Scholar] [CrossRef]
- Hamaideh, S.H. Gender differences in stressors and reactions to stressors among Jordanian university students. Int. J. Soc. Psychiatr. 2012, 58, 26–33. [Google Scholar] [CrossRef]
- Lester, D. College student stressors, depression, and suicidal ideation. Psychol. Rep. 2014, 114, 293–296. [Google Scholar] [CrossRef] [PubMed]
- El Ansari, W.; Adetunji, H.; Oskrochi, R. Food and mental health: Relationship between food and perceived stress and depressive symptoms among university students in the United Kingdom. Cent. Eur. J. Public Health 2014, 22, 90–97. [Google Scholar] [PubMed]
- El Ansari, W.; Sebena, R.; Stock, C. Do importance of religious faith and healthy lifestyle modify the relationships between depressive symptoms and four indicators of alcohol consumption? A survey of students across seven universities in England, Wales, and Northern Ireland. Subst. Use Misuse 2014, 49, 211–220. [Google Scholar] [CrossRef] [PubMed]
- El Ansari, W.; Dibba, E.; Stock, C. Body image concerns: Levels, correlates and gender differences among students in the United Kingdom. Cent. Eur. J. Public Health 2014, 22, 106–117. [Google Scholar]
- El Ansari, W.; Khalil, K.; Crone, D.; Stock, C. Physical activity and gender differences: Correlates of compliance with recommended levels of five forms of physical activity among students at nine universities in Libya. Cent. Eur. J. Public Health 2014, 22, 98–105. [Google Scholar] [PubMed]
- El Ansari, W.; Sebena, R.; Labeeb, S. Multiple risk factors: prevalence and correlates of alcohol, tobacco and other drug (ATOD) use among university students in Egypt. J. Subst. Use 2014. [Google Scholar] [CrossRef]
- El Ansari, W.; Labeeb, S.; Moseley, L.; Kotb, S.; El-Houfey, A. Physical and psychological well-being of university students: Survey of eleven faculties in Egypt. Int. J. Prev. Med. 2013, 4, 293–310. [Google Scholar] [PubMed]
- El Ansari, W.; Sebena, R.; Stock, C. Socio-demographic correlates of six indicators of alcohol consumption: Survey findings of students across seven universities in England, Wales and Northern Ireland. Arch. Public Health 2013, 71. [Google Scholar] [CrossRef]
- El Ansari, W.; Stock, C.; Mills, C. Is alcohol consumption associated with poor academic achievement in university students? Int. J. Prev. Med. 2013, 4, 1175–1188. [Google Scholar] [PubMed]
- Stock, C.; Kücük, N.; Miseviciene, I.; Guillén-Grima, F.; Petkeviciene, J.; Aguinaga-Ontoso, I.; Krämer, A. Differences in health complaints among university students from three European countries. Prev. Med. 2003, 37, 535–543. [Google Scholar] [CrossRef] [PubMed]
- Stock, C.; Mikolajczyk, R.T.; Bilir, N.; Petkeviciene, J.; Naydenova, V.; Dudziak, U.; Marin-Fernandez, B.; El Ansari, W. Gender differences in health complaints among students: Results from a survey in seven countries. J. Public Health 2008, 16, 353–360. [Google Scholar] [CrossRef]
- Hurrelmann, K.; Kolip, P. Der Jugendgesundheitssurvey; University of Bielefeld: Bielefeld, Germany, 1994. (in German) [Google Scholar]
- American College Health Association. American College Health Association––National College Health Assessment (ACHA-NCHA) spring 2005 reference group data report (abridged). J. Amer. Coll. Health 2006, 55, 15–16. [Google Scholar]
- Obesity: Preventing and Managing the Global Epidemic; World Health Organization: Geneva, Switzerland, 2000.
- Bruusgard, D.; Nessioy, I.; Rutle, O.; Furuseth, K.; Natvig, B. Measuring functional status in a population survey. The Dartmouth COOP/WONCA functional health assessment charts used in an epidemiological study. Fam. Pract. 1993, 10, 212–218. [Google Scholar] [CrossRef] [PubMed]
- Gadzella, B. College students assess their stressors and reactions to stressors. In Proceedings of Texas A&M University Assessment Conference, College Station, TX, USA; 2004. [Google Scholar]
- Boström, M.; Dellve, L.; Thomée, S.; Hagberg, M. Risk factors for generally reduced productivity—A prospective cohort study of young adults with neck or upper-extremity musculoskeletal symptoms. Scand. J. Work Environ. Health 2008, 34, 120–132. [Google Scholar] [CrossRef] [PubMed]
- Brennan, G.; Shafat, A.; Mac Donncha, C.; Vekins, C. Lower back pain in physically demanding college academic programs: A questionnaire based study. BMC Musculoskelet. Disord. 2007, 8. [Google Scholar] [CrossRef]
- Lee, E.Y.; Mun, M.S.; Lee, S.H.; Cho, H.S. Perceived stress and gastrointestinal symptoms in nursing students in Korea: A cross-sectional survey. BMC Nursing 2011, 10. [Google Scholar] [CrossRef]
- Divaris, K.; Polychronopoulou, A.; Villa-Torres, L.; Mafla, A.C.; Moya, G.A.; González-Martínez, F.; Vila-Sierra, L.A.; Fortich-Mesa, N.; Gómez-Scarpetta, R.Á.; Duque-Restrepo, L.M. Extracurricular factors influence perceived stress in a large cohort of Colombian dental students. J. Dent. Educ. 2014, 78, 213–225. [Google Scholar]
- Al-Busaidi, Z.; Bhargava, K.; Al-Ismaily, A.; Al-Lawati, H.; Al-Kindi, R.; Al-Shafaee, M.; Al-Maniri, A. Prevalence of depressive symptoms among university students in Oman. Oman Med. J. 2011, 26, 235–239. [Google Scholar] [CrossRef] [PubMed]
- Von Bothmer, M.I.; Fridlund, B. Gender differences in health habits and in motivation for a healthy lifestyle among Swedish university students. Nurs. Health Sci. 2005, 7, 107–118. [Google Scholar] [CrossRef] [PubMed]
- Denton, M.; Prus, S.; Walters, V. Gender differences in health: A Canadian study of the psychological, structural and behavioral determinants of health. Soc. Sci. Med. 2004, 58, 255–260. [Google Scholar] [CrossRef]
- Abdel Rahman, A.G.; Al Hashim, B.N.; Al Hiji, N.K.; Al-Abbad, Z. Stress among medical Saudi students at College of Medicine, King Faisal University. J. Prev. Med. Hyg. 2013, 54, 195–199. [Google Scholar] [PubMed]
- Rodrigo, C.; Welgama, S.; Gurusinghe, J.; Wijeratne, T.; Jayananda, G.; Rajapakse, S. Symptoms of anxiety and depression in adolescent students: A perspective from Sri Lanka. Child Adolescent Psychiat. Mental Health 2010, 4, 10–12. [Google Scholar] [CrossRef]
- Wang, H.F.; Yeh, M.C. Stress, coping, and psychological health of vocational high school nursing students associated with a competitive entrance exam. J. Nurs. Res. 2005, 13, 106–116. [Google Scholar] [CrossRef] [PubMed]
- Gibbons, C. Stress, coping and burn-out in nursing students. Int. J. Nurs. Stud. 2010, 47, 1299–1309. [Google Scholar] [CrossRef] [PubMed]
- Albino, J.E.; Young, S.K.; Neumann, L.M.; Kramer, G.A.; Andrieu, S.C.; Henson, L.; Horn, B.; Hendricson, W.D. Assessing dental students’ competence: Best practice recommendations in the performance assessment literature and investigation of current practices in predoctoral dental education. J. Dent. Educ. 2008, 72, 1405–1435. [Google Scholar] [PubMed]
- Polychronopoulou, A.; Divaris, K. Dental students’ perceived sources of stress: A multi-country study. J. Dent. Educ. 2009, 73, 631–639. [Google Scholar] [PubMed]
- Omigbodun, O.O. Stressors and psychological symptoms in students of medicine and allied health professions in Nigeria. Soc. Psychiat. Psychiat. Epidem. 2006, 41, 415–421. [Google Scholar] [CrossRef]
© 2014 by the authors; licensee MDPI, Basel, Switzerland. This article is an open access article distributed under the terms and conditions of the Creative Commons Attribution license (http://creativecommons.org/licenses/by/4.0/).
Share and Cite
El Ansari, W.; Khalil, K.; Stock, C. Symptoms and Health Complaints and Their Association with Perceived Stressors among Students at Nine Libyan Universities. Int. J. Environ. Res. Public Health 2014, 11, 12088-12107. https://doi.org/10.3390/ijerph111212088
El Ansari W, Khalil K, Stock C. Symptoms and Health Complaints and Their Association with Perceived Stressors among Students at Nine Libyan Universities. International Journal of Environmental Research and Public Health. 2014; 11(12):12088-12107. https://doi.org/10.3390/ijerph111212088
Chicago/Turabian StyleEl Ansari, Walid, Khalid Khalil, and Christiane Stock. 2014. "Symptoms and Health Complaints and Their Association with Perceived Stressors among Students at Nine Libyan Universities" International Journal of Environmental Research and Public Health 11, no. 12: 12088-12107. https://doi.org/10.3390/ijerph111212088
APA StyleEl Ansari, W., Khalil, K., & Stock, C. (2014). Symptoms and Health Complaints and Their Association with Perceived Stressors among Students at Nine Libyan Universities. International Journal of Environmental Research and Public Health, 11(12), 12088-12107. https://doi.org/10.3390/ijerph111212088