Poultry Farm Vulnerability and Risk of Avian Influenza Re-Emergence in Thailand

Abstract
:1. Introduction
2. Material and Methods
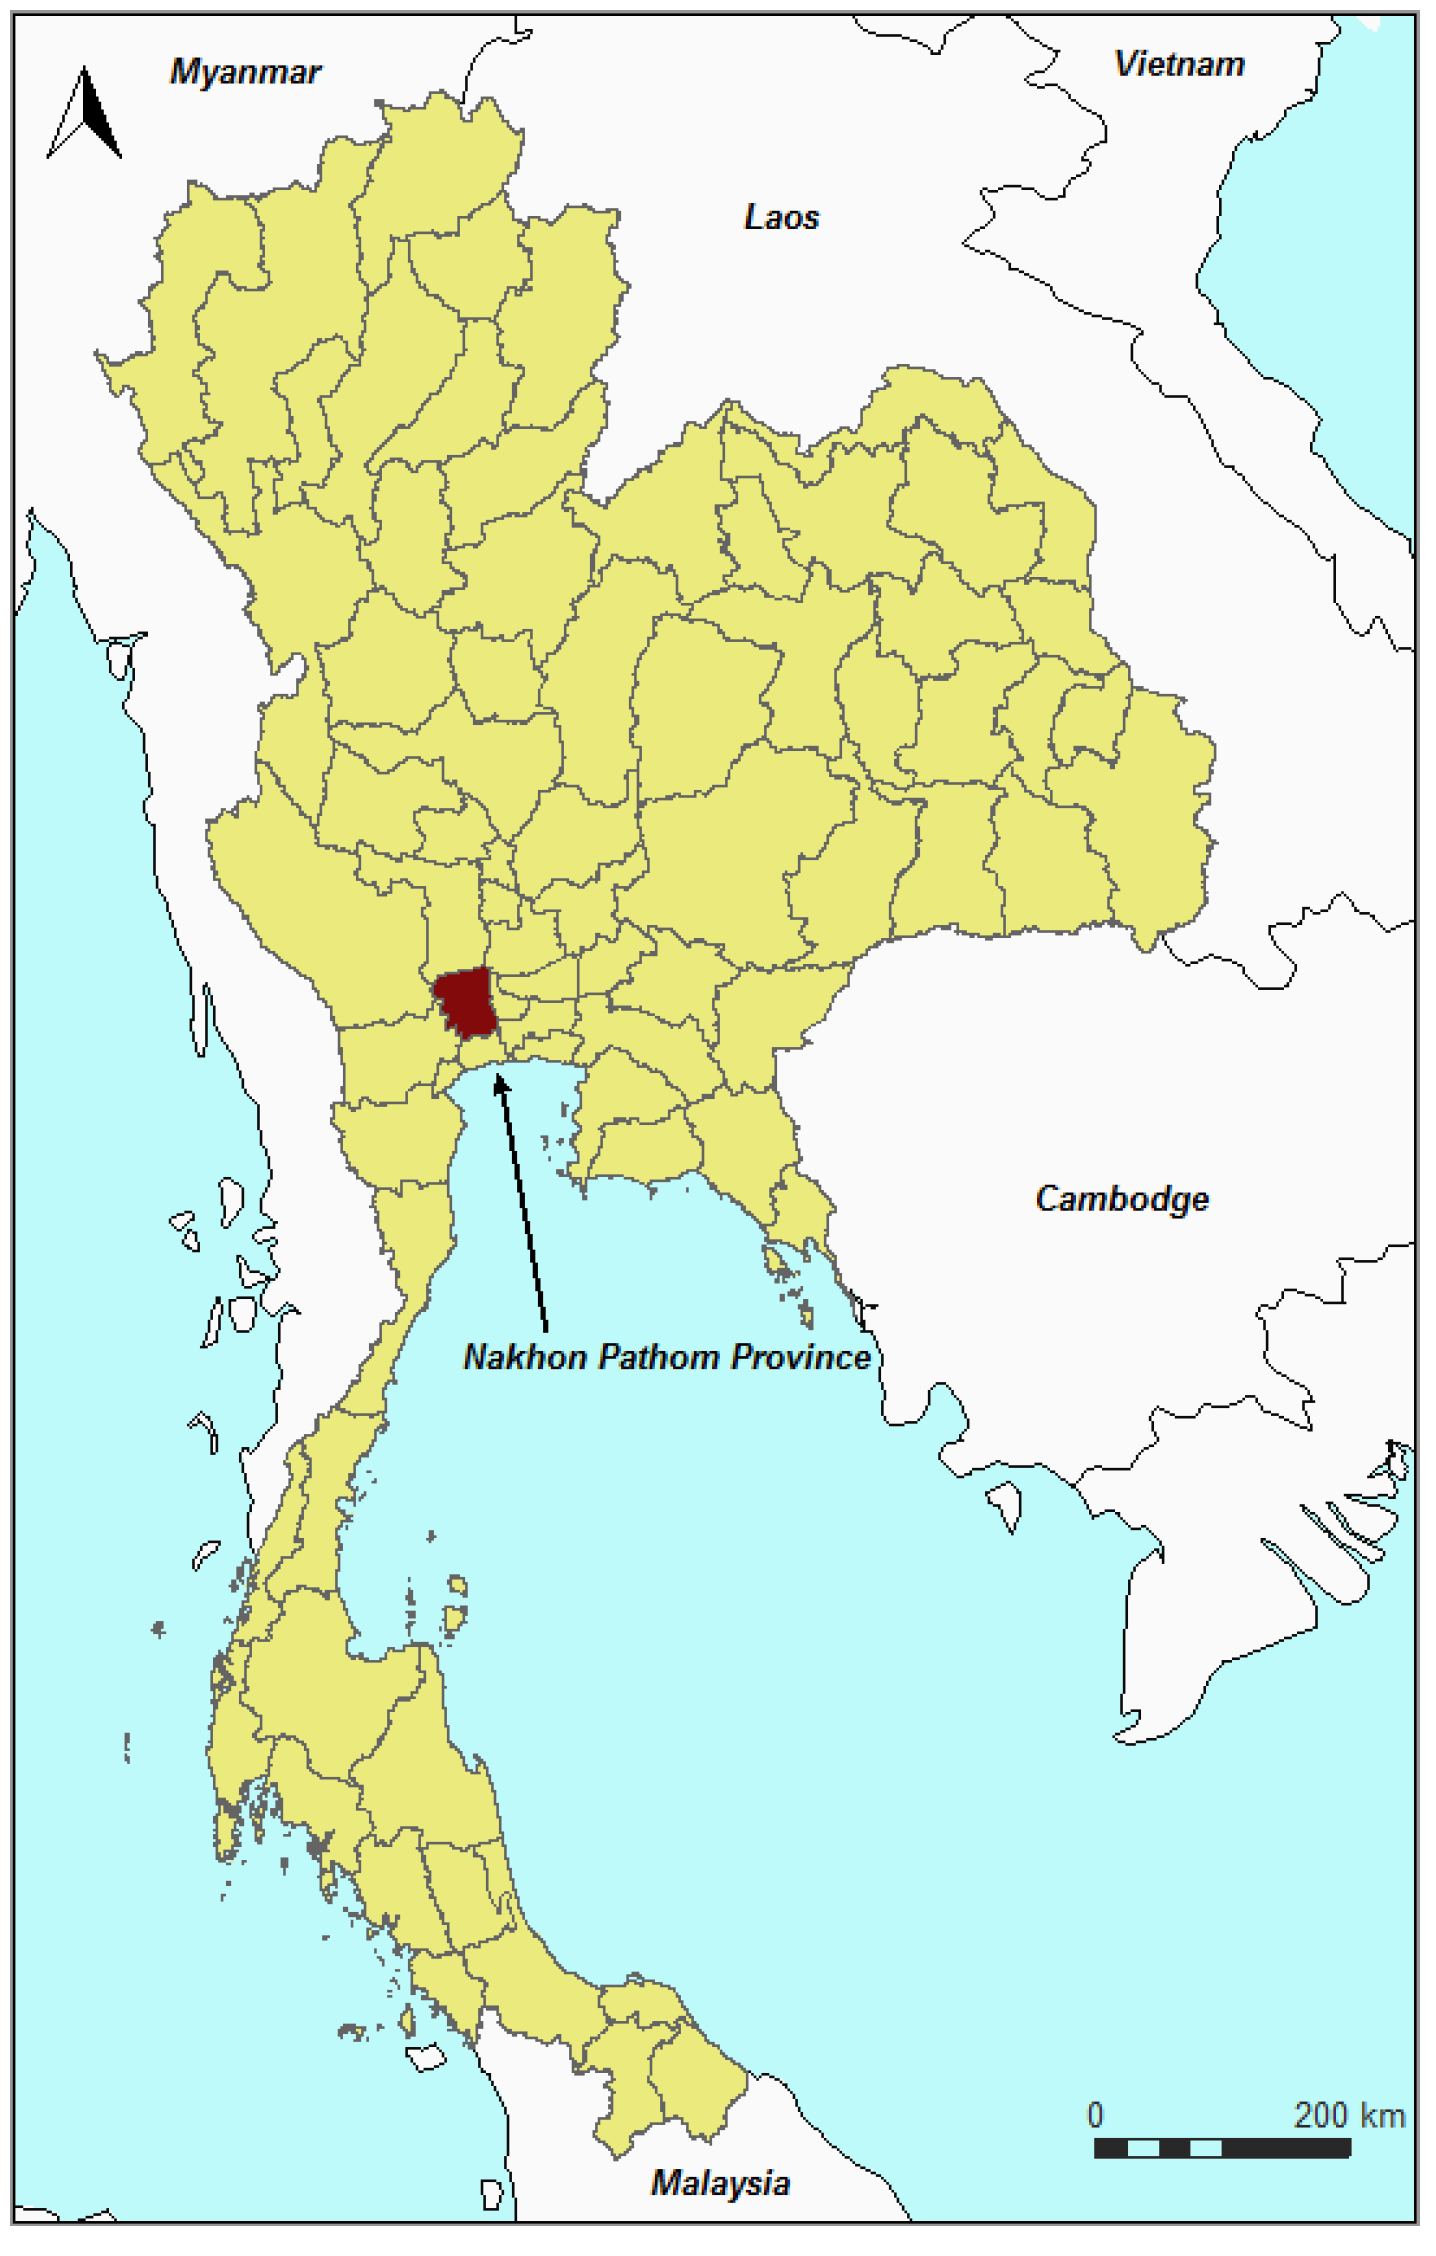
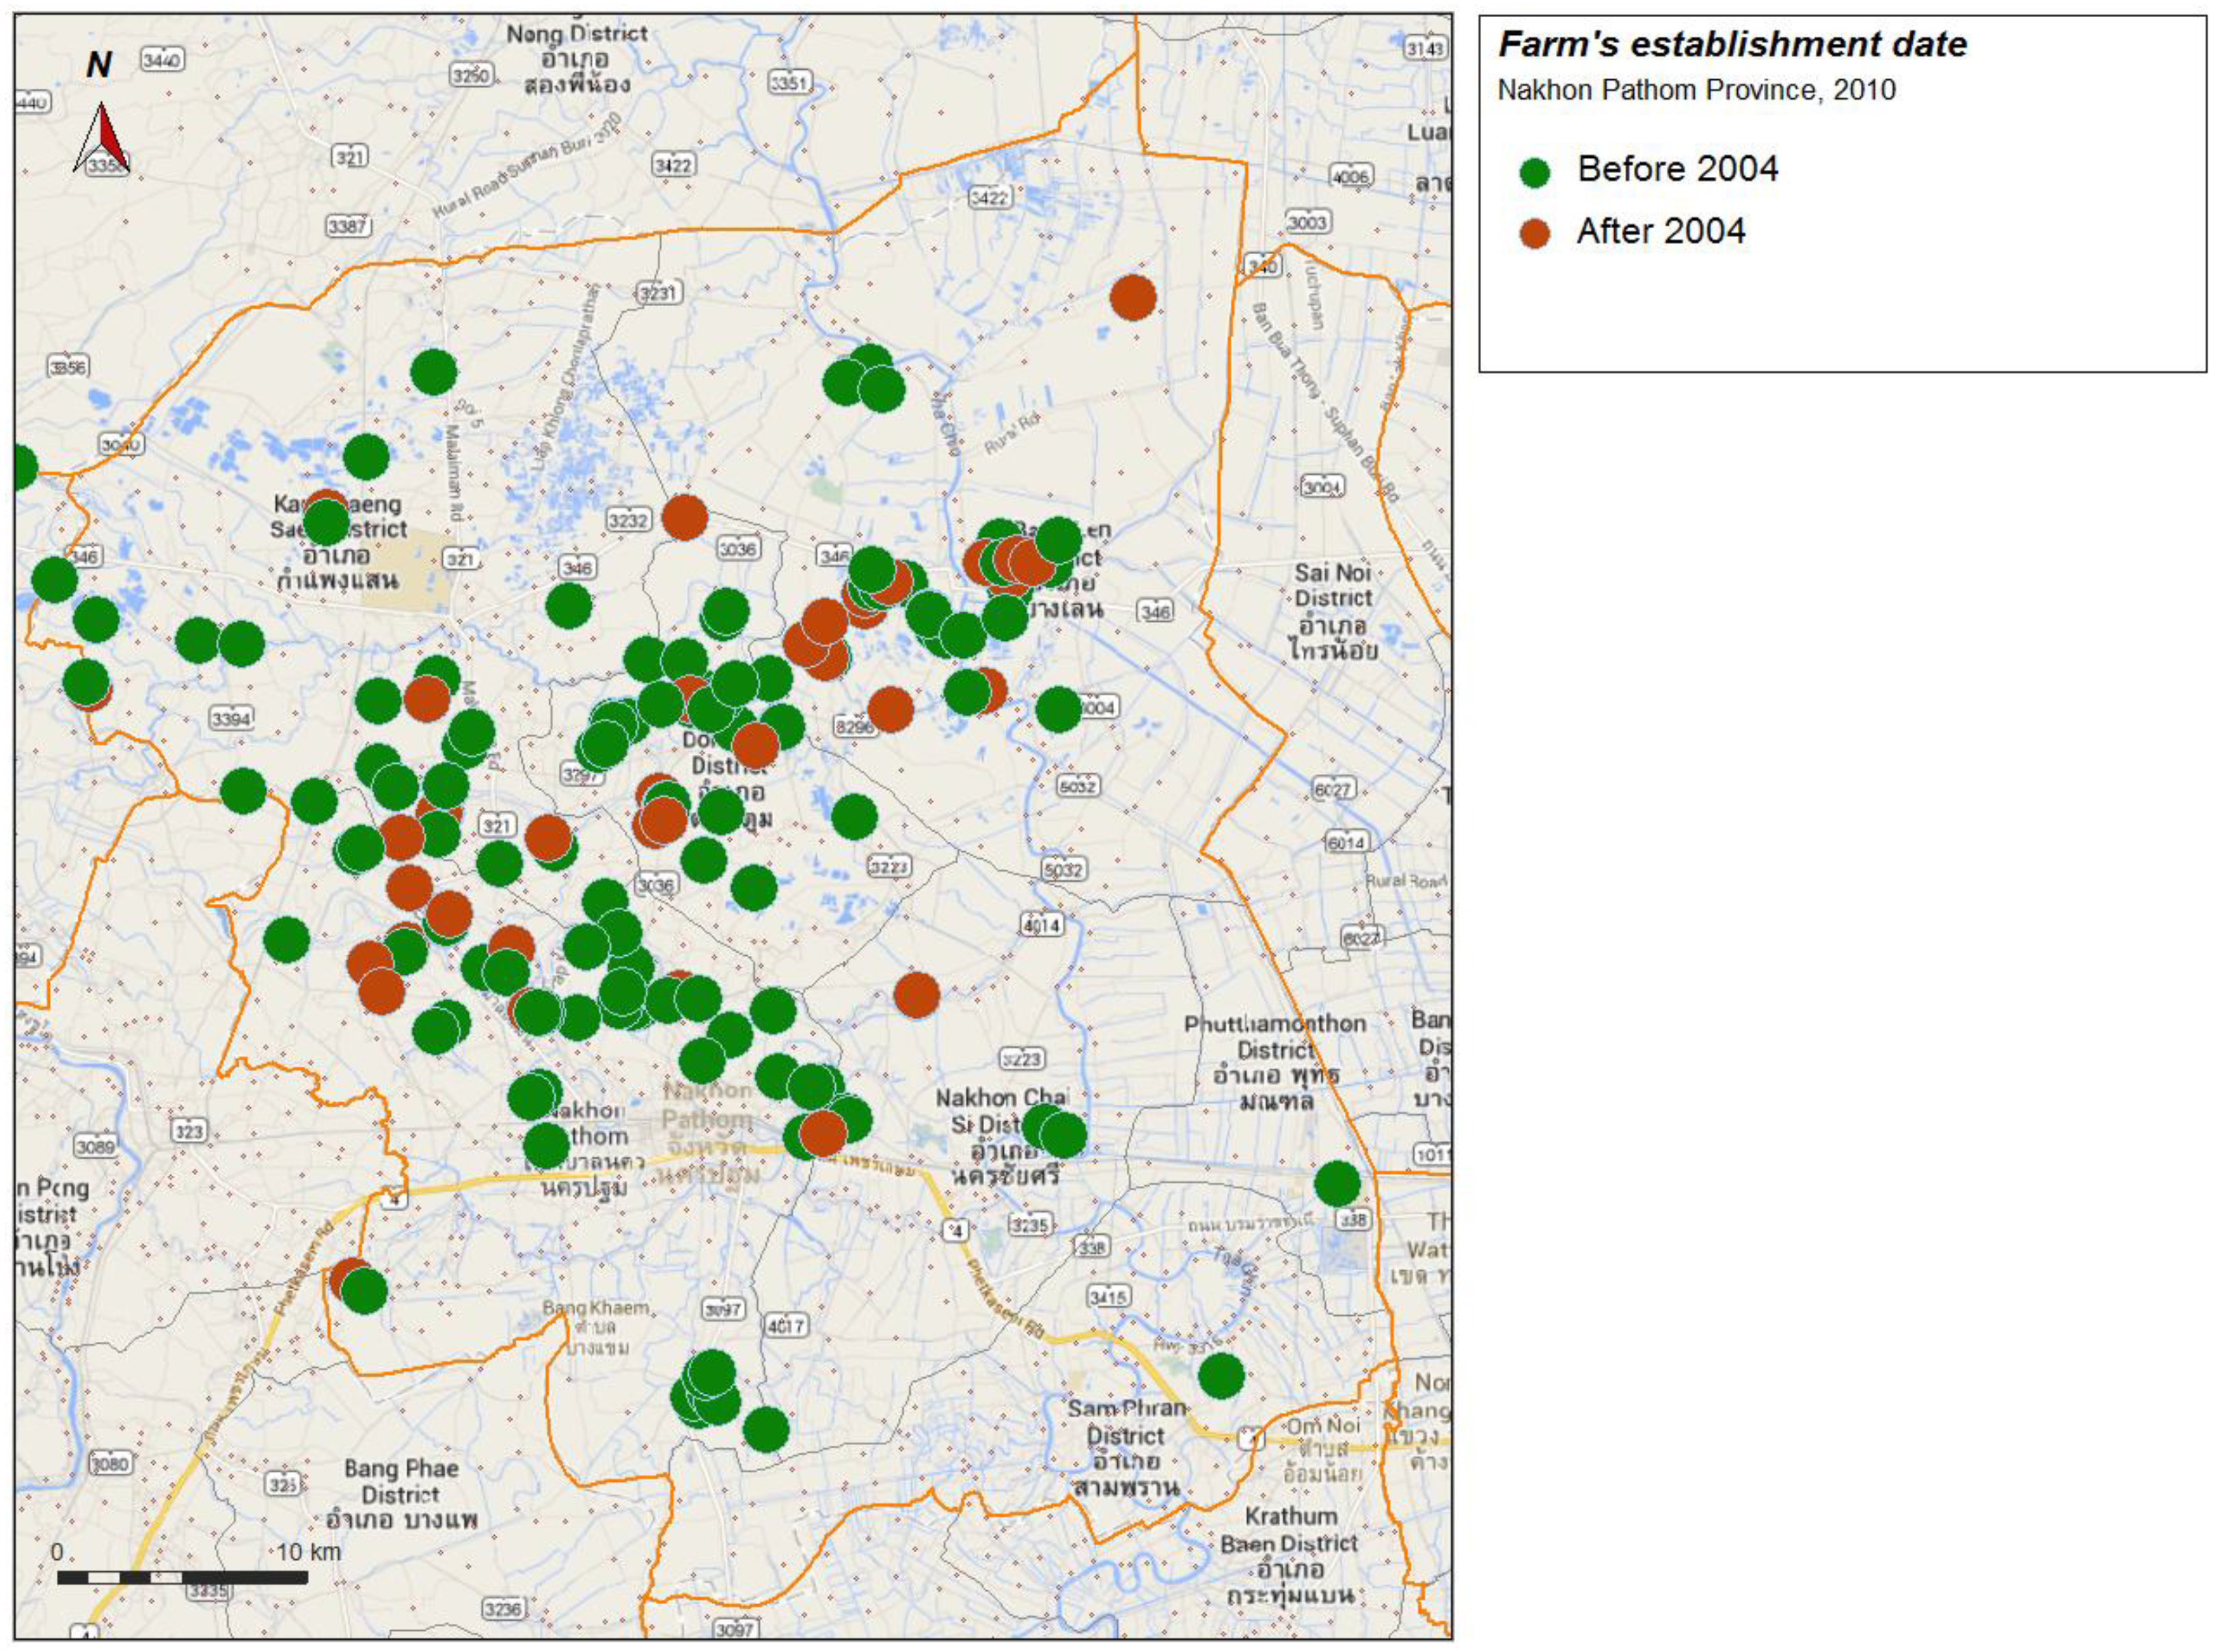
2.1. Field Survey in Nakhon Pathom Province

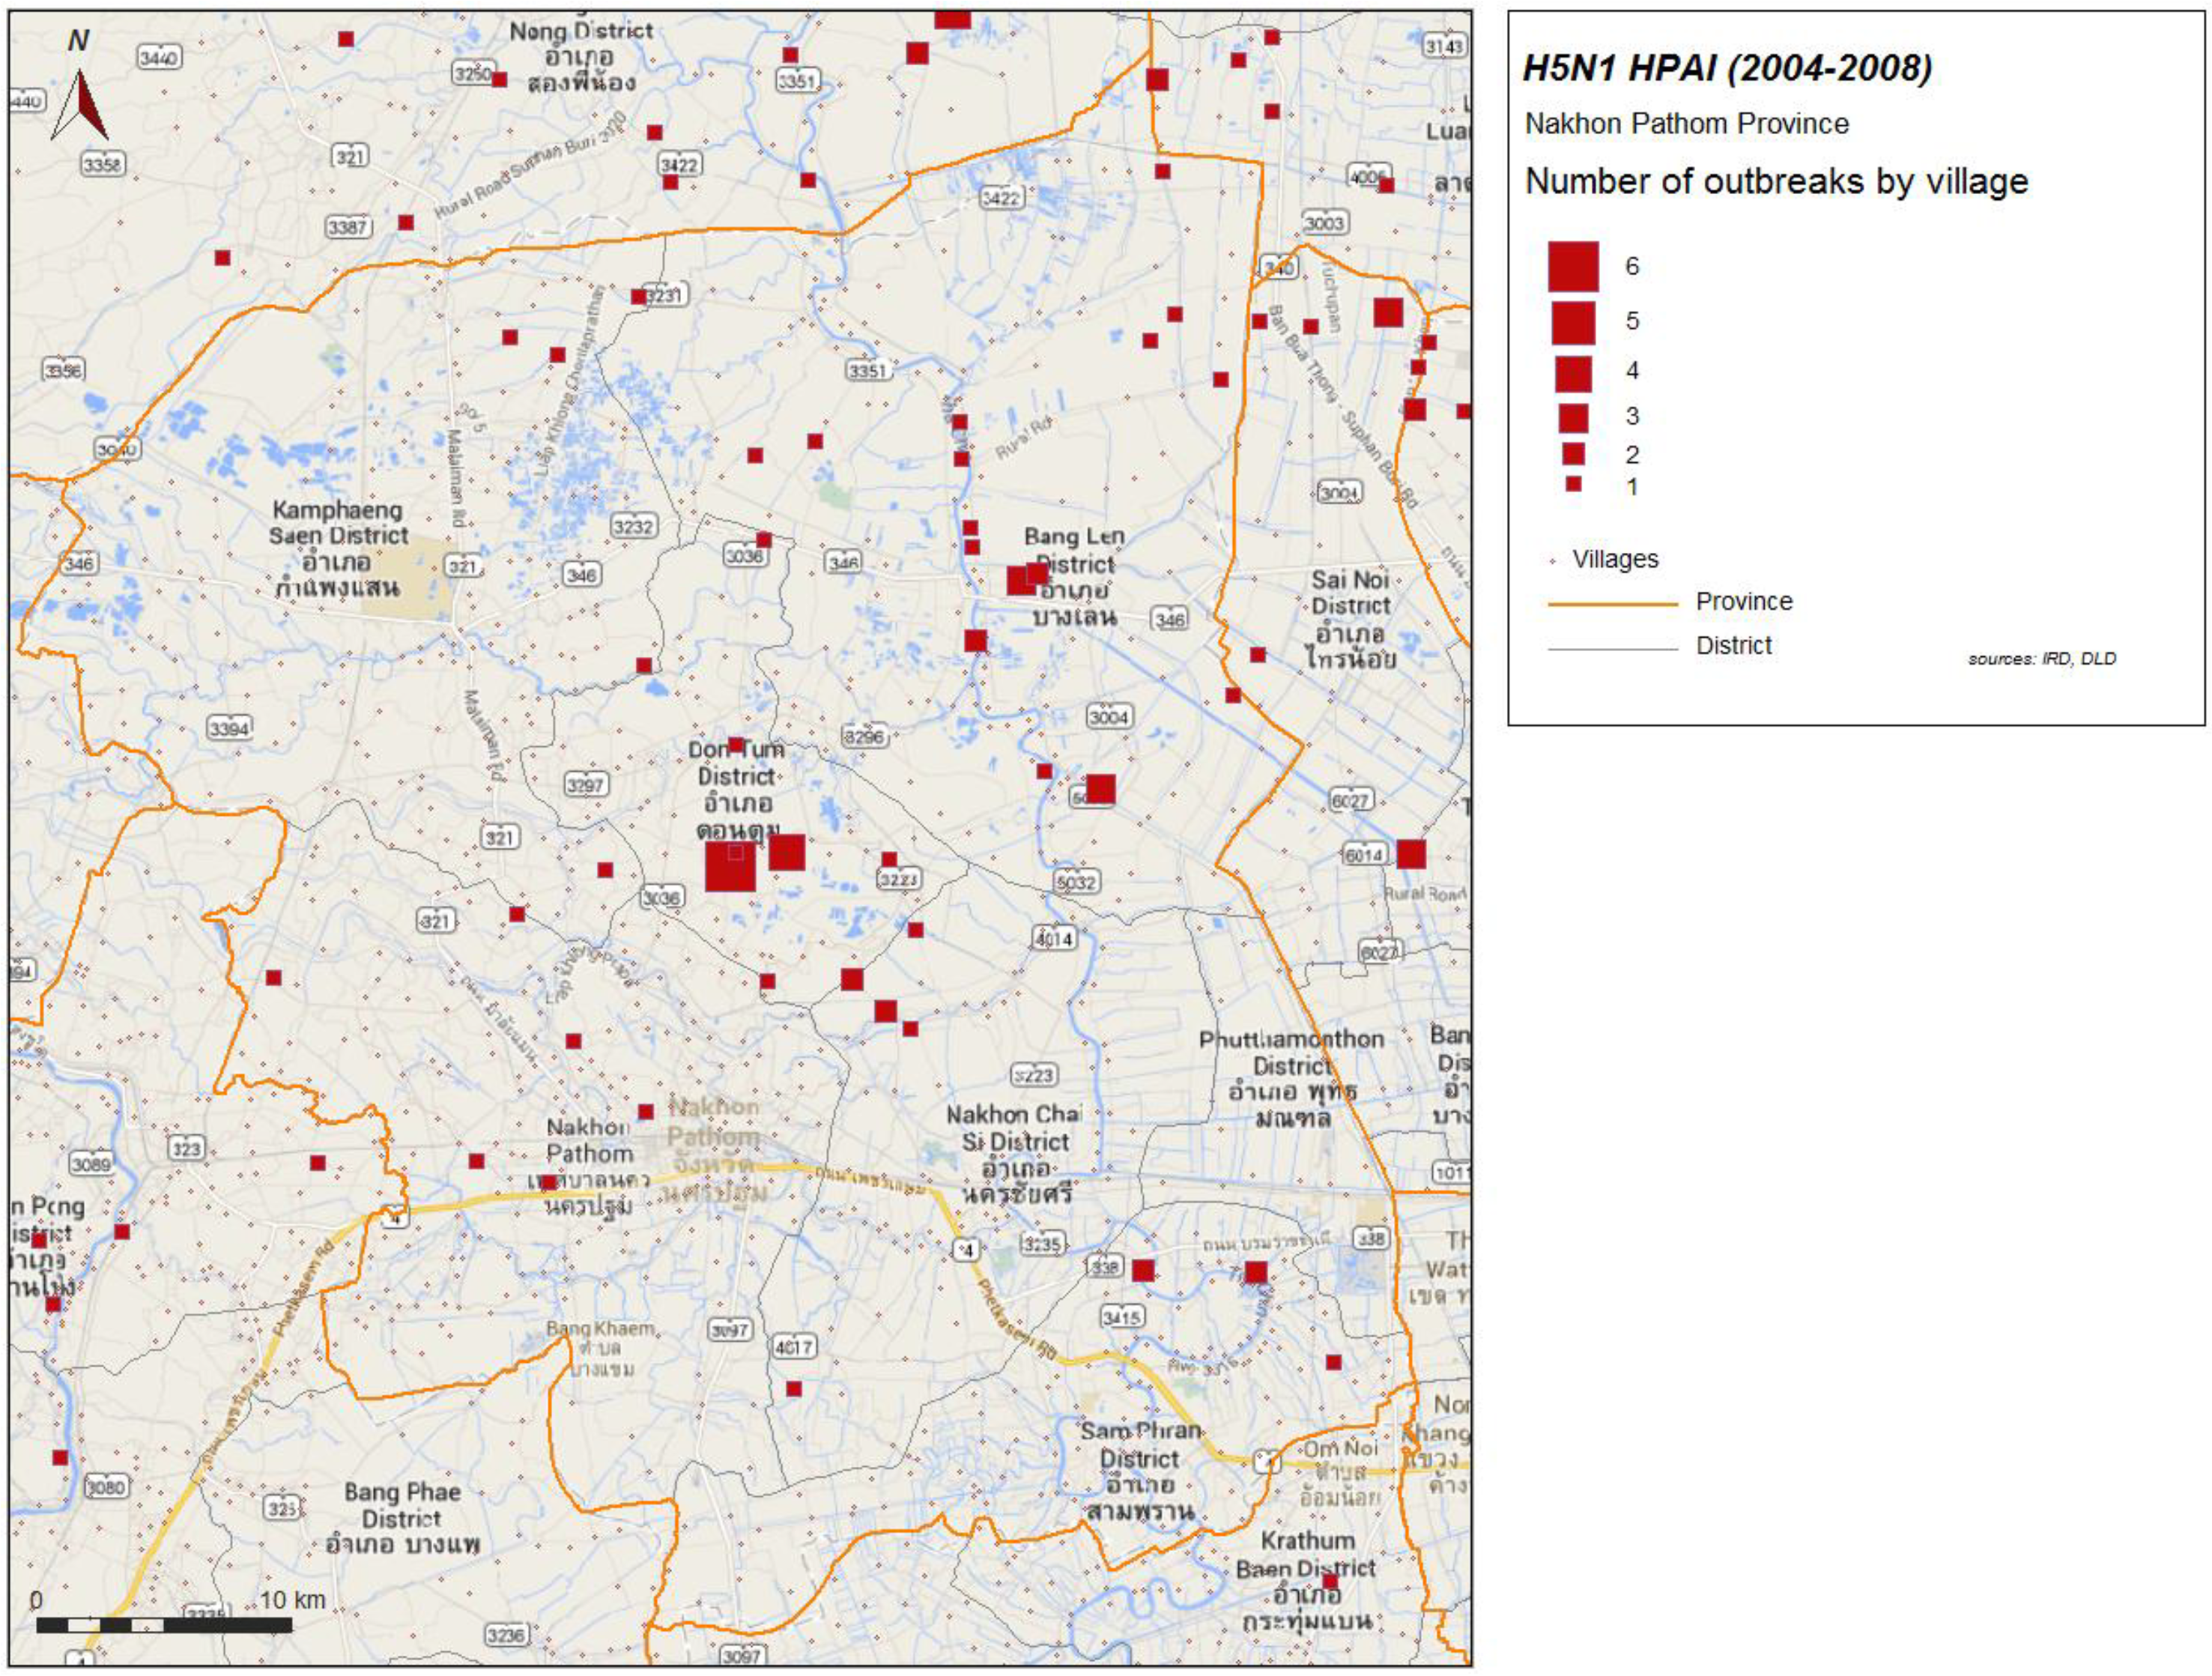
2.2. HPAI in the Nakhon Pathom Province, 2004–2008


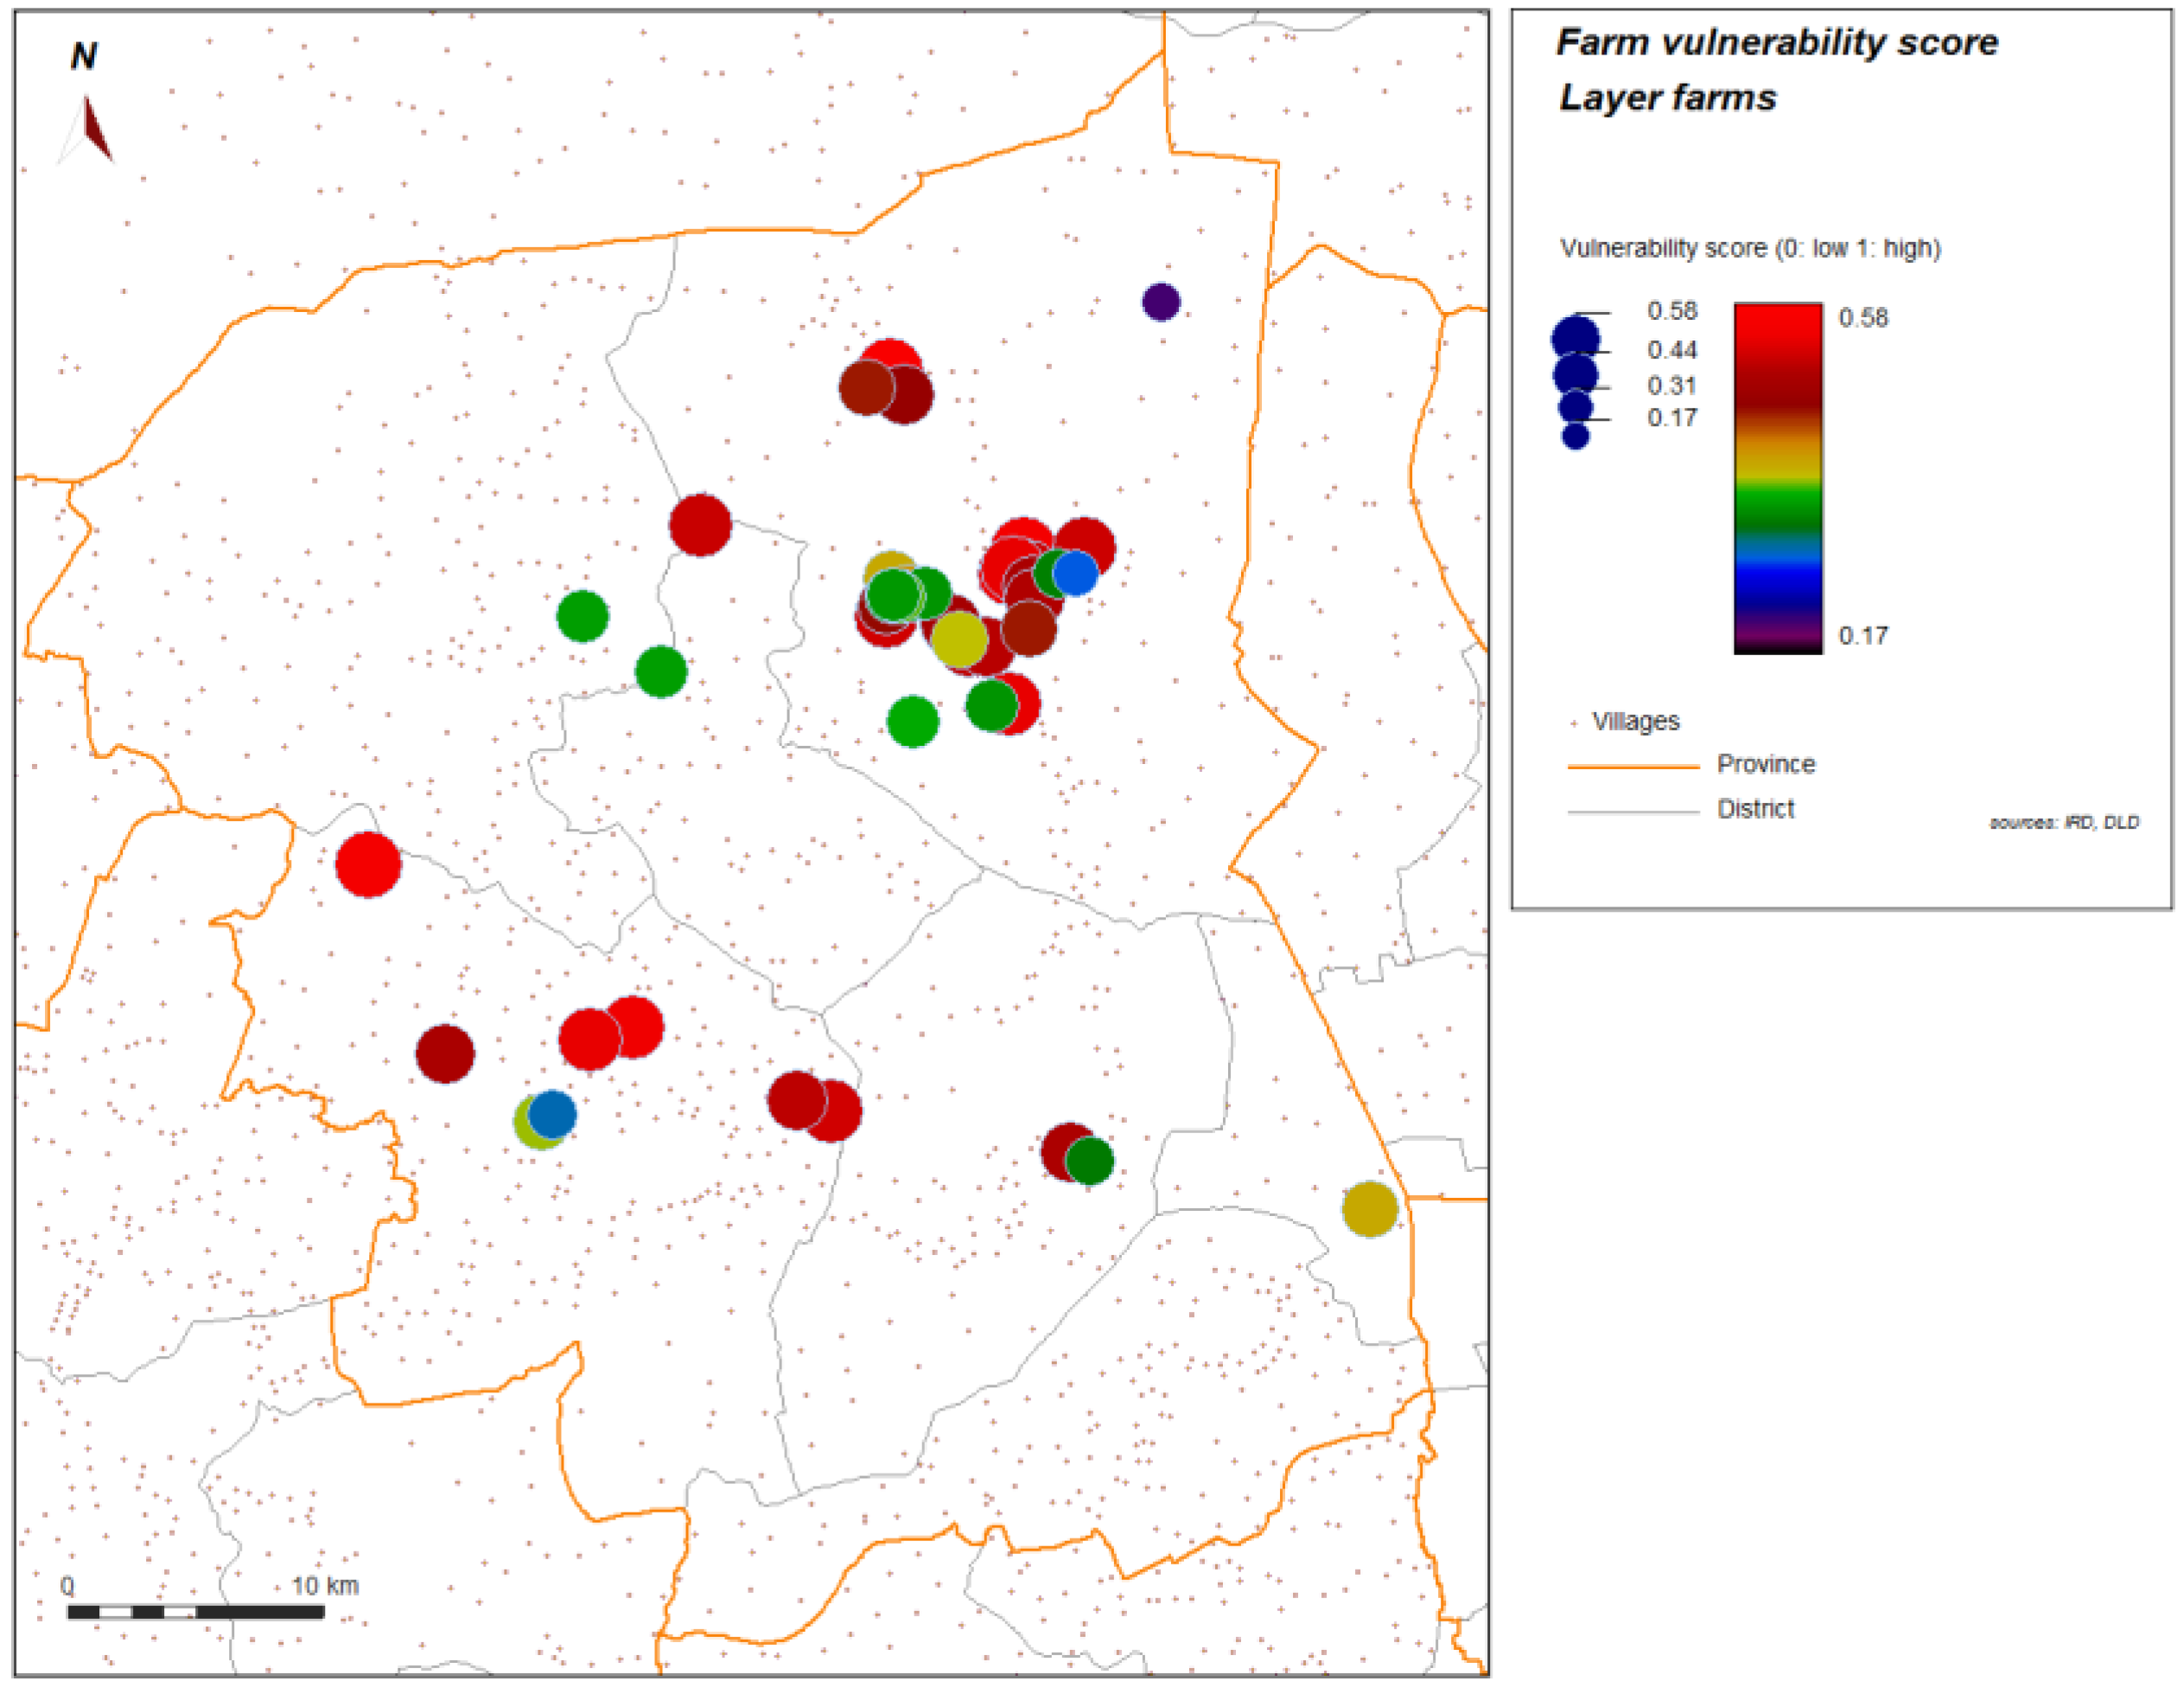
2.3. Vulnerability Factors, Vulnerability Scores, Statistical and Spatial Analysis
- Cat. 1: general condition of the farm, environmental and geographical description, environmental and farm condition, animal health and poultry welfare management;
- Cat. 2: agricultural and agro-commercial practice, slaughtering and selling bird on the farm, to who birds are sold, who organize transports, frequency of transport, “all-in-all-out” practice, restocking time;
- Cat. 3: bio-security measures and farm management, including transports, restocking practice, manure utilization, water management, rodent and insect control, frequency of disinfection, workers routine and hygiene practice, contact between farms;
- Cat. 4: agro-commercial practice of layers farms: egg transportation, disinfection of egg trays, percentages of sale direct to contractors, sale through aggregators;
- Cat. 5: knowledge of the local farmer’s regarding HPAI and verification of their commitment to HPAI risk management;

| n° | Factors of Vulnerability | Category * | Weight ** |
|---|---|---|---|
| 1 | Distance to main road less than 50 m | 1 | 7 |
| 2 | No fence at all around the farm | 1 | 9 |
| 3 | Easy entry to the farm | 1 | 8 |
| 4 | A pond is on the farm or next to the farm | 1 | 6 |
| 5 | Open air house on fish pond | 1 | 6 |
| 6 | Dead fowl used as animal food | 2 | 6 |
| 7 | Sale of dead birds | 2 | 9 |
| 8 | Carcass of dead birds throw away | 2 | 7 |
| 9 | Domestic cats and dogs living on the farm | 1 | 4 |
| 10 | Stray dogs/cats on farm | 1 | 8 |
| 11 | Backyard poultry on the farm | 1 | 9 |
| 12 | Presence of other birds | 1 | 5 |
| 13 | Fighting cocks on the farm | 1 | 4 |
| 14 | Presence of exotic birds in cage | 1 | 2 |
| 15 | Presence of other farm animals (pigs, cow, horse, rabbit, boar) | 2 | 4 |
| 16 | Frog breeding on the farm | 2 | 2 |
| 17 | No rodent control | 3 | 6 |
| 18 | No use of insecticides | 3 | 4 |
| 19 | Outsider are permitted to enter the farm | 3 | 9 |
| 20 | Frequent entry/exit from farm more than two times per day | 3 | 9 |
| 21 | Workers do not have working clothing | 3 | 9 |
| 22 | Same employees work on several units on the same farm | 3 | 5 |
| 23 | No farm disinfection | 3 | 9 |
| 24 | Disinfectant barrier at farm entrance does not exist | 3 | 9 |
| 25 | Footbath next to poultry house does not exist | 3 | 8 |
| 26 | Vehicles are not disinfected before entering | 3 | 9 |
| 27 | Dealers/Drivers free movement without changing clothes | 3 | 9 |
| 28 | Poultry houses are not disinfected at end of production | 3 | 9 |
| 29 | Different age groups in same building (no all in/all out) | 2 | 9 |
| 30 | Pond water used for animal drinking | 1 | 7 |
| 31 | Manure not properly stored | 3 | 5 |
| 32 | Manure used as animal feed | 2 | 3 |
| 33 | Use of wet and fresh litter | 2 | 7 |
| 34 | Not daily cleaning of rearing equipment | 3 | 4 |
| 35 | Cleaning of equipment only at the end of production cycle | 3 | 6 |
| 36 | Food delivered by different suppliers | 2 | 7 |
| 37 | Easy access to food storage for rodents and wild birds | 1 | 8 |
| 38 | Poultry sold to trader | 2 | 9 |
| 39 | Restocking before 14 days gap | 3 | 9 |
| 40 | Slaughtering on the farm without proper hygiene facilities | 3 | 3 |
| 41 | Egg trays not disinfected at the farm | 4 | 6 |
| 42 | Eggs are sold on the farm to villagers | 4 | 7 |
| 43 | Eggs sold to different dealers | 4 | 9 |
| 44 | Farmers are not informed about AI | 5 | 9 |
| 45 | Farmers are not concerned about AI as dangerous disease | 5 | 9 |

- A score for each category (management and environmental conditions, agricultural practices, bio-security measures, security measures related to egg production, knowledge of the farmer);
- An overall score of vulnerability considering all variables but eliminating variables related to egg production in layer and meat farms;
- An overall score of vulnerability considering all variables including variables related to egg production. Although variables associated with the eggs production are vulnerability factors for the farms producing eggs and are not relevant for farms producing birds, they were included in the calculation of the overall indicator of vulnerability: egg production increases the potential vulnerability with more potentially “at risk” practices and behaviors.
2.4. Ethics Statement
3. Results and Discussion
3.1. Results
| n° | Vulnerability factors | All farms | Sdt. Dev. | Meat farms | Layer farms | Chicken farms | Duck farms |
|---|---|---|---|---|---|---|---|
| 1 | Distance to main road less than 50 m | 0.18 | 0.38 | 0.16 | 0.22 | 0.18 | 0.18 |
| 2 | No fence at all around the farm | 0.03 | 0.18 | 0.04 | 0.02 | 0.05 | 0.00 |
| 3 | Easy entry to the farm | 0.76 | 0.43 | 0.74 | 0.82 | 0.73 | 0.86 |
| 4 | A pond is on the farm or next to the farm | 0.75 | 0.43 | 0.68 | 0.92 | 0.69 | 0.93 |
| 5 | Open air house on fish pond | 0.11 | 0.31 | 0.12 | 0.06 | 0.14 | 0.02 |
| 6 | Dead fowl used as animal food | 0.53 | 0.50 | 0.50 | 0.57 | 0.50 | 0.59 |
| 7 | Sale of dead birds | 0.01 | 0.11 | 0.01 | 0.00 | 0.02 | 0.00 |
| 8 | Carcass of dead birds throw away | 0.08 | 0.27 | 0.08 | 0.08 | 0.09 | 0.07 |
| 9 | Domestic cats and dogs living on the farm | 0.84 | 0.37 | 0.82 | 0.88 | 0.89 | 0.68 |
| 10 | Stray dogs/cats on farm | 0.27 | 0.45 | 0.32 | 0.14 | 0.26 | 0.32 |
| 11 | Backyard poultry on the farm | 0.18 | 0.38 | 0.15 | 0.26 | 0.16 | 0.25 |
| 12 | Presence of other birds | 1.00 | 0.00 | 1.00 | 1.00 | 1.00 | 1.00 |
| 13 | Fighting cocks on the farm | 0.05 | 0.22 | 0.06 | 0.02 | 0.05 | 0.07 |
| 14 | Presence of exotic birds in cage | 0.04 | 0.20 | 0.05 | 0.02 | 0.04 | 0.05 |
| 15 | Presence of other farm animals (pigs, cow, horse, rabbit, boar) | 0.26 | 0.44 | 0.26 | 0.24 | 0.29 | 0.18 |
| 16 | Frog breeding on the farm | 0.05 | 0.210 | 0.06 | 0.02 | 0.06 | 0.00 |
| 17 | No rodent control | 0.14 | 0.35 | 0.10 | 0.26 | 0.12 | 0.20 |
| 18 | No use of insecticides | 0.94 | 0.23 | 0.95 | 0.89 | 0.94 | 0.95 |
| 19 | Outsider are permitted to enter the farm | 0.37 | 0.48 | 0.31 | 0.51 | 0.34 | 0.45 |
| 20 | Frequent entry/exit from farm more than two times per day | 0.67 | 0.47 | 0.60 | 0.84 | 0.66 | 0.70 |
| 21 | Workers do not have working clothing | 0.93 | 0.25 | 0.94 | 0.90 | 0.92 | 0.95 |
| 22 | Same employees work on several units on the same farm | 0.38 | 0.49 | 0.48 | 0.14 | 0.38 | 0.39 |
| 23 | No farm disinfection | 0.41 | 0.49 | 0.37 | 0.51 | 0.38 | 0.50 |
| 24 | Disinfectant barrier at farm entrance does not exist | 0.94 | 0.24 | 0.93 | 0.96 | 0.91 | 1.00 |
| 25 | Footbath next to poultry house does not exist | 0.97 | 0.17 | 0.98 | 0.96 | 0.96 | 1.00 |
| 26 | Vehicles are not disinfected before entering | 0.55 | 0.50 | 0.50 | 0.67 | 0.51 | 0.66 |
| 27 | Dealers/Drivers free movement without changing clothes | 1.00 | 0.00 | 1.00 | 1.00 | 1.00 | 1.00 |
| 28 | Poultry houses are not disinfected at end of production | 0.02 | 0.13 | 0.01 | 0.04 | 0.01 | 0.05 |
| 29 | Different age groups in same building (no all in/all out) | 0.02 | 0.13 | 0.01 | 0.04 | 0.01 | 0.05 |
| 30 | Pond water used for animal drinking | 0.04 | 0.20 | 0.01 | 0.12 | 0.00 | 0.16 |
| 31 | Manure not properly stored | 0.03 | 0.18 | 0.02 | 0.08 | 0.02 | 0.07 |
| 32 | Manure used as animal feed | 0.57 | 0.50 | 0.56 | 0.61 | 0.70 | 0.23 |
| 33 | Use of wet and fresh litter | 0.29 | 0.46 | 0.15 | 0.67 | 0.31 | 0.25 |
| 34 | Not daily cleaning of rearing equipment | 0.27 | 0.44 | 0.27 | 0.26 | 0.34 | 0.05 |
| 35 | Cleaning of equipment only at the end of production cycle | 0.27 | 0.44 | 0.27 | 0.26 | 0.34 | 0.05 |
| 36 | Food delivered by different suppliers | 0.07 | 0.25 | 0.07 | 0.06 | 0.07 | 0.07 |
| 37 | Easy access to food storage for rodents and wild birds | 0.83 | 0.38 | 0.86 | 0.73 | 0.78 | 0.95 |
| 38 | Poultry sold to trader | 0.39 | 0.49 | 0.35 | 0.49 | 0.39 | 0.39 |
| 39 | Restocking before 14 days gap | 0.22 | 0.42 | 0.25 | 0.16 | 0.27 | 0.09 |
| 40 | Slaughtering on the farm without proper hygiene facilities | 0.04 | 0.20 | 0.06 | 0.00 | 0.05 | 0.00 |
| 41 | Egg trays not disinfected at the farm | 0.10 | 0.31 | 0.00 | 0.37 | 0.05 | 0.27 |
| 42 | Eggs are sold on the farm to villagers | 0.21 | 0.41 | 0.00 | 0.73 | 0.19 | 0.27 |
| 43 | Eggs sold to different dealers | 0.15 | 0.36 | 0.00 | 0.51 | 0.14 | 0.18 |
| 44 | Farmers are not informed about AI | 0.01 | 0.13 | 0.01 | 0.02 | 0.01 | 0.05 |
| 45 | Farmers are not concerned about AI as dangerous disease | 0.63 | 0.48 | 0.72 | 0.41 | 0.64 | 0.59 |
| Vulnerability Score Category | Min. | Max. | Mean | Median | Sdt. Dev. |
|---|---|---|---|---|---|
| General characteristics of the farm | 0.11 | 0.66 | 0.39 | 0.37 | 0.11 |
| Agricultural and commercial practices | 0 | 0.54 | 0.20 | 0.19 | 0.12 |
| Biosecurity measures, farm management | 0.25 | 0.79 | 0.52 | 0.52 | 0.10 |
| Layers farms practices | 0 | 1 | 0.16 | 0 | 0.29 |
| AI farmer knowledge | 0 | 0.5 | 0.32 | 0.5 | 0.24 |
| Global score | 0.17 | 0.58 | 0.38 | 0.37 | 0.07 |
| Vulnerability Score Category | Meat * | Layer | p-value (T) | OR | Chi2 |
|---|---|---|---|---|---|
| General characteristics of the farm | 0.38 | 0.40 | 0.17 | 1.32 [0.52, 3.31] | 0.34 |
| Agricultural and commercial practices | 0.18 | 0.27 | 0.00005 | 3.77 [1.63, 8.69] | 10 |
| Biosecurity measures, farm management | 0.51 | 0.55 | 0.001 | 5.64 [2.27, 14.01] | 16 |
| AI farmer knowledge | 0.37 | 0.21 | 0.00006 | 0.27 [0.14, 0.54] | 14 |
| Global score | 0.36 | 0.43 | <0.000001 | 13.24 [4.12, 42.51] | 27 |
| Score w/t cat. 4 | 0.39 | 0.42 | 0.0006 | 5.53 [2.29, 13.32] | 16 |
| Vulnerability Score Category | Chicken * | Duck | p-value (T) | OR (Ajusted) | Chi2 (MH) |
|---|---|---|---|---|---|
| General characteristics of the farm | 0.37 | 0.43 | 0.0028 | 1.25 [0.46, 3.43] | 0.15 |
| Agricultural and commercial practices | 0.21 | 0.18 | 0.056 | 1.35 [0.55, 3.32] | 0.31 |
| Biosecurity measures, farm management | 0.51 | 0.53 | 0.19 | 0.81 [0.27, 2.44] | 0.22 |
| Layers farms practices | 0.13 | 0.23 | 0.006 | 0.93 [0.28, 3.10] | 0.01 |
| AI farmer knowledge | 0.32 | 0.32 | 0.42 | 1.09 [0.51, 2.32] | 0.05 |
| Global score | 0.38 | 0.40 | 0.03 | 1.41 [0.65, 3.06] | 0.81 |
| Score w/t cat. 4 (Layers farms practices) | 0.39 | 0.41 | 0.08 | 2.28 [0.89, 5.86] | 3.06 |
| Vulnerability Score | All | Meat | Layer | p-value (F *) | ||
|---|---|---|---|---|---|---|
| Chicken | Duck | Chicken | Duck | |||
| General characteristics of the farm | 0.39 | 0.37 | 0.42 | 0.38 | 0.44 | 0.046 |
| Agricultural and commercial practices | 0.20 | 0.19 | 0.15 | 0.28 | 0.24 | 0.00003 |
| Biosecurity measures, farm management | 0.52 | 0.51 | 0.50 | 0.53 | 0.58 | 0.02 |
| Layers farms practices | 0.16 | 0.00 | 0.00 | 0.50 | 0.62 | <0.00001 |
| AI farmer knowledge | 0.32 | 0.36 | 0.37 | 0.21 | 0.22 | 0.002 |
| Global score | 0.38 | 0.36 | 0.36 | 0.42 | 0.46 | <0.00001 |
| Score w/t cat.4 (Layers farms practices) | 0.40 | 0.39 | 0.39 | 0.41 | 0.44 | 0.02 |


3.2. Discussion
4. Conclusions
Acknowledgments
Author Contributions
Conflicts of Interest
References
- OIE. Update on Highly Pathogenic Avian Influenza in Animals (Type H5 and H7). 2013. Available online: http://www.oie.int/en/animal-health-in-the-world/update-on-avian-influenza (accessed on 24 December 2013).
- Souris, M.; Gonzalez, J.P.; Shanmugasundaram, J.; Corvest, V.; Kittayapong, P. Retrospective space-time analysis of H5N1 Avian Influenza emergence in Thailand. Int. J. Health Geogr. 2010, 9. [Google Scholar] [CrossRef]
- Rushton, J.; Viscarra, R.; Bleich, E.G.; McLeod, A. Impact of Avian Influenza Outbreaks in the Poultry Sectors of Five South East Asian Countries (Cambodia, Indonesia, Lao PDR, Thailand, Vietnam) Outbreak Costs, Responses and Potential Long Term Control. In TCP/RAS/3010; FAO: Rome, Italy, 2007; Volume 10, pp. 1–25. [Google Scholar]
- Beaudoin, A.L.; Kitikoon, P.; Schreiner, P.J.; Singer, R.S.; Sasipreeyajan, J.; Amonsin, A.; Gramer, M.R.; Pakinsee, S.; Bender, J.B. Risk factors for exposure to influenza a viruses, including subtype H5 viruses, in Thai free-grazing ducks. Transbound. Emerg. Dis. 2012. [Google Scholar] [CrossRef]
- Costales, A. Thailand Poultry Sector Brief. In Food and Agriculture Organization; PPLPF: Rome, Italy, 2002. [Google Scholar]
- Recommendations on the Prevention, Control and Eradication of Highly Pathogenic Avian Influenza (HPAI) in Asia; FAO: Rome, Italy, 2004.
- Tiensin, T.; Chaitaweesub, P.; Songserm, T.; Chaisingh, A.; Hoonsuwan, W.; Buranathai, C.; Parakamawongsa, T.; Premashthira, S.; Amonsin, A.; Gilbert, M.; et al. Highly pathogenic avian influenza H5N1, Thailand, 2004. Emerg. Infect. Dis. 2005, 11, 1664–1672. [Google Scholar] [CrossRef]
- Gilbert, M.; Chaitaweesub, P.; Parakamawongsa, T.; Premashthira, S.; Tiensin, T.; Kalpravidh, W.; Wagner, H.; Slingenbergh, J. Free-grazing ducks and highly pathogenic avian influenza, Thailand. Emerg. Infect. Dis. 2006, 12, 227–234. [Google Scholar] [CrossRef]
- Paul, M.; Wongnarkpet, S.; Gasqui, P.; Poolkhet, C.; Thongratsakul, S.; Ducrot, C.; Roger, F. Risk factors for highly pathogenic avian influenza (HPAI) H5N1 infection in backyard chicken farms, Thailand. Acta Trop. 2011, 118, 209–216. [Google Scholar] [CrossRef]
- Keawcharoen, J.; Broek, J.; Bouma, A.; Tiensin, T.; Osterhaus, A.; Heesterbeek, H. Wild birds and increased transmission of highly pathogenic avian influenza (H5N1) among poultry, Thailand. Emerg. Infect. Dis. 2011, 17, 1016–1022. [Google Scholar]
- Tiensin, T.; Nielen, M.; Vernooij, H.; Songserm, T.; Kalpravidh, W.; Chotiprasatintara, S.; Chaisingh, A.; Wongkasemjit, S.; Chanachai, K.; Thanapongtham, W.; et al. Transmission of the highly pathogenic avian influenza virus H5N1 within Flocks during the 2004 epidemic in Thailand. J. Infect. Dis. 2007, 196, 1679–1684. [Google Scholar] [CrossRef]
- Avian Influenza Situations and Control Measures; Department of Livestock Development (DLD): Bangkok, Thailand, 2004.
- Ranong, V.N. Structural changes in Thailand’s poultry sector: avian influenza and its aftermath. TDRI Quart. Rev. 2008, 23, 3–10. [Google Scholar]
- Wei, H.; Aengwanich, W. Biosecurity evaluation of Poultry Production Clusters (PPCs) in Thailand. Int. J. Poult. Sci. 2012, 11, 582–588. [Google Scholar] [CrossRef]
- Chantong, W.; Kaneene, J.B. Poultry raising systems and highly pathogenic avian influenza outbreaks in Thailand: the situation, associations, and impacts. Southeast Asia. J. Trop. Med. Public Health 2011, 42, 596–608. [Google Scholar]
- Bouyer, G.; Hémon, D.; Cordier, S.; Derriernnic, F.; Stücker, I.; Stengel, B.; Clavel, J. Epidemiologie, Principles et Methods Quantitative; Les Editions INSERM: Paris, France, 1995. [Google Scholar]
- Pfeiffer, D.; Robinson, T.; Stevenson, M.; Stevens, K.; Rogers, D.; Clements, A. Spatial Analysis in Epidemiology; Oxford University Press: Oxford, UK, 2008. [Google Scholar]
- Souris, M.; Bichaud, L. Statistical methods for bivariate spatial analysis in marked points. Example in spatial epidemiology. Spat. Spatio-Temporal Epidemiol. 2011, 2, 227–234. [Google Scholar] [CrossRef]
- Kulldorff, M. A spatial scan statistic. Commun. Statist.—Theor. Method. 1997, 26, 1481–1496. [Google Scholar] [CrossRef]
- SavGIS Geographic Information System. Available online: www.savgis.org (accessed on 24 December 2013).
- Heft-Neal, S.; Otte, J.; Pupphavessa, W.; Roland-Holst, D.; Sudsawasd, S.; Zilberman, D. Supply Chain Auditing for Poultry Production in Thailand. In Pro-poor Livestock Policy Initiative Research Report; FAO: Rome, Italy, 2008. [Google Scholar]
- Glover, D.; Kusterer, K. Small Farmers, Big Business: Contract Farming and Rural Development; St. Martin’s Press: New York, NY, USA, 1990. [Google Scholar]
- FAO/OIE/WHO. Consultation on Avian Influenza and Human Health: Risk Reduction Measures in Producing, Marketing, and Living with Animals in Asia; FAO: Rome, Italy, 2005. [Google Scholar]
- Webster, R.G.; Yakhno, M.; Hinshaw, V.S.; Bean, W.J.; Murti, K.G. Intestinal influenza: Replication and characterization of influenza viruses in ducks. Virology 1978, 84, 268–278. [Google Scholar] [CrossRef]
- Utterback, W. Update on Avian Influenza through February 21 1984 in Pennsylvania and Virginia. In Proceedings of the 33rd Western Poultry Disease Conference, University of California, Davis, CA, USA, 27–29 February 1984; pp. 4–7.
- Feare, C.J. Fish Farming and the Risk of Spread of Avian Influenza; WildWings Bird Management, BirdLife International: Cambridge, UK, 2006; p. 11. Available online: http://www.naturecanada.ca/pdf/bli_fish_farming_review.pdf (accessed on 24 December 2013).
- Halvorson, D.A.; Karunakaran, D.; Newman, J.A. Avian influenza in caged laying chickens. Avian Dis. 1980, 24, 288–294. [Google Scholar] [CrossRef]
- Glass, S.E.; Naqi, S.A.; Grumbles, L.C. Isolation of avian influenza viruses in Texas. Avian Dis. 1981, 25, 545–549. [Google Scholar] [CrossRef]
- Delforge, I. Contract Farming in Thailand: A View from the Farm. In Occasional Paper 2, Focus on the Global South, CUSRI; Chulalongkorn University: Bangkok, Thailand, 2007. [Google Scholar]
- Thomas, M.E.; Bouma, A.; Ekker, H.M.; Fonken, A.J.; Stegeman, J.A.; Nielen, M. Risk factors for the introduction of high pathogenicity Avian Influenza virus into poultry farms during the epidemic in the Netherlands in 2003. Prev. Vet. Med. 2005, 69, 1–11. [Google Scholar] [CrossRef]
© 2014 by the authors; licensee MDPI, Basel, Switzerland. This article is an open access article distributed under the terms and conditions of the Creative Commons Attribution license (http://creativecommons.org/licenses/by/3.0/).
Share and Cite
Souris, M.; Selenic, D.; Khaklang, S.; Ninphanomchai, S.; Minet, G.; Gonzalez, J.-P.; Kittayapong, P. Poultry Farm Vulnerability and Risk of Avian Influenza Re-Emergence in Thailand. Int. J. Environ. Res. Public Health 2014, 11, 934-951. https://doi.org/10.3390/ijerph110100934
Souris M, Selenic D, Khaklang S, Ninphanomchai S, Minet G, Gonzalez J-P, Kittayapong P. Poultry Farm Vulnerability and Risk of Avian Influenza Re-Emergence in Thailand. International Journal of Environmental Research and Public Health. 2014; 11(1):934-951. https://doi.org/10.3390/ijerph110100934
Chicago/Turabian StyleSouris, Marc, Dubravka Selenic, Supaluk Khaklang, Suwannapa Ninphanomchai, Guy Minet, Jean-Paul Gonzalez, and Pattamaporn Kittayapong. 2014. "Poultry Farm Vulnerability and Risk of Avian Influenza Re-Emergence in Thailand" International Journal of Environmental Research and Public Health 11, no. 1: 934-951. https://doi.org/10.3390/ijerph110100934
APA StyleSouris, M., Selenic, D., Khaklang, S., Ninphanomchai, S., Minet, G., Gonzalez, J.-P., & Kittayapong, P. (2014). Poultry Farm Vulnerability and Risk of Avian Influenza Re-Emergence in Thailand. International Journal of Environmental Research and Public Health, 11(1), 934-951. https://doi.org/10.3390/ijerph110100934