Analysis of Phthalate Migration to Food Simulants in Plastic Containers during Microwave Operations

Abstract
:1. Introduction
2. Materials and Methods
2.1. Materials
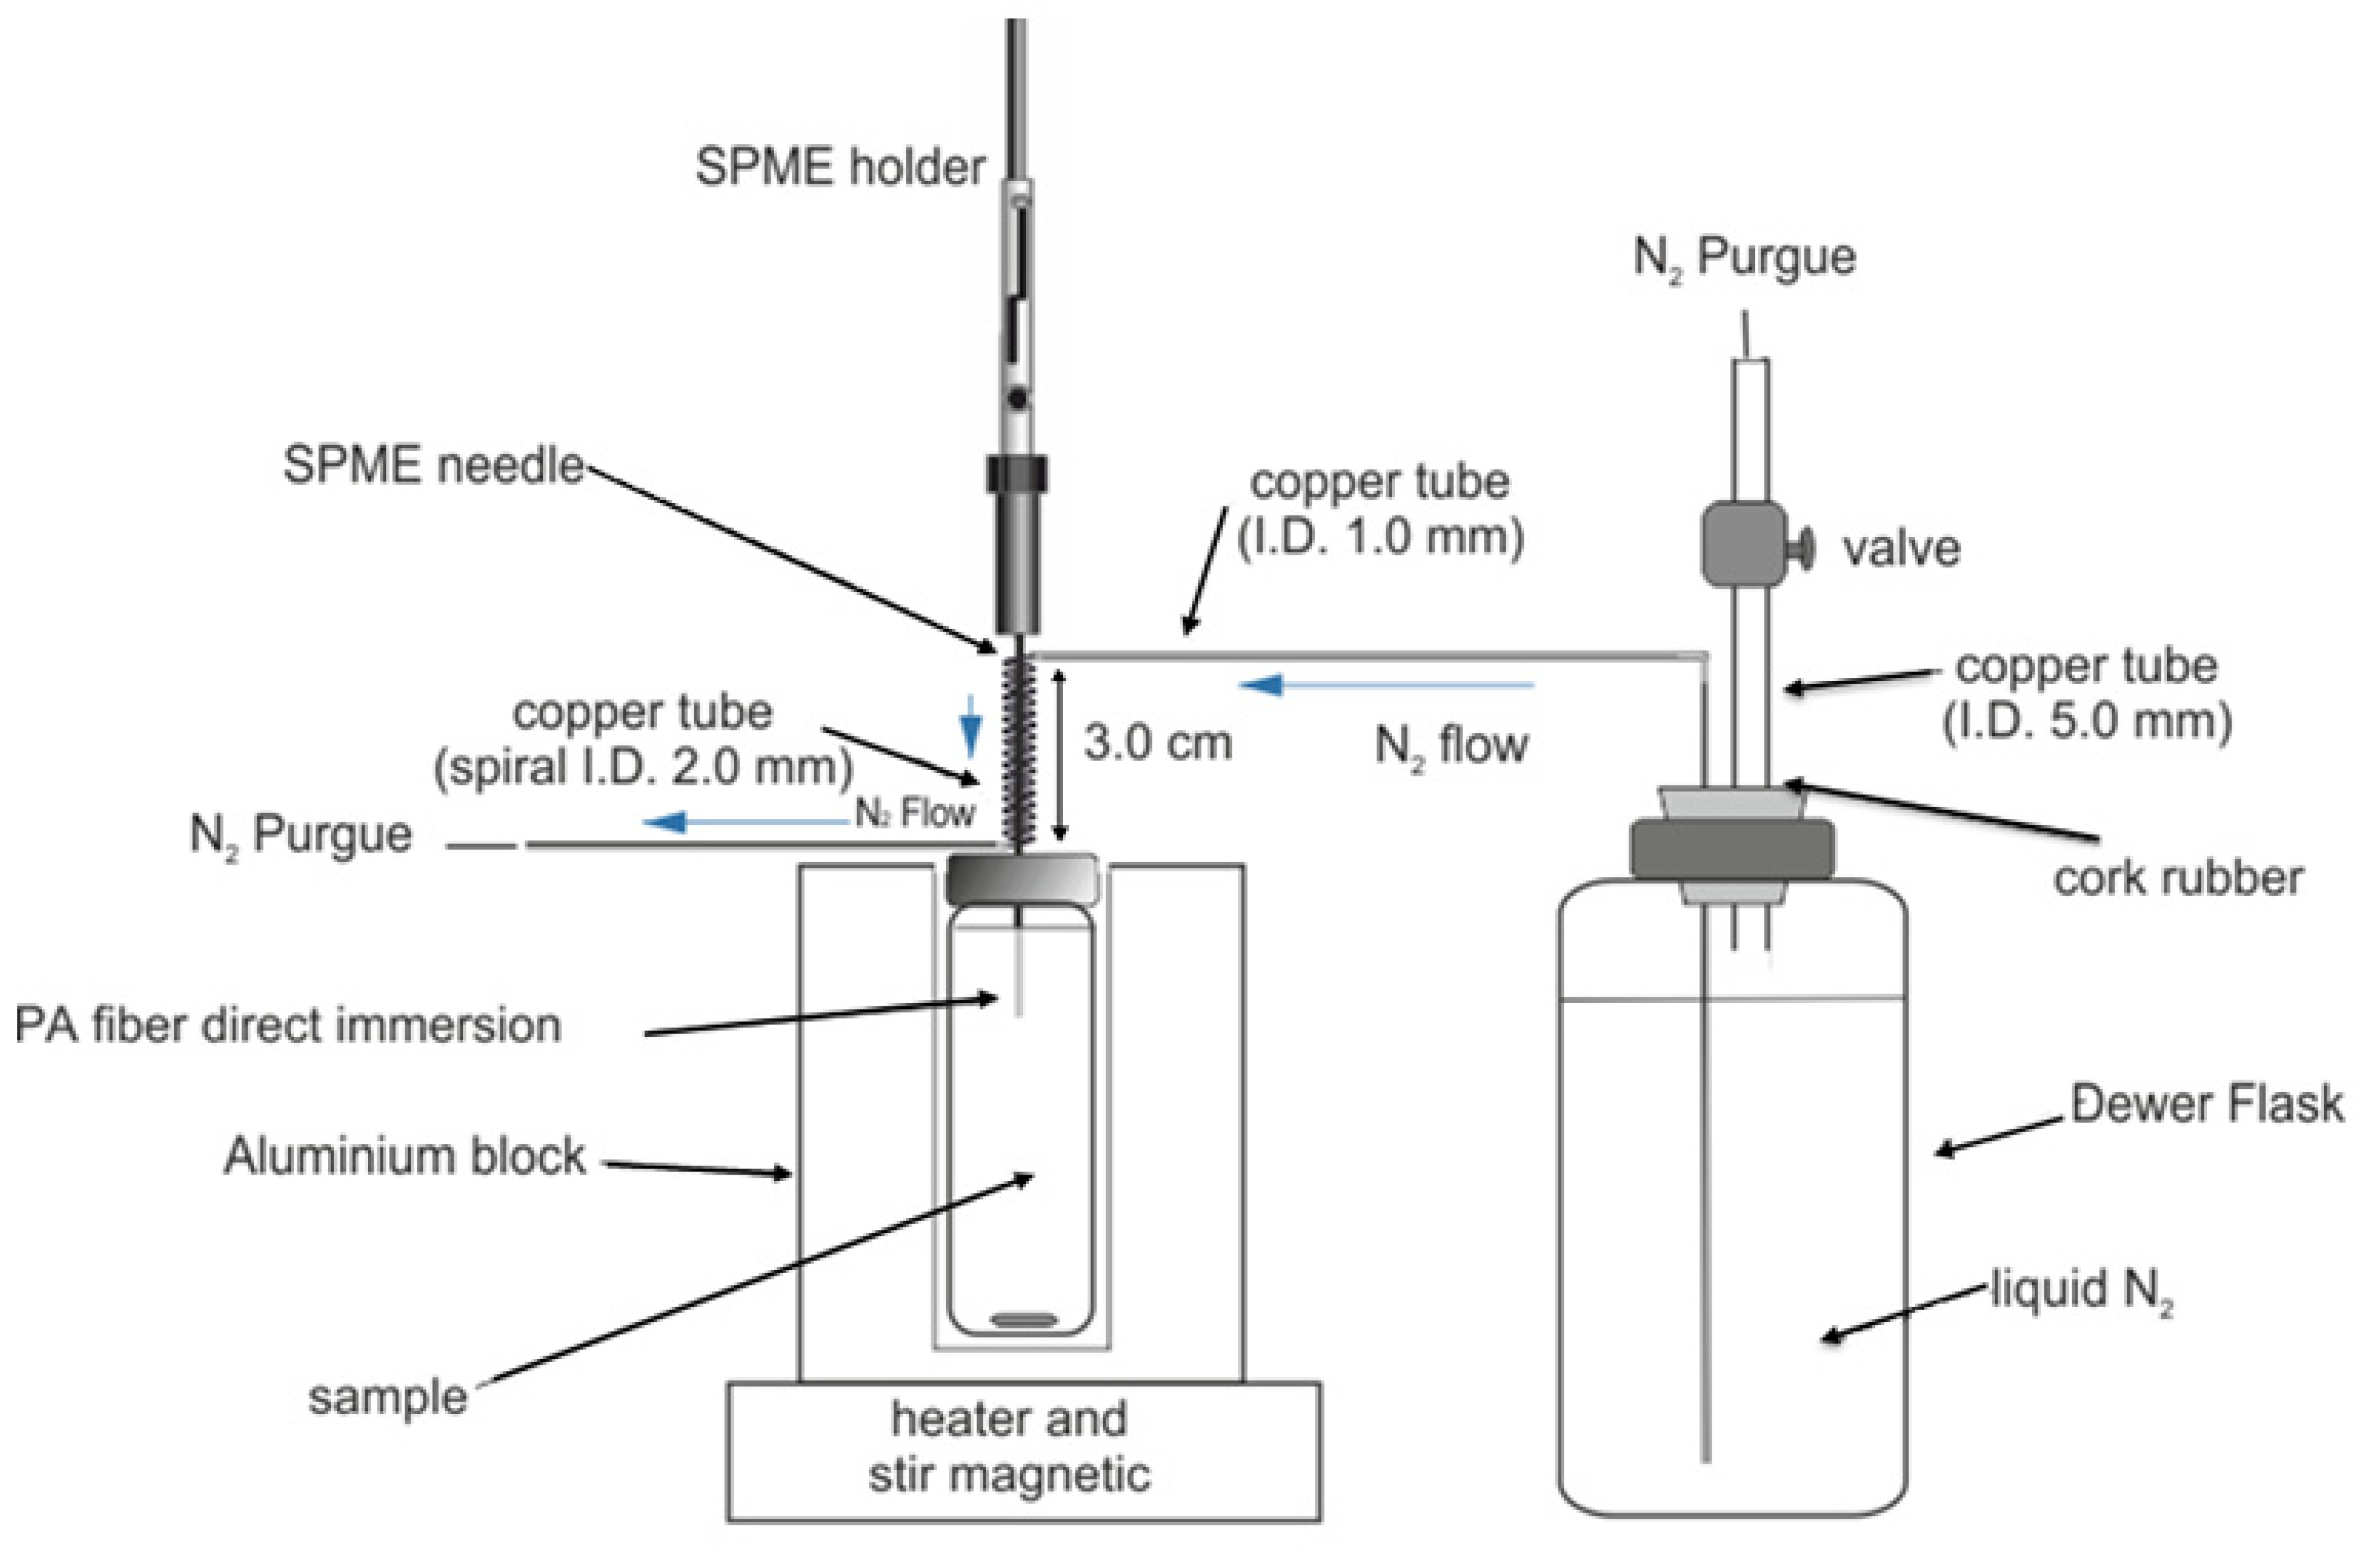
2.2. Extraction Method
2.3. Chromatographic System
2.4. Analysis Conditions

| Plastic Containers | Volume (mL) | Characteristics |
|---|---|---|
| A 1 | 750 | colorless, size: 10.5 cm (dm) × 11.0 cm (h) |
| B 1 | 500 | red translucent, size: 10.5 cm (dm) × 6.2 cm (h) |
| C 1 | 600 | colorless, size: 13.2 cm × 13.2 cm × 4.8 cm |
| D 1 | 1,200 | colorless, size: 12.6 cm × 12.6 cm × 11.0 cm |
| E 1 | 480 | colorless, size: 12.5 cm × 9.3 cm × 5.3 cm |
| F 2 | 600 | colorless, size: 13.0 cm × 13.0 cm × 4.7 cm |
| G 2 | 1,000 | colorless, size: 13.7 cm × 10.0 cm × 2.7 cm |
| H 2 | 600 | colorless, size: 11.2 cm (dm) × 6.6 cm (h) |
| I 2 | 1,200 | colorless, size: 22.0 cm × 15.0 cm × 4.6 cm |
| J 2 | 300 | colorless, size: 13.8 cm (dm) × 7.9 cm (h) |
3. Results and Discussion
3.1. Extraction Method
3.2. Analytical Validations
| Compound | Linear Range (µg/L) | Equation | SD Intercept | SD Slope | Coefficient of Determination (R2) |
|---|---|---|---|---|---|
| DBP | 0.2 to 6.0 | y = 55,438x + 14,941 | 5,007 | 1,354 | 0.9905 |
| BBP | 0.5 to 6.0 | y = 29,500x – 4,882.9 | 3,322 | 897 | 0.9854 |
| RSD—Intra-assay | RSD—Inter-assay | |||||
|---|---|---|---|---|---|---|
| 1.0 µg/L | 5.0 µg/L | 1.0 µg/L | 5.0 µg/L | |||
| % | % | |||||
| DBP | 11.7 | 7.6 | 11.9 | 8.2 | 0.08 | 0.2 |
| BBP | 16.2 | 11.0 | 22.3 | 13.9 | 0.31 | 0.5 |
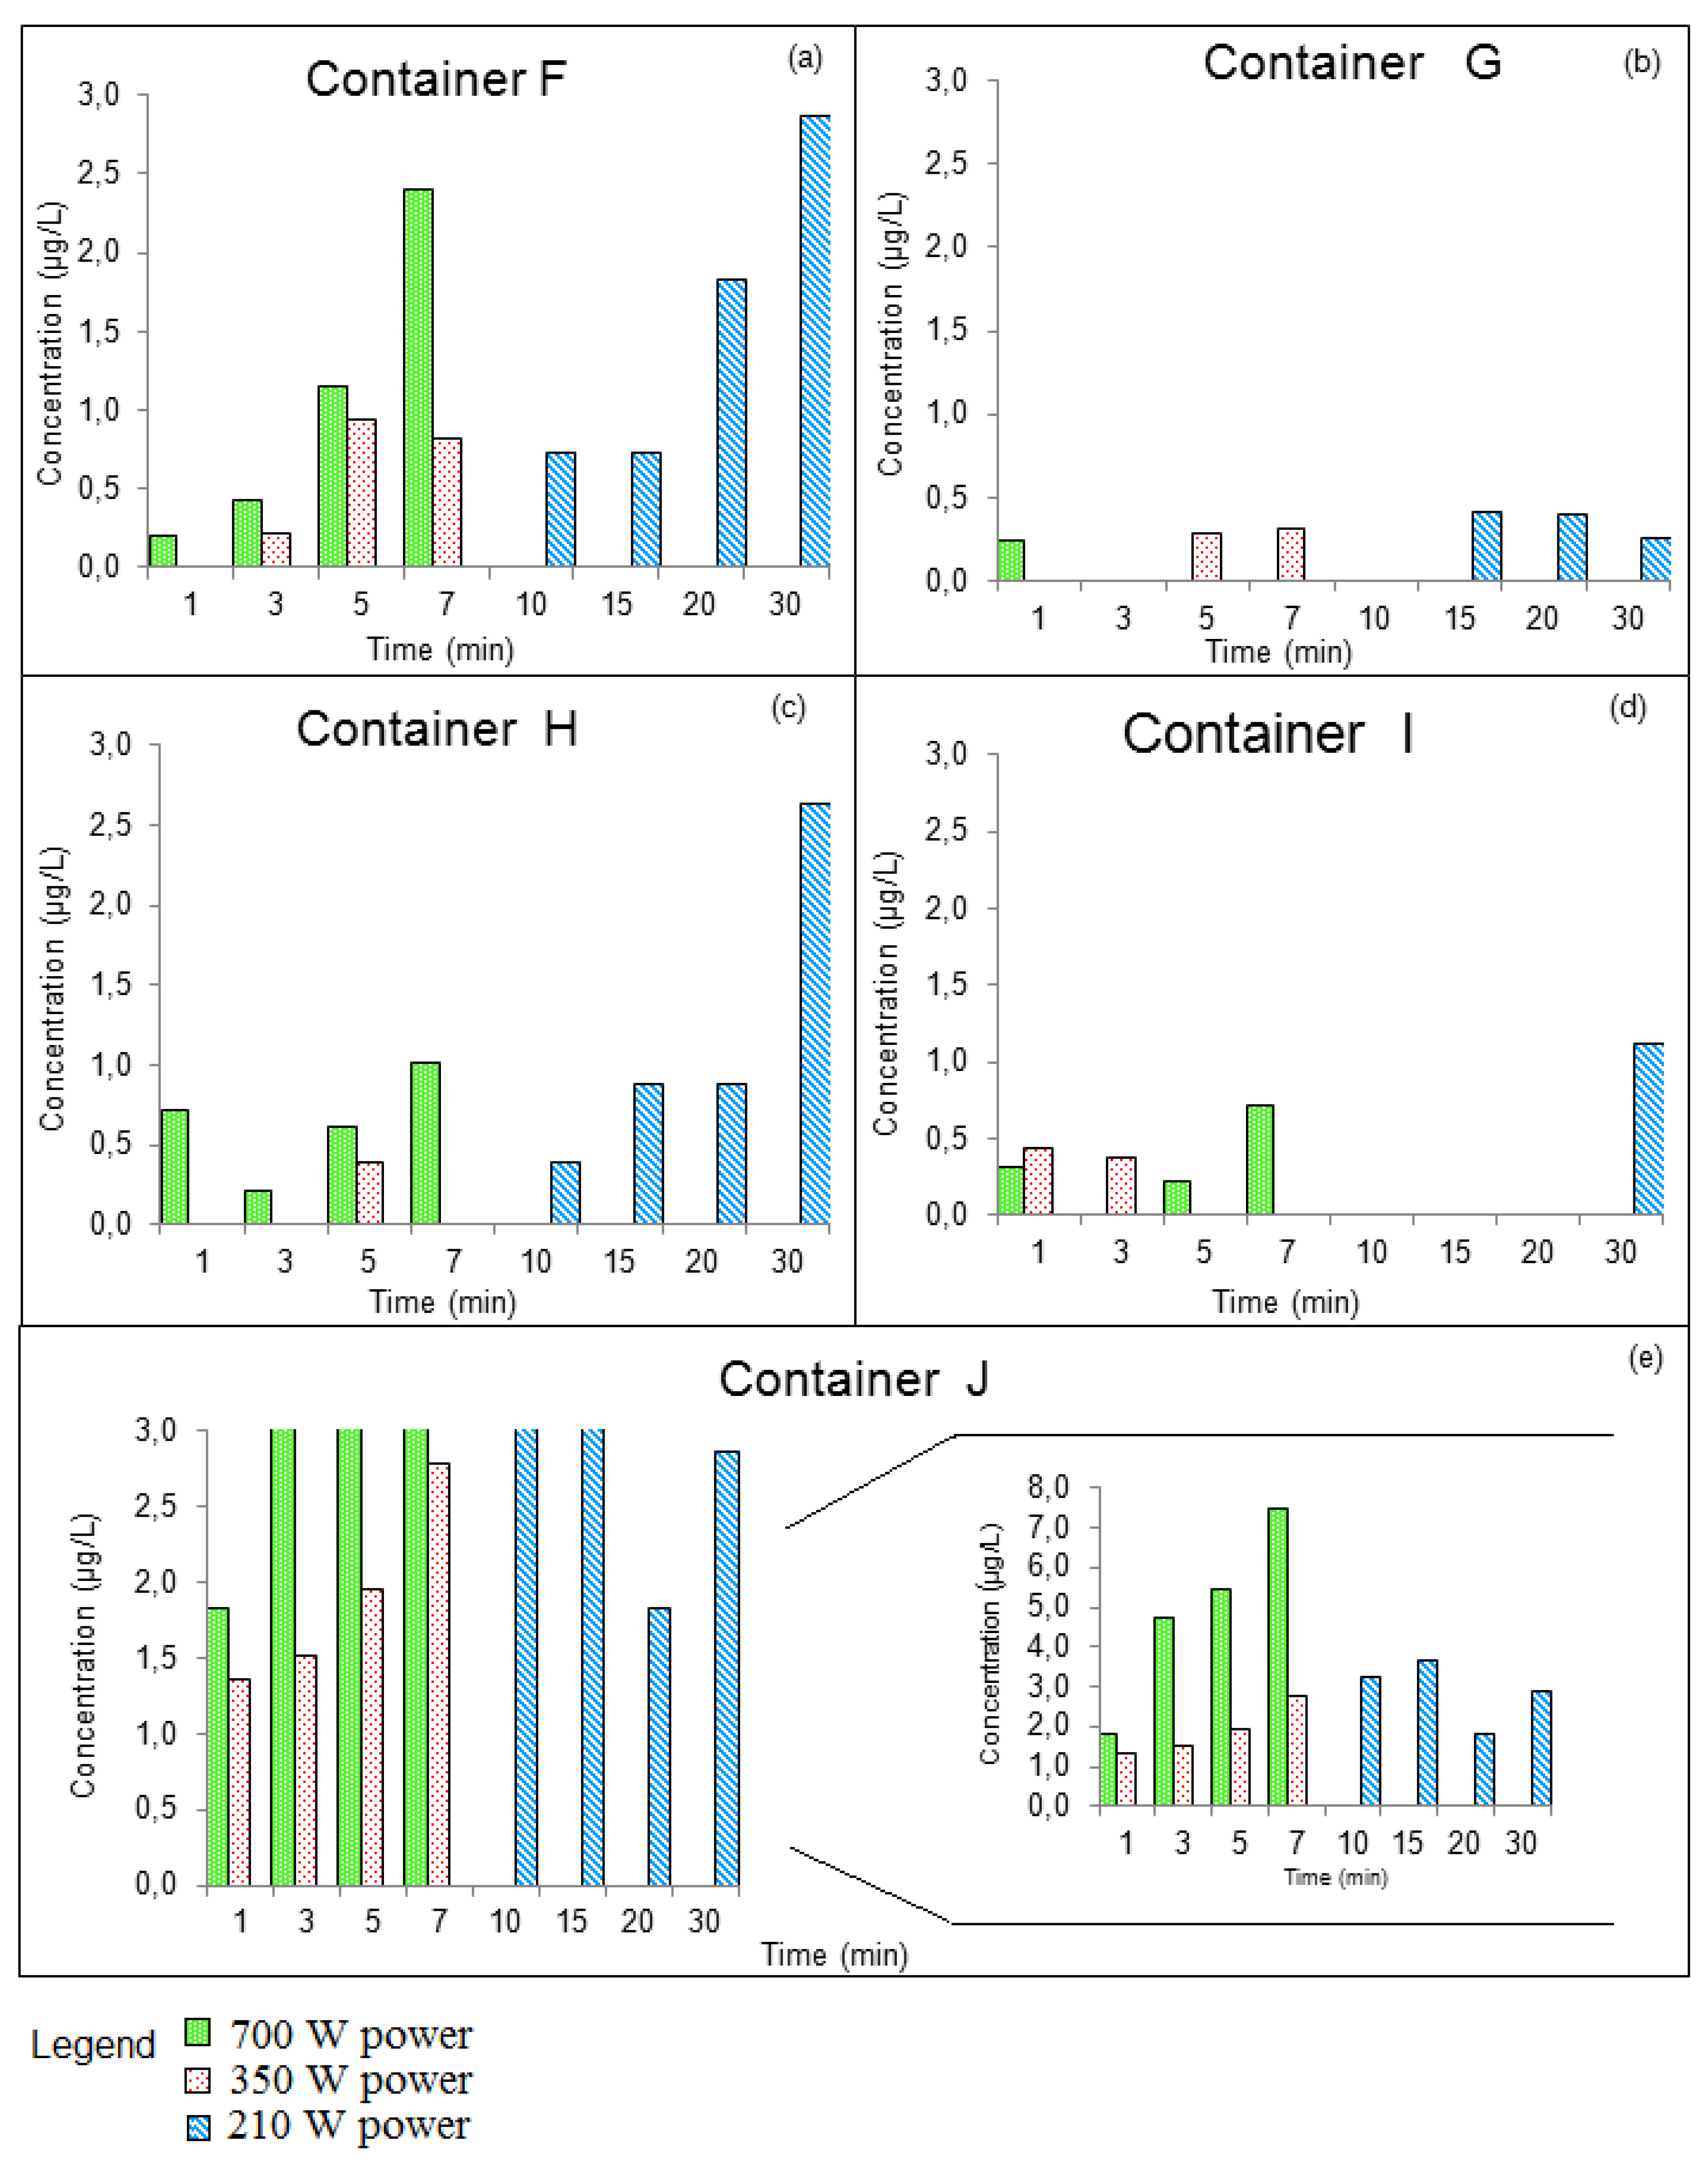
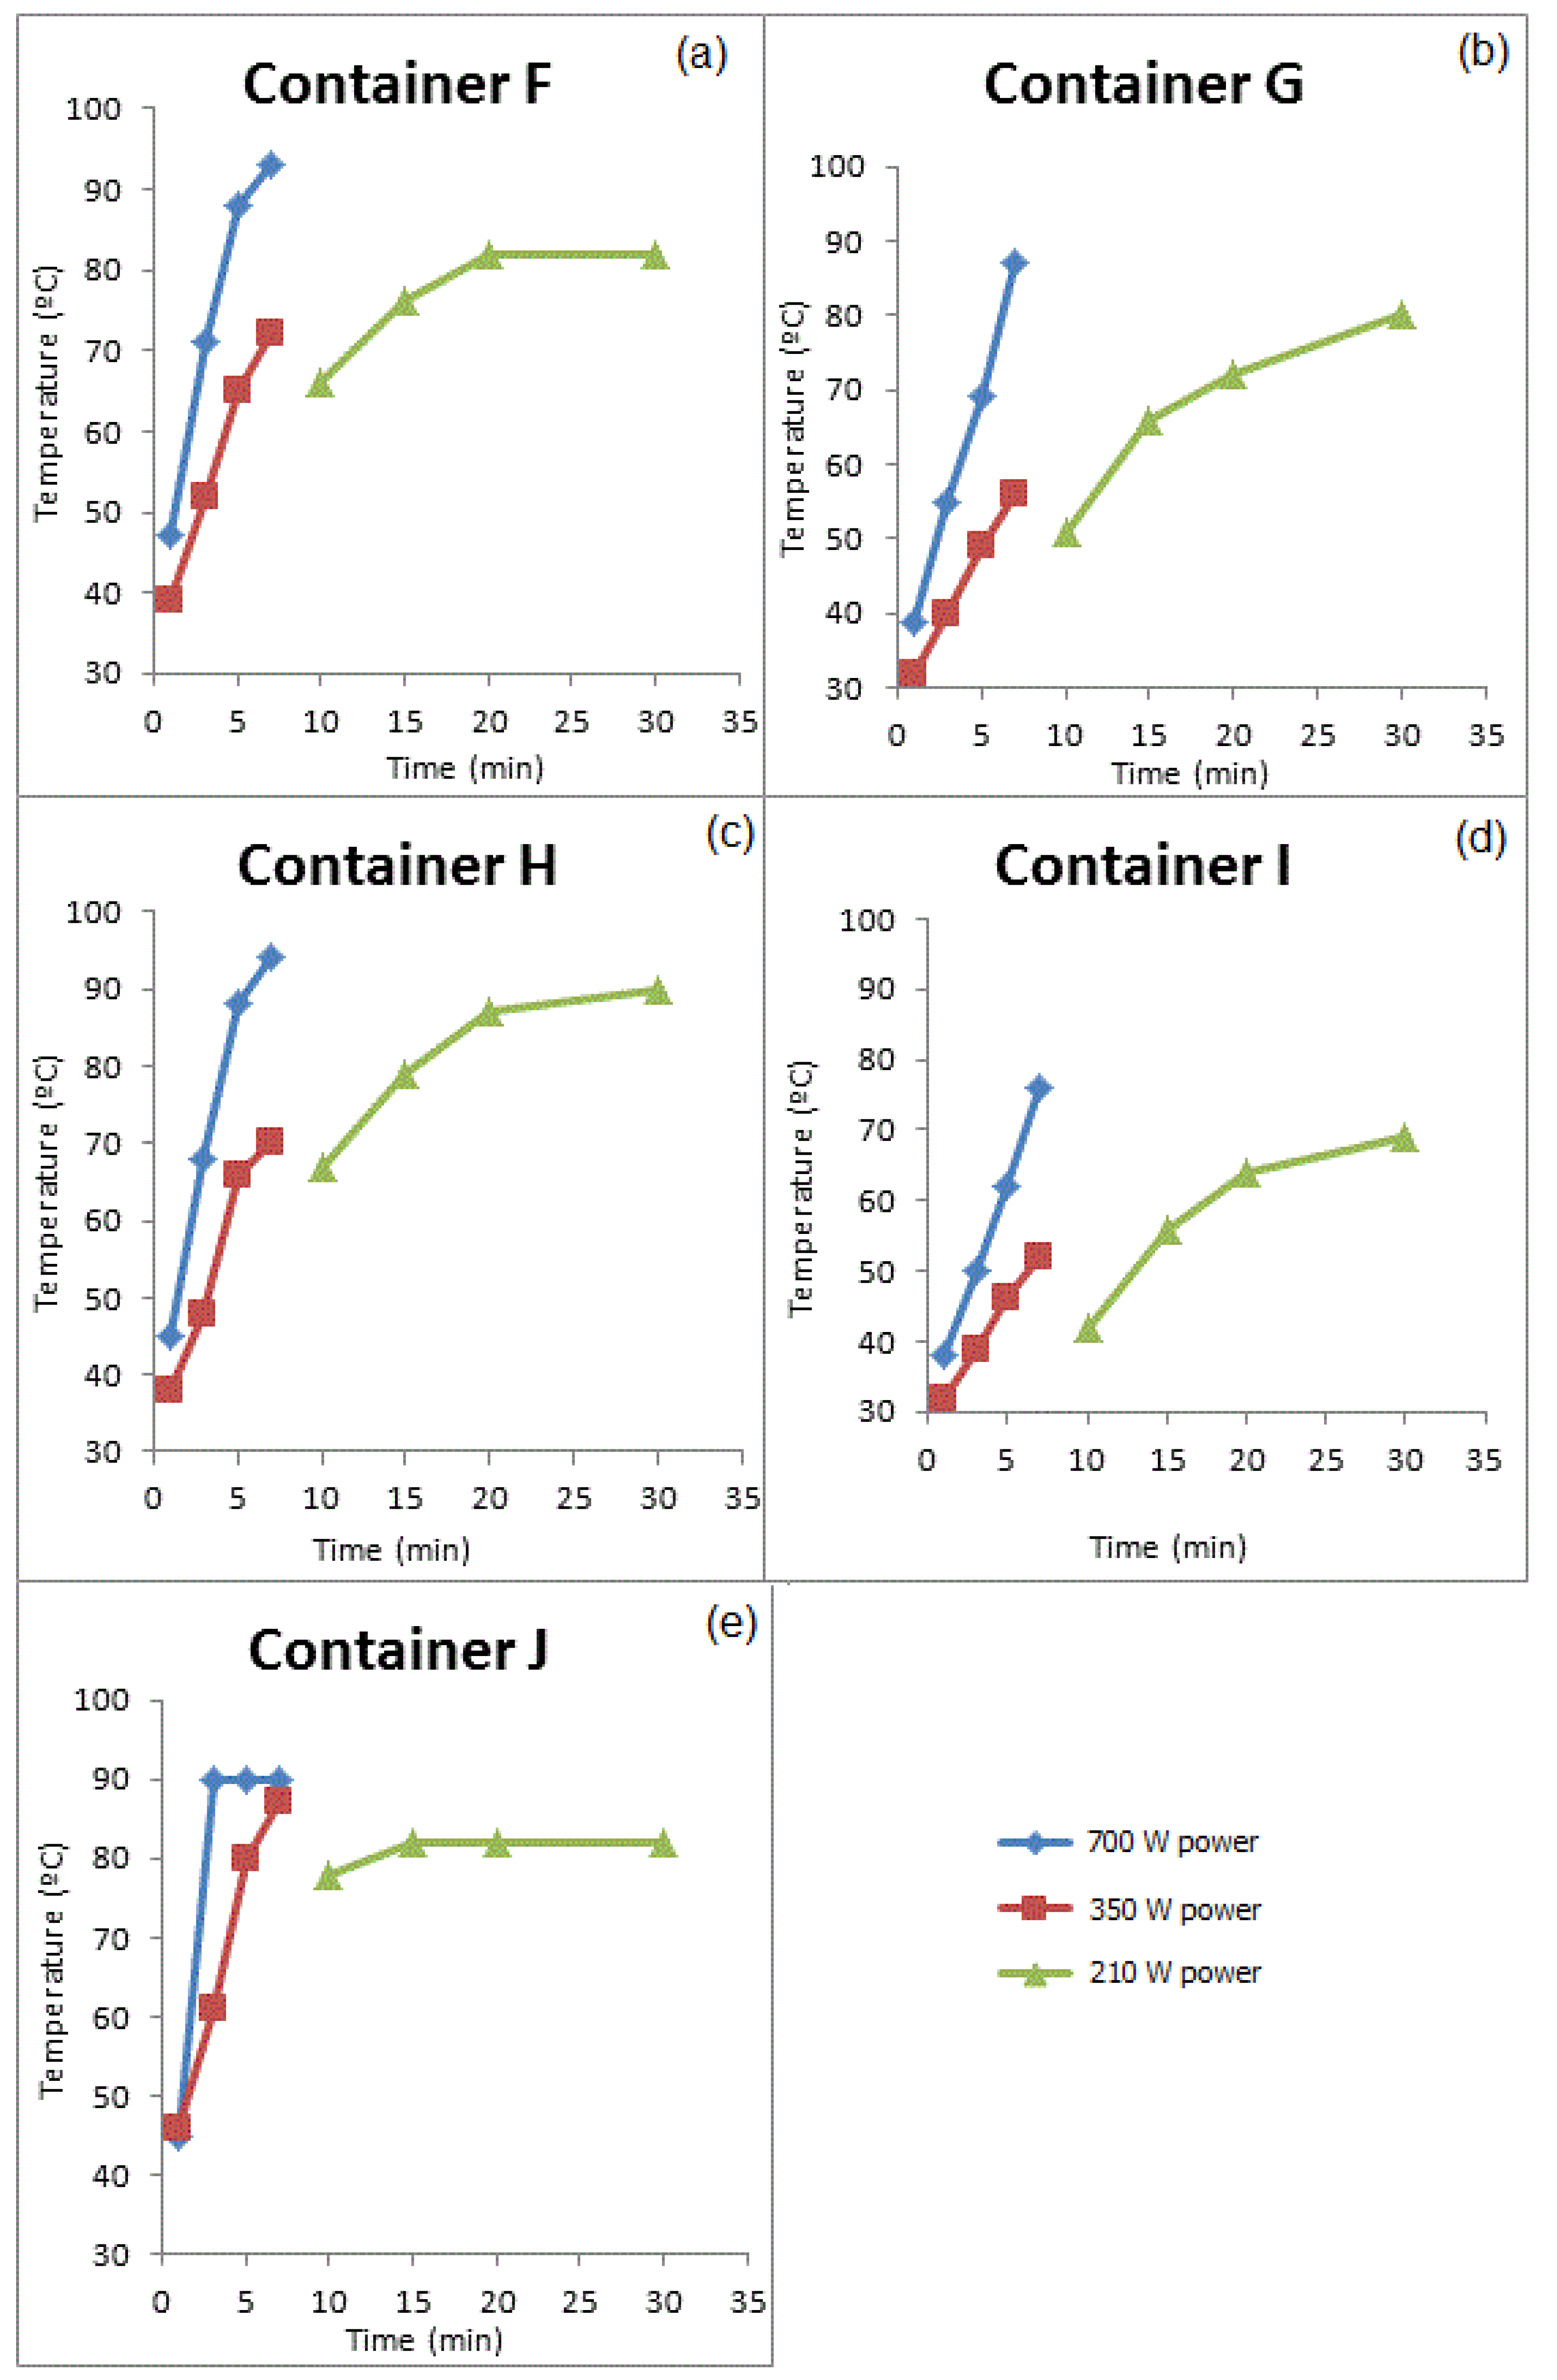
3.3. Concentration of Phthalates due to Migration from Plastic Containers Heated in a Microwave Oven
3.3.1. GROUP I: New Containers
3.3.2. GROUP II: Containers that Were Used for Prolonged Periods of Time

| Compounds | Concentration (µg/kg) | Samples | Method of Extraction | Instrumental | LOD | LOQ | Reference |
|---|---|---|---|---|---|---|---|
| DBP | 7.30 to 50.3 | Commercial whole milk | SPE (C18) | GC/MS | 0.09 | [37] | |
| BBP | 1.11 to 2.93 | 0.12 | — | ||||
| DEHP | 15.1 to 27.2 | 0.06 | |||||
| DBP | <LOD to 490 | Olive oil | Gel permeation chromatography | GC-MS/MS | [15] | ||
| BBP | <LOD to 1,750 | ||||||
| DEHP | <LOD to 4,700 | — | — | ||||
| DEHP | 22.8 to 270.3 | Cereals and legumes, Meat based, fish based, dairy, vegetables, condiments, fresh fruit, bread | LLE | GC-FID | — | — | [38] |
| DBP | 10.2 to 142.8 | ||||||
| DBP | <LOD to 244 (µg/L) | Wines | SPE | GC/MS | 18 (µg/L) | 29 (µg/L) | [16] |
| BBP | <LOD to 269 (µg/L) | 18 (µg/L) | 29 (µg/L) | ||||
| DEHP | <LOD to 276 (µg/L) | 15 (µg/L) | 24 (µg/L) | ||||
| DBP | 4.07 to 9.79 | Cow milk | HS-SPME | GC/MS | 0.02 a 072 | [17] | |
| BBP | <LOD | 0.23 a 4.7 | — | ||||
| DEHP | 8.40 to 282.90 | 0.31 a 3.3 | |||||
| DBP | 0.001 to 0.003 | Water (food simulant) | LLE | GC/MS, HPLC/UV-VIS and HPLC fluorescence | 2.0 ×10⁻³ | 5.0 ×10⁻³ | [20] |
| DBP | 32 and 24 (µg/L) | Water released from disposable PP soup bowl and PVDC wrap film | Hollow fiber microdialysis enrichment system | HPLC/UV | 0.4 (µg/L) | — | [28] |
| DEHP | 77 to 1643 | Commercial vegetable Oils | Direct injection of thediluted oil | GC/MS | 10 | 40 | [32] |
| DBP | 22 to 360 | 10 | 40 | ||||
| DBP | <LOD to 175 | Olive oil | SPME | GC/MS/MS | 30 | — | [29] |
| BBP | 87 to 211 | 30 | |||||
| DEHP | 198 a 840 | 30 | |||||
| DBP | <LOD to 9,840 | Plastic containers | Sonication-assisted extraction | GC/MS | 10 | — | [33] |
| BBP | <LOD to 9,980 | ||||||
| DEHP | <LOD to 1.76 × 10⁶ | ||||||
| DBP | <LOD | Bottled mineral water | AALLME | GC-FID | 0.37 (µg/L) | — | [39] |
| DEHP | 0.26 to 0.32 (µg/L) | 0.75 (µg/L) | |||||
| DBP | 0.32 to 0.51 (µg/L) | Bottled mineral water | LPME | GC/MS | 0.005 (µg/L) | — | [40] |
| BBP | <LOD | ||||||
| DEHP | 0.57 to 0.65 (µg/L) | 0.01 (µg/L) | |||||
| 0.02 (µg/L) | |||||||
| DBP | <LOD | Bottled mineral water | DLLME | GC/MS | 0.005 (µg/L) | — | [41] |
| BBP | <LOD | 0.002 (µg/L) | |||||
| DEHP | <LOD | 0.005 (µg/L) | |||||
| DBP | 0.2 to 7.5 | Water (food simulant) | SPME | GC/MS | 0.08 (µg/L) | 0.2 (µg/L) | This study |
| BBP | <LOD | 0.31 (µg/L) | 0.5 (µg/L) |
4. Conclusions
Acknowledgments
Conflicts of Interest
References
- Toxicity and Exposure Assessment for Children’s Health. Available online: http://www.epa.gov/teach/chem_summ/phthalates_summary.pdf (accessed on 3 November 2012).
- Fromme, H.; Kuchler, T.; Otto, T.; Pilz, K.; Muller, J.; Wenzel, A. Occurrence of phthalates and bisphenol A and F in the environment. Water Res. 2002, 36, 1429–1438. [Google Scholar] [CrossRef]
- Nerin, C.; Cacho, J.; Gancedo, P. Plasticizers from printing inks in a selection of food packagings and their migration to food. Food Addit. Contam. 1993, 10, 453–460. [Google Scholar]
- International Programme on Chemical Safety. Available online: http://whqlibdoc.who.int/hq/2002/WHO_PCS_EDC_02.2.pdf (accessed on 3 November 2012).
- Bila, D.M.; Dezotti, M. Endocrine disrupters in the environment: Part 1—Effects and consequences. Quim. Nova 2007, 30, 651–666. [Google Scholar] [CrossRef]
- Xia, H.; Chi, Y.; Qi, X.; Su, M.; Cao, Y.; Song, P.; Li, X.; Chen, T.; Zhao, A.; Zhang, Y.; Cao, Y.; Ma, X.; Jia, W. Metabolomic evaluation of di-n-butyl phthalate-induced teratogenesis in mice. Metabolomics 2011, 7, 559–571. [Google Scholar] [CrossRef]
- Arcadi, F.A.; Costa, C.; Imperatore, C.; Marchese, A.; Rapisarda, A.; Salemi, M.; Trimarchi, G.R.; Costa, G. Oral toxicity of bis(2-ethylhexyl) phthalate during pregnancy and suckling in the long-evans rat. Food Chem. Toxicol. 1998, 36, 963–970. [Google Scholar] [CrossRef]
- Schmidt, J.S.; Schaedlich, K.; Fiandanese, N.; Pocar, P.; Fischer, B. Effects of Di(2-ethylhexyl) Phthalate (DEHP) on Female Fertility and Adipogenesis in C3H/N Mice. Environ. Health Perspect. 2012, 120, 1123–1129. [Google Scholar] [CrossRef]
- Fredricsson, B.; Moller, L.; Pousette, A.; Westerholm, R. Human sperm motility is affected by plasticizers and diesel particle extracts. Pharmacol. Toxicol. 1993, 72, 128–133. [Google Scholar] [CrossRef]
- Kim, S.H.; Chun, S.; Jang, J.Y.; Chae, H.D.; Kim, C.H.; Kang, B.M. Increased plasma levels of phthalate esters in women with advanced-stage endometriosis: A prospective case-control study. Fertil. Steril. 2011, 95, 357–359. [Google Scholar] [CrossRef]
- Meeker, J.D.; Ferguson, K.K. Relationship between urinary phthalate and bisphenol a concentrations and serum thyroid measures in USA adults and adolescents from the national health and nutrition examination survey (NHANES) 2007–2008. Environ. Health Perspect. 2011, 119, 1396–1402. [Google Scholar] [CrossRef]
- European Food Safety Authority. Opinion of the Scientific Panel on food additives, flavourings, processing aids and materials in contact with food (AFC) related to di-Butylphthalate (DBP) for use in food contact materials. EFSA J. 2005, 242, 1–17. [Google Scholar]
- European Food Safety Authority. Opinion of the Scientific Panel on food additives, flavourings, processing aids and materials in contact with food (AFC) related to Butylbenzylphthalate (BBP) for use in food contact materials. EFSA J. 2005, 241, 1–14. [Google Scholar]
- European Food Safety Authority. Opinion of the Scientific Panel on Food Additives, Flavourings, Processing Aids and Materials in Contact with Food (AFC) on a request from the Commission related to Bis(2-ethylhexyl)phthalate (DEHP) for use in food contact materials. EFSA J. 2005, 243, 1–20. [Google Scholar]
- Cavaliere, B.; Macchione, B.; Sindona, G.; Tagarelli, A. Tandem mass spectrometry in food safety assessment: The determination of phthalates in olive oil. J. Chromatogr. A 2008, 1205, 137–143. [Google Scholar] [CrossRef]
- Del Carlo, M.; Pepe, A.; Sacchetti, G.; Compagnone, D.; Mastrocola, D.; Cichelli, A. Determination of phthalate esters in wine using solid-phase extraction and gas chromatography-mass spectrometry. Food Chem. 2008, 111, 771–777. [Google Scholar] [CrossRef]
- Feng, Y.L.; Zhu, J.P.; Sensenstein, R. Development of a headspace solid-phase microextraction method combined with gas chromatography mass spectrometry for the determination of phthalate esters in cow milk. Anal. Chim. Acta 2005, 538, 41–48. [Google Scholar]
- Ghiasvand, A.R.; Hosseinzadeh, S.; Pawliszyn, J. New cold-fiber headspace solid-phase microextraction device for quantitative extraction of polycyclic aromatic hydrocarbons in sediment. J. Chromatogr. A 2006, 1124, 35–42. [Google Scholar]
- Menezes, H.C.; Cardeal, Z.L. Determination of polycyclic aromatic hydrocarbons from ambient air particulate matter using a cold fiber solid phase microextraction gas chromatography-mass spectrometry method. J. Chromatogr. A 2011, 1218, 3300–3305. [Google Scholar] [CrossRef]
- Gonzalez-Castro, M.I.; Olea-Serrano, M.F.; Rivas-Velasco, A.M.; Medina-Rivero, E.; Ordonez-Acevedo, L.G.; de Leon-Rodriguez, A. Phthalates and bisphenols migration in Mexican food cans and plastic food containers. Bull. Environ. Contam. Toxicol. 2011, 86, 627–631. [Google Scholar]
- Kueseng, P.; Thavarungkul, P.; Kanatharana, P. Trace phthalate and adipate esters contaminated in packaged food. J. Environ. Sci. Health B 2007, 42, 569–576. [Google Scholar] [CrossRef]
- Prokupkova, G.; Holadova, K.; Poustka, J.; Hajslova, J. Development of a solid-phase microextraction method for the determination of phthalic acid esters in water. Anal. Chim. Acta 2002, 457, 211–223. [Google Scholar] [CrossRef]
- European Union. Commission Regulation No.10/2011. Available online: http://eur-lex.europa.eu/LexUriServ/LexUriServ.do?uri=OJ:L: 2011:012:0001:0089:EN:PDF (accessed on 5 September 2012).
- Brasil, Agência Nacional de Vigilância Sanitária, Ministério da Saúde, in Portaria N 26/MS/SVS 1996. Available online: http://www.anvisa.gov.br/legis/portarias/26_96.htm (accessed on 3 November 2012).
- EURACHEM Guide to Quality in Analytical Chemistry: An Aid to Accreditation. Available online: http://www.eurachem.org/images/stories/Guides/pdf/CITAC_EURACHEM_GUIDE.pdf (accessed on 7 September 2012).
- De Souza, S.V.C.; Junqueira, R.G. A procedure to assess linearity by ordinary least squares method. Anal. Chim. Acta 2005, 552, 25–35. [Google Scholar] [CrossRef]
- Batlle, R.; Nerin, C. Application of single-drop microextraction to the determination of dialkyl phthalate esters in food simulants. J. Chromatogr. A 2004, 1045, 29–35. [Google Scholar] [CrossRef]
- Jen, J.F.; Liu, T.C. Determination of phthalate esters from food-contacted materials by on-line microdialysis and liquid chromatography. J. Chromatogr. A 2006, 1130, 28–33. [Google Scholar]
- Rios, J.J.; Morales, A.; Marquez-Ruiz, G. Headspace solid-phase microextraction of oil matrices heated at high temperature and phthalate esters determination by gas chromatography multistage mass spectrometry. Talanta 2010, 80, 2076–2082. [Google Scholar] [CrossRef]
- Guidance for the Validation of Analytical Methodology and Calibration of Equipment used for Testing of Illicit Drugs in Seized Materials and Biological Specimens. Available online: http://www.unodc.org/documents/scientific/validation_E.pdf (accessed on 3 November 2012).
- Nerin, C.; Acosta, D.; Rubio, C. Potential migration release of volatile compounds from plastic containers destined for food use in microwave ovens. Food Addit. Contam. 2002, 19, 594–601. [Google Scholar] [CrossRef]
- Nanni, N.; Fiselier, K.; Grob, K.; di Pasquale, M.; Fabrizi, L.; Aureli, P.; Coni, E. Contamination of vegetable oils marketed in Italy by phthalic acid esters. Food Control 2011, 22, 209–214. [Google Scholar] [CrossRef]
- Shen, H.Y. Simultaneous screening and determination eight phthalates in plastic products for food use by sonication-assisted extraction/GC-MS methods. Talanta 2005, 66, 734–739. [Google Scholar] [CrossRef]
- Ohnishi, R.; Yukimasa, S.; Konakazawa, T. Synthesis of elastomeric poly(propylene) (ELPP) using the highly active TiCl4/dibutyl phthalate (DBP)/MgCl2-Al(i-C4H9)(3)/1-allyl-3,4-dimethoxybenzene (ADMB) catalyst. Macromol. Chem. Phys. 2002, 203, 1003–1010. [Google Scholar] [CrossRef]
- Basic Information about Di(2-ethylhexyl) phthalate in Drinking Water. Available online: http://water.epa.gov/drink/contaminants/basicinformation/di_2-ethylhexyl_phthalate.cfm (accessed on 5 April 2012).
- Brasil, Agência Nacional de Vigilância Sanitária, Ministério da Saúde, in Resolução Anvisa RDC N17. Available online: http://www.aguaseaguas.com.br/images/stories/pdflegislacaonovas/ 036.pdf (accessed on 7 September 2012).
- Casajuana, N.; Lacorte, S. New methodology for the determination of phthalate esters, bisphenol A, bisphenol A diglycidyl ether, and nonylphenol in commercial whole milk samples. J. Agric. Food Chem. 2004, 52, 3702–3707. [Google Scholar] [CrossRef]
- Cirillo, T.; Fasano, E.; Castaldi, E.; Montuori, P.; Cocchieri, R.A. Children’s Exposure to Di(2-ethylhexyl)phthalate and Dibutylphthalate Plasticizers from School Meals. J. Agric. Food Chem. 2011, 59, 10532–10538. [Google Scholar] [CrossRef]
- Farajzadeh, M.A.; Mogaddam, M.R.A. Air-assisted liquid-liquid microextraction method as a novel microextraction technique. Application in extraction and preconcentration of phthalate esters in aqueous sample followed by gas chromatography-flame ionization detection. Anal. Chim. Acta 2012, 728, 31–38. [Google Scholar] [CrossRef]
- Psillakis, E.; Kalogerakis, N. Hollow-fibre liquid-phase microextraction of phthalate esters from water. J. Chromatogr. A 2003, 999, 145–153. [Google Scholar] [CrossRef]
- Farahani, H.; Norouzi, P.; Dinarvand, R.; Ganjali, M.R. Development of dispersive liquid-liquid microextraction combined with gas chromatography-mass spectrometry as a simple, rapid and highly sensitive method for the determination of phthalate esters in water samples. J. Chromatogr. A 2007, 1172, 105–112. [Google Scholar]
© 2013 by the authors; licensee MDPI, Basel, Switzerland. This article is an open access article distributed under the terms and conditions of the Creative Commons Attribution license (http://creativecommons.org/licenses/by/3.0/).
Share and Cite
Moreira, M.A.; André, L.C.; Cardeal, Z.L. Analysis of Phthalate Migration to Food Simulants in Plastic Containers during Microwave Operations. Int. J. Environ. Res. Public Health 2014, 11, 507-526. https://doi.org/10.3390/ijerph110100507
Moreira MA, André LC, Cardeal ZL. Analysis of Phthalate Migration to Food Simulants in Plastic Containers during Microwave Operations. International Journal of Environmental Research and Public Health. 2014; 11(1):507-526. https://doi.org/10.3390/ijerph110100507
Chicago/Turabian StyleMoreira, Miriany A., Leiliane C. André, and Zenilda L. Cardeal. 2014. "Analysis of Phthalate Migration to Food Simulants in Plastic Containers during Microwave Operations" International Journal of Environmental Research and Public Health 11, no. 1: 507-526. https://doi.org/10.3390/ijerph110100507
APA StyleMoreira, M. A., André, L. C., & Cardeal, Z. L. (2014). Analysis of Phthalate Migration to Food Simulants in Plastic Containers during Microwave Operations. International Journal of Environmental Research and Public Health, 11(1), 507-526. https://doi.org/10.3390/ijerph110100507